[level-membership-for-hematology-oncology-and-palliative-medicine-category]
Chapter 9 Liver Cancer
Hepatocellular and Fibrolamellar Hepatocellular Carcinoma
Epidemiology
HCC is the sixth most common cancer worldwide and one of the major causes of cancer-related deaths worldwide: fourth after lung, stomach, and colorectal cancers.1–3 It is the most common primary liver cancer in children and young adults. Worldwide, the most common cause of HCC is hepatitis B and C infection. Other high-risk groups include patients with alcohol cirrhosis, hemochromatosis, primary biliary cirrhosis, aflatoxin exposure, and α1-antitrypsin deficiency. The annual incidence of HCC in patients with cirrhosis is 2% to 6%.4 In the Western world, the most common liver disorder is nonalcoholic fatty liver disease (NAFLD). NAFLD corresponds to the hepatic manifestation of patients with obesity, insulin resistance, hypertriglyceridemia, and low high-density lipoprotein. NAFLD can progress to cirrhosis and to HCC.
There is a geographic bias with a high incidence of 90 per 100,000 cases in the Far East, Southeast Asia, and sub-Saharan Africa. In contrast, the incidence of HCC in the United States between 1998 and 2001 was 3.3 per 100,000.5 However, there has been an increased incidence in the United States since 1978 to 1980, when the incidence was 1.3 per 100,000. It is suggested that this increased incidence may be due to hepatitis C infection. HCC in the United States is more common in non-Hispanic whites (57%), followed by blacks (13%), Chinese Americans (8%), and white Hispanics (7%). In 2009, 22,620 adults are estimated to be diagnosed with HCC in the United States with 18,160 deaths in the same time period. In North America, approximately 20% of HCC does not have underlying cirrhosis.
HCC is more common in men than in women (4:1). In the high-incidence regions of the world, the male-to-female ratio can be as high as 8:1; in the low-incidence regions, it is 2:1. The median age of diagnosis is 66 years with less than 5% diagnosed in patients younger than 40 years. The peak age of incidence is 50 to 70 years. However, in the high-incidence regions, the age of presentation is younger at 30 to 50 years, and in the Western regions of the world, patients present later, in the eighth and ninth decades.6 The patient with cirrhosis presents at an earlier age.
The relative survival of HCC in the United States is 26% at 1 year and 7% to 12% at 5 years. The 5-year survival for untreated HCC is less than 5%.6a The patients with cirrhosis and a small HCC (<2 cm) who can undergo a liver transplant have an 80% survival rate.6,7
Anatomy
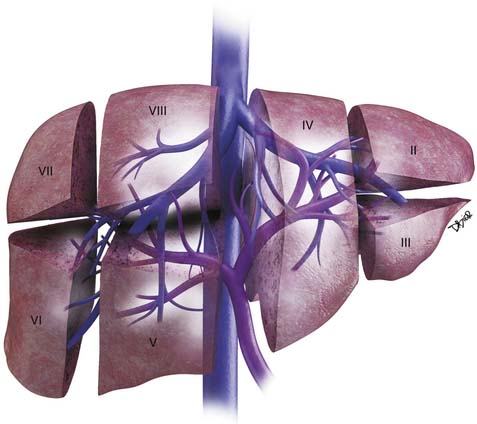
The liver is divided into the right and left lobes and is subdivided into eight anatomic segments (Figure 9-1). The segments are defined by their portal vein supply and separated from each other by the hepatic veins. The caudate lobe is considered segment I. The portal supply to the caudate lobe arises commonly from the main portal vein but may be seen from the left or right portal veins. Segments II and III of the liver are in the left lobe and are supplied by the first and second lateral branches of the left portal vein, respectively. Segment IV is also in the left lobe and is separated from II and III by the left hepatic vein and by the falciform ligament. It is supplied by the medial branches of the left portal vein. The right hepatic vein separates segments in the right lobe: segment VII from VIII and segment VI from V. Segments VII and VI are supplied by the posterior branch of the right portal vein, superior and inferior branches, respectively. Segments VIII and V are supplied by the anterior branch of the right portal vein, superior and inferior, respectively. The middle hepatic vein separates the right and left lobes, segment VIII from IV and segment V from IV. Segment V is also separated from segment IV by the gallbladder fossa (see Figure 9-1).
The liver has an assortment of vascular variants. Michel’s classification describes 10 hepatic arterial anomalies.8 The most common, type I, describes a common hepatic artery that arises from the celiac artery and bifurcates into the right and left hepatic artery, supplying the right and left lobes. Other common vascular variants include a replaced or accessory right hepatic artery from the superior mesenteric artery and a replaced or accessory left hepatic artery from the left gastric artery. Surgical intervention and transarterial chemoembolization (TACE) rely on the complete understanding of the liver arterial anatomy. Documentation of the vascular supply of the liver is essential for correct treatment planning.
Pathology
In the cirrhotic liver, the development of HCC occurs in stages.9 The transformation begins from regenerative nodules (RNs), to a premalignant lesion–dysplastic nodules (DNs), to early HCC, to advanced carcinoma.10 It has been reported that allelic loss, chromosomal changes, gene mutations, epigenetic alterations, and alterations in molecular cellular pathways play a role in this transformation.11
HCC has four main histologic classifications: trabecular, pseudoglandular, compact, and scirrhous. The most common type is the trabecular pattern, and the scirrhous is the least common. The trabecular pattern is composed of fibrous stroma separating the tumor cell plates.12 The histology grading of HCC ranges from well-differentiated to highly anaplastic tumors. This tumor grade has been found to predict survival. Grade I tumors can mimic hepatocellular adenomas, whereas grade IV tumors may mimic nonhepatocellular malignancy.
HCC can present as large or infiltrative diffuse disease. A capsule is commonly present in tumors larger than 2 cm.13,14
Clinical Presentation
The clinical presentation of HCC is nonspecific with symptoms that include right upper quadrant pain, weight loss, fullness, anorexia, abdominal swelling, vomiting, fever, fatigue, and jaundice. Many of these symptoms are shared by the underlying cirrhosis and chronic hepatitis in the absence of HCC.15,16 In the setting of cirrhosis, the development of weakness, malaise, and weight loss should raise the suspicion of an HCC.
Paraneoplastic manifestations of HCC, seen in fewer than 5% of patients with HCC, include erythrocytes, hypercholesterolemia, porphyria cutanea tarda, gynecomastia, hypercalcemia, and hyperglycemia.17
The laboratory testing for HCC includes alpha-fetoprotein (AFP) levels. AFP is the most common tumor marker used for screening patients with HCC. The normal range is 10 to 20 ng/mL. The positive predictive value (PPV) of AFP in predicting cancer depends on the etiology of the tumor. Elevated AFP is seen more commonly in the Asian countries (70%) than in the Western world (50%). A non–viral-related form has a 94% PPV compared with 70% for viral-related HCC.18 A mass in the liver with an AFP level of more than 200 ng/mL is considered diagnostic of HCC. However, in 20% of HCCs, the AFP is not elevated. Another serum marker evaluated in patients with HCC is the protein-induced vitamin K abnormality (PIVKA). PIVKA is commonly elevated in patients with HCC (80%).19 However, AFP and PIVKA may be elevated in patients with chronic hepatitis and cirrhosis without HCC.
Staging Classification
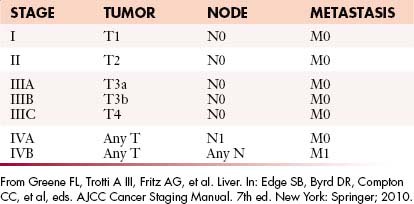
The most recent tumor-node-metastasis (TNM) staging criteria of the seventh edition of the American Joint Commission on Cancer (AJCC; Tables 9-1 and 9-2) is based on tumor number, size, and vascular invasion (T); local and distant metastatic adenopathy (N); and the presence of metastatic disease.20,21
Table 9-1 Tumor-Node-Metastasis Classification for Hepatocellular Carcinoma
| Primary Tumor (T) | |
| TX | Primary tumor cannot be assessed |
| T0 | No evidence of primary tumor |
| T1 | Solitary tumor without vascular invasion |
| T2 | Solitary tumor with vascular invasion or multiple tumors none > 5 cm |
| T3a | Multiple tumors > 5 cm |
| T3b | Single tumor or multiple tumors of any size involving a major branch of the portal vein or hepatic vein |
| T4 | Tumor(s) with direct invasion of adjacent organs other than the gallbladder or with perforation of visceral peritoneum |
| Regional Lymph Nodes (N) | |
| NX | Regional lymph nodes cannot be assessed |
| N0 | No regional lymph node metastasis |
| N1 | Regional lymph node metastasis |
| Distant Metastasis (M) | |
| M0 | No distant metastasis |
| M1 | Distant metastasis |
From Greene FL, Trotti A III, Fritz AG, et aI. Liver. In: Edge SB, Byrd DR, Compton CC, et al, eds. AJCC Cancer Staging Manual. 7th ed. New York: Springer; 2010.
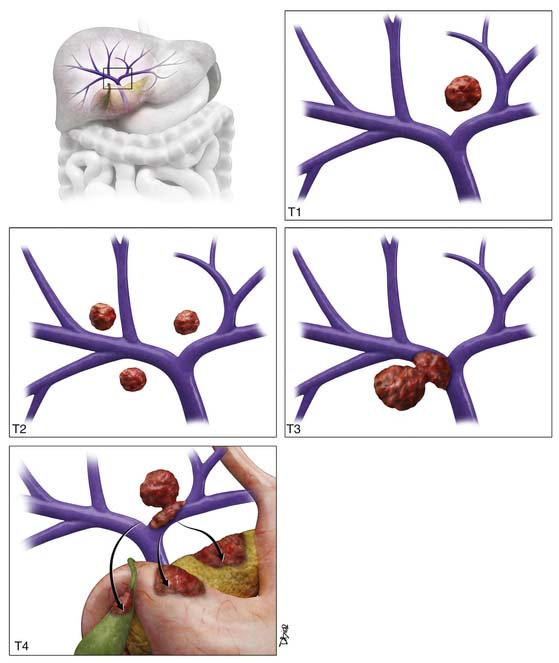
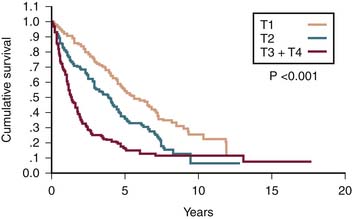
T1 tumor stage classification is for all solitary tumors regardless of size without vascular invasion (Figure 9-2). T2 tumor is defined as solitary tumors with vascular invasion or multiple tumors none larger than 5 cm (see Figure 9-2). T3 tumors are classified as multiple tumors larger than 5 cm or tumors with major vascular invasion of a major branch of the portal or hepatic veins (see Figure 9-2). T4 lesions are described as tumors that demonstrate direct invasion to adjacent organs, other than the gallbladder, or in the setting of perforation to the visceral peritoneum (see Figure 9-2). The cumulative survival for the various T stages is shown in Figure 9-3.20
The criteria for liver transplantation (LT) are based on size and number of lesions. Patients with a single lesion less than 5 cm or up to three lesions none larger than 3 cm are considered transplant candidates. The Model for End Stage Liver Disease (MELD) HCC scoring system is used to prioritize the patients on the waiting list for LT.22 A single HCC larger than 2 cm or multiple nodules increase the priority. In explanted livers in the United States, a third of the patients with the pretransplant diagnosis of HCC did not have histologic confirmation.22 Transplantation can be considered for HCC solely on the basis of lesion characterization on imaging.
Key Points Staging of hepatocellular carcinoma
• T staging is based on lesion size (>5 cm), number, and vascular and organ invasion.
• N staging is based on regional (N1) and distant nodes (N2).
• Most common distant metastases are lung and bone.
• Criteria for transplantation are a single lesion smaller than 5 cm or up to three lesions, none larger than 3 cm.
Patterns of Tumor Spread
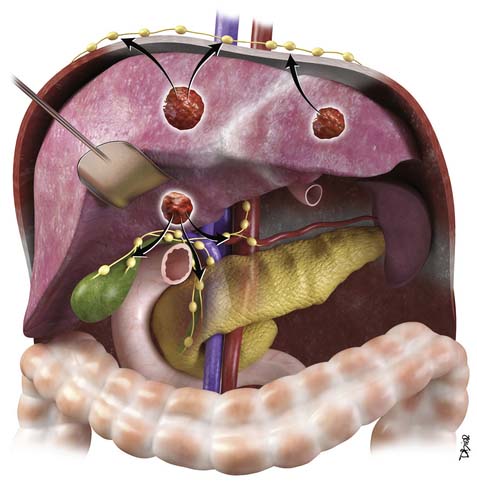
HCC may present with intrahepatic and extrahepatic tumor spread.23 This is more common with larger tumors (>5 cm). The most common type of spread of HCC is intrahepatic tumors followed by portal vein tumor thrombosis. The extrahepatic (hematogenous + lymphatic) spread has been reported in autopsy series in over half of cases, with the lung as the most common site.17 Hematogenous spread may also be seen in the adrenal glands, bone, pancreas, kidney, and spleen. Lymphatic metastases are commonly found and typically occur at the hepatic hilum (Figure 9-4).23 Other common nodal stations include anterior diaphragmatic nodes, peripancreatic nodes, perigastric nodes, retroperitoneum, paratracheal, carina, and supraclavicular nodal stations. The mortality of HCC is usually due to underlying liver failure rather than tumor spread, with most patients dying without clinical symptoms of extrahepatic metastasis.
Imaging
Primary Tumor
Ultrasound
Ultrasound (US) has been suggested as the imaging modality of choice in screening patients with chronic liver disease that are at risk of developing HCC. In a survey of physicians, members of the American Association of Study of Liver Diseases found that screening for HCC was performed by 84% of the responders.24 The most frequent screening tools were AFP and US examination.
The sensitivity of US for the detection of HCC depends on the patient population, size of the lesion, and technical skills. Lower sensitivities for detection were seen in the United States and in the smaller lesions (1-2 cm). This lower sensitivity in the United States may be due to an overweight population. The higher sensitivity was seen in Asia with a less overweight patient population. Utilizing the gold standard of explanted livers, the sensitivity of US ranges with great variability from 33% to 72%.25,26 The specificity of US ranged from 92% to 100%.27,28
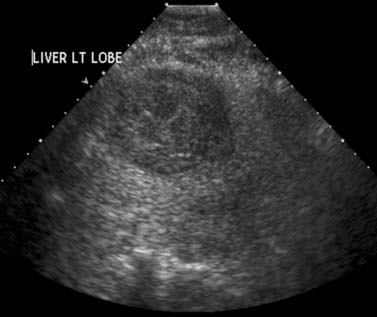
The most common sonographic appearance of HCC is a hypoechoic solid mass (Figure 9-5). This is more common in smaller, well-differentiated tumors. In larger tumors, the sonographic appearance is varied with features due to necrosis (hypoechoic), fat (hyperechoic), fibrosis (hyperechoic), hemorrhage (hyperechoic), and calcium (hyperechoic). US is commonly the imaging modality of choice for image-guided tumor biopsy.
Contrast-enhanced ultrasound (CE-US) has shown promise in the characterization of HCC. The most common imaging feature is intratumoral enhancement in the arterial phase.29 However, in some well-differentiated HCCs, there is no arterial enhancement on CE-US evaluation.29 This technique is not approved for clinical use in the United States.
Computed Tomography
Computed tomography (CT) is the most commonly used modality for the evaluation of patients with HCC. This is in part a result of availability. A liver protocol is recommended for the evaluation of patients with HCC. This consists of a precontrast CT examination of the abdomen at 5 mm with 2.5-mm reconstructed images and dynamic study with multiple phases after the intravenous injection of iodinated contrast agent. The rate of contrast injection should be 4 to 6 mL/sec. This allows optimum tumor enhancement and conspicuity.30,31 The first phase after contrast administration is the late arterial phase. This occurs at approximately 30 to 35 seconds after the intravenous administration of contrast. In our institution, we use a bolus tracking technique in which the inflow of contrast is monitored with a region of interest in the aorta at the level of the celiac artery. Once the Hounsfield units reach 100 HU, after a set delay of 17 seconds, the late arterial phase is acquired. The second phase, the portal venous phase (PVP), is obtained at approximately 60 seconds after contrast administration. The third phase of imaging, the excretory phase, is obtained at 3 to 5 minutes after intravenous contrast administration.
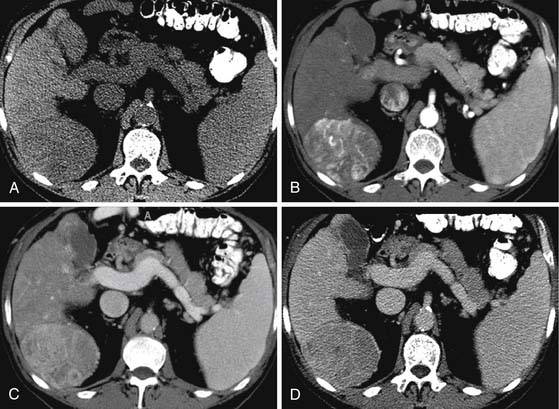
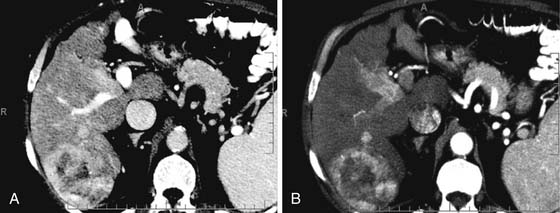
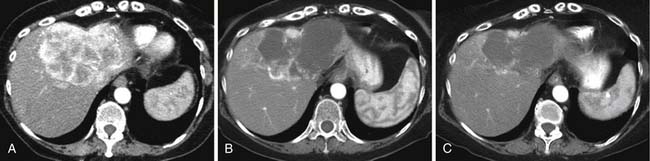
On the noncontrast CT examination, HCC is commonly seen as a low-attenuation mass relative to liver but can present as isointense or hyperintense to liver (Figure 9-6A). The noncontrast study is useful to detect calcifications, hemorrhage, and fat infiltration of the liver. HCCs are very hypervascular tumors and are best detected during the late arterial phase of contrast administration (see Figure 9-6B). The liver enhancement occurs during the second phase after contrast administration, the PVP. The tumor is less conspicuous during this phase of imaging (see Figure 9-6C). The classic pattern of enhancement is for the hypervascular mass seen on the late arterial phase to show low attenuation relative to the liver on the excretory phase. In the setting of a capsule, the capsule will demonstrate low attenuation in the late arterial phase, mixed attenuation on the PVP, and enhancement on the delayed phase (see Figure 9-6D). HCC imaging features are variable with some tumors seen only during the late arterial phase (hypervascular) or only during the excretory phase (low attenuation). A follow-up evaluation of a series of 60 hypoattenuating nodules in chronically injured liver concluded that the conversion rates to hypervascular HCC (nodule in a nodule or entire enhancement) at 1 year, 2 years, and 3 years were 15.8%, 44.3%, and 58.7%, respectively.32
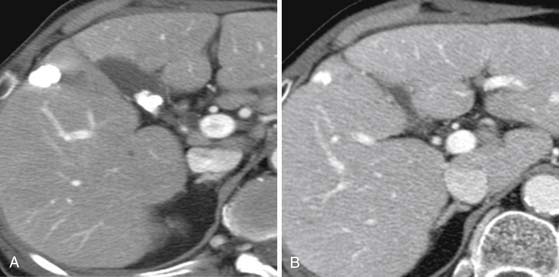
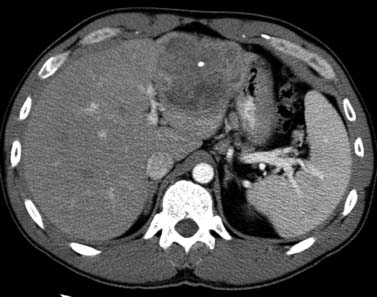
CT scan features of cirrhosis include nodular contour of the liver, an enlarged caudate lobe, relative enlargement of the left lobe, right hepatic notch, and an enlarged gallbladder fossa (Figure 9-7). In the setting of portal hypertension, an enlarged spleen, recanalized umbilical vein, and varices in the left gastric or esophageal distribution may be seen on CT.
To complicate the diagnosis of HCC, other lesions seen in the cirrhotic liver may share imaging features with HCC. As described previously, tumor development in the cirrhotic patient is a stepwise progression from an RN, to a DN, to a DN with HCC, and to HCC (well-differentiated to poorly differentiated). RNs have a dominant portal venous blood supply and may have iron content (siderotic nodules). On the precontrast CT image of the liver, siderotic RN appears higher in attenuation relative to the liver. On the multiphasic evaluation, RNs are isoattenuating to liver. DNs, similar to RNs, also have a dominant portal venous supply with some arterial feeding. Thus, some DNs may enhance in the earlier late arterial phase of contrast administration but most are isointense to liver. The DNs are also mostly isointense to liver on the excretory phase of contrast administration. This is a helpful distinction from HCC. The DN with foci of HCC appears as a mostly isoattenuating mass with some areas demonstrating early enhancement. DNs and RNs lack a capsule, another helpful distinction from HCC.
The receiver operating characteristics (ROC) analysis is used to evaluate tumor detection. The area under the curve (Az) and sensitivity for the detection of HCC for multidetector row computed tomography (MDCT) have been investigated. For MDCT contrast-enhanced dynamic imaging, the Az ranges from 0.82 to 0.99 and the sensitivity from 77% to 93%.33,34 The sensitivity of tumor detection is best for HCCs larger than 1 cm.
Key Points Computed tomography of hepatocellular carcinoma
• Multiphasic CT study is required for HCC.
• HCC enhances early, is isointense on the PVP, and is hypointense on the delayed phase.
• CT presentation of HCC may be variable and the distinction from DN difficult.
• Cirrhotic liver have nodular contour, enlarged left and caudate lobes, right hepatic notch, and enlarged gallbladder fossa.
Magnetic Resonance Imaging
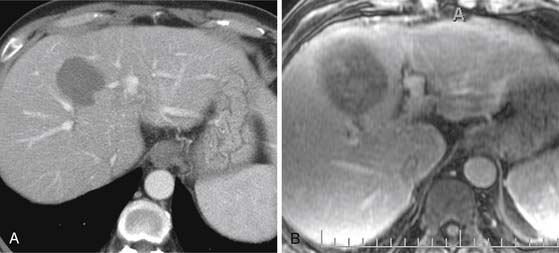
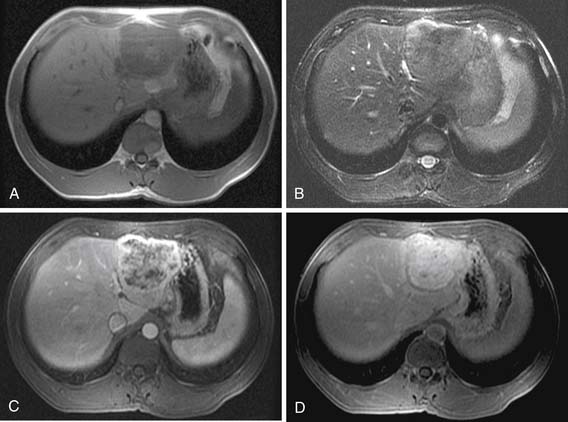
On T1-weighted images (T1WIs), HCC is usually hypointense to the liver on the in-phase and out-of-phase images (Figure 9-8A) (40% of HCC14). In a fatty liver, the lesion may be isointense to hyperintense to the liver on the out-of-phase sequence. A fat-containing HCC will be hyperintense to the liver on the in-phase images and isointense or hypointense on the out-of-phase images. Lesions with copper, protein, glycogen, or hemorrhage may present as hyperintense to liver on the T1WI (35%).14
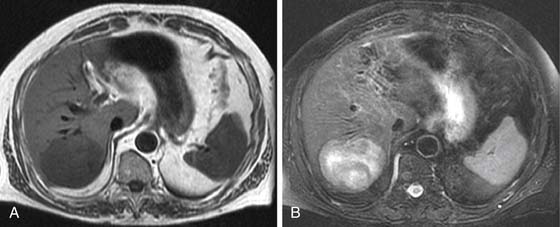
On FSE T2WI, HCC is usually hyperintense to liver (see Figure 9-8B).14 In a series of 47 HCCs, 94% of the lesions were hyperintense on T2WI.13 In other series, HCC has been described as variable in signal low or isointense to the liver on T2WI. The well-differentiated HCC may be iso- to hypointense to the liver on the T2WI.14,35 The regenerative nodules and most dysplastic nodules are hypointense to liver.36 The development of HCC from a dysplastic nodule can be detected by foci of high signal on the T2WI in an isointense or hypointense nodule.37
DWI can be used for the qualitative characterization of lesions. The quantitative characterization of HCC includes the calculation of the apparent diffusion coefficient (ADC). The ADC of HCC (1.33 mm2/sec) has been reported to be different from hemangiomas (2.95 mm2/sec) and cysts (3.63 mm2/sec). However, there is an overlap in the ADC values of other malignant masses in the liver and HCC. This area requires further investigation.
The most critical MRI series for the detection of HCC is the dynamic postgadolinium series. This sequence is obtained during a breathhold with a three-dimensional (3D) volume gradient echo sequence. The timing of the arterial phase is critical for the detection of HCC. An improperly timed acquisition may result in lower sensitivity for the detection of HCC. Because the blood supply of HCC is almost exclusively from the hepatic artery, the enhancement pattern is best during the arterial or late arterial supply.38,39
Four different techniques are used in determining the timing of the arterial phase of contrast administration: A set delay with (1) a single or (2) a double arterial phase; (3) a 1- to 2-mL test bolus; or (4) fluoro-triggered imaging. A set delay of 20 seconds, although simple, has the limitation of lacking compensation for differences in cardiac output between patients. A double arterial phase utilizes a set delay time but compensates for cardiac output differences with two sequential series after contrast administration.40 These images are usually acquired with lower matrix (lower resolution) to allow the completion during a single breathhold. The 1- to 2-mL test bolus technique compensates for cardiac output and provides excellent timing. The limitations of this technique are an increased scan time and the concern of image interpretation when the total volume of contrast to be used is less than 10 mL. Fluoro-triggered images utilize a set delay time after the visualization of contrast in the aorta or pulmonary arteries. The delay time has to take into account the timing of the center of k-space acquisition relative to the first echo. In our institution, the center of k-space is acquired at the middle of the scan. We found that a 17-second delay time from the pulmonary arteries to the center of k-space is optimum. Others have reported a delay of 8 to 9 seconds from the visualization of contrast at the level of the abdominal aorta/celiac artery when the center of k-space is obtained at the beginning of the scan.41
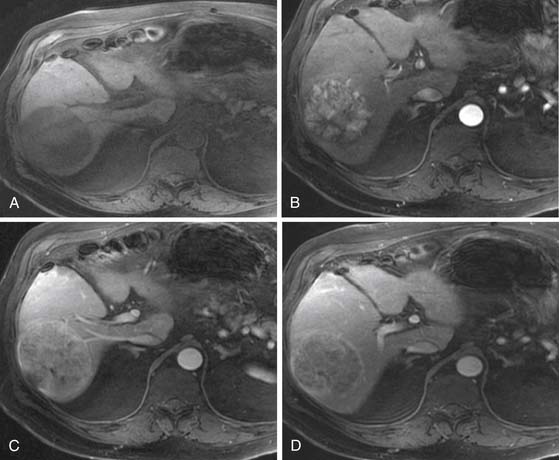
Similar to CT, the classic image features for HCC on MRI after the intravenous administration of contrast are hyper-, iso-, and hypointense to liver during the arterial phase, PVP, and excretory phase, respectively (Figure 9-9). The image features are variable. For example, some HCCs are seen only during the excretory phase of contrast administration as a hypointense mass.32,42 Delayed images show late enhancement of the fibrous capsule and hypointensity of the mass relative to liver (see Figure 9-9D).
The ROC analysis of MRI for the detection of HCC has reported sensitivity from 65% to 91% and the Az of 0.68 to 0.97.43,44 The sensitivity of the detection of HCCs larger than 1 cm for MRI has been reported as high as 94%.45 This is reduced to less than 45% for nodules smaller than 1 cm.45
MRI is also useful in characterizing nonmalignant nodules seen in the cirrhotic and noncirrhotic liver. The nonmalignant RNs are commonly small (<1 cm) and contain hemosiderin deposition. These RNs (or siderotic nodules) have low signal on T1WI and T2WI sequences.36 These nodules do not exhibit the dominant arterial enhancement seen on HCC. The premalignant DNs may be hyperintense on the T1WI and iso- or hypointense on the T2WI. This is a distinctive feature from HCC, which is commonly hyperintense on the T2WI. The DNs and RNs are commonly hypovascular on the arterial phase of enhancement.
Hepatocyte-specific agents have been used in the evaluation of HCC. Gd-EOB-(DTPA) (gadolinium ethoxybenzyl diethylenetriamine-penta-acetic acid) and Gd-BOPTA (gadobenate dimeglumine) both show the similar dynamic postgadolinium profile of other gadolinium-based contrast agents (GBCAs) for the arterial phase, PVP, and delayed phase of enhancement. On the hepatocyte phase of contrast administration, most HCCs and some DNs showed hypointensity relative to the liver.10 In some cases, HCC may be isointense to hyperintense to liver in the hepatocyte phase of contrast administration. These cases in which the HCCs demonstrate uptake of the agent, the uptake is regarded to be determined as a function of the expression of OATP1B3 (organic anion transporter 1B3) protein rather than a function of tumor differentiation or bile production.46
Even in the setting of improved preoperative imaging techniques of CT and MRI, the detection rate for tumors less than 1 cm is close to 70%. Unfortunately, over 35% of preoperative diagnosed single HCCs less than 5 cm demonstrated additional lesions in the explanted specimen.47
In larger HCCs, the mosaic pattern of enhancement may be seen on the postcontrast CT and MRI examination of the liver. This pattern is composed of enhancing nodules, low-attenuation areas, and internal septa. The enhancing nodules correspond to the viable tumor, and the low-attenuation areas are a combination of necrosis, fibrosis, and hemorrhage.48 MRI evaluation of large tumors with the mosaic pattern demonstrates variable T1WI and T2WI signal with heterogeneous nodular enhancement pattern.
Arterial Enhancing Nodule
In the cirrhotic and noncirrhotic liver, the detection of arterial enhancing nodules (AENs) can be problematic. An AEN is defined as a nodule seen only during a single phase of contrast administration, the late arterial phase. These nodules are not detected on the T1, T2, or other phases of contrast administration. The differential diagnosis for AEN includes HCC but also many other benign lesions such as focal nodular hyperplasia (FNH), adenoma, perfusion abnormalities, vascular malformation, dysplastic nodules, and others. In multiple series, a follow-up of these lesions concluded that they were likely to be benign even in the setting of cirrhosis and that follow-up evaluation or MRI evaluation was recommended.49–51 Hepatocyte contrast agents may demonstrate low signal intensity on the hepatocyte phase of contrast administration that may suggest HCC.
Positron-Emission Tomography
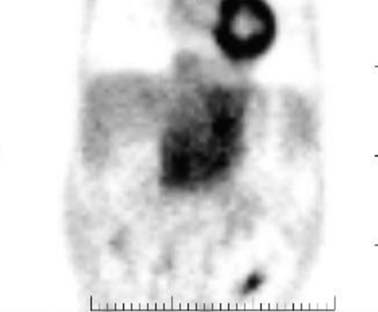
The role of fluoro-2-deoxy-D-glucose positron-emission tomography (FDG-PET) is limited in the evaluation of patients with HCC. HCC may be hypermetabolic relative to the liver (Figure 9-10). The sensitivity of FDG-PET for HCC is 50% to 60%.52–54 It has been suggested that there is an association between the degree of FDG uptake and the histology of the tumors, tumor size, vascular endothelial growth factor (VEGF) expression, and doubling time. The well-differentiated tumors exhibit lesser uptake, whereas the poorly differentiated tumors show more activity.52–54 In the setting of extrahepatic disease, FDG-PET may assist in the detection of metastatic disease. However, a negative FDG-PET examination does not exclude metastatic disease.
11C acetate-PET imaging has been evaluated in the characterization of liver lesions. The tracer is short-lived with a half-life of only 20 minutes (18F has a half life of 110 min). It has been postulated that the combination of FDG-PET and 11C acetate-PET can provide improved specificity and sensitivity in the detection of HCC.55 An FDG-PET and an 11C acetate-PET scan that are both positive makes the diagnosis of HCC very likely. An FDG-PET that is positive with a negative 11C acetate-PET makes the diagnosis of a poorly differentiated HCC or a non-HCC malignancy more likely. In the setting of a negative FDG-PET and 11C acetate-PET, the likely diagnosis is a benign lesion.
Lymph Nodes
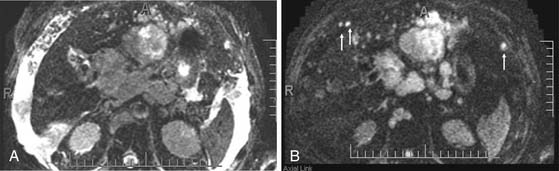
The radiologic evaluation of lymph nodes is based on size, morphology, and location.56,57 Nodes larger than 1 cm are more likely to be malignant. Nodes located near the primary tumor are also likely to be malignant, even if they measure less than 1 cm in minimum diameter. A round node is also more likely to be malignant than an oval node. In patients with cirrhosis, enlarged nodes (>1.5 cm) are commonly seen in the porta caval nodal station and along the hepatoduodenal ligament. Although these nodes are commonly reactive, the distinction between malignant and benign nodes in this setting is difficult. Imaging features that suggest a malignant node include a pattern of enhancement during the multiphase images that resembles HCC and a necrotic/heterogeneous appearance. Nodal stations that should be carefully examined in a patient with HCC include the anterior, posterior, and middle diaphragmatic; celiac; hepatic artery; left gastric; and retroperineal nodal stations.57,58 MRI, DWI has been shown to be very useful in the detection of lymph nodes, in particular in a patient with extensive ascites (Figure 9-11). The high signal of the free fluid in the DWI will be suppressed with a B value greater than 50 sec/mm2
Metastatic Disease
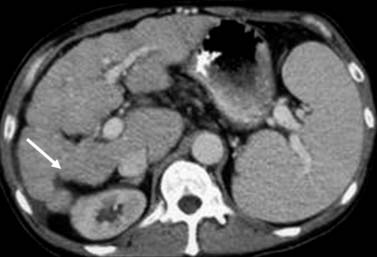
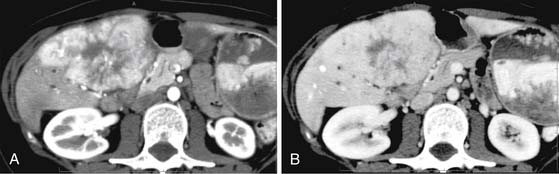
As discussed earlier, the pattern of tumor spread for HCC may be extrahepatic or intrahepatic. Intrahepatic spread may include extension of tumor into the portal or hepatic vein. In addition to tumor thrombus, bland thrombus of these vessels may be encountered. The distinction between these two entities is important for staging classification and surgical planning. The tumor thrombus in contrast to bland thrombus will expand the vessel. A portal vein diameter greater than 23 mm is highly suggestive of tumor thrombus.59 The portal vein tumor will also demonstrate early enhancement during the late arterial phase of contrast administration (Figure 9-12).60,61 Noncontrast US evaluation with color Doppler imaging is also helpful in detecting tumor extension into the portal or hepatic vein. On the CT and MRI examination, the early enhancement of the portal vein may not be due to tumor thrombus but secondary to arterial portal shunting in the tumor. In the setting of a vascular shunt, the delay images will not show thrombus in the portal vein.
Distant metastatic disease can be evaluated with a chest radiograph or CT of the chest in search of lung metastases. Skeletal survey of the CT of the abdomen and pelvis may demonstrate skeletal metastases. In the CT of the abdomen and pelvis, in particular in the setting of a capsular HCC, soft tissue nodules in the peritoneum may represent metastatic disease. These nodules can be obscured by extensive ascites (see Figure 9-11). Improved conspicuity of these nodules is achieved with DWI in which the high signal from the ascitic fluid is suppressed.
Treatment*
Surgery
Surgery provides the best outcome for patients with HCC. The two surgical options are liver resection and LT. For liver resection, pretreatment imaging with CT and/or MRI is essential to stratify the patient as a surgical candidate. Knowledge of the number of lesions, major vascular invasion, regional anatomic structures, nodal, and extrahepatic disease are essential information in assessing resectability. The most detailed information that is provided to the surgeon of the tumor and its relationship to the adjacent structures—including hepatic and portal veins, bile ducts, arterial supply, nodal disease, segmental involvement, and extrahepatic disease—will allow for better patient selection and, if needed, special resection techniques.62,63 Incidentally, the size of the tumor is not a contraindication to resection with a 35% 5-year survival reported in masses larger than 10 cm.64 In addition to anatomic information, knowledge of underlying liver disease is required. For example, a patient with poor liver function (Child-Pugh C) is a contraindication to liver resection.
For patients considered for resection, volumetric studies are commonly used to assess residual functional liver reserve (FLR). For a noncirrhotic liver, an FLR of 20% is recommended to reduce surgical morbidity.65 For the cirrhotic patient, a higher FLR of 40% is recommended. In the setting of suboptimal FLR, preoperative portal vein embolization is performed to induce compensatory hypertrophy.66
The location and number of the lesions will dictate the surgical approach. Open surgical resection may include extended resection, anatomic resection, and nonanatomic resection.63,67,68 Extended resection refers to the removal of at least four liver segments with or without biliary and vascular resection, anatomic resection refers to segmental resection, and nonanatomic resection refers to resection of the HCC with a 1-cm margin of normal tissue. The nonanatomic resection is the less favorable technique and has a high risk of recurrence owing to the nonresection of micrometastases.67 The use of laparoscopic US will assist in the detection of vascular involvement and screening of the nonresected liver.
The overall survival and recurrence free-survival have improved in patients with anatomic (segmental) resection of the liver.47,69 In addition, the operative mortality of partial hepatectomy is less than 5%.65 The reported overall 5-year survival after resection ranges from 24% to 76%.70–72 The 5-year survival for tumors less than 5 cm is over 70%.72,73 The en bloc resection of the primary tumors and vascular tributaries potentially reduces the risk of recurrent disease.
LT is considered the best option for treating early HCC. Many centers used the Milan criteria for exclusion for LT: a mass larger than 5 cm or more than three nodules with any larger than 3 cm in diameter. Similar to resection, complete understanding of the anatomic involvement is required. Vascular invasion is a predictor of recurrence and poor long-term survival.74 Living donor liver transplantation (LDLT) is an alternative option to cadaver donor liver transplantation (CDLT). In the United States, this is less common. The MELD score of patients with HCC within the Milan criteria will have a priority score. The 5-year survival for CDLT is 71% to 75.4%.7,75,76 For LDLT, the 5-year survival rate is 75% to 100%.77,78
Transarterial Chemoembolization
The principle of TACE of HCC is to selectively inject chemotherapeutic agents to HCC and decrease the systemic effect of chemotherapeutic agents. The techniques utilize a combination of gelatin, iodized oil, and a cytotoxic agent. TACE treatment has been performed for symptom control and prolonged survival palliation with 18% to 63% tumor control.79 TACE has also been used as neoadjuvant chemotherapy with a 70% tumor control.79 In the symptomatic ruptured HCC, TACE provided a reported 82% to 100% control of bleeding.79 TACE has also been reported to maintain tumor size during the waiting period for a suitable LT. TACE has also been used in combination with radiofrequency ablation (RFA) therapy.
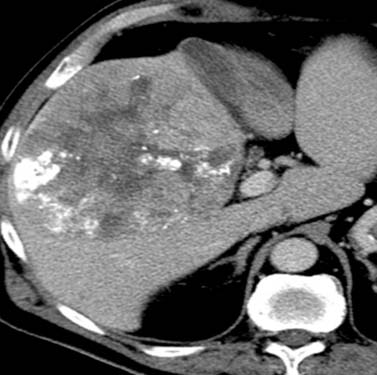
Chemotherapeutic agents can be single, double, or triple therapeutic anticancer medications. Single drugs include doxorubicin, cisplatin, epirubicin/doxorubicin, mitoxantrone, mitomycin C and SMANCS. SMANCS is a chemical conjugate of styrene maleic acid (SMA) and neocarzinostatin (NCS). Double therapies have been reported with doxorubicin and mitomycin C and doxorubicin with cisplatin. Cisplatin, doxorubicin, and mitomycin C triple therapy has been used. Lipiodol (ethiodized oil) is used in TACE; it accumulates inside tumor tissue. The efficacy of lipiodol in TACE has not been demonstrated. A limitation of using lipiodol is that it can obscure the vascularity of residual disease owing to the high iodine content (Figure 9-13). The iodized oil is not used in all TACE procedures.
The CT features of successful response are homogeneous uptake of lipiodol and reduction in size on follow-up studies without areas of enhancement (see Figure 9-13). The CT features of unsuccessful response include heterogeneous uptake of lipiodol (Figure 9-14). The detection of nodular enhancement in the treated mass is also an indication of residual tumor (see Figure 9-14).80,81 Owing to the background attenuation of the lipiodol, the radiologic response of HCC after TACE is best evaluated with dynamic MRI.
Response to TACE treatment is improved with multiple treatments.82 The results in survival after multiple versus single treatment are not conclusive. The interval time between the two TACE treatments has been reported from 4 to 12 weeks.83
A histologic assessment of liver specimens after TACE showed that 44% ± 30% of cases had complete tumor response and 85% ± 22% had over 50% tumor necrosis.83 TACE can be used to downstage a patient to qualify for LT.
Radiofrequency Ablation
RFA has also been reported in combination with surgical resection for hepatic disease.84,85 In patients who are candidates for LT but do not have suitable donors, RFA can been used to maintain tumor size and keep the patient as a transplant candidate.86,87 The application of RFA to the treatment of malignant liver disease may be an option when surgical curative intervention is not possible.
The reported clinical local recurrence rates for RFA-treated HCC ranges from 2.9% (N = 34) to 22% (N = 21).88–91 However, explant data show persistent tumor in the majority of the patients after treatment with RFA.92 The most important factor for an increased risk of local recurrence is tumor size.89,90 Other factors include the procedure type and the proximity of the lesion to a vessel. The open procedure has been reported to have a higher local recurrence rate.93 The proximity of the lesion to a vessel that may serve as a heat sink may be associated with a higher risk of local recurrence. The radiologic description of the tumor should indicate the proximity to major vessels, diaphragm, or other structures that may interfere with the technical success of this procedure.
Following RFA, a baseline 1-month evaluation is obtained. This will demonstrate increased size and lower attenuation of the treated area (Figure 9-15). A review of the pretreatment images is required to confirm that the lesion was correctly treated. The follow-up images (CT or MRI) will demonstrate no enhancement and decrease in size in the setting of successful response to RFA (see Figure 9-15). Any evidence of nodular enhancement or enlargement of the cavity is suggestive of residual disease and unsuccessful treatment (Figure 9-16).
Systemic Therapy
Hepatomas are relatively chemoresistant tumors. Among the attributed factors for this property is the presence of p53 mutation. This is the most common mutation in HCC and p53 studies are required for chemotherapeutic apoptosis resulting in chemoresistant tumors. Other factors such as overexpression of DNA topoisomerase II alpha and p-glycoprotein has been contributory to the chemoresistance of HCC.94
Similarly to chemotherapeutic agents, hormonal therapy with tamoxifen has failed to demonstrate an increased survival.95,96
Hepatomas have been found to produce proangiogenic factors that facilitate tumor invasion. Thalidomide is an antiangiogenic agent that inhibits the in vivo effects of anti-VEGF, insulin-like growth factors, and basic fibroblast growth factors. Several trials have been published on the efficacy of thalidomide on HCC. The objective response rate was 4% to 7% and the overall survival was 4 to 7 months. The treatment produced tumor stabilization in 10% to 25% of HCCs.97,98 MRI perfusion studies evaluating the time intensity curves showed significant difference in MRI perfusion parameters for stable or responded versus progressive disease.98
Sorafenib is an oral multikinase inhibitor that blocks tumor proliferation by targeting various growth factor pathways and has antiangiogenic effects targeting tyrosine kinase VEGF-2, vascular endothelial growth factor receptor-3 (VEGFR-3), and platelet-derived growth factor receptor-beta (PDGFR-β).99 There are reports of improvement in survival and time to progression of disease with sorafenib versus placebo.100,101
The SHARP (Sorafenib Hepatocellular Carcinoma Assessment Randomized Protocol) trial reported a 2.8-month improvement in median overall survival rate, along with increased time to progression and disease control rate, but with only 2.3% response rate as assessed by RECIST criteria.99,100 The study has led to U.S. Food and Drug Administration (FDA) approval of sorafenib for advanced HCC. Collectively, application of antiangiogenesis to patients with advanced HCC led to improvement in survival despite surprisingly low response rates. There is a poor correlation between survival benefit and conventional methods of response assessment (RECIST), which poses questions of how best to quantify efficacy of antiangiogenesis agents. Despite tumors increasing in size, the observation of tumor necrosis in many studies is intriguing. Therefore, a modified RECIST criteria and time to progression have been proposed as the primary endpoints in testing therapy for HCC.102
Radiotherapy
The application of RT has been difficult owing to the challenges of delivering therapeutic levels of radiation without the secondary effects of radiation-induced liver disease (RILD). Improvement in 3D radiation planning techniques, tumor tracking, tumor immobilization, and knowledge of tolerance of the liver to radiation has permitted the delivery of higher doses of radiation with lower complications.103,104
With these techniques, sustained local control rates ranging from 70% to 100% have been reported after 30 to 90 Gy was delivered over 1 to 8 weeks. Technologic advances of intensity-modulated radiation therapy (IMRT) and stereotactic body radiation therapy have also permitted higher-radiation dose delivery.103,104 More recent techniques include proton therapy and carbon ion particles. These two techniques have been associated with the best outcome of RT. Combination therapy of TACE and RT has been reported with promising results.105–107
Yttrium-90 (90Y) is a beta-emitter radioisotope. The 90Y is delivered in microspheres into the hepatic artery and embolizes the microvessels and capillaries of the liver. Careful preintervention planning is required. This is performed to predict the distribution of microspheres in particular to possible shunting to the lungs or gastrointestinal system.108 The two contraindications to the procedure are exaggerated hepatopulmonary shunting and reflux into the arterial supply of the gastroduodenal region. 99mTc-MAA (Tc-macroaggregated albumin) single-photon emission computed tomography (SPECT) is obtained to detect the deposition of 90Y particles in nontargeted vessels. This in combination with detail knowledge of the arterial anatomy to the liver will reduce the risk of the procedures. For example, to reduce shunting and radiation damage to the pancreas, stomach, and gastrointestinal system, selected arterial embolization may be performed before therapy. This commonly includes embolization of the gastroduodenal artery.108
After 90Y administration, the HCC will demonstrate decreased enhancement in keeping with response to treatment. Nodular enhancement may suggest residual disease. The complete extent of response to treatment may not be seen in the initial examination. A follow-up study may demonstrate continued decrease in size and enhancement without additional therapy (Figure 9-17).
90Y has been used for downstaged HCC and, in recent studies, has outperformed TACE.109 In a larger series, 90Y-treated HCC had a time to progression of 7.9 months. Patients with Child-Pugh A disease benefited from the treatment, whereas patients with Child-Pugh B with portal vein thrombosis had poor outcomes.110
Surveillance
Arterial Enhancing Nodules
In the setting of patients with HCC, the detection of an AEN requires follow-up evaluation to assess resolution. Most of these AENs are likely to represent benign findings. The follow-up depends on the lesion size. For lesions larger than 0.5 cm, a 3-month follow-up is suggested. For lesions smaller than 0.5 mm, a 6-month follow-up is suggested. A longer follow-up is recommended for the smaller lesion to appreciate significant change in the studies.
Following Radiofrequency Ablation and Transarterial Chemoembolization
On imaging, the ablated tissue will show changes due to hemorrhage and necrosis (liquefactive and coagulative).111,112 The hemorrhage will result in high signal on the T1WI, the coagulative necrosis will result in low signal on T2WI, and the liquefactive necrosis will result in high signal on the T2WI. The liquefactive necrosis will demonstrate nonrestrictive diffusion on DWI (B = 500) and an increase in ADC.113
The utilization of contrast-enhanced imaging (CT and MRI) is very useful to detect tumor response to RFA. MRI is slightly superior to CT in the sensitivity of detecting recurrent disease.111 It is important to note that the WHO and RECIST criteria are suboptimal in the evaluation of post–RFA-treated HCCs. The size of the cavity after RFA treatment will appear larger than the size of the original tumor. In these first scans, the evaluation should be centered on the margin of the RFA cavity. The detection of a nodular enhancement, irregular wall, or the distortion of a smooth tumor margin is a sign of an unsuccessful treatment.112–114 Subtraction images in MRI using the precontrast as the mask for subtracted images can be very helpful in detecting intracavity enhancement.
On follow-up studies, successful RFA will also demonstrate a subsequent decrease in size of the cavity.111 An increase in size of the cavity (on CT or MRI) indicates either interval hemorrhage or recurrent disease.114,115
Following 90Y
The most common finding on the CT evaluation of treated liver with 90Y is decreased attenuation. This is probably due to congestion, edema, and microinfarction. This is similar to radiation changes in the setting of external beam RT. In the evaluation of response to treatment after 90Y therapy, the RECIST criteria are suboptimal. The tumor response may present as decreased activity on FDG-PET imaging, decreased arterial enhancement, and interval necrosis. The survival at 1-year is reported in two separate studies at 51% and 63%.116,117 In a separate study, tumor response was observed in 100% of targeted lesions. However, the appearance of new lesions affected overall survival.117
The Radiology Report
Key Points The radiology report for hepatocellular carcinoma
• Number, size, and segmental distribution.
• Vascular evaluation: involvement, relationship to tumor, and variant anatomy.
• Evaluation of FLR pre- and post-PVE (portal vein embolization).
• Evaluation for cirrhosis, portal hypertension, fatty liver, and ascites.
• Regional and distant nodal disease.
• Metastatic implants: liver, organs, or peritoneal disease.
Epidemiology
FLHCC occurs primarily in young patients. It is, however, more common to have an HCC in a younger patient than to have FLHCC. The mean and median age of diagnosis are 23 years and 33 years, respectively.6 There is no sex predilection for this tumor. The majority of tumors in the United States present in the non-Hispanic white population.
The age-adjusted incidence of FLHCC in the United States is 0.02 per 100,000 per year based on the Surveillance, Epidemiology, and End Results (SEER) program of the National Cancer Institute (NCI). This is 100-fold less than HCC. Unlike HCC, there is no association with hepatitis B or C infection and there are no specific risk factors.
The population-based relative survival of FLHCC in the United States is 73% to 90% at 1 year and 32% to 38% at 5 years.6,118,119 The median survival for unresectable metastatic FLHCC is 14 months.
Pathology
In contrast to HCC, immunohistochemical staining for α1-antitrypsin and fibrinogen is positive and AFP staining is mostly absent. Other markers seen on HCC, such as HepPar, cytokeratin 7, and CD99, may be seen with poorly differentiated FLHCC.120
Clinical Presentation
The most common symptoms are nonspecific and include abdominal pain, weight loss, and malaise.121 Rare symptoms such as the presence of gynecomastia due to aromatase production of FLHCC have been described. Other rare symptoms include liver failure and pain associated with skeletal metastases. At the time of diagnosis, the tumors are large intrahepatic liver masses. The tumor may measure 10 to 20 cm at presentation. Extrahepatic disease including nodal metastases is common at presentation. In contrast to HCC, there is no associated history of cirrhosis or chronic liver disease.
Abnormal liver function tests with mild elevation of AST (aspartate transaminase) and ALT (alanine transaminase) levels may be detected at presentation. Owing to mass effect on the biliary tree, elevated bilirubin may be detected. The level of AFP is usually normal with fewer than 10% of patients presenting with an AFP greater than 200 ng/mL.122 Elevated levels of serum des-carboxy prothombin and B12 binding capacity can be seen in most FLHCCs.123,124
Patterns of Tumor Spread
At the time of presentation, 70% of FLHCCs will have metastatic nodal disease.125 Metastatic disease is more common at presentation than on HCC. Distant metastases to the chest, ovary, and bones as well as peritoneal implants can be seen in over 40% of patients at presentation. The pattern of tumor spread for FLHCC is similar to that for HCC. The 5-year survival is 86% for patients without metastases versus 39% in the setting of metastatic disease.
Imaging
CT is the most commonly used modality for the evaluation of patients with FLHCC. On the precontrast CT image, FLHCC appears as a low-attenuation, well-defined, solitary mass. Calcifications are present in 33% to 55% of FLHCCs (Figure 9-18). Retraction of the Glisson capsule can be seen in FLHCC as in other malignant processes.
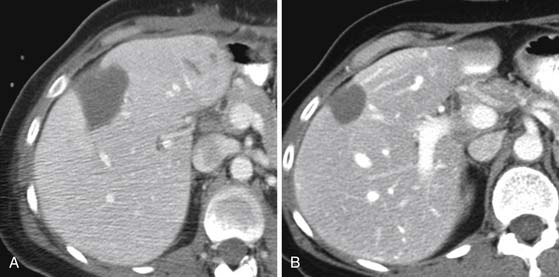
A multiphasic evaluation is recommended for the diagnosis and staging of FLHCC. During the multiphasic dynamic postcontrast CT evaluation of the liver, there is early and heterogeneous enhancement of the nonfibrous portion of the tumor (Figure 9-19). The central scar typically does not enhance; in 25% of cases, the scar may enhance on delayed imaging (see Figure 9-19). Some of the imaging features of FLHCC may overlap with a benign liver lesion: FNH. Both of these masses occur in a younger population. There are various distinctive imaging features. Delayed enhancement of the central scar is more commonly seen in FNH. Other distinguishing features that distinguish FLHCC from FNH are (1) size (FNH usually < 5 cm); (2) invasion of vessels or bile ducts (not seen on FNH); (3) heterogeneous enhancement (rare in FNH); (4) calcifications (seen on FLHCC); and (5) isoattenuating to vessels (likely FNH).
The MRI evaluation of the liver in patients with FLHCC shows a large and lobulated mass. On the T1WI, it is hypointense to the liver parenchyma (Figure 9-20). On the T2WI, the periphery of the lesion is hyperintense and heterogeneous to the liver, whereas the central scar is hypointense to the liver (see Figure 9-20). The scar is low signal on both T1WI and T2WI, in contrast to FNH in which the central area is hyperintense to the liver. However, necrosis in the central scar of FLHCC will appear as high signal intensity on the T2WI.
During the multiphasic dynamic postcontrast MRI evaluation of the liver, there is early and heterogeneous enhancement of the nonfibrous portion of the tumor. The central scar usually does not enhance or enhances late (see Figure 9-20).
FDG-PET imaging is of limited value because these tumors are well differentiated.
Key Points Imaging of fibrolamellar hepatocellular carcinoma
• Multiphasic dynamic postcontrast protocol (CT and MRI) is required.
• FLHCC enhances early and washes out on delayed images.
• Twenty-five percent of FLHCC’s central scar enhances on delayed images.
• Distinction of FLHCC from FNH is based on size (>5 cm), invasion of vessels, heterogeneous enhancement, calcifications, and low signal of the central scar on T2WI.
• Metastatic adenopathy mimics the imaging features of the primary tumor.
Treatment
Surgery
Because the patient population is younger without underlying cirrhotic liver disease, FLHCC is more aggressively treated. The 5-year survival rates for hepatic resection range from 45% to 80%.118,119,122 The 5-year recurrence-free survival is 18%.122 In one series, the most significant prognostic factor was the presence of lymph node metastases. In another series, the analysis of tumor size, number of lesions, vascular, capsular, or lymph node invasion did not affect the prognosis.118 In the setting of recurrent disease or lymph node metastases, resection is performed because surgery remains the best treatment option.118,122
In some institutions, the detection of local organ spread or lymph node metastasis is not considered a contraindication to surgical resection.123,125
LT has been considered for unresectable FLHCCs. In multiple small series, the 5-year survival for orthotopic LT ranges from 35% to 50%.118,119 Because there is no underlying cirrhosis in the setting of FLHCC, orthotopic LT does not have the added benefit of orthotopic LT in HCC of the resection of the underlying liver pathology.
Transarterial Chemoembolization/Chemotherapy Agents
FLHCC has been treated with single and combined agents. A trial of combination 5-fluorouracil (5-FU) and interferon-alpha-2b demonstrated 62.5% response and an overall survival of 23.1 months.126 In this trial, FLHCC responded better than HCC (median survival 15.5 mo) and, subsequently, this regimen has gained a wide acceptance among medical oncologists.
FLHCC can be treated with TACE.127,128 The main indications for TACE in FLHCC are tumor reduction in the preoperative management (downstaging) and in the setting of unresectable disease, although FLHCC is generally considered a “surgical” disease.
Radiation Therapy
RT has not been useful in the management of FLHCC except for palliation.
Key Points Treatment of fibrolamellar hepatocellular carcinoma
• Aggressive resection of primary tumor, nodal, and lung metastases improves survival.
• Re-resection of recurrent disease remains the best treatment option.
• RT is indicated for palliation.
• TACE is beneficial for downstaging.
• Combination chemotherapy had an overall survival greater than for HCC.
Surveillance
CT and MRI evaluation are performed on a routine basis after resection of the tumor. Because FLHCC occurs in a younger population, MRI is suggested as the modality of choice to eliminate radiation risks. Close attention should be paid to the regional nodes—diaphragmatic, precaval, periportal, and retroperitoneal—for evidence of recurrence. Because these are younger patients without underlying liver disease, aggressive management is performed. Repeat surgical intervention with resection of the metastatic adenopathy improves survival.129
1. Parkin D.M., et al. Global cancer statistics, 2002. CA Cancer. J Clin. 2005;55:74-108.
2. El-Serag H.B., Rudolph K.L. Hepatocellular carcinoma: epidemiology and molecular carcinogenesis. Gastroenterology. 2007;132:2557-2576.
3. McGlynn K.A., London W.T. Epidemiology and natural history of hepatocellular carcinoma. Best Pract Res Clin Gastroenterol. 2005;19:3-23.
4. Tsukuma H., et al. Risk factors for hepatocellular carcinoma among patients with chronic liver disease. N Engl J Med. 1993;328:1797-1801.
5. El-Serag H.B., et al. The continuing increase in the incidence of hepatocellular carcinoma in the United States: an update. Ann Intern Med. 2003;139:817-823.
6. El-Serag H.B., Davila J.A. Is fibrolamellar carcinoma different from hepatocellular carcinoma? A US population-based study. Hepatology. 2004;39:798-803.
6a. El-Serag H.B., Mason A.C. Rising incidence of hepatocellular carcinoma in the United States. N Engl J Med. 1999;340:745-750.
7. Mazzaferro V., et al. Risk of HBV reinfection after liver transplantation in HBsAg-positive cirrhosis. Primary hepatocellular carcinoma is not a predictor for HBV recurrence. The European Cooperative Study Group on Liver Cancer and Transplantation. Liver. 1996;16:117-122.
8. Michels N.A. Newer anatomy of the liver and its variant blood supply and collateral circulation. Am J Surg. 1966;112:337-347.
9. Kudo M. Multistep human hepatocarcinogenesis: correlation of imaging with pathology. J Gastroenterol. 2009;44(Suppl 19):112-118.
10. Kobayashi M., et al. Dysplastic nodules frequently develop into hepatocellular carcinoma in patients with chronic viral hepatitis and cirrhosis. Cancer. 2006;106:636-647.
11. Wong C.M., Ng I.O. Molecular pathogenesis of hepatocellular carcinoma. Liver Int. 2008;28:160-174.
12. Klein W.M., et al. Primary liver carcinoma arising in people younger than 30 years. Am J Clin Pathol. 2005;124:512-518.
13. van den Bos I.C., et al. MR imaging of hepatocellular carcinoma: relationship between lesion size and imaging findings, including signal intensity and dynamic enhancement patterns. J Magn Reson Imaging. 2007;26:1548-1555.
14. Kadoya M., et al. Hepatocellular carcinoma: correlation of MR imaging and histopathologic findings. Radiology. 1992;183:819-825.
15. Schafer D.F., Sorrell M.F. Hepatocellular carcinoma. Lancet. 1999;353:1253-1257.
16. Trevisani F., et al. Etiologic factors and clinical presentation of hepatocellular carcinoma. Differences between cirrhotic and noncirrhotic Italian patients. Cancer. 1995;75:2220-2232.
17. Kassianides C., Kew M.C. The clinical manifestations and natural history of hepatocellular carcinoma. Gastroenterol Clin North Am. 1987;16:553-562.
18. Soresi M., et al. Usefulness of alpha-fetoprotein in the diagnosis of hepatocellular carcinoma. Anticancer Res. 2003;23:1747-1753.
19. Zhou L., Liu J., Luo F. Serum tumor markers for detection of hepatocellular carcinoma. World J Gastroenterol. 2006;12:1175-1181.
20. Vauthey J.N., et al. Simplified staging for hepatocellular carcinoma. J Clin Oncol. 2002;20:1527-1536.
21. Greene F.L., Trotti A.III, Fritz A.G. Liver. In: Edge SB, Byrd DR, Compton CC, et al, eds. AJCC Cancer Staging Manual, 7th ed. New York: Springer, 2010.
22. Wiesner R.H., Freeman R.B., Mulligan D.C. Liver transplantation for hepatocellular cancer: the impact of the MELD allocation policy. Gastroenterology. 2004;127(5 Suppl. 1):S261-S267.
23. Yuki K., et al. Growth and spread of hepatocellular carcinoma. A review of 240 consecutive autopsy cases. Cancer. 1990;66:2174-2179.
24. Chalasani N., et al. Screening for hepatocellular carcinoma in patients with cirrhosis in the United States: results of a national survey. Am J Gastroenterol. 1999;94:2224-2229.
25. Rode A., et al. Small nodule detection in cirrhotic livers: evaluation with US, spiral CT, and MRI and correlation with pathologic examination of explanted liver. J Comput Assist Tomogr. 2001;25:327-336.
26. Teefey S.A., et al. Detection of primary hepatic malignancy in liver transplant candidates: prospective comparison of CT, MR imaging, US, and PET. Radiology. 2003;226:533-542.
27. Miller J.C., et al. Screening for hepatocellular carcinoma in cirrhotic patients. J Am Coll Radiol. 2008;5:1012-1014.
28. Bennett G.L., et al. Sonographic detection of hepatocellular carcinoma and dysplastic nodules in cirrhosis: correlation of pretransplantation sonography and liver explant pathology in 200 patients. AJR Am J Roentgenol. 2002;179:75-80.
29. Nicolau C., et al. Evaluation of hepatocellular carcinoma using SonoVue, a second generation ultrasound contrast agent: correlation with cellular differentiation. Eur Radiol. 2004;14:1092-1099.
30. Kamel I.R., Liapi E., Fishman E.K. Multidetector CT of hepatocellular carcinoma. Best Pract Res Clin Gastroenterol. 2005;19:63-89.
31. Monzawa S., et al. Dynamic CT for detecting small hepatocellular carcinoma: usefulness of delayed phase imaging. AJR Am J Roentgenol. 2007;188:147-153.
32. Takayasu K., et al. CT evaluation of the progression of hypoattenuating nodular lesions in virus-related chronic liver disease. AJR Am J Roentgenol. 2006;187:454-463.
33. Kim S.K., et al. Detection of hepatocellular carcinoma: comparison of dynamic three-phase computed tomography images and four-phase computed tomography images using multidetector row helical computed tomography. J Comput Assist Tomogr. 2002;26:691-698.
34. Iannaccone R., et al. Hepatocellular carcinoma: role of unenhanced and delayed phase multi-detector row helical CT in patients with cirrhosis. Radiology. 2005;234:460-467.
35. Hecht E.M., et al. Hepatocellular carcinoma in the cirrhotic liver: gadolinium-enhanced 3D T1-weighted MR imaging as a stand-alone sequence for diagnosis. Radiology. 2006;239:438-447.
36. Krinsky G.A., et al. Hepatocellular carcinoma and dysplastic nodules in patients with cirrhosis: prospective diagnosis with MR imaging and explantation correlation. Radiology. 2001;219:445-454.
37. Mitchell D.G., et al. Hepatocellular tumors with high signal on T1-weighted MR images: chemical shift MR imaging and histologic correlation. J Comput Assist Tomogr. 1991;15:762-769.
38. Kim T., et al. Detection of hypervascular hepatocellular carcinoma by dynamic MRI and dynamic spiral CT. J Comput Assist Tomogr. 1995;19:948-954.
39. Oi H., et al. Dynamic MR imaging and early-phase helical CT for detecting small intrahepatic metastases of hepatocellular carcinoma. AJR Am J Roentgenol. 1996;166:369-374.
40. Kumano S., et al. Efficacy of double arterial phase dynamic magnetic resonance imaging with the sensitivity encoding technique versus dynamic multidetector-row helical computed tomography for detecting hypervascular hepatocellular carcinoma. Jpn J Radiol. 2009;27:229-236.
41. Sharma P., et al. Gadolinium-enhanced imaging of liver tumors and manifestations of hepatitis: pharmacodynamic and technical considerations. Top Magn Reson Imaging. 2009;20:71-78.
42. Matsui O., et al. Benign and malignant nodules in cirrhotic livers: distinction based on blood supply. Radiology. 1991;178:493-497.
43. Kim Y.K., et al. Three-dimensional dynamic liver MR imaging using sensitivity encoding for detection of hepatocellular carcinomas: comparison with superparamagnetic iron oxide-enhanced MR imaging. J Magn Reson Imaging. 2004;20:826-837.
44. Mori K., et al. Triple arterial phase dynamic MRI with sensitivity encoding for hypervascular hepatocellular carcinoma: comparison of the diagnostic accuracy among the early, middle, late, and whole triple arterial phase imaging. AJR Am J Roentgenol. 2005;184:63-69.
45. Choi S.H., et al. Hepatocellular carcinoma in liver transplantation candidates: detection with gadobenate dimeglumine-enhanced MRI. AJR Am J Roentgenol. 2008;191:529-536.
46. Narita M., et al. Expression of OATP1B3 determines uptake of Gd-EOB-DTPA in hepatocellular carcinoma. J Gastroenterol. 2009;44:793-798.
47. Imamura H., et al. Risk factors contributing to early and late phase intrahepatic recurrence of hepatocellular carcinoma after hepatectomy. J Hepatol. 2003;38:200-207.
48. Stevens W.R., et al. Mosaic pattern of hepatocellular carcinoma: histologic basis for a characteristic CT appearance. J Comput Assist Tomogr. 1996;20:337-342.
49. Lauenstein T.C., et al. Gadolinium-enhanced MRI for tumor surveillance before liver transplantation: center-based experience. AJR Am J Roentgenol. 2007;189:663-670.
50. Kim Y.K., et al. Clinical implication of small (<20 mm) enhancing hepatic nodules observed only during three-dimensional gadobenate dimeglumine-enhanced hepatic arterial-phase MRI of the hepatitis B virus-induced mild cirrhosis. Clin Imaging. 2008;32:453-459.
51. Holland A.E., et al. Importance of small (≤ 20-mm) enhancing lesions seen only during the hepatic arterial phase at MR imaging of the cirrhotic liver: evaluation and comparison with whole explanted liver. Radiology. 2005;237:938-944.
52. Torizuka T., et al. In vivo assessment of glucose metabolism in hepatocellular carcinoma with FDG-PET. J Nucl Med. 1995;36:1811-1817.
53. Lee J.D., et al. Analysis of gene expression profiles of hepatocellular carcinomas with regard to 18F-fluorodeoxyglucose uptake pattern on positron emission tomography. Eur J Nucl Med Mol Imaging. 2004;31:1621-1630.
54. Trojan J., et al. Fluorine-18 FDG positron emission tomography for imaging of hepatocellular carcinoma. Am J Gastroenterol. 1999;94:3314-3319.
55. Ho C.L., Yu S.C., Yeung D.W. 11C-acetate PET imaging in hepatocellular carcinoma and other liver masses. J Nucl Med. 2003;44:213-221.
56. De Gaetano A.M., et al. Role of diagnostic imaging in abdominal lymphadenopathy. Rays. 2000;25:463-484.
57. Moron F.E., Szklaruk J. Learning the nodal stations in the abdomen. Br J Radiol. 2007;80:841-848.
58. Efremidis S.C., et al. Pathways of lymph node involvement in upper abdominal malignancies: evaluation with high-resolution CT. Eur Radiol. 1999;9:868-874.
59. Tublin M.E., Dodd G.D.3rd, Baron R.L. Benign and malignant portal vein thrombosis: differentiation by CT characteristics. AJR Am J Roentgenol. 1997;168:719-723.
60. Tarantino L., et al. Diagnosis of benign and malignant portal vein thrombosis in cirrhotic patients with hepatocellular carcinoma: color Doppler US, contrast-enhanced US, and fine-needle biopsy. Abdom Imaging. 2006;31:537-544.
61. Catalano O.A., et al. Differentiation of malignant thrombus from bland thrombus of the portal vein in patients with hepatocellular carcinoma: application of diffusion-weighted MR imaging. Radiology. 2010;254:154-162.
62. Pawlik T.M., et al. Tumor size predicts vascular invasion and histologic grade: Implications for selection of surgical treatment for hepatocellular carcinoma. Liver Transpl. 2005;11:1086-1092.
63. Pawlik T.M., et al. Hepatectomy for hepatocellular carcinoma with major portal or hepatic vein invasion: results of a multicenter study. Surgery. 2005;137:403-410.
64. Yamashita Y., et al. Outcomes of hepatic resection for huge hepatocellular carcinoma (≥10 cm in diameter). J Surg Oncol. 2011;104:292-298.
65. Vauthey J.N., et al. Standardized measurement of the future liver remnant prior to extended liver resection: methodology and clinical associations. Surgery. 2000;127:512-519.
66. Madoff D.C., Abdalla E.K., Vauthey J.N. Portal vein embolization in preparation for major hepatic resection: evolution of a new standard of care. J Vasc Interv Radiol. 2005;16:779-790.
67. Ueno S., et al. Efficacy of anatomic resection vs nonanatomic resection for small nodular hepatocellular carcinoma based on gross classification. J Hepatobiliary Pancreat Surg. 2008;15:493-500.
68. Palavecino M., et al. Major hepatic resection for hepatocellular carcinoma with or without portal vein embolization: perioperative outcome and survival. Surgery. 2009;145:399-405.
69. Yamashita Y., et al. Long-term favorable results of limited hepatic resections for patients with hepatocellular carcinoma: 20 years of experience. J Am Coll Surg. 2007;205:19-26.
70. Nuzzo G., et al. Liver resections for hepatocellular carcinoma in chronic liver disease: experience in an Italian centre. Eur J Surg Oncol. 2007;33:1014-1018.
71. Belghiti J., et al. Resection prior to liver transplantation for hepatocellular carcinoma. Ann Surg. 2003;238:885-892. discussion 892–893
72. Lo C.M., et al. A randomized, controlled trial of postoperative adjuvant interferon therapy after resection of hepatocellular carcinoma. Ann Surg. 2007;245:831-842.
73. Ng K.K., et al. Is hepatic resection for large or multinodular hepatocellular carcinoma justified? Results from a multi-institutional database. Ann Surg Oncol. 2005;12:364-373.
74. Young A.L., et al. Large hepatocellular carcinoma: time to stop preoperative biopsy. J Am Coll Surg. 2007;205:453-462.
75. Jonas S., et al. Vascular invasion and histopathologic grading determine outcome after liver transplantation for hepatocellular carcinoma in cirrhosis. Hepatology. 2001;33:1080-1086.
76. Tanwar S., et al. Liver transplantation for hepatocellular carcinoma. World J Gastroenterol. 2009;15:5511-5516.
77. Furukawa H., et al. Living-donor liver transplantation for hepatocellular carcinoma. J Hepatobiliary Pancreat Surg. 2006;13:393-397.
78. Soejima Y., et al. Extended indication for living donor liver transplantation in patients with hepatocellular carcinoma. Transplantation. 2007;83:893-899.
79. Vogl T.J., et al. Review on transarterial chemoembolization in hepatocellular carcinoma: palliative, combined, neoadjuvant, bridging, and symptomatic indications. Eur J Radiol. 2009;72:505-516.
80. Ito K., et al. Therapeutic efficacy of transcatheter arterial chemoembolization for hepatocellular carcinoma: MRI and pathology. J Comput Assist Tomogr. 1995;19:198-203.
81. Yamashita Y., et al. Dynamic MR imaging of hepatoma treated by transcatheter arterial embolization therapy. Assessment of treatment effect. Acta Radiol. 1993;34:303-308.
82. Jaeger H.J., et al. Sequential transarterial chemoembolization for unresectable advanced hepatocellular carcinoma. Cardiovasc Intervent Radiol. 1996;19:388-396.
83. Marelli L., et al. Transarterial therapy for hepatocellular carcinoma: which technique is more effective? A systematic review of cohort and randomized studies. Cardiovasc Intervent Radiol. 2007;30:6-25.
84. Abdalla E.K., et al. Recurrence and outcomes following hepatic resection, radiofrequency ablation, and combined resection/ablation for colorectal liver metastases. Ann Surg. 2004;239:818-825. discussion 825–827
85. Elias D., et al. Simultaneous percutaneous right portal vein embolization and left liver tumor radiofrequency ablation prior to a major right hepatic resection for bilateral colorectal metastases. Hepatogastroenterology. 2004;51:1788-1791.
86. Llovet J.M. Updated treatment approach to hepatocellular carcinoma. J Gastroenterol. 2005;40:225-235.
87. Llovet J.M., Sala M. Non-surgical therapies of hepatocellular carcinoma. Eur J Gastroenterol Hepatol. 2005;17:505-513.
88. Pearson A.S., et al. Intraoperative radiofrequency ablation or cryoablation for hepatic malignancies. Am J Surg. 1999;178:592-599.
89. Bowles B.J., et al. Safety and efficacy of radiofrequency thermal ablation in advanced liver tumors. Arch Surg. 2001;136:864-869.
90. Bleicher R.J., et al. Radiofrequency ablation in 447 complex unresectable liver tumors: lessons learned. Ann Surg Oncol. 2003;10:52-58.
91. Lencioni R.A., et al. Small hepatocellular carcinoma in cirrhosis: randomized comparison of radio-frequency thermal ablation versus percutaneous ethanol injection. Radiology. 2003;228:235-240.
92. Mazzaferro V., et al. Radiofrequency ablation of small hepatocellular carcinoma in cirrhotic patients awaiting liver transplantation: a prospective study. Ann Surg. 2004;240:900-909.
93. Ni Y., et al. A review of the general aspects of radiofrequency ablation. Abdom Imaging. 2005;30:381-400.
94. Ng I.O., et al. Expression of P-glycoprotein in hepatocellular carcinoma. A determinant of chemotherapy response. Am J Clin Pathol. 2000;113:355-363.
95. Zhu A.X. Systemic therapy of advanced hepatocellular carcinoma: how hopeful should we be? Oncologist. 2006;11:790-800.
96. Nowak A.K., Chow P.K., Findlay M. Systemic therapy for advanced hepatocellular carcinoma: a review. Eur J Cancer. 2004;40:1474-1484.
97. Pinter M., et al. Thalidomide in advanced hepatocellular carcinoma as antiangiogenic treatment approach: a phase I/II trial. Eur J Gastroenterol Hepatol. 2008;20:1012-1019.
98. Wang J., et al. Dynamic contrast-enhanced MRI analysis of perfusion changes in advanced hepatocellular carcinoma treated with an antiangiogenic agent: a preliminary study. AJR Am J Roentgenol. 2004;183:713-719.
99. Wilhelm S.M., et al. BAY 43-9006 exhibits broad spectrum oral antitumor activity and targets the RAF/MEK/ERK pathway and receptor tyrosine kinases involved in tumor progression and angiogenesis. Cancer Res. 2004;64:7099-7109.
100. Llovet J.M., et al. Sorafenib in advanced hepatocellular carcinoma. N Engl J Med. 2008;359:378-390.
101. Cheng A.L., et al. Efficacy and safety of sorafenib in patients in the Asia-Pacific region with advanced hepatocellular carcinoma: a phase III randomised, double-blind, placebo-controlled trial. Lancet Oncol. 2009;10:25-34.
102. Llovet J.M., et al. Design and endpoints of clinical trials in hepatocellular carcinoma. J Natl Cancer Inst. 2008;100:698-711.
103. Krishnan S., et al. Radiotherapy for hepatocellular carcinoma: an overview. Ann Surg Oncol. 2008;15:1015-1024.
104. Hawkins M.A., Dawson L.A. Radiation therapy for hepatocellular carcinoma: from palliation to cure. Cancer. 2006;106:1653-1663.
105. Chiba T., et al. Proton beam therapy for hepatocellular carcinoma: a retrospective review of 162 patients. Clin Cancer Res. 2005;11:3799-3805.
106. Kato H., et al. Results of the first prospective study of carbon ion radiotherapy for hepatocellular carcinoma with liver cirrhosis. Int J Radiat Oncol Biol Phys. 2004;59:1468-1476.
107. Seong J., et al. Combined transcatheter arterial chemoembolization and local radiotherapy of unresectable hepatocellular carcinoma. Int J Radiat Oncol Biol Phys. 1999;43:393-397.
108. Murthy R., et al. Yttrium-90 microsphere therapy for hepatic malignancy: devices, indications, technical considerations, and potential complications. Radiographics. 2005;25(Suppl 1):S41-S55.
109. Lewandowski R.J., et al. A comparative analysis of transarterial downstaging for hepatocellular carcinoma: chemoembolization versus radioembolization. Am J Transplant. 2009;9:1920-1928.
110. Salem R., et al. Radioembolization for hepatocellular carcinoma using Yttrium-90 microspheres: a comprehensive report of long-term outcomes. Gastroenterology. 2010;138(1):52-64.
111. Dromain C., et al. Hepatic tumors treated with percutaneous radio-frequency ablation: CT and MR imaging follow-up. Radiology. 2002;223:255-262.
112. Kuszyk B.S., et al. Local tumor recurrence following hepatic cryoablation: radiologic-histopathologic correlation in a rabbit model. Radiology. 2000;217:477-486.
113. Okuma T., et al. Assessment of early treatment response after CT-guided radiofrequency ablation of unresectable lung tumours by diffusion-weighted MRI: a pilot study. Br J Radiol. 2009;82:989-994.
114. Braga L., Semelka R.C. Magnetic resonance imaging features of focal liver lesions after intervention. Top Magn Reson Imaging. 2005;16:99-106.
115. Limanond P., et al. Interpretation of CT and MRI after radiofrequency ablation of hepatic malignancies. AJR Am J Roentgenol. 2003;181:1635-1640.
116. Geschwind J.F., et al. Yttrium-90 microspheres for the treatment of hepatocellular carcinoma. Gastroenterology. 2004;127(5 Suppl 1):S194-S205.
117. Sangro B., et al. Radioembolization using 90Y-resin microspheres for patients with advanced hepatocellular carcinoma. Int J Radiat Oncol Biol Phys. 2006;66:792-800.
118. El-Gazzaz G., et al. Outcome of liver resection and transplantation for fibrolamellar hepatocellular carcinoma. Transpl Int. 2000;1(Suppl 1):S406-S409.
119. Pinna A.D., et al. Treatment of fibrolamellar hepatoma with subtotal hepatectomy or transplantation. Hepatology. 1997;26:877-883.
120. Vasdev N., Nayak N.C. CD99 expression in hepatocellular carcinoma: an immunohistochemical study in the fibrolamellar and common variant of the tumour. Indian J Pathol Microbiol. 2003;46:625-629.
121. Torbenson M. Review of the clinicopathologic features of fibrolamellar carcinoma. Adv Anat Pathol. 2007;14:217-223.
122. Stipa F., et al. Outcome of patients with fibrolamellar hepatocellular carcinoma. Cancer. 2006;106:1331-1338.
123. Meriggi F., Forni E. Surgical therapy of hepatic fibrolamellar carcinoma [in Italian]. Ann Ital Chir. 2007;78:53-58.
124. van Tonder S., et al. Serum vitamin B12 binders in South African blacks with hepatocellular carcinoma. Cancer. 1985;56:789-792.
125. Stevens W.R., et al. Fibrolamellar hepatocellular carcinoma: stage at presentation and results of aggressive surgical management. AJR Am J Roentgenol. 1995;164:1153-1158.
126. Patt Y.Z., et al. Phase II trial of systemic continuous fluorouracil and subcutaneous recombinant interferon Alfa-2b for treatment of hepatocellular carcinoma. J Clin Oncol. 2003;21:421-427.
127. Sitzmann J.V. Conversion of unresectable to resectable liver cancer: an approach and follow-up study. World J Surg. 1995;19:790-794.
128. Soyer P., et al. Nonresectable fibrolamellar hepatocellular carcinoma: outcome of 4 cases treated by intra-arterial chemotherapy [in French]. J Belge Radiol. 1992;75:463-468.
129. A.W. Hemming. et al. Aggressive surgical management of fibrolamellar hepatocellular carcinoma. J Gastrointest Surg.. 1997;1:342-346.
* Please refer to the abridged M.D. Anderson practice consensus algorithm at the end of this chapter and to the unabridged algorithm on expertconsult.com
[/level-membership-for-hematology-oncology-and-palliative-medicine-category][not-level-membership-for-hematology-oncology-and-palliative-medicine-category]
Chapter 9 Liver Cancer
Hepatocellular and Fibrolamellar Hepatocellular Carcinoma
Epidemiology
HCC is the sixth most common cancer worldwide and one of the major causes of cancer-related deaths worldwide: fourth after lung, stomach, and colorectal cancers.1–3 It is the most common primary liver cancer in children and young adults. Worldwide, the most common cause of HCC is hepatitis B and C infection. Other high-risk groups include patients with alcohol cirrhosis, hemochromatosis, primary biliary cirrhosis, aflatoxin exposure, and α1-antitrypsin deficiency. The annual incidence of HCC in patients with cirrhosis is 2% to 6%.4 In the Western world, the most common liver disorder is nonalcoholic fatty liver disease (NAFLD). NAFLD corresponds to the hepatic manifestation of patients with obesity, insulin resistance, hypertriglyceridemia, and low high-density lipoprotein. NAFLD can progress to cirrhosis and to HCC.
There is a geographic bias with a high incidence of 90 per 100,000 cases in the Far East, Southeast Asia, and sub-Saharan Africa. In contrast, the incidence of HCC in the United States between 1998 and 2001 was 3.3 per 100,000.5 However, there has been an increased incidence in the United States since 1978 to 1980, when the incidence was 1.3 per 100,000. It is suggested that this increased incidence may be due to hepatitis C infection. HCC in the United States is more common in non-Hispanic whites (57%), followed by blacks (13%), Chinese Americans (8%), and white Hispanics (7%). In 2009, 22,620 adults are estimated to be diagnosed with HCC in the United States with 18,160 deaths in the same time period. In North America, approximately 20% of HCC does not have underlying cirrhosis.
HCC is more common in men than in women (4:1). In the high-incidence regions of the world, the male-to-female ratio can be as high as 8:1; in the low-incidence regions, it is 2:1. The median age of diagnosis is 66 years with less than 5% diagnosed in patients younger than 40 years. The peak age of incidence is 50 to 70 years. However, in the high-incidence regions, the age of presentation is younger at 30 to 50 years, and in the Western regions of the world, patients present later, in the eighth and ninth decades.6 The patient with cirrhosis presents at an earlier age.
The relative survival of HCC in the United States is 26% at 1 year and 7% to 12% at 5 years. The 5-year survival for untreated HCC is less than 5%.6a The patients with cirrhosis and a small HCC (<2 cm) who can undergo a liver transplant have an 80% survival rate.6,7
Anatomy
The liver is divided into the right and left lobes and is subdivided into eight anatomic segments (Figure 9-1). The segments are defined by their portal vein supply and separated from each other by the hepatic veins. The caudate lobe is considered segment I. The portal supply to the caudate lobe arises commonly from the main portal vein but may be seen from the left or right portal veins. Segments II and III of the liver are in the left lobe and are supplied by the first and second lateral branches of the left portal vein, respectively. Segment IV is also in the left lobe and is separated from II and III by the left hepatic vein and by the falciform ligament. It is supplied by the medial branches of the left portal vein. The right hepatic vein separates segments in the right lobe: segment VII from VIII and segment VI from V. Segments VII and VI are supplied by the posterior branch of the right portal vein, superior and inferior branches, respectively. Segments VIII and V are supplied by the anterior branch of the right portal vein, superior and inferior, respectively. The middle hepatic vein separates the right and left lobes, segment VIII from IV and segment V from IV. Segment V is also separated from segment IV by the gallbladder fossa (see Figure 9-1).
The liver has an assortment of vascular variants. Michel’s classification describes 10 hepatic arterial anomalies.8 The most common, type I, describes a common hepatic artery that arises from the celiac artery and bifurcates into the right and left hepatic artery, supplying the right and left lobes. Other common vascular variants include a replaced or accessory right hepatic artery from the superior mesenteric artery and a replaced or accessory left hepatic artery from the left gastric artery. Surgical intervention and transarterial chemoembolization (TACE) rely on the complete understanding of the liver arterial anatomy. Documentation of the vascular supply of the liver is essential for correct treatment planning.
Pathology
In the cirrhotic liver, the development of HCC occurs in stages.9 The transformation begins from regenerative nodules (RNs), to a premalignant lesion–dysplastic nodules (DNs), to early HCC, to advanced carcinoma.10 It has been reported that allelic loss, chromosomal changes, gene mutations, epigenetic alterations, and alterations in molecular cellular pathways play a role in this transformation.11
HCC has four main histologic classifications: trabecular, pseudoglandular, compact, and scirrhous. The most common type is the trabecular pattern, and the scirrhous is the least common. The trabecular pattern is composed of fibrous stroma separating the tumor cell plates.12 The histology grading of HCC ranges from well-differentiated to highly anaplastic tumors. This tumor grade has been found to predict survival. Grade I tumors can mimic hepatocellular adenomas, whereas grade IV tumors may mimic nonhepatocellular malignancy.
HCC can present as large or infiltrative diffuse disease. A capsule is commonly present in tumors larger than 2 cm.13,14
Clinical Presentation
The clinical presentation of HCC is nonspecific with symptoms that include right upper quadrant pain, weight loss, fullness, anorexia, abdominal swelling, vomiting, fever, fatigue, and jaundice. Many of these symptoms are shared by the underlying cirrhosis and chronic hepatitis in the absence of HCC.15,16 In the setting of cirrhosis, the development of weakness, malaise, and weight loss should raise the suspicion of an HCC.
Paraneoplastic manifestations of HCC, seen in fewer than 5% of patients with HCC, include erythrocytes, hypercholesterolemia, porphyria cutanea tarda, gynecomastia, hypercalcemia, and hyperglycemia.17
The laboratory testing for HCC includes alpha-fetoprotein (AFP) levels. AFP is the most common tumor marker used for screening patients with HCC. The normal range is 10 to 20 ng/mL. The positive predictive value (PPV) of AFP in predicting cancer depends on the etiology of the tumor. Elevated AFP is seen more commonly in the Asian countries (70%) than in the Western world (50%). A non–viral-related form has a 94% PPV compared with 70% for viral-related HCC.18 A mass in the liver with an AFP level of more than 200 ng/mL is considered diagnostic of HCC. However, in 20% of HCCs, the AFP is not elevated. Another serum marker evaluated in patients with HCC is the protein-induced vitamin K abnormality (PIVKA). PIVKA is commonly elevated in patients with HCC (80%).19 However, AFP and PIVKA may be elevated in patients with chronic hepatitis and cirrhosis without HCC.
Staging Classification
The most recent tumor-node-metastasis (TNM) staging criteria of the seventh edition of the American Joint Commission on Cancer (AJCC; Tables 9-1 and 9-2) is based on tumor number, size, and vascular invasion (T); local and distant metastatic adenopathy (N); and the presence of metastatic disease.20,21
Table 9-1 Tumor-Node-Metastasis Classification for Hepatocellular Carcinoma
| Primary Tumor (T) | |
| TX | Primary tumor cannot be assessed |
| T0 | No evidence of primary tumor |
| T1 | Solitary tumor without vascular invasion |
| T2 | Solitary tumor with vascular invasion or multiple tumors none > 5 cm |
| T3a | Multiple tumors > 5 cm |
| T3b | Single tumor or multiple tumors of any size involving a major branch of the portal vein or hepatic vein |
| T4 | Tumor(s) with direct invasion of adjacent organs other than the gallbladder or with perforation of visceral peritoneum |
| Regional Lymph Nodes (N) | |
| NX | Regional lymph nodes cannot be assessed |
| N0 | No regional lymph node metastasis |
| N1 | Regional lymph node metastasis |
| Distant Metastasis (M) | |
| M0 | No distant metastasis |
| M1 | Distant metastasis |
From Greene FL, Trotti A III, Fritz AG, et aI. Liver. In: Edge SB, Byrd DR, Compton CC, et al, eds. AJCC Cancer Staging Manual. 7th ed. New York: Springer; 2010.
T1 tumor stage classification is for all solitary tumors regardless of size without vascular invasion (Figure 9-2). T2 tumor is defined as solitary tumors with vascular invasion or multiple tumors none larger than 5 cm (see Figure 9-2). T3 tumors are classified as multiple tumors larger than 5 cm or tumors with major vascular invasion of a major branch of the portal or hepatic veins (see Figure 9-2). T4 lesions are described as tumors that demonstrate direct invasion to adjacent organs, other than the gallbladder, or in the setting of perforation to the visceral peritoneum (see Figure 9-2). The cumulative survival for the various T stages is shown in Figure 9-3.20
The criteria for liver transplantation (LT) are based on size and number of lesions. Patients with a single lesion less than 5 cm or up to three lesions none larger than 3 cm are considered transplant candidates. The Model for End Stage Liver Disease (MELD) HCC scoring system is used to prioritize the patients on the waiting list for LT.22 A single HCC larger than 2 cm or multiple nodules increase the priority. In explanted livers in the United States, a third of the patients with the pretransplant diagnosis of HCC did not have histologic confirmation.22 Transplantation can be considered for HCC solely on the basis of lesion characterization on imaging.
Key Points Staging of hepatocellular carcinoma
• T staging is based on lesion size (>5 cm), number, and vascular and organ invasion.
• N staging is based on regional (N1) and distant nodes (N2).
• Most common distant metastases are lung and bone.
• Criteria for transplantation are a single lesion smaller than 5 cm or up to three lesions, none larger than 3 cm.
Patterns of Tumor Spread
HCC may present with intrahepatic and extrahepatic tumor spread.23 This is more common with larger tumors (>5 cm). The most common type of spread of HCC is intrahepatic tumors followed by portal vein tumor thrombosis. The extrahepatic (hematogenous + lymphatic) spread has been reported in autopsy series in over half of cases, with the lung as the most common site.17 Hematogenous spread may also be seen in the adrenal glands, bone, pancreas, kidney, and spleen. Lymphatic metastases are commonly found and typically occur at the hepatic hilum (Figure 9-4).23 Other common nodal stations include anterior diaphragmatic nodes, peripancreatic nodes, perigastric nodes, retroperitoneum, paratracheal, carina, and supraclavicular nodal stations. The mortality of HCC is usually due to underlying liver failure rather than tumor spread, with most patients dying without clinical symptoms of extrahepatic metastasis.
Imaging
Primary Tumor
Ultrasound
Ultrasound (US) has been suggested as the imaging modality of choice in screening patients with chronic liver disease that are at risk of developing HCC. In a survey of physicians, members of the American Association of Study of Liver Diseases found that screening for HCC was performed by 84% of the responders.24 The most frequent screening tools were AFP and US examination.
The sensitivity of US for the detection of HCC depends on the patient population, size of the lesion, and technical skills. Lower sensitivities for detection were seen in the United States and in the smaller lesions (1-2 cm). This lower sensitivity in the United States may be due to an overweight population. The higher sensitivity was seen in Asia with a less overweight patient population. Utilizing the gold standard of explanted livers, the sensitivity of US ranges with great variability from 33% to 72%.25,26 The specificity of US ranged from 92% to 100%.27,28
The most common sonographic appearance of HCC is a hypoechoic solid mass (Figure 9-5). This is more common in smaller, well-differentiated tumors. In larger tumors, the sonographic appearance is varied with features due to necrosis (hypoechoic), fat (hyperechoic), fibrosis (hyperechoic), hemorrhage (hyperechoic), and calcium (hyperechoic). US is commonly the imaging modality of choice for image-guided tumor biopsy.
Contrast-enhanced ultrasound (CE-US) has shown promise in the characterization of HCC. The most common imaging feature is intratumoral enhancement in the arterial phase.29 However, in some well-differentiated HCCs, there is no arterial enhancement on CE-US evaluation.29 This technique is not approved for clinical use in the United States.
Computed Tomography
Computed tomography (CT) is the most commonly used modality for the evaluation of patients with HCC. This is in part a result of availability. A liver protocol is recommended for the evaluation of patients with HCC. This consists of a precontrast CT examination of the abdomen at 5 mm with 2.5-mm reconstructed images and dynamic study with multiple phases after the intravenous injection of iodinated contrast agent. The rate of contrast injection should be 4 to 6 mL/sec. This allows optimum tumor enhancement and conspicuity.30,31 The first phase after contrast administration is the late arterial phase. This occurs at approximately 30 to 35 seconds after the intravenous administration of contrast. In our institution, we use a bolus tracking technique in which the inflow of contrast is monitored with a region of interest in the aorta at the level of the celiac artery. Once the Hounsfield units reach 100 HU, after a set delay of 17 seconds, the late arterial phase is acquired. The second phase, the portal venous phase (PVP), is obtained at approximately 60 seconds after contrast administration. The third phase of imaging, the excretory phase, is obtained at 3 to 5 minutes after intravenous contrast administration.
On the noncontrast CT examination, HCC is commonly seen as a low-attenuation mass relative to liver but can present as isointense or hyperintense to liver (Figure 9-6A). The noncontrast study is useful to detect calcifications, hemorrhage, and fat infiltration of the liver. HCCs are very hypervascular tumors and are best detected during the late arterial phase of contrast administration (see Figure 9-6B). The liver enhancement occurs during the second phase after contrast administration, the PVP. The tumor is less conspicuous during this phase of imaging (see Figure 9-6C). The classic pattern of enhancement is for the hypervascular mass seen on the late arterial phase to show low attenuation relative to the liver on the excretory phase. In the setting of a capsule, the capsule will demonstrate low attenuation in the late arterial phase, mixed attenuation on the PVP, and enhancement on the delayed phase (see Figure 9-6D). HCC imaging features are variable with some tumors seen only during the late arterial phase (hypervascular) or only during the excretory phase (low attenuation). A follow-up evaluation of a series of 60 hypoattenuating nodules in chronically injured liver concluded that the conversion rates to hypervascular HCC (nodule in a nodule or entire enhancement) at 1 year, 2 years, and 3 years were 15.8%, 44.3%, and 58.7%, respectively.32
CT scan features of cirrhosis include nodular contour of the liver, an enlarged caudate lobe, relative enlargement of the left lobe, right hepatic notch, and an enlarged gallbladder fossa (Figure 9-7). In the setting of portal hypertension, an enlarged spleen, recanalized umbilical vein, and varices in the left gastric or esophageal distribution may be seen on CT.
To complicate the diagnosis of HCC, other lesions seen in the cirrhotic liver may share imaging features with HCC. As described previously, tumor development in the cirrhotic patient is a stepwise progression from an RN, to a DN, to a DN with HCC, and to HCC (well-differentiated to poorly differentiated). RNs have a dominant portal venous blood supply and may have iron content (siderotic nodules). On the precontrast CT image of the liver, siderotic RN appears higher in attenuation relative to the liver. On the multiphasic evaluation, RNs are isoattenuating to liver. DNs, similar to RNs, also have a dominant portal venous supply with some arterial feeding. Thus, some DNs may enhance in the earlier late arterial phase of contrast administration but most are isointense to liver. The DNs are also mostly isointense to liver on the excretory phase of contrast administration. This is a helpful distinction from HCC. The DN with foci of HCC appears as a mostly isoattenuating mass with some areas demonstrating early enhancement. DNs and RNs lack a capsule, another helpful distinction from HCC.
The receiver operating characteristics (ROC) analysis is used to evaluate tumor detection. The area under the curve (Az) and sensitivity for the detection of HCC for multidetector row computed tomography (MDCT) have been investigated. For MDCT contrast-enhanced dynamic imaging, the Az ranges from 0.82 to 0.99 and the sensitivity from 77% to 93%.33,34 The sensitivity of tumor detection is best for HCCs larger than 1 cm.
Key Points Computed tomography of hepatocellular carcinoma
• Multiphasic CT study is required for HCC.
• HCC enhances early, is isointense on the PVP, and is hypointense on the delayed phase.
• CT presentation of HCC may be variable and the distinction from DN difficult.
• Cirrhotic liver have nodular contour, enlarged left and caudate lobes, right hepatic notch, and enlarged gallbladder fossa.
Magnetic Resonance Imaging
On T1-weighted images (T1WIs), HCC is usually hypointense to the liver on the in-phase and out-of-phase images (Figure 9-8A) (40% of HCC14). In a fatty liver, the lesion may be isointense to hyperintense to the liver on the out-of-phase sequence. A fat-containing HCC will be hyperintense to the liver on the in-phase images and isointense or hypointense on the out-of-phase images. Lesions with copper, protein, glycogen, or hemorrhage may present as hyperintense to liver on the T1WI (35%).14
On FSE T2WI, HCC is usually hyperintense to liver (see Figure 9-8B).14 In a series of 47 HCCs, 94% of the lesions were hyperintense on T2WI.13 In other series, HCC has been described as variable in signal low or isointense to the liver on T2WI. The well-differentiated HCC may be iso- to hypointense to the liver on the T2WI.14,35 The regenerative nodules and most dysplastic nodules are hypointense to liver.36 The development of HCC from a dysplastic nodule can be detected by foci of high signal on the T2WI in an isointense or hypointense nodule.37
DWI can be used for the qualitative characterization of lesions. The quantitative characterization of HCC includes the calculation of the apparent diffusion coefficient (ADC). The ADC of HCC (1.33 mm2/sec) has been reported to be different from hemangiomas (2.95 mm2/sec) and cysts (3.63 mm2/sec). However, there is an overlap in the ADC values of other malignant masses in the liver and HCC. This area requires further investigation.
The most critical MRI series for the detection of HCC is the dynamic postgadolinium series. This sequence is obtained during a breathhold with a three-dimensional (3D) volume gradient echo sequence. The timing of the arterial phase is critical for the detection of HCC. An improperly timed acquisition may result in lower sensitivity for the detection of HCC. Because the blood supply of HCC is almost exclusively from the hepatic artery, the enhancement pattern is best during the arterial or late arterial supply.38,39
Four different techniques are used in determining the timing of the arterial phase of contrast administration: A set delay with (1) a single or (2) a double arterial phase; (3) a 1- to 2-mL test bolus; or (4) fluoro-triggered imaging. A set delay of 20 seconds, although simple, has the limitation of lacking compensation for differences in cardiac output between patients. A double arterial phase utilizes a set delay time but compensates for cardiac output differences with two sequential series after contrast administration.40 These images are usually acquired with lower matrix (lower resolution) to allow the completion during a single breathhold. The 1- to 2-mL test bolus technique compensates for cardiac output and provides excellent timing. The limitations of this technique are an increased scan time and the concern of image interpretation when the total volume of contrast to be used is less than 10 mL. Fluoro-triggered images utilize a set delay time after the visualization of contrast in the aorta or pulmonary arteries. The delay time has to take into account the timing of the center of k-space acquisition relative to the first echo. In our institution, the center of k-space is acquired at the middle of the scan. We found that a 17-second delay time from the pulmonary arteries to the center of k-space is optimum. Others have reported a delay of 8 to 9 seconds from the visualization of contrast at the level of the abdominal aorta/celiac artery when the center of k-space is obtained at the beginning of the scan.41
Similar to CT, the classic image features for HCC on MRI after the intravenous administration of contrast are hyper-, iso-, and hypointense to liver during the arterial phase, PVP, and excretory phase, respectively (Figure 9-9). The image features are variable. For example, some HCCs are seen only during the excretory phase of contrast administration as a hypointense mass.32,42 Delayed images show late enhancement of the fibrous capsule and hypointensity of the mass relative to liver (see Figure 9-9D).
The ROC analysis of MRI for the detection of HCC has reported sensitivity from 65% to 91% and the Az of 0.68 to 0.97.43,44 The sensitivity of the detection of HCCs larger than 1 cm for MRI has been reported as high as 94%.45 This is reduced to less than 45% for nodules smaller than 1 cm.45
MRI is also useful in characterizing nonmalignant nodules seen in the cirrhotic and noncirrhotic liver. The nonmalignant RNs are commonly small (<1 cm) and contain hemosiderin deposition. These RNs (or siderotic nodules) have low signal on T1WI and T2WI sequences.36 These nodules do not exhibit the dominant arterial enhancement seen on HCC. The premalignant DNs may be hyperintense on the T1WI and iso- or hypointense on the T2WI. This is a distinctive feature from HCC, which is commonly hyperintense on the T2WI. The DNs and RNs are commonly hypovascular on the arterial phase of enhancement.
Hepatocyte-specific agents have been used in the evaluation of HCC. Gd-EOB-(DTPA) (gadolinium ethoxybenzyl diethylenetriamine-penta-acetic acid) and Gd-BOPTA (gadobenate dimeglumine) both show the similar dynamic postgadolinium profile of other gadolinium-based contrast agents (GBCAs) for the arterial phase, PVP, and delayed phase of enhancement. On the hepatocyte phase of contrast administration, most HCCs and some DNs showed hypointensity relative to the liver.10 In some cases, HCC may be isointense to hyperintense to liver in the hepatocyte phase of contrast administration. These cases in which the HCCs demonstrate uptake of the agent, the uptake is regarded to be determined as a function of the expression of OATP1B3 (organic anion transporter 1B3) protein rather than a function of tumor differentiation or bile production.46
Even in the setting of improved preoperative imaging techniques of CT and MRI, the detection rate for tumors less than 1 cm is close to 70%. Unfortunately, over 35% of preoperative diagnosed single HCCs less than 5 cm demonstrated additional lesions in the explanted specimen.47
In larger HCCs, the mosaic pattern of enhancement may be seen on the postcontrast CT and MRI examination of the liver. This pattern is composed of enhancing nodules, low-attenuation areas, and internal septa. The enhancing nodules correspond to the viable tumor, and the low-attenuation areas are a combination of necrosis, fibrosis, and hemorrhage.48 MRI evaluation of large tumors with the mosaic pattern demonstrates variable T1WI and T2WI signal with heterogeneous nodular enhancement pattern.
Arterial Enhancing Nodule
In the cirrhotic and noncirrhotic liver, the detection of arterial enhancing nodules (AENs) can be problematic. An AEN is defined as a nodule seen only during a single phase of contrast administration, the late arterial phase. These nodules are not detected on the T1, T2, or other phases of contrast administration. The differential diagnosis for AEN includes HCC but also many other benign lesions such as focal nodular hyperplasia (FNH), adenoma, perfusion abnormalities, vascular malformation, dysplastic nodules, and others. In multiple series, a follow-up of these lesions concluded that they were likely to be benign even in the setting of cirrhosis and that follow-up evaluation or MRI evaluation was recommended.49–51 Hepatocyte contrast agents may demonstrate low signal intensity on the hepatocyte phase of contrast administration that may suggest HCC.
Key Points Imaging of arterial enhancing nodule of hepatocellular carcinoma
• AENs are likely benign lesions.
• Hyperintense signal on T2WI, wash-out on delayed images, and capsule suggest HCC.
• MRI is recommended for characterization.
[/not-level-membership-for-hematology-oncology-and-palliative-medicine-category]
