[level-membership-for-basic-science-category]
Laboratory Methods and Strategies for Antimicrobial Susceptibility Testing
1. List the relevant factors considered for control and standardization of antimicrobial susceptibility testing.
2. Describe testing conditions (medium, inoculum size, incubation conditions, incubation duration, controls, and purpose) for the broth dilution, agar dilution, and disk diffusion methods.
3. Define a McFarland standard and explain how it is used to standardize susceptibility testing.
4. Explain how end points are determined for the broth dilution, agar dilution, and disk diffusion methods.
5. Define the minimal inhibitory concentration (MIC) break point and identify the types of testing used to determine an MIC.
6. Define peak and trough levels and describe the clinical application for the data associated with each level.
7. Define the susceptible, intermediate, and resistant interpretive categories of antimicrobial susceptibility testing.
8. Outline the basic principles for agar screens, disk screens, and the “D” test for antimicrobial resistance detection, including method, application, and clinical utility.
9. Explain the principle and purpose of the chromogenic cephalosporinase test.
10. Compare and contrast molecular methods to detect resistance mechanisms versus traditional susceptibility testing, including clinical utility, effectiveness, and specificity.
11. Restate the principle of the minimal bactericidal concentration, time-kill assay, serum bactericidal test, and synergy test.
12. Define synergy and indifferent and antagonistic interactions in drug combinations.
13. Define and describe the purpose of drug susceptibility testing as it relates to the use of predictor drugs and organismal identification.
14. List the criteria for determining when to perform susceptibility testing.
15. Describe the purpose of reviewing susceptibility profiles and provide examples of profiles requiring further evaluation.
As discussed in Chapter 11, most clinically relevant bacteria are capable of acquiring and expressing resistance to antimicrobial agents commonly used to treat infections. Therefore, once an organism is isolated in the laboratory, characterization frequently includes tests to detect antimicrobial resistance. In addition to identifying the organism, the antimicrobial susceptibility profile often is a key component of the clinical laboratory report produced for the physician. The procedures used to produce antimicrobial susceptibility profiles and detect resistance to therapeutic agents are referred to as antimicrobial susceptibility testing (AST) methods. The methods applied for profiling aerobic and facultative anaerobic bacteria are the focus of this chapter; strategies for when and how these methods should be applied are also considered. Procedures for antimicrobial susceptibility testing of clinical isolates of anaerobic bacteria and mycobacteria are discussed in Chapters 41 and 43, respectively.
Goal and Limitations
Standardization
For laboratory tests to accurately determine organism-based resistances, the potential influence of environmental factors on antibiotic activity should be minimized (see Chapter 11). This is not to suggest that environmental resistance does not play a clinically relevant role; however, the major focus of the in vitro tests is to measure an organism’s expression of resistance. To control the impact of environmental factors, the conditions for susceptibility testing are extensively standardized. Standardization serves three important purposes:
• It optimizes bacterial growth conditions so that inhibition of growth can be attributed to the antimicrobial agent against which the organism is being tested and is not the result of limitations of nutrient, temperature, or other environmental conditions that may hinder the organism’s growth.
• It optimizes conditions for maintaining antimicrobial integrity and activity; thus, failure to inhibit bacterial growth can be attributed to organism-associated resistance mechanisms rather than to environmental drug inactivation.
• It maintains reproducibility and consistency in the resistance profile of an organism, regardless of the microbiology laboratory performing the test.
Standard conditions for antimicrobial susceptibility testing methods have been established based on numerous laboratory investigations. The procedures, guidelines, and recommendations are published in documents from the Subcommittee on Antimicrobial Susceptibility Testing of the Clinical and Laboratory Standards Institute (CLSI). The CLSI documents that describe various methods of antimicrobial susceptibility testing are continuously updated and may be obtained by contacting CLSI, 940 W. Valley Road, Suite 1400, Wayne, Pennsylvania, 19087. http://www.clsi.org
The standardized components of antimicrobial susceptibility testing include:
Limitations of Standardization
Testing Methods
Principles
Three general methods are available to detect and evaluate antimicrobial susceptibility:
• Methods that directly measure the activity of one or more antimicrobial agents against a bacterial isolate
• Methods that directly detect the presence of a specific resistance mechanism in a bacterial isolate
• Special methods that measure complex antimicrobial-organism interactions
Methods That Directly Measure Antimicrobial Activity
• Conventional susceptibility testing methods such as broth dilution, agar dilution, and disk diffusion
Conventional Testing Methods: General Considerations
Inoculum Preparation.
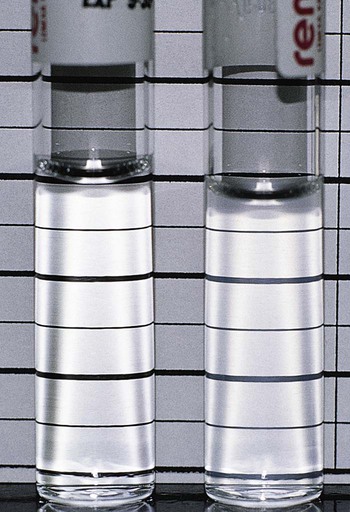
Use of a standard inoculum size is as important as culture purity and is accomplished by comparing the turbidity of the organism suspension with a turbidity standard. McFarland turbidity standards, prepared by mixing 1% sulfuric acid and 1.175% barium chloride to obtain a solution with a specific optical density, are commonly used. The 0.5 McFarland standard, which is commercially available, provides an optical density comparable to the density of a bacterial suspension of 1.5 × 10⁸ colony forming units (CFU) per milliliter. Pure cultures are grown or are prepared directly from agar plates to match the turbidity of the 0.5 McFarland standard (Figure 12-1). The newly inoculated bacterial suspension and the McFarland standard are compared by examining turbidity against a dark background. Alternatively, any one of various commercially available instruments capable of measuring turbidity may be used to standardize the inoculum. If the bacterial suspension does not match the standard’s turbidity, the suspension may be further diluted or supplemented with more organisms as needed.
Selection of Antimicrobial Agents for Testing.
The antimicrobial agents chosen for testing against a particular bacterial isolate are referred to as the antimicrobial battery or panel. A laboratory may use different testing batteries, but the content and application of each battery are based on specific criteria. Although the criteria listed in Box 12-1 influence the selection of the panel’s content, the final decision should not be made by the laboratory independently; input from the medical staff (particularly infectious diseases specialists) and the pharmacy is imperative.
Testing profiles are considered for each of the common organism groupings:
Conventional Testing Methods: Broth Dilution
Procedures.
The key features of broth dilution testing procedures are shown in Table 12-1. Because changes are made in these procedural recommendations, the CLSI M07 series, “Methods for Dilution Antimicrobial Susceptibility Tests for Bacteria that Grow Aerobically,” should be consulted annually.
TABLE 12-1
Summary of Broth Dilution Susceptibility Testing Conditions
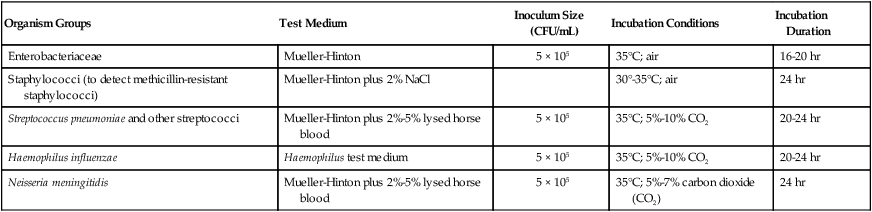
| Organism Groups | Test Medium | Inoculum Size (CFU/mL) | Incubation Conditions | Incubation Duration |
| Enterobacteriaceae | Mueller-Hinton | 5 × 10⁵ | 35°C; air | 16-20 hr |
| Staphylococci (to detect methicillin-resistant staphylococci) | Mueller-Hinton plus 2% NaCl | 30°-35°C; air | 24 hr | |
| Streptococcus pneumoniae and other streptococci | Mueller-Hinton plus 2%-5% lysed horse blood | 5 × 10⁵ | 35°C; 5%-10% CO2 | 20-24 hr |
| Haemophilus influenzae | Haemophilus test medium | 5 × 10⁵ | 35°C; 5%-10% CO2 | 20-24 hr |
| Neisseria meningitidis | Mueller-Hinton plus 2%-5% lysed horse blood | 5 × 10⁵ | 35°C; 5%-7% carbon dioxide (CO2) | 24 hr |
Medium and Antimicrobial Agents.
With in vitro susceptibility testing methods, certain conditions must be altered when examining fastidious organisms to optimize growth and facilitate expression of bacterial resistance. For example, the Mueller-Hinton preparation is the standard medium used for most broth dilution testing, and conditions in the medium (e.g., pH, cation concentration, thymidine content) are well controlled by commercial manufacturers. However, media supplements or different media are required to obtain good growth and reliable susceptibility profiles for bacteria such as S. pneumoniae and H. influenzae. Although staphylococci are not considered fastidious organisms, media supplemented with sodium chloride (NaCl) enhance the expression and detection of methicillin-resistant isolates (see Table 12-1).
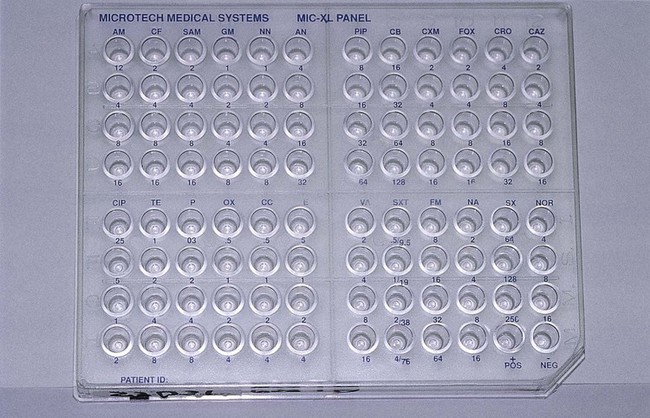
Broth dilution testing is divided into two general categories: microdilution and macrodilution. The principle of each test is the same; the only difference is the volume of broth in which the test is performed. For microdilution testing, the total broth volume is 0.05 to 0.1 mL; for macrodilution testing, the broth volumes are usually 1 mL or greater. Because most susceptibility test batteries require testing of several antibiotics at several different concentrations, the smaller volume used in microdilution allows this to be conveniently accomplished in a single microtiter tray (Figure 12-2).
Inoculation and Incubation.
Standardized bacterial suspensions that match the turbidity of the 0.5 McFarland standard (i.e., 1.5 × 10⁸ CFU/mL) usually serve as the starting point for dilutions ultimately achieving the required final standard bacterial concentration of 5 × 10⁵ CFU/mL in each microtiter well. It is essential to prepare the standard inoculum from a fresh, overnight, pure culture of the test organism. Inoculation of the microdilution panel is accomplished using manual or automated multiprong inoculators calibrated to deliver the precise volume of inoculum to each well in the panel simultaneously (see Figure 12-2).
Inoculated trays are incubated under optimal environmental conditions to optimize bacterial growth without interfering with the antimicrobial activity (i.e., avoiding environmentally mediated results). For the most commonly tested bacteria (e.g., Enterobacteriaceae, P. aeruginosa, staphylococci, and enterococci), the environmental condition consists of room air at 35°C (see Table 12-1). Fastidious bacteria, such as H. influenzae, require incubation in 5% to 10% carbon dioxide (CO2). Similarly, incubation durations for some organisms may need to be extended beyond the usual 16 to 20 hours (see Table 12-1). However, prolonged incubation times beyond recommended limits should be avoided, because antimicrobial deterioration may result in false or elevated resistance patterns. This is a primary factor that limits the ability to perform accurate testing with some slow-growing bacteria.
Reading and Interpretation of Results.
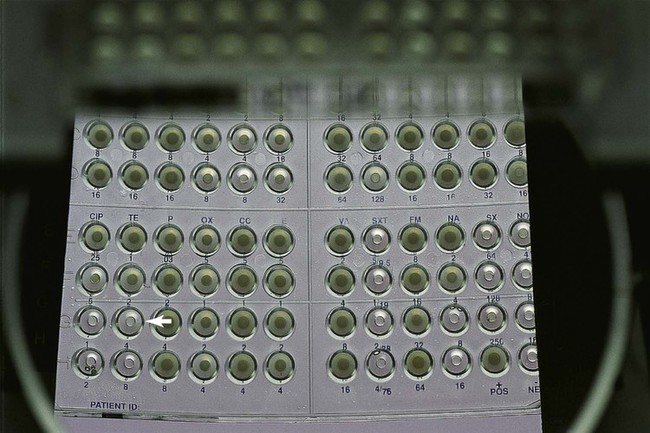
After incubation, the microdilution trays are examined for bacterial growth. Each tray should include a growth control that does not contain antimicrobial agent and a sterility control that was not inoculated. Once growth in the growth control and no growth in the sterility control wells have been confirmed, the growth profiles for each antimicrobial dilution can be established and the MIC determined. The detection of growth in microdilution wells is often augmented through the use of light boxes and reflecting mirrors. When a panel is placed in these devices, bacterial growth, manifested as light to heavy turbidity or a button of growth on the well bottom, is more reliably visualized (Figure 12-3).
When the dilution series for each antibiotic is inspected, the microdilution well containing the lowest drug concentration that completely inhibits visible bacterial growth is recorded as the MIC. Once the MICs for the antimicrobials in the test battery for an organism have been recorded, they are usually translated into one of the interpretive categories, specifically susceptible, intermediate, or resistant (Box 12-2). The interpretive criteria for these categories are based on extensive studies that correlate the MIC with serum-achievable levels for each antimicrobial agent, particular resistance mechanisms, and successful therapeutic outcomes. The interpretive criteria for an array of antimicrobial agents are published in the CLSI M07 series document, “Methods for Dilution Antimicrobial Susceptibility Tests for Bacteria that Grow Aerobically (M100 supplements).” For example, using these standards, an isolate of P. aeruginosa with an imipenem MIC of less than or equal to 4 µg/mL would be classified as susceptible; one with an MIC of 8 µg/mL would be classified as intermediate; and one with an MIC of 16 µg/mL or greater would be classified as resistant to imipenem.
Conventional Testing Methods: Agar Dilution
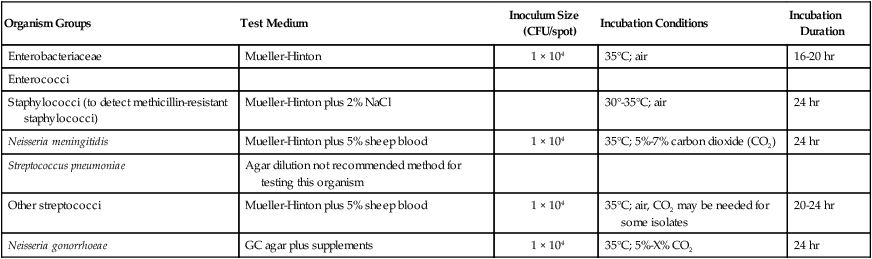
With agar dilution the antimicrobial concentrations and organisms to be tested are brought together on an agar-based medium rather than in liquid broth. Each doubling dilution of an antimicrobial agent is incorporated into a single agar plate; therefore, testing of a series of six dilutions of one drug requires the use of six plates, plus one positive growth control plate without antibiotic. The standard conditions and media for agar dilution testing are shown in Table 12-2. The surface of each plate is inoculated with 1 × 10⁴ CFU (Figure 12-4). This method allows examination of one or more bacterial isolates per plate. After incubation the plates are examined for growth; the MIC is the lowest concentration of an antimicrobial agent in agar that completely inhibits visible growth. The same MIC breakpoints and interpretive categories used for broth dilution are applied for interpretation of agar dilution methods. Similarly, test results may be reported as the MICs only, the category only, or both.
TABLE 12-2
Summary of Agar Dilution Susceptibility Testing Conditions
| Organism Groups | Test Medium | Inoculum Size (CFU/spot) | Incubation Conditions | Incubation Duration |
| Enterobacteriaceae | Mueller-Hinton | 1 × 10⁴ | 35°C; air | 16-20 hr |
| Enterococci | ||||
| Staphylococci (to detect methicillin-resistant staphylococci) | Mueller-Hinton plus 2% NaCl | 30°-35°C; air | 24 hr | |
| Neisseria meningitidis | Mueller-Hinton plus 5% sheep blood | 1 × 10⁴ | 35°C; 5%-7% carbon dioxide (CO2) | 24 hr |
| Streptococcus pneumoniae | Agar dilution not recommended method for testing this organism | |||
| Other streptococci | Mueller-Hinton plus 5% sheep blood | 1 × 10⁴ | 35°C; air, CO2 may be needed for some isolates | 20-24 hr |
| Neisseria gonorrhoeae | GC agar plus supplements | 1 × 10⁴ | 35°C; 5%-X% CO2 | 24 hr |

Conventional Testing Methods: Disk Diffusion
As more antimicrobial agents were created to treat bacterial infections, the limitations of the macrobroth dilution method became apparent. Before microdilution technology became widely available, it became clear that a more practical and convenient method of testing multiple antimicrobial agents against bacterial strains was needed. Out of this need the disk diffusion test was developed, emerging from the landmark study by Bauer et al.1 in 1966. These investigators standardized and correlated the use of antibiotic-impregnated filter paper disks (i.e., antibiotic disks) with MICs using many bacterial strains. With the disk diffusion susceptibility test, antimicrobial resistance is detected by challenging bacterial isolates with antibiotic disks placed on the surface of an agar plate that has been seeded with a lawn of bacteria (Figure 12-5).
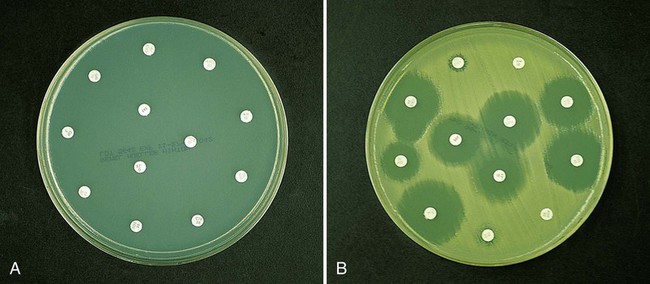
When disks containing a known concentration of antimicrobial agent are placed on the surface of a freshly inoculated plate, the agent immediately begins to diffuse into the agar and establish a concentration gradient around the paper disk. The highest concentration is closest to the disk. Upon incubation, the bacteria grow on the surface of the plate except where the antibiotic concentration in the gradient around each disk is sufficiently high to inhibit growth. After incubation, the diameter of the zone of inhibition around each disk is measured in millimeters (see Figure 12-5).
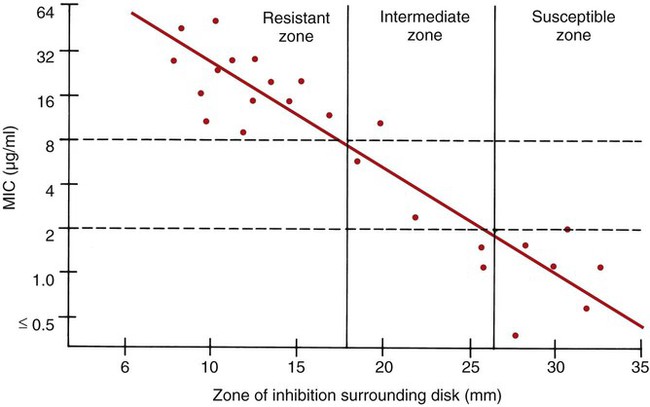
To establish reference inhibitory zone–size breakpoints to define the susceptible, intermediate, and resistant categories for each antimicrobial agent/bacterial species combination, hundreds of strains are tested. The inhibition zone sizes obtained are then correlated with MICs obtained by broth or agar dilution, and a regression analysis is completed comparing the zone size in millimeters against the MIC (Figure 12-6). As the MICs of the bacterial strains tested increase (i.e., the more resistant bacterial strains), the corresponding inhibition zone sizes (i.e., diameters) decrease. Using Figure 12-6 to illustrate, horizontal lines are drawn from the MIC resistant breakpoint and the susceptible MIC breakpoint, 8 µg/mL and 2 µg/mL, respectively. Where the horizontal lines intersect the regression line, vertical lines are drawn to delineate the corresponding inhibitory zone size breakpoints (in millimeters). Using this approach, zone size interpretive criteria have been established for most of the commonly tested antimicrobial agents and are published in the CLSI M02 series, “Performance Standards for Antimicrobial Disk Susceptibility Tests.”
Procedures.
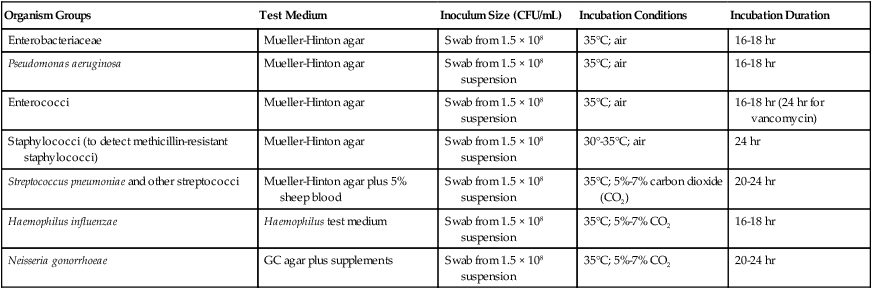
The key features of disk diffusion testing procedures are summarized in Table 12-3, with more details and updates available through CLSI.
TABLE 12-3
Summary of Disk Diffusion Susceptibility Testing Conditions
| Organism Groups | Test Medium | Inoculum Size (CFU/mL) | Incubation Conditions | Incubation Duration |
| Enterobacteriaceae | Mueller-Hinton agar | Swab from 1.5 × 10⁸ | 35°C; air | 16-18 hr |
| Pseudomonas aeruginosa | Mueller-Hinton agar | Swab from 1.5 × 10⁸ suspension | 35°C; air | 16-18 hr |
| Enterococci | Mueller-Hinton agar | Swab from 1.5 × 10⁸ suspension | 35°C; air | 16-18 hr (24 hr for vancomycin) |
| Staphylococci (to detect methicillin-resistant staphylococci) | Mueller-Hinton agar | Swab from 1.5 × 10⁸ suspension | 30°-35°C; air | 24 hr |
| Streptococcus pneumoniae and other streptococci | Mueller-Hinton agar plus 5% sheep blood | Swab from 1.5 × 10⁸ suspension | 35°C; 5%-7% carbon dioxide (CO2) | 20-24 hr |
| Haemophilus influenzae | Haemophilus test medium | Swab from 1.5 × 10⁸ suspension | 35°C; 5%-7% CO2 | 16-18 hr |
| Neisseria gonorrhoeae | GC agar plus supplements | Swab from 1.5 × 10⁸ suspension | 35°C; 5%-7% CO2 | 20-24 hr |
Medium and Antimicrobial Agents.
To ensure equal diffusion of the drug into the agar, the disks must be placed flat on the surface and be firmly applied to ensure adhesion. This is most easily accomplished by using any one of several disk dispensers that are available through commercial disk manufacturers. With these dispensers, all disks in the test battery are simultaneously delivered to the inoculated agar surface and are adequately spaced to minimize the chances for inhibition zone overlap and significant interactions between antimicrobials. In most instances, a maximum of 12 antibiotic disks may be applied to the surface of a single 150-mm Mueller-Hinton agar plate (see Figure 12-5).
Inoculation and Incubation.
Most organisms are incubated at 35°C in room air, but increased CO2 is used for testing of specific fastidious bacteria (see Table 12-3). Similarly, the incubation time may be increased beyond 16 hours to enhance detection of certain resistance patterns (e.g., methicillin resistance in staphylococci and vancomycin resistance in enterococci) and to ensure accurate results in general for fastidious organisms such as N. gonorrhoeae.
Reading and Interpretation of Results.
Before results with individual antimicrobial agent disks are read, the plate is examined to confirm that a confluent lawn of growth has been obtained (see Figure 12-5). If growth between inhibitory zones around each disk is poor and nonconfluent, the test should not be interpreted and should be repeated. The lack of confluent growth may be due to insufficient inoculum. Alternatively, a particular isolate may have undergone mutation, and growth factors supplied by the standard medium are no longer sufficient to support robust growth. In the latter case, medium supplemented with blood and/or incubation in CO2 may enhance growth. However, caution in interpreting results is required when extraordinary measures are used to obtain good growth and the standard medium recommended for testing a particular type of organism is not used. Plates should also be examined for purity. Mixed cultures are evident through the appearance of different colony morphologies scattered throughout the lawn of bacteria (Figure 12-7). Mixed cultures require purification and repeat testing.
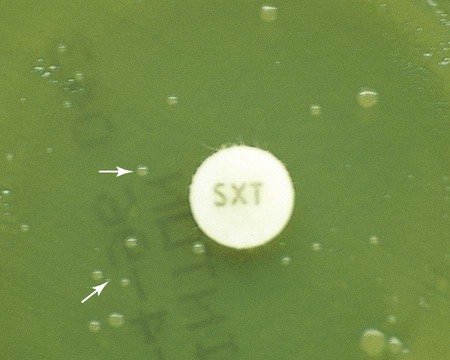
A dark background and reflected light are used to examine a disk diffusion plate (Figure 12-8). The plate is situated so that a ruler or caliper can be used to measure the inhibition zone diameters for each antimicrobial agent. Certain motile organisms, such as Proteus spp., may swarm over the surface of the plate and complicate clear interpretation of the zone boundaries. In these cases, the swarming haze is ignored and zones are measured at the point where growth is obviously inhibited. Similarly, hazes of bacterial growth may be observed when testing sulfonamides and trimethoprim as a result of the organism population going through several doubling generations before inhibition; the resulting haze of growth should be ignored for disk interpretation with these agents.
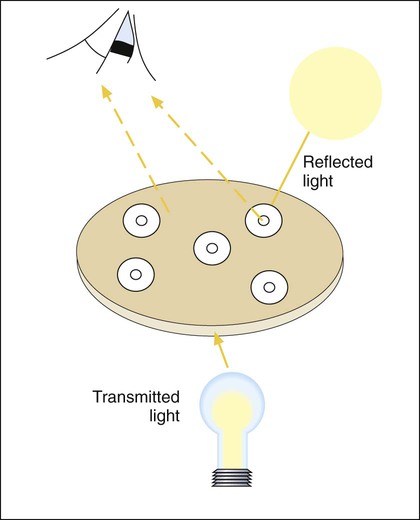
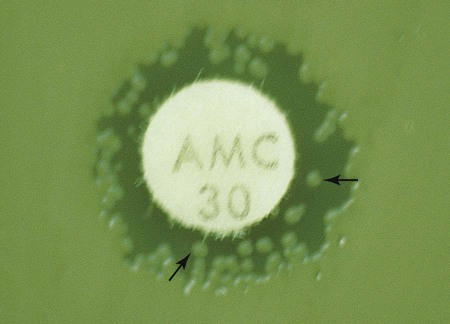
In instances not involving swarming organisms or the testing of sulfonamides and trimethoprim, hazes of growth that occur in more obvious inhibition zones should not be ignored. In many instances, this is the only way clinically relevant resistance patterns are manifested by certain bacterial isolates when tested using the disk diffusion method. Key examples in which this may occur include cephalosporin resistance among several species of Enterobacteriaceae, methicillin resistance in staphylococci, and vancomycin resistance in some enterococci. In fact, the haze produced by some staphylococci and enterococci can best be detected using transmitted rather than reflected light. In these cases, the disk diffusion plates are held in front of the light source when methicillin and vancomycin inhibition zones are read (see Figure 12-8). Still other significant resistances may be subtly evident and appear as individual colonies in an obvious zone of inhibition (Figure 12-9). When such colonies are seen, purity of the test isolate must be confirmed. If purity is confirmed, the individual colonies are variants or resistant mutants of the same species, and the test isolate should be considered resistant.
Once zone sizes have been recorded, interpretive categories are assigned. Interpretive criteria for antimicrobial agent/organism combinations that may be tested by disk diffusion are provided in the CLSI-M2 series, “Performance Standards for Antimicrobial Disk Susceptibility Tests (M100 supplements).” The definitions of susceptible, intermediate, and resistant are the same as those used for dilution methods (see Box 12-2). For example, using the CLSI interpretive standards, an E. coli isolate that produces an ampicillin inhibition zone diameter of 13 mm or less is classified as resistant; if the zone is 14 to 16 mm, the isolate is considered intermediate to ampicillin; if the zone is 17 mm or greater, the organism is categorized as susceptible.
Advantages and Disadvantages.
Two important advantages of the disk diffusion test are convenience and user friendliness. Up to 12 antimicrobial agents can be tested against one bacterial isolate with minimal use of extra materials and devices. Because the results are generally accurate and commonly encountered bacteria are reliably tested, the disk diffusion technique is still among the most frequently used methods for antimicrobial susceptibility testing. The major disadvantages of this method are the lack of interpretive criteria for organisms not included in Table 12-3 and the inability to provide more precise data about the level of an organism’s resistance or susceptibility, as can be obtained using MIC methods.
Commercial Susceptibility Testing Systems
• Format in which bacteria and antimicrobial agents are brought together
• Extent of automation for inoculation, incubation, interpretation, and reporting
• Method used for detection of bacterial growth inhibition
Agar Dilution Derivations.
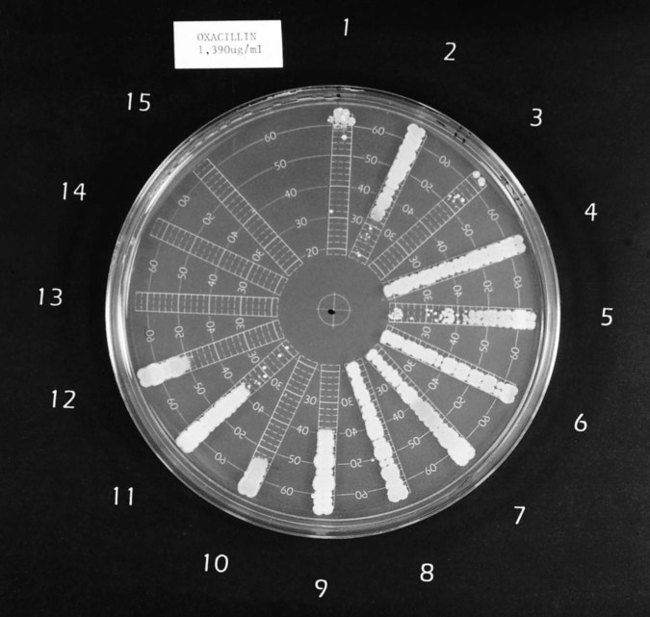
One commercial system (Spiral Biotech Inc., Bethesda, Maryland) uses an instrument to apply antimicrobial agent to the surface of an already prepared agar plate in a concentric spiral fashion. Starting in the center of the plate, the instrument deposits the highest concentration of antibiotic and from that point drug application proceeds to the periphery of the plate. Diffusion of the drug in the agar establishes a concentration gradient from high (center of plate) to low (periphery of plate). Starting at the periphery of the plate, bacterial inocula are applied as a single streak perpendicular to the established gradient in a spoke-wheel fashion. After incubation, the distance is measured between the point where growth is noted at the edge of the plate to the point where growth is inhibited toward the center of the plate (Figure 12-10). This value is used to calculate the MIC for the antimicrobial agent against each of the bacterial isolates on the plate.
Diffusion in Agar Derivations.
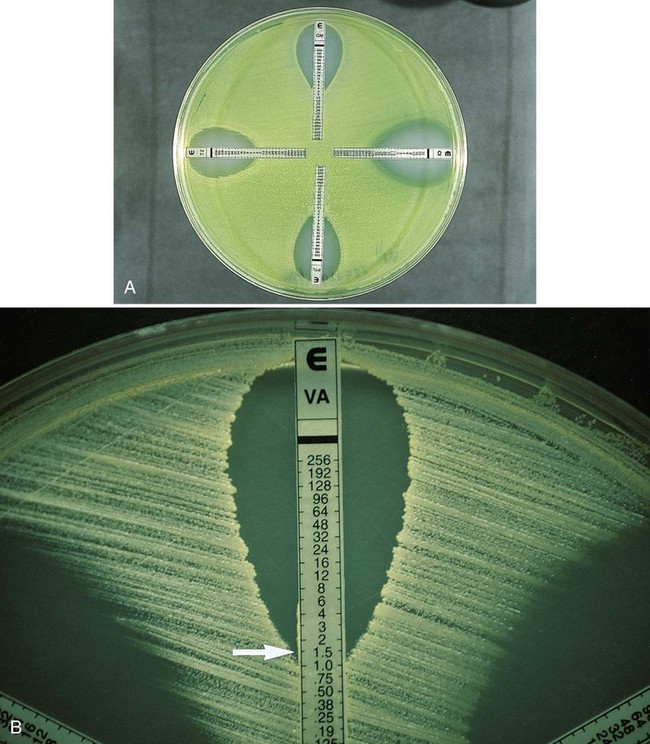
One test has been developed that combines the convenience of disk diffusion with the ability to generate MIC data. The Etest (bioMérieux, Durham, North Carolina) uses plastic strips; one side of the strip contains the antimicrobial agent concentration gradient, and the other contains a numeric scale that indicates the drug concentration (Figure 12-11). Mueller-Hinton plates are inoculated as for disk diffusion, and the strips are placed on the inoculum lawn. Several strips may be placed radially on the same plate so that multiple antimicrobials may be tested against a single isolate. After overnight incubation, the plate is examined and the number present at the point where the border of growth inhibition intersects the E-strip is taken as the MIC (Figure 12-11). The same MIC interpretive criteria used for dilution methods, as provided in CLSI guidelines, are used with the Etest value to assign an interpretive category of susceptible, intermediate, or resistant. This method provides a means of producing MIC data in situations in which the level of resistance can be clinically relevant (e.g., penicillin or cephalosporins against S. pneumoniae).
Automated Antimicrobial Susceptibility Test Systems.
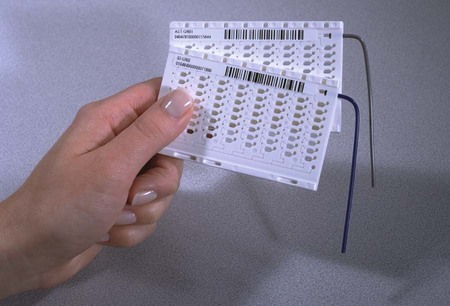
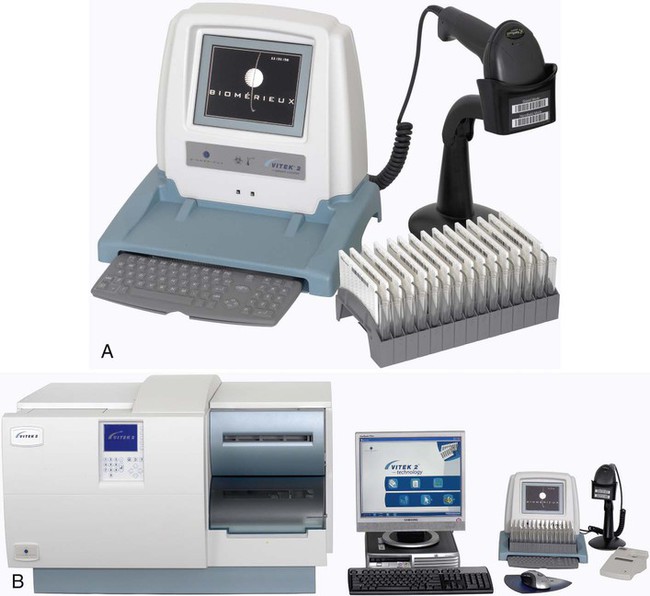
For example, the Vitek 2 AST inoculum is automatically introduced by a filling tube into a miniaturized, plastic, 64-well, closed card containing specified concentrations of antibiotics (Figure 12-12). Cards are incubated in a temperature-controlled compartment. Optical readings are performed every 15 minutes to measure the amount of light transmitted through each well, including a growth control well. Algorithmic analysis of the growth kinetics in each well is performed by the system’s software to derive the MIC data. The MIC results are validated with the Advanced Expert System (AES) software, a category interpretation is assigned, and the organism’s antimicrobial resistance patterns are reported. Resistance detection is enhanced with the sophisticated AES software, which can recognize and report resistance patterns using MICs. In summary, this system facilitates standardized susceptibility testing in a closed environment with validated results and recognition of an organism’s antimicrobial resistance mechanism in 6 to 8 hours for most clinically relevant bacteria (Figure 12-13).
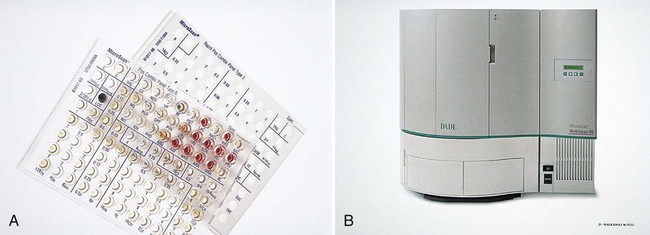
The MicroScan WalkAway system uses the broth microdilution panel format manually inoculated with a multiprong device. Inoculated panels are placed in an incubator-reader unit, where they are incubated for the required time and then the growth patterns are automatically read and interpreted. Depending on the microdilution tray used, bacterial growth may be detected using spectrophotometry or fluorometry (Figure 12-14).
Alternative Approaches for Enhancing Resistance Detection
Supplemental Testing Methods.
Table 12-4 highlights some of the features of supplemental tests that may be used to enhance resistance detection. For certain strains of staphylococci, conventional and commercial systems may have difficulty detecting resistance to oxacillin and the related drugs methicillin and nafcillin. The oxacillin agar screen provides a backup test that may be used when other methods provide equivocal or uncertain profiles. Growth on the screen correlates highly with the presence of oxacillin (or methicillin) resistance, and no growth is strong evidence that an isolate is susceptible. This is an important determination; strains that are classified as resistant are considered resistant to all other currently available beta-lactam antibiotics, indicating the need for therapy to include the use of vancomycin. The agar screen plates can be made in-house, and are available commercially (e.g., Remel, Lenexa, Kansas; BBL, Cockeysville, Maryland). Additionally, other commercial tests designed to detect oxacillin resistance more rapidly (i.e., 4 hours) have been developed and may provide another approach to supplemental testing (e.g., Crystal MRSA ID System, BBL, Cockeysville, Maryland). In addition to the agar screen, 30-µg cefoxitin disks have been developed for disk diffusion to improve the detection of oxacillin-resistant staphylococci (CLSI M100-22). According to this method, cefoxitin inhibitory zones less than or equal to 24 mm indicate oxacillin resistance in staphylococci. The cefoxitin disk test is especially helpful in detecting oxacillin resistance in coagulase-negative staphylococci.
TABLE 12-4
Supplemental Methods for Detection of Antimicrobial Resistance
| Test | Purpose | Conditions | Interpretation |
| Oxacillin agar screen | Detection of staphylococcal resistance to penicillinase- resistant penicillins (e.g., oxacillin, methicillin, or nafcillin) | Medium: Mueller-Hinton agar plus 6 µg oxacillin/mL plus 4% NaCl Inoculum: Swab or spot from 1.5 × 10⁸ standard suspension Incubation: 30°-35°C 24 hr, up to 48 hr for non–Staphylococcus aureus |
Growth = Resistance No growth = Susceptible |
| Vancomycin agar screen | Detection of enterococcal resistance to vancomycin | Medium: Brain-heart infusion agar plus 6 µg vancomycin/mL Inoculum: Spot of 105-106 CFU Incubation: 35°C, 24 hr |
Growth = Resistance No growth = Susceptible |
| Aminoglycoside screens | Detection of acquired enterococcal high-level resistance to aminoglycosides that would compromise synergy with a cell wall–active agent (e.g., ampicillin or vancomycin) | Medium: Brain-heart infusion broth: 500 µg/mL gentamicin; 1000 µg/mL streptomycin Agar: 500 µg/mL gentamicin; 2000 µg/mL streptomycin Inoculum: Broth; 5 × 10⁵ CFU/mL agar; 106 CFU/spot Incubation: 35°C, 24 hr; 48 hr for streptomycin, only if no growth at 24 hr |
Growth = Resistance No growth = Susceptible |
| Oxacillin disk screen | Detection of Streptococcus pneumoniae resistance to penicillin | Medium: Mueller-Hinton agar plus 5% sheep blood plus 1 µg oxacillin disk Inoculum: as for disk diffusion Incubation: 5%-7% CO2 35° C; 20-24 hr | Inhibition zone ≤20 mm: penicillin susceptible Inhibition zone <20 mm: penicillin resistant, intermediate, or susceptible; further testing by MIC method is needed |
| D test | Differentiate clindamycin resistance among S. aureus resulting from efflux (msrA gene or MLSB resistance) | Approximation of clindamycin and erythromycin disk to look for blunting of clindamycin zone | Blunting of clindamycin zone to give “D” pattern, indicating inducible clindamycin resistance |
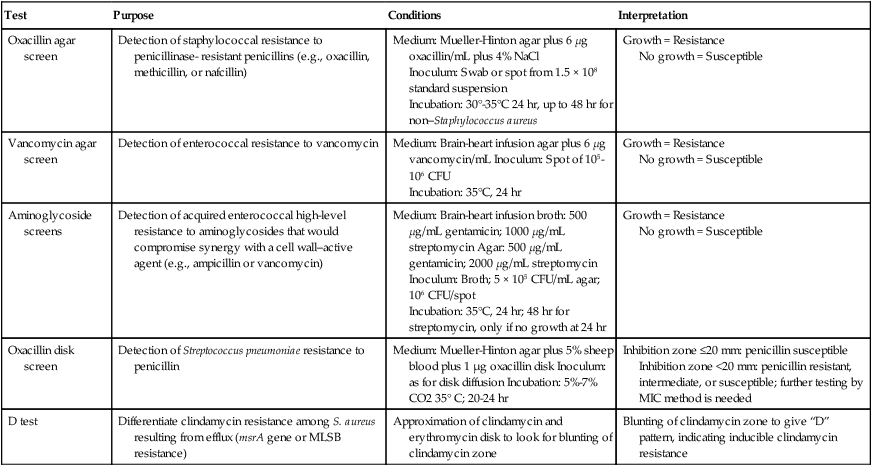
CFU, Colony forming units; MIC, minimum inhibitory concentration; MLSB, macrolide-lincosamide-streptogramin-B.
Similarly, reduced staphylococcal susceptibility to vancomycin (i.e., MICs from 4 to 16 µg/mL) can be difficult to detect by disk diffusion and some commercial methods. Although the therapeutic relevance of staphylococci with vancomycin MICs in this range is currently uncertain, the diminished susceptibility is outside the normal MIC range for susceptible strains; therefore, this phenotype needs to be detected. The agar screen used for this purpose is outlined in Table 12-4 and is essentially the same as that outlined for enterococci, also in Table 12-4. Strains that grow on the screen should be tested by broth microdilution to obtain a definitive MIC value.
Similarly, detection of enterococcal resistance to vancomycin can be difficult by some conventional and commercial methods, and the agar screen may be helpful in confirming the resistance pattern (see Table 12-4). However, as a screen, not all enterococcal isolates capable of growth are resistant to vancomycin at clinically relevant levels. Therefore, strains detected using this method should also be characterized using a broth microdilution method to determine the isolate’s MIC.
Aminoglycosides also play a key role in therapy for serious enterococcal infections, and acquired high-level resistance, which essentially destroys the therapeutic value of these drugs for combination therapy with ampicillin or vancomycin, is not readily detected by conventional methods. Therefore, screens using high concentrations of aminoglycosides (see Table 12-4) have been developed and are available commercially (e.g., Remel, Lenexa, Kansas; or BBL, Cockeysville, Maryland).
With the emergence of penicillin resistance in S. pneumoniae, the penicillin disk diffusion test became insufficiently sensitive to detect subtle but significant changes in susceptibility to penicillin. To address this issue, the oxacillin disk screen described in Table 12-4 is useful but has a notable limitation. Although organisms identified with zones greater than or equal to 20 mm can be accurately characterized as penicillin susceptible, the penicillin susceptibility status of those with zones less than 20 mm remains uncertain, and an MIC value must be determined through an additional test.
With regard to macrolide (e.g., erythromycin, azithromycin, clarithromycin) and lincosamide (e.g., clindamycin) resistance among staphylococci, interpretation of in vitro results can also be complicated by the different underlying mechanisms of resistance that have very different therapeutic implications. Isolates that produce a profile of resistance to a macrolide (e.g., erythromycin) and susceptibility to clindamycin may do so as a result of two different resistance mechanisms. If this profile is the result of the efflux (msrA gene) mechanism, the isolate can be considered susceptible to clindamycin. However, if this profile resulted from the inducible macrolide-lincosamide-streptogramin-B (MLSB) mechanism, which results in an altered ribosomal target, clindamycin-resistant mutants may readily arise during therapy with this agent. Currently such strains should be reported as resistant to clindamycin. The D test that is used to distinguish between these two different resistance mechanisms is outlined in Table 12-4.
Predictor Antimicrobial Agents.
• Staphylococcal resistance to oxacillin is used to determine and report resistance to all currently available beta-lactams, including penicillins, cephalosporins, and carbapenems.
• Enterococcal high-level gentamicin resistance predicts resistance to nearly all other currently available aminoglycosides, including amikacin, tobramycin, netilmicin, and kanamycin.
• Enterococcal resistance to ampicillin predicts resistance to all penicillin derivatives.
Methods That Directly Detect Specific Resistance Mechanisms
Phenotypic Methods
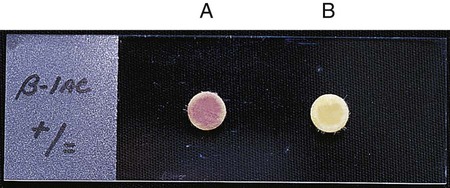
β-Lactamase Detection.
β-lactamases play a key role in bacterial resistance to beta-lactam agents, and detection of their presence can provide useful information (see Chapter 11). Various assays are available to detect β-lactamases, but the most useful in clinical laboratories is the chromogenic cephalosporinase test. β-lactamases exert their effect by opening the β-lactam ring (see Figure 11-9). When a chromogenic cephalosporin is used as the substrate, this process results in a colored product. The Cefinase disk is an example of a commercially available chromogenic test (BD Microbiology Systems, Cockeysville, Maryland). The disk incorporates nitrocefin as the substrate (Figure 12-15).
Genotypic Methods
The genes that encode many of the clinically relevant acquired resistance mechanisms are known, as is all or part of their nucleotide sequences. This has allowed for the development of molecular methods involving nucleic acid hybridization and amplification for the study and detection of antimicrobial resistance (for more information on molecular methods for the characterization of bacteria, see Chapter 8). The ability to definitively determine the presence of a particular gene that encodes antimicrobial resistance has several advantages. However, as with any laboratory procedure, certain disadvantages and limitations also exist.
• Use of probes or oligonucleotides for specific resistance genes. Resistance mediated by divergent genes or totally different mechanisms could be missed (i.e., the absence of one gene may not guarantee antimicrobial susceptibility).
• Phenotypic resistance to a level that is clinically significant for any one antimicrobial agent may be due to a culmination of processes that involve enzymatic modification of the antimicrobial, decreased uptake, altered affinity of the drug’s target, or some combination of these mechanisms (i.e., the presence of one gene does not guarantee resistance).
• The presence of a gene encoding resistance does not provide information about the status of the control genes necessary for expression of resistance; that is, although present, the genes may be silent or nonfunctional, and the organism may be incapable of expressing the resistance encoded by the gene.
• From a clinical laboratory perspective, it may be impractical to adopt molecular methods specific for only a few resistance mechanisms when the vast majority of the susceptibility testing still will be accomplished using phenotypic-based methods. Items to consider before adopting molecular tests may include (but are not limited to) clinical efficacy, space, personnel, and financial management.
Special Methods for Complex Antimicrobial/Organism Interactions
Tests for Activity of Antimicrobial Combinations
• Treating polymicrobial infections caused by organisms with different antimicrobial resistance profiles
• Achieving more rapid bactericidal activity than may be achieved with any single agent
• Achieving bactericidal activity against bacteria for which no single agent is lethal
• Minimizing the emergence of resistant organisms during therapy
• Synergy: the activity of the antimicrobial combination is substantially greater than the activity of the single most active drug alone
• Indifference: the activity of the combination is no better or worse than the single most active drug alone
• Antagonism: the activity of the combination is substantially less than the activity of the single most active drug alone (an interaction to be avoided)
Laboratory Strategies for Antimicrobial Susceptibility Testing
The clinical microbiology laboratory is responsible for maximizing the positive impact that susceptibility testing information can have on the use of antimicrobial agents to treat infectious diseases. However, meeting this responsibility is difficult because of demands for more efficient use of laboratory resources, the increasing complexities of important bacterial resistance profiles, and the continued expectations for high-quality results. To ensure quality in the midst of dwindling resources and expanding antimicrobial resistance, strategies for antimicrobial susceptibility testing must be carefully developed. These strategies should target relevance, accuracy, and communication (Figure 12-16).
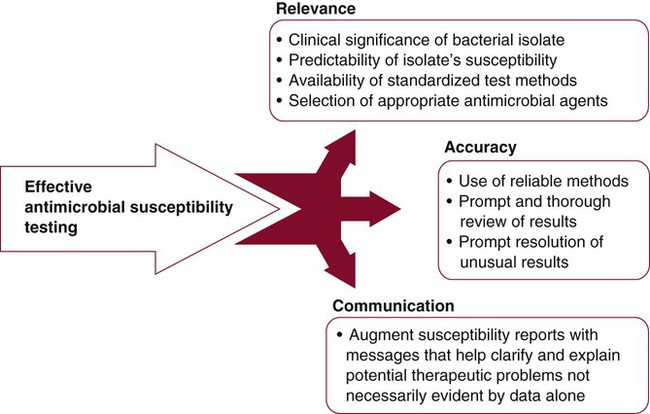
Relevance
When to Perform a Susceptibility Test
• Clinical significance of a bacterial isolate
• Predictability of a bacterial isolate’s susceptibility to the antimicrobial agents most commonly used against them, often referred to as the drugs of choice
• Availability of reliable standardized methods for testing the isolate
Determining Clinical Significance
• Detection and/or the abundance of the organism on direct Gram stain of a patient’s specimen, preferably in the presence of white blood cells, and growth of an organism with the same morphology in culture
• Known ability of the bacterial species isolated to cause infection at the body site from which the specimen was obtained (see Part VII)
• Whether the organism is generally considered either an epithelial or mucosal colonizer or is generally considered a pathogen
• Body site from which the organism was isolated (normally sterile or a typically colonized site)
Predictability of Antimicrobial Susceptibility
If the organisms are clinically significant, what are the chances they could be resistant to the antimicrobial agents commonly used to eradicate them? Unfortunately, the increasing dissemination of resistance among clinically relevant bacteria has diminished the number of bacteria for which antimicrobial susceptibility can be confidently predicted based on identification without the need to perform testing. Table 12-5 categorizes many of the commonly encountered bacteria according to the need to perform testing to detect resistance.
TABLE 12-5
Categorization of Bacteria According to Need for Routine Performance of Antimicrobial Susceptibility Testing*
| Need for Testing | Bacteria |
| Testing commonly required |
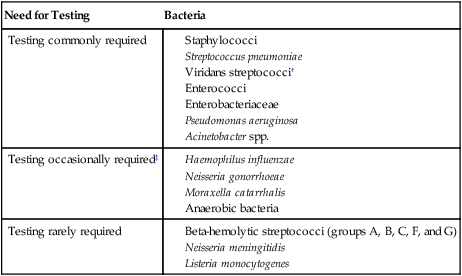
*Based on the assumption that the organism is clinically significant. Table includes bacteria for which standardized testing procedures are available, as outlined and recommended by the Clinical and Laboratory Standards Institute.
†Viridans streptococci require testing when implicated in endocarditis or isolated in pure culture from a normally sterile site with a strong suspicion of being clinically important.
‡Testing required if an antimicrobial to which the organisms are frequently resistant is still considered for use (e.g., penicillin for Neisseria gonorrhoeae).
The recommendations outlined in Table 12-5 are guidelines. In any clinical setting, exceptions will arise that must be considered in consultation with the physician. Also, these guidelines are for providing data used for the management of a single patient’s infection. When susceptibility testing is performed as a means of gathering surveillance data for the monitoring of emerging resistance (see Accuracy and Antimicrobial Resistance Surveillance later in this chapter), the guidelines may not necessarily apply.
Availability of Reliable Susceptibility Testing Methods
If a reliable, standardized method for testing a particular bacterial genus or species does not exist, the ability to produce accurate and meaningful data is substantially compromised. Although standard methods exist for most of the commonly encountered bacteria (see Tables 12-1 to 12-3), clinically relevant isolates of bacterial species for which standard testing methods do not exist are encountered. In these instances, the dilemma stems from the conflict between the laboratory’s urge to contribute in some way by providing data and the lack of confidence in producing interpretable and accurate information.
Many organisms not listed in Table 12-5 grow on the media and under the conditions recommended for testing commonly encountered bacteria. However, the ability to grow and the ability to detect important antimicrobial resistance patterns are not the same thing. For example, the gram-negative bacillus Stenotrophomonas maltophilia grows extremely well under most susceptibility testing conditions, but the results obtained with beta-lactam antibiotics can be widely variable and seriously misleading. This organism produces potent beta-lactamases that seriously compromise the effectiveness of most beta-lactams, yet certain isolates may appear susceptible by standard in vitro testing criteria. Therefore, even though testing may provide an potential answer, the answer may be incorrect.
Selection of Antimicrobial Agents for Testing
Selection of relevant antimicrobial agents is based on the criteria outlined in Box 12-1. These criteria should be carefully considered when antimicrobial agents are selected to avoid cluttering reports with superfluous information, to minimize the risk of confusing physicians, and to substantially decrease the waste of time and resources in the clinical microbiology laboratory.
Antimicrobial agents that may be considered for inclusion in batteries to be tested against certain bacterial groups are provided in Table 12-6. The list is not exhaustive but is useful for illustrating some points about the development of relevant testing batteries. For example, with all the penicillins, cephalosporins, and other beta-lactam antibiotics available for testing, only penicillin and oxacillin need to be tested against staphylococci. The information acquired with these two agents reflects the general effectiveness of any other beta-lactam. In essence, these drugs are predictor agents, as discussed earlier in this chapter. Similarly, ampicillin can be used independently as an indicator of enterococcal susceptibility to various penicillins, and because of intrinsic resistance, cephalosporins should never be tested against these organisms.
TABLE 12-6
Selection of Antimicrobial Agents for Testing Against Common Bacterial Groups*
| Antimicrobial Agents | Enterobacteriaceae | Pseudomonas aeruginosa | Staphylococci | Enterococci | Streptococcus pneumoniae | Viridans Streptococci |
| Penicillins | ||||||
| Penicillin | − | − | + | − | + | + |
| Oxacillin | − | − | + | − | − | − |
| Ampicillin | + | − | − | + | − | − |
| Piperacillin/tazobactam | + | + | − | − | − | − |
| Cephalosporins | ||||||
| Cefazolin | + | − | − | − | − | − |
| Cefotetan | + | − | − | − | − | − |
| Ceftriaxone | + | − | − | − | + | + |
| Cefotaxime | + | − | − | − | + | + |
| Ceftazidime | + | + | − | − | − | − |
| Other Beta-Lactams | ||||||
| Aztreonam | + | + | − | − | − | − |
| Imipenem | + | + | − | − | ± | − |
| Glycopeptides | ||||||
| Vancomycin | − | − | + | + | + | + |
| Aminoglycosides | ||||||
| Gentamicin | + | + | ± | +† | − | − |
| Tobramycin | + | + | − | − | − | − |
| Amikacin | + | + | − | − | − | − |
| Quinolones | ||||||
| Ciprofloxacin | + | + | + | − | + | − |
| Levofloxacin | + | + | + | − | + | + |
| Other Agents | ||||||
| Erythromycin | − | − | + | − | + | + |
| Clindamycin | − | − | + | − | + | + |
| Trimethoprim-sulfamethoxazole | + | − | + | − | + | −, ± |
| Tigecycline | + | − | + | + | ± | + |
| Daptomycin | − | − | + | + | ± | ± |
| Linezolid | − | − | + | + | ± | + |
| Telithromycin | − | − | + | − | + |

+, May be selected for inclusion in testing batteries (not all agents with + need to be selected); ±, may be selected in certain situations; −, selection for testing is not necessary or not recommended.
*Not all available antimicrobial agents are included. Selection recommendation is based on non–urinary tract infections.
†Gentamicin testing against enterococci requires use of high-concentration disks or a special screen (see Table 12-4).
Many scenarios exist in which the spectrum of activity and other criteria listed in Box 12-1 are considered for the sake of designing the most relevant and useful testing batteries. These criteria should be considered in consultation with patients’ physicians and the pharmacy staff.
Accuracy
Susceptibility testing strategies focused on production of accurate results have two key components:
• Use of methods that produce accurate results
• The application of real-time review of results prior to reporting
Review of Results
Components of Results Review Strategies
• Data review—a mechanism for recognizing new or unusual susceptibility profiles
• Resolution—the application of protocols for determining whether an unusual profile is a result of an error (technical or clerical) or accurately reflects the emergence of a new resistance mechanism
Data Review.
Recognition of unusual resistance profiles is primarily accomplished by carefully reviewing the daily laboratory susceptibility data. Examples of unusual susceptibility profiles for gram-positive and gram-negative bacteria are given in Table 12-7. The examples are a mixture of profiles that clearly demonstrate a likely error (i.e., clindamycin-resistant, erythromycin-susceptible staphylococci); profiles that have rarely been encountered but if observed require immediate attention (i.e., vancomycin resistance in staphylococci); and profiles that have been described but may not be common (i.e., imipenem resistance in Enterobacteriaceae).
TABLE 12-7
Examples of Susceptibility Testing Profiles Requiring Further Evaluation
| Organism | Susceptibility Profile |
| Staphylococci | Vancomycin intermediate or resistant Clindamycin resistant; erythromycin susceptible Linezolid resistant Daptomycin resistant |
| Viridans streptococci | Vancomycin intermediate or resistant |
| Streptococcus pneumoniae | Vancomycin intermediate or resistant |
| Beta-hemolytic streptococci | Penicillin intermediate or resistant |
| Enterobacteriaceae | Imipenem resistant |
| Enterobacter/Citrobacter/Serratia/Morganella/Providencia/Klebsiella | Susceptible to ampicillin or cefazolin |
| Enterococci | Vancomycin resistant, high level of aminoglycoside resistance by disk diffusion |
| Pseudomonas aeruginosa | Amikacin resistant; gentamicin or tobramycin susceptible |
| Stenotrophomonas maltophilia | Imipenem susceptible; trimethoprim/sulfamethoxazole resistant |
| Neisseria gonorrhoeae | Ceftriaxone resistant |
| Neisseria meningitidis | Penicillin resistant |
Modified from Courvalin P: Interpretive reading of antimicrobial susceptibility tests, Am Soc Microbiol News 58:368, 1992.
• The identification of the organism must be known. To evaluate the accuracy of a susceptibility profile, identification and susceptibility data must be simultaneously analyzed in a timely fashion. Without knowing the organism’s identification, it is frequently difficult to determine whether the susceptibility profile is unusual.
• Susceptibility results should be analyzed and reported as early in the day as possible. The workflow should allow time for corrective action for errors found during data review so that corrected, or substantiated, results can be provided to physicians as soon as possible.
• Two or more tiers of data review should be used. The first tier is at the bench level, where technologists are simultaneously reading the results and evaluating an organism’s susceptibility profile for appropriateness. When unusual profiles are found, the technologist should be able to initiate troubleshooting protocols (see the next section). To prevent the release of erroneous and potentially dangerous information, results should not be reported at this point. Review at this level, which is greatly facilitated by automated expert review systems, maintains proficiency among technologists in relationship to the nuances of susceptibility profiles and important resistance patterns. The second tier is at the level of supervisory or laboratory director. The purpose of review at this level is to track and monitor the efficiency of the first tier, to take ultimate responsibility for the accuracy of results, to provide constructive and educational feedback to the technologists performing the first-line review, and to provide guidance for resolution of the unusual profiles. Again, a computer-based review process that searches all reports for predefined unusual profiles (similar to those outlined in Table 12-7) can greatly enhance the efficiency and accuracy of the second level of review.
• The review process must be flexible and updated. Because bacterial capabilities for antimicrobial resistance profiles change, laboratory resistance detection systems can become outdated. Therefore, the list of unusual profiles requires periodic review and updating.
Resolution.
• Review data for possible clerical error.
• Determine whether susceptibility panel and identification system were inoculated with same isolate.
• Reexamine test panel or plate for reading error (e.g., misreading of actual zone of inhibition).
• Confirm purity of inoculum and proper inoculum preparation.
• For commercial systems, determine whether manufacturer’s recommended procedures were followed.
• Confirm accuracy of organism identification.
• Confirm resistance by using a second method or screening test.
*2013/Photos: bioMérieux/ BIOMERIEUX, the blue logo, Etest, Testremsa, VITEK are registered trademarks belonging to bioMérieux or one of its subsidiaries or one of its companies.
[/level-membership-for-basic-science-category][not-level-membership-for-basic-science-category]
Laboratory Methods and Strategies for Antimicrobial Susceptibility Testing
1. List the relevant factors considered for control and standardization of antimicrobial susceptibility testing.
2. Describe testing conditions (medium, inoculum size, incubation conditions, incubation duration, controls, and purpose) for the broth dilution, agar dilution, and disk diffusion methods.
3. Define a McFarland standard and explain how it is used to standardize susceptibility testing.
4. Explain how end points are determined for the broth dilution, agar dilution, and disk diffusion methods.
5. Define the minimal inhibitory concentration (MIC) break point and identify the types of testing used to determine an MIC.
6. Define peak and trough levels and describe the clinical application for the data associated with each level.
7. Define the susceptible, intermediate, and resistant interpretive categories of antimicrobial susceptibility testing.
8. Outline the basic principles for agar screens, disk screens, and the “D” test for antimicrobial resistance detection, including method, application, and clinical utility.
9. Explain the principle and purpose of the chromogenic cephalosporinase test.
10. Compare and contrast molecular methods to detect resistance mechanisms versus traditional susceptibility testing, including clinical utility, effectiveness, and specificity.
11. Restate the principle of the minimal bactericidal concentration, time-kill assay, serum bactericidal test, and synergy test.
12. Define synergy and indifferent and antagonistic interactions in drug combinations.
13. Define and describe the purpose of drug susceptibility testing as it relates to the use of predictor drugs and organismal identification.
14. List the criteria for determining when to perform susceptibility testing.
15. Describe the purpose of reviewing susceptibility profiles and provide examples of profiles requiring further evaluation.
As discussed in Chapter 11, most clinically relevant bacteria are capable of acquiring and expressing resistance to antimicrobial agents commonly used to treat infections. Therefore, once an organism is isolated in the laboratory, characterization frequently includes tests to detect antimicrobial resistance. In addition to identifying the organism, the antimicrobial susceptibility profile often is a key component of the clinical laboratory report produced for the physician. The procedures used to produce antimicrobial susceptibility profiles and detect resistance to therapeutic agents are referred to as antimicrobial susceptibility testing (AST) methods. The methods applied for profiling aerobic and facultative anaerobic bacteria are the focus of this chapter; strategies for when and how these methods should be applied are also considered. Procedures for antimicrobial susceptibility testing of clinical isolates of anaerobic bacteria and mycobacteria are discussed in Chapters 41 and 43, respectively.
Goal and Limitations
Standardization
For laboratory tests to accurately determine organism-based resistances, the potential influence of environmental factors on antibiotic activity should be minimized (see Chapter 11). This is not to suggest that environmental resistance does not play a clinically relevant role; however, the major focus of the in vitro tests is to measure an organism’s expression of resistance. To control the impact of environmental factors, the conditions for susceptibility testing are extensively standardized. Standardization serves three important purposes:
• It optimizes bacterial growth conditions so that inhibition of growth can be attributed to the antimicrobial agent against which the organism is being tested and is not the result of limitations of nutrient, temperature, or other environmental conditions that may hinder the organism’s growth.
• It optimizes conditions for maintaining antimicrobial integrity and activity; thus, failure to inhibit bacterial growth can be attributed to organism-associated resistance mechanisms rather than to environmental drug inactivation.
• It maintains reproducibility and consistency in the resistance profile of an organism, regardless of the microbiology laboratory performing the test.
Standard conditions for antimicrobial susceptibility testing methods have been established based on numerous laboratory investigations. The procedures, guidelines, and recommendations are published in documents from the Subcommittee on Antimicrobial Susceptibility Testing of the Clinical and Laboratory Standards Institute (CLSI). The CLSI documents that describe various methods of antimicrobial susceptibility testing are continuously updated and may be obtained by contacting CLSI, 940 W. Valley Road, Suite 1400, Wayne, Pennsylvania, 19087. http://www.clsi.org
The standardized components of antimicrobial susceptibility testing include:
Limitations of Standardization
Testing Methods
Principles
Three general methods are available to detect and evaluate antimicrobial susceptibility:
• Methods that directly measure the activity of one or more antimicrobial agents against a bacterial isolate
• Methods that directly detect the presence of a specific resistance mechanism in a bacterial isolate
• Special methods that measure complex antimicrobial-organism interactions
Methods That Directly Measure Antimicrobial Activity
• Conventional susceptibility testing methods such as broth dilution, agar dilution, and disk diffusion
Conventional Testing Methods: General Considerations
Inoculum Preparation.
Use of a standard inoculum size is as important as culture purity and is accomplished by comparing the turbidity of the organism suspension with a turbidity standard. McFarland turbidity standards, prepared by mixing 1% sulfuric acid and 1.175% barium chloride to obtain a solution with a specific optical density, are commonly used. The 0.5 McFarland standard, which is commercially available, provides an optical density comparable to the density of a bacterial suspension of 1.5 × 10⁸ colony forming units (CFU) per milliliter. Pure cultures are grown or are prepared directly from agar plates to match the turbidity of the 0.5 McFarland standard (Figure 12-1). The newly inoculated bacterial suspension and the McFarland standard are compared by examining turbidity against a dark background. Alternatively, any one of various commercially available instruments capable of measuring turbidity may be used to standardize the inoculum. If the bacterial suspension does not match the standard’s turbidity, the suspension may be further diluted or supplemented with more organisms as needed.
Selection of Antimicrobial Agents for Testing.
The antimicrobial agents chosen for testing against a particular bacterial isolate are referred to as the antimicrobial battery or panel. A laboratory may use different testing batteries, but the content and application of each battery are based on specific criteria. Although the criteria listed in Box 12-1 influence the selection of the panel’s content, the final decision should not be made by the laboratory independently; input from the medical staff (particularly infectious diseases specialists) and the pharmacy is imperative.
Testing profiles are considered for each of the common organism groupings:
Conventional Testing Methods: Broth Dilution
Procedures.
The key features of broth dilution testing procedures are shown in Table 12-1. Because changes are made in these procedural recommendations, the CLSI M07 series, “Methods for Dilution Antimicrobial Susceptibility Tests for Bacteria that Grow Aerobically,” should be consulted annually.
TABLE 12-1
Summary of Broth Dilution Susceptibility Testing Conditions
| Organism Groups | Test Medium | Inoculum Size (CFU/mL) | Incubation Conditions | Incubation Duration |
| Enterobacteriaceae | Mueller-Hinton | 5 × 10⁵ | 35°C; air | 16-20 hr |
| Staphylococci (to detect methicillin-resistant staphylococci) | Mueller-Hinton plus 2% NaCl | 30°-35°C; air | 24 hr | |
| Streptococcus pneumoniae and other streptococci | Mueller-Hinton plus 2%-5% lysed horse blood | 5 × 10⁵ | 35°C; 5%-10% CO2 | 20-24 hr |
| Haemophilus influenzae | Haemophilus test medium | 5 × 10⁵ | 35°C; 5%-10% CO2 | 20-24 hr |
| Neisseria meningitidis | Mueller-Hinton plus 2%-5% lysed horse blood | 5 × 10⁵ | 35°C; 5%-7% carbon dioxide (CO2) | 24 hr |
Medium and Antimicrobial Agents.
With in vitro susceptibility testing methods, certain conditions must be altered when examining fastidious organisms to optimize growth and facilitate expression of bacterial resistance. For example, the Mueller-Hinton preparation is the standard medium used for most broth dilution testing, and conditions in the medium (e.g., pH, cation concentration, thymidine content) are well controlled by commercial manufacturers. However, media supplements or different media are required to obtain good growth and reliable susceptibility profiles for bacteria such as S. pneumoniae and H. influenzae. Although staphylococci are not considered fastidious organisms, media supplemented with sodium chloride (NaCl) enhance the expression and detection of methicillin-resistant isolates (see Table 12-1).
Broth dilution testing is divided into two general categories: microdilution and macrodilution. The principle of each test is the same; the only difference is the volume of broth in which the test is performed. For microdilution testing, the total broth volume is 0.05 to 0.1 mL; for macrodilution testing, the broth volumes are usually 1 mL or greater. Because most susceptibility test batteries require testing of several antibiotics at several different concentrations, the smaller volume used in microdilution allows this to be conveniently accomplished in a single microtiter tray (Figure 12-2).
Inoculation and Incubation.
Standardized bacterial suspensions that match the turbidity of the 0.5 McFarland standard (i.e., 1.5 × 10⁸ CFU/mL) usually serve as the starting point for dilutions ultimately achieving the required final standard bacterial concentration of 5 × 10⁵ CFU/mL in each microtiter well. It is essential to prepare the standard inoculum from a fresh, overnight, pure culture of the test organism. Inoculation of the microdilution panel is accomplished using manual or automated multiprong inoculators calibrated to deliver the precise volume of inoculum to each well in the panel simultaneously (see Figure 12-2).
Inoculated trays are incubated under optimal environmental conditions to optimize bacterial growth without interfering with the antimicrobial activity (i.e., avoiding environmentally mediated results). For the most commonly tested bacteria (e.g., Enterobacteriaceae, P. aeruginosa, staphylococci, and enterococci), the environmental condition consists of room air at 35°C (see Table 12-1). Fastidious bacteria, such as H. influenzae, require incubation in 5% to 10% carbon dioxide (CO2). Similarly, incubation durations for some organisms may need to be extended beyond the usual 16 to 20 hours (see Table 12-1). However, prolonged incubation times beyond recommended limits should be avoided, because antimicrobial deterioration may result in false or elevated resistance patterns. This is a primary factor that limits the ability to perform accurate testing with some slow-growing bacteria.
Reading and Interpretation of Results.
After incubation, the microdilution trays are examined for bacterial growth. Each tray should include a growth control that does not contain antimicrobial agent and a sterility control that was not inoculated. Once growth in the growth control and no growth in the sterility control wells have been confirmed, the growth profiles for each antimicrobial dilution can be established and the MIC determined. The detection of growth in microdilution wells is often augmented through the use of light boxes and reflecting mirrors. When a panel is placed in these devices, bacterial growth, manifested as light to heavy turbidity or a button of growth on the well bottom, is more reliably visualized (Figure 12-3).
When the dilution series for each antibiotic is inspected, the microdilution well containing the lowest drug concentration that completely inhibits visible bacterial growth is recorded as the MIC. Once the MICs for the antimicrobials in the test battery for an organism have been recorded, they are usually translated into one of the interpretive categories, specifically susceptible, intermediate, or resistant (Box 12-2). The interpretive criteria for these categories are based on extensive studies that correlate the MIC with serum-achievable levels for each antimicrobial agent, particular resistance mechanisms, and successful therapeutic outcomes. The interpretive criteria for an array of antimicrobial agents are published in the CLSI M07 series document, “Methods for Dilution Antimicrobial Susceptibility Tests for Bacteria that Grow Aerobically (M100 supplements).” For example, using these standards, an isolate of P. aeruginosa with an imipenem MIC of less than or equal to 4 µg/mL would be classified as susceptible; one with an MIC of 8 µg/mL would be classified as intermediate; and one with an MIC of 16 µg/mL or greater would be classified as resistant to imipenem.
Conventional Testing Methods: Agar Dilution
With agar dilution the antimicrobial concentrations and organisms to be tested are brought together on an agar-based medium rather than in liquid broth. Each doubling dilution of an antimicrobial agent is incorporated into a single agar plate; therefore, testing of a series of six dilutions of one drug requires the use of six plates, plus one positive growth control plate without antibiotic. The standard conditions and media for agar dilution testing are shown in Table 12-2. The surface of each plate is inoculated with 1 × 10⁴ CFU (Figure 12-4). This method allows examination of one or more bacterial isolates per plate. After incubation the plates are examined for growth; the MIC is the lowest concentration of an antimicrobial agent in agar that completely inhibits visible growth. The same MIC breakpoints and interpretive categories used for broth dilution are applied for interpretation of agar dilution methods. Similarly, test results may be reported as the MICs only, the category only, or both.
TABLE 12-2
Summary of Agar Dilution Susceptibility Testing Conditions
| Organism Groups | Test Medium | Inoculum Size (CFU/spot) | Incubation Conditions | Incubation Duration |
| Enterobacteriaceae | Mueller-Hinton | 1 × 10⁴ | 35°C; air | 16-20 hr |
| Enterococci | ||||
| Staphylococci (to detect methicillin-resistant staphylococci) | Mueller-Hinton plus 2% NaCl | 30°-35°C; air | 24 hr | |
| Neisseria meningitidis | Mueller-Hinton plus 5% sheep blood | 1 × 10⁴ | 35°C; 5%-7% carbon dioxide (CO2) | 24 hr |
| Streptococcus pneumoniae | Agar dilution not recommended method for testing this organism | |||
| Other streptococci | Mueller-Hinton plus 5% sheep blood | 1 × 10⁴ | 35°C; air, CO2 may be needed for some isolates | 20-24 hr |
| Neisseria gonorrhoeae | GC agar plus supplements | 1 × 10⁴ | 35°C; 5%-X% CO2 | 24 hr |
Conventional Testing Methods: Disk Diffusion
As more antimicrobial agents were created to treat bacterial infections, the limitations of the macrobroth dilution method became apparent. Before microdilution technology became widely available, it became clear that a more practical and convenient method of testing multiple antimicrobial agents against bacterial strains was needed. Out of this need the disk diffusion test was developed, emerging from the landmark study by Bauer et al.1 in 1966. These investigators standardized and correlated the use of antibiotic-impregnated filter paper disks (i.e., antibiotic disks) with MICs using many bacterial strains. With the disk diffusion susceptibility test, antimicrobial resistance is detected by challenging bacterial isolates with antibiotic disks placed on the surface of an agar plate that has been seeded with a lawn of bacteria (Figure 12-5).
When disks containing a known concentration of antimicrobial agent are placed on the surface of a freshly inoculated plate, the agent immediately begins to diffuse into the agar and establish a concentration gradient around the paper disk. The highest concentration is closest to the disk. Upon incubation, the bacteria grow on the surface of the plate except where the antibiotic concentration in the gradient around each disk is sufficiently high to inhibit growth. After incubation, the diameter of the zone of inhibition around each disk is measured in millimeters (see Figure 12-5).
To establish reference inhibitory zone–size breakpoints to define the susceptible, intermediate, and resistant categories for each antimicrobial agent/bacterial species combination, hundreds of strains are tested. The inhibition zone sizes obtained are then correlated with MICs obtained by broth or agar dilution, and a regression analysis is completed comparing the zone size in millimeters against the MIC (Figure 12-6). As the MICs of the bacterial strains tested increase (i.e., the more resistant bacterial strains), the corresponding inhibition zone sizes (i.e., diameters) decrease. Using Figure 12-6 to illustrate, horizontal lines are drawn from the MIC resistant breakpoint and the susceptible MIC breakpoint, 8 µg/mL and 2 µg/mL, respectively. Where the horizontal lines intersect the regression line, vertical lines are drawn to delineate the corresponding inhibitory zone size breakpoints (in millimeters). Using this approach, zone size interpretive criteria have been established for most of the commonly tested antimicrobial agents and are published in the CLSI M02 series, “Performance Standards for Antimicrobial Disk Susceptibility Tests.”
Procedures.
The key features of disk diffusion testing procedures are summarized in Table 12-3, with more details and updates available through CLSI.
TABLE 12-3
Summary of Disk Diffusion Susceptibility Testing Conditions
| Organism Groups | Test Medium | Inoculum Size (CFU/mL) | Incubation Conditions | Incubation Duration |
| Enterobacteriaceae | Mueller-Hinton agar | Swab from 1.5 × 10⁸ | 35°C; air | 16-18 hr |
| Pseudomonas aeruginosa | Mueller-Hinton agar | Swab from 1.5 × 10⁸ suspension | 35°C; air | 16-18 hr |
| Enterococci | Mueller-Hinton agar | Swab from 1.5 × 10⁸ suspension | 35°C; air | 16-18 hr (24 hr for vancomycin) |
| Staphylococci (to detect methicillin-resistant staphylococci) | Mueller-Hinton agar | Swab from 1.5 × 10⁸ suspension | 30°-35°C; air | 24 hr |
| Streptococcus pneumoniae and other streptococci | Mueller-Hinton agar plus 5% sheep blood | Swab from 1.5 × 10⁸ suspension | 35°C; 5%-7% carbon dioxide (CO2) | 20-24 hr |
| Haemophilus influenzae | Haemophilus test medium | Swab from 1.5 × 10⁸ suspension | 35°C; 5%-7% CO2 | 16-18 hr |
| Neisseria gonorrhoeae | GC agar plus supplements | Swab from 1.5 × 10⁸ suspension | 35°C; 5%-7% CO2 | 20-24 hr |
Medium and Antimicrobial Agents.
To ensure equal diffusion of the drug into the agar, the disks must be placed flat on the surface and be firmly applied to ensure adhesion. This is most easily accomplished by using any one of several disk dispensers that are available through commercial disk manufacturers. With these dispensers, all disks in the test battery are simultaneously delivered to the inoculated agar surface and are adequately spaced to minimize the chances for inhibition zone overlap and significant interactions between antimicrobials. In most instances, a maximum of 12 antibiotic disks may be applied to the surface of a single 150-mm Mueller-Hinton agar plate (see Figure 12-5).
Inoculation and Incubation.
Most organisms are incubated at 35°C in room air, but increased CO2 is used for testing of specific fastidious bacteria (see Table 12-3). Similarly, the incubation time may be increased beyond 16 hours to enhance detection of certain resistance patterns (e.g., methicillin resistance in staphylococci and vancomycin resistance in enterococci) and to ensure accurate results in general for fastidious organisms such as N. gonorrhoeae.
Reading and Interpretation of Results.
Before results with individual antimicrobial agent disks are read, the plate is examined to confirm that a confluent lawn of growth has been obtained (see Figure 12-5). If growth between inhibitory zones around each disk is poor and nonconfluent, the test should not be interpreted and should be repeated. The lack of confluent growth may be due to insufficient inoculum. Alternatively, a particular isolate may have undergone mutation, and growth factors supplied by the standard medium are no longer sufficient to support robust growth. In the latter case, medium supplemented with blood and/or incubation in CO2 may enhance growth. However, caution in interpreting results is required when extraordinary measures are used to obtain good growth and the standard medium recommended for testing a particular type of organism is not used. Plates should also be examined for purity. Mixed cultures are evident through the appearance of different colony morphologies scattered throughout the lawn of bacteria (Figure 12-7). Mixed cultures require purification and repeat testing.
A dark background and reflected light are used to examine a disk diffusion plate (Figure 12-8
[/not-level-membership-for-basic-science-category]
