Laboratory haematology I – Blood and bone marrow
The blood count
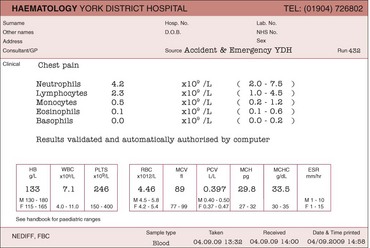
Many of the diseases discussed in this book are first suggested by an abnormality in the blood count (often referred to as the full blood count). The test is performed on a small specimen of anticoagulated venous blood; the normal anticoagulant is ethylene diamine tetra-acetic acid (EDTA). A typical report is illustrated in Figure 9.1. As can be seen, it contains a large amount of numerical information pertaining to the three cell lines in the peripheral blood: red cells (and haemoglobin), white cells (with a differential count of each specific cell type) and platelets.
The blood film
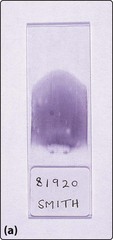
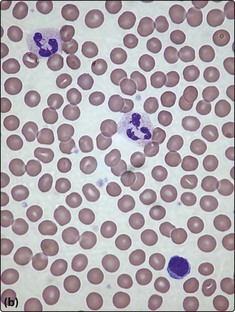
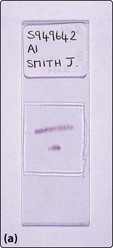
A blood film is simply made by smearing a drop of anticoagulated venous blood onto a glass slide with a glass spreader (Fig 9.2a). In larger laboratories film spreading can be automated. Following drying, the film is fixed with methanol and stained. Routine stains are based on Romanowsky’s method – commonly used variants are the May–Grünwald–Giemsa (MGG) stain and Wright’s stain. Constituent dyes include methylene blue, azure B and eosin. Once stained, the blood film should be systematically studied under the light microscope – the normal appearance of a film stained by the MGG method is illustrated in Figure 9.2b. Alternative stains are sometimes needed. Visualisation of reticulocytes requires the use of a dye such as methylene blue on live unfixed cells (‘supravital stain’). Malarial parasites are most easily seen following staining at a specific pH.
The first step in film examination is a decision as to whether the film is of adequate quality. Either poor staining techniques or prolonged storage of the specimen may make the film worthless. Any comment on the film appearance is usually appended to the blood count report. The nomenclature used in film reporting can appear obscure; some more commonly used morphological terms are listed in Table 9.1. Microscopic images of blood cells are now routinely photographed using digital cameras. These images may increasingly be used to create ‘virtual slides’ or employed with cell recognition systems for automated morphological screening.
Table 9.1
Some morphological terms used in blood film reports
| Red cells | |
| Hypochromia | Pale staining of cells |
| Polychromasia | Grey-blue tint to cells (usually reticulocytes) |
| Anisocytosis | Variation in cell size |
| Poikilocytosis | Variation in cell shape |
| Macrocytosis/microcytosis | Increase/decrease in cell size |
| Spherocyte | Small spherical densely stained cell |
| Burr cell | Crimpled cell membrane |
| Target cell | Increased staining in middle of area of central pallor – suggests increased surface area |
| Basophilic stippling | Small basophilic inclusions in cytoplasm (RNA) |
| Howell–Jolly bodies | Nuclear remnants in cytoplasm |
| Schistocyte | Fragmented cell |
| White cells | |
| Hypersegmented neutrophils | Increased nuclear segmentation |
| Left-shifted neutrophils | Reduced nuclear segmentation |
| Toxic granulation | Increased neutrophil cytoplasmic granularity |
| Atypical lymphocytes | Morphology variable; often seen in viral infections |
| Blasts | Leukaemic cells |
| Platelets | |
| Clumping | Sticking together; can cause artefactually low count |
Note: Causes of these morphological abnormalities are discussed in the disease sections.
Bone marrow examination
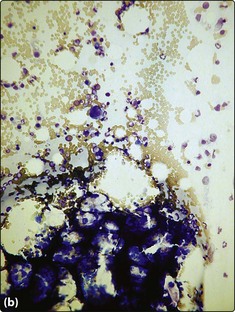
Aspirate
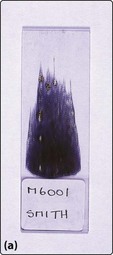
The aspirate is simply sucked through the needle and spread onto a glass slide; the marrow particles are normally easily visible (Fig 9.3a). The marrow is fixed and stained as for a blood film and additionally stained by Perl’s method to demonstrate iron. Microscopy and reporting is systematic with reference to the overall cellularity, the appearance and number of each normal cell line, possible infiltration by malignant cells, and any other pathological features. The advantage of the aspirate specimen is that individual cells are well preserved and subtle morphological changes can be detected. The major disadvantage is that the normal architecture of the marrow is lost. In the investigation of haematological malignancy (e.g. leukaemia) marrow aspirate samples are often also used for immunophenotyping and cytogenetic and molecular genetic testing.
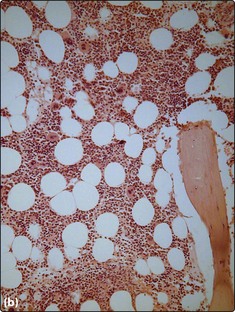
Trephine biopsy
The trephine biopsy (Fig 9.4) is sectioned and normally stained by haematoxylin and eosin (H&E) and Giemsa methods. Silver impregnation can be used to demonstrate marrow fibrosis and Perl’s stain to highlight iron. The trephine is less good than the aspirate for identifying morphological abnormalities of individual cells but it is better for detecting abnormalities of marrow architecture and infiltration by solid malignancy. The two types of bone marrow sample are thus complementary.
Laboratory haematology I – blood and bone marrow


