Chapter 2 Ischaemic heart disease
Introduction
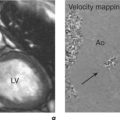
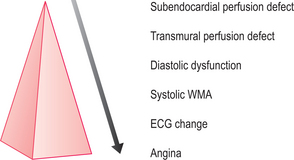
CMR is the current gold standard for the recognition of infarcted myocardium and the assessment of global and regional cardiac wall motion abnormalities (WMA). WMA arise in the context of MI and ischaemia. Stress-induced WMA are early indicators of coronary artery stenosis in the ischaemic cascade and may precede clinical symptoms and/or ECG changes (Figure 2.1). CMR can also diagnose haemodynamically significant coronary stenosis by measuring myocardial perfusion, although clinical experience is less extensive currently. Clinical CMR studies should follow the cardiac imaging protocol detailed in Chapter 1. Evaluation of global and regional ventricular function is by means of cines which reveal global and focal WMA. The four-chamber, two-chamber and short-axis stack cines are mandatory with subsequent imaging planes being directed by these initial views. These planes are repeated after gadolinium for imaging of myocardial pathology.
Myocardial infarction
Shortly after coronary artery occlusion, myocardial necrosis begins. This spreads outwards through the myocardial layers from the subendocardium towards the subepicardium. This progression of transmurality cannot be confidently discerned with the ECG but is readily appreciated by CMR. Accurate imaging of infarcted territory is useful for diagnosis and in predicting outcomes such as the development of heart failure, and planning coronary arterial revascularization by either PCI (percutaneous coronary intervention) or CABG (coronary artery bypass grafting).
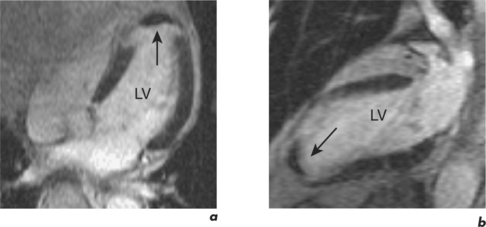
Characteristic regional thinning of myocardium with akinesia suggests MI and is first noted on the cines (Figure 2.2). Exact delineation of damaged myocardium is then performed using the technique of late enhancement with gadolinium, or LGE.
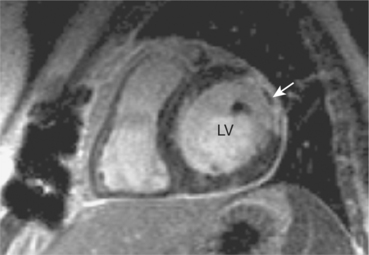
Gadolinium is bound to a chelate in contrast agents which limits its distribution to the extracellular space. Gadolinium accumulates within abnormal interstitium in the myocardium affected by acute or chronic MI. In the acute setting gadolinium distributes into necrotic tissue, and in the chronic setting gadolinium is found in fibrosis of the infarct scar. Gadolinium accumulation reduces T1 and therefore increases signal on T1W images. This principle along with an ECG-gated, inversion recovery fast GE sequence underlies the LGE technique. An important additional feature of this technique is the inversion time delay set by the operator to optimize contrast between normal myocardium and infarcted tissue. With optimal setting of this inversion time, normal myocardium becomes black while infarcted myocardium is bright white. This has led to the aphorism that in infarction ‘white is dead’ (Figure 2.3).
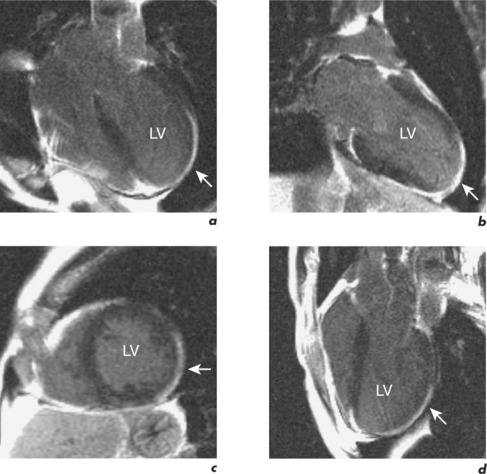
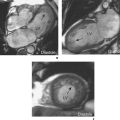
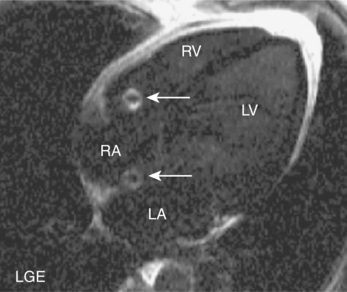
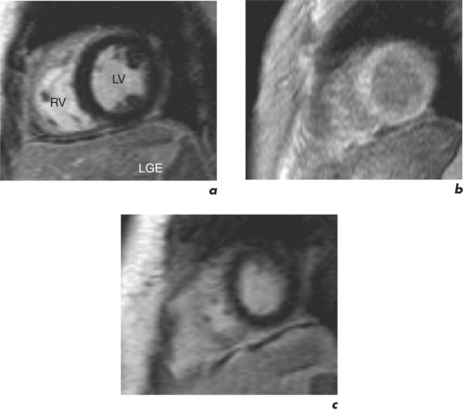
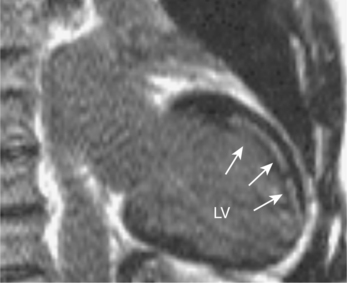
Figure 2.3 LGE CMR study from the patient in Figure 2.2 which shows transmural enhancement within the left circumflex (LCx) territory (white arrows) in the (a) four-chamber, (b) two-chamber, (c) mid-ventricular short-axis and (d) LVOT views.
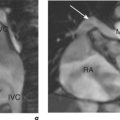
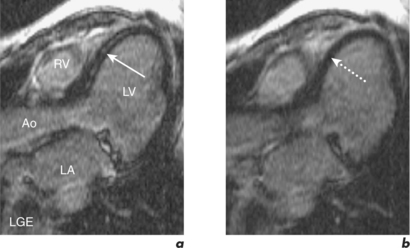
CMR is also used to image zones of microvascular obstruction (MVO) using early gadolinium enhancement (EGE). MVO occurs in the first hours post-MI, predicts an unfavourable prognosis, and corresponds to areas of no-reflow. The CMR appearances are of a black area within the infarct zone with exclusion of gadolinium relative to the surrounding reperfused infarcted tissue (Figure 2.4). These appearances also occur in LV thrombus and the clinical context of the CMR study must be borne in mind (Figure 2.5). EGE uses the same sequence as LGE but images are acquired in the first 1–5 minutes following contrast injection. LGE is commenced after 5 minutes have elapsed and imaging can continue for up to 20 minutes. The two-chamber, four-chamber and LVOT are standard views taken in EGE studies. For LGE a full short-axis stack and long-axis images are acquired. Additional imaging through areas of known or suspected pathology are recommended and positive findings are reported as early or late enhancement, respectively.
The technique takes approximately 20 minutes to perform and begins with dose calculation of gadolinium, selection of initial views, and setting of the inversion time. Images are acquired in late diastole when cardiac motion artefact should be minimal. Another artefact reduction technique is the application of a saturation prepulse over the spinal column to overcome the problem of cerebrospinal fluid (CSF) ghosting (Figure 2.6). Gadolinium is typically given at a dose of 0.1 mmol/kg by rapid hand injection into a peripheral vein. Inversion time for EGE imaging is set at 440 milliseconds (ms) and reduced to around 320 ms for LGE imaging to commence. Throughout the LGE acquisition, the inversion time is gradually increased up to 440 ms to maintain correct signal nulling of normal myocardium (Figure 2.7). Abnormal findings should be confirmed by changing the phase encode direction of the slice to confidently exclude artefact (Figure 2.8). This is known as phase-swapping.
So in the setting of MI, CMR can:
The scan report should address all these issues and will be discussed in more detail in the next section on myocardial viability.
Myocardial viability
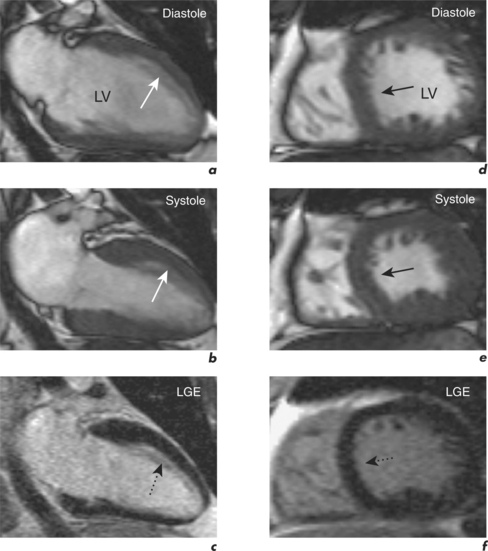
For example, significant wall thinning and impaired contractility in association with akinesia and transmural late enhancement indicates myocardial scarring. However, reduced contractility in association with normal thickness and no late enhancement indicates viable hibernating myocardium (Figure 2.9). This mismatch between cines and contrast findings is the key to reporting myocardial viability CMR studies. LGE CMR can quantify the degree of transmural involvement in MI and as transmurality increases the likelihood of improvement in regional contractility post-revascularization decreases.
Dysfunctional myocardium which shows < 50% transmural gadolinium enhancement has a high likelihood of functional recovery (Figure 2.10), while transmural infarction of > 75% is unlikely to recover contractility (Figure 2.3).
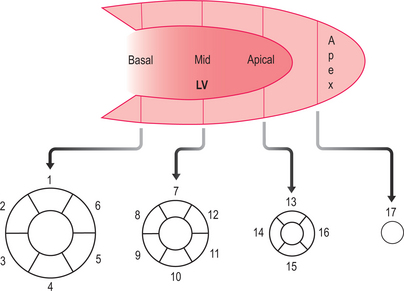
The scan report should follow the 17-segment model (Figure 2.11) and include:
Persistent WMA post-MI with successful revascularization may reflect delayed recovery and warrants repeat CMR evaluation after 4–6 months. Perfusion CMR or a dobutamine stress CMR can further clarify the issue of stunned versus hibernating myocardium.
Myocardial perfusion
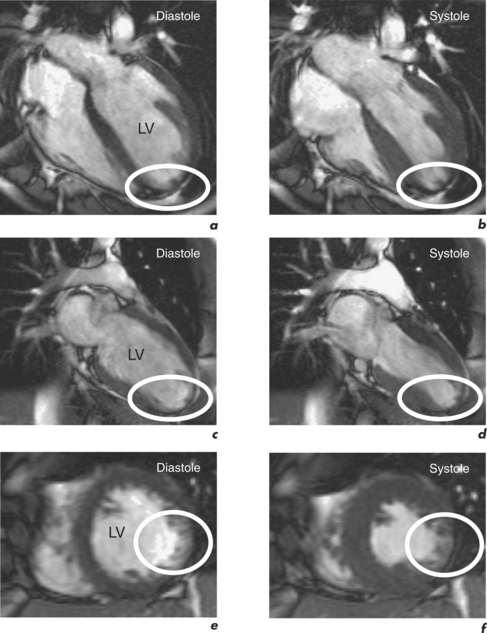
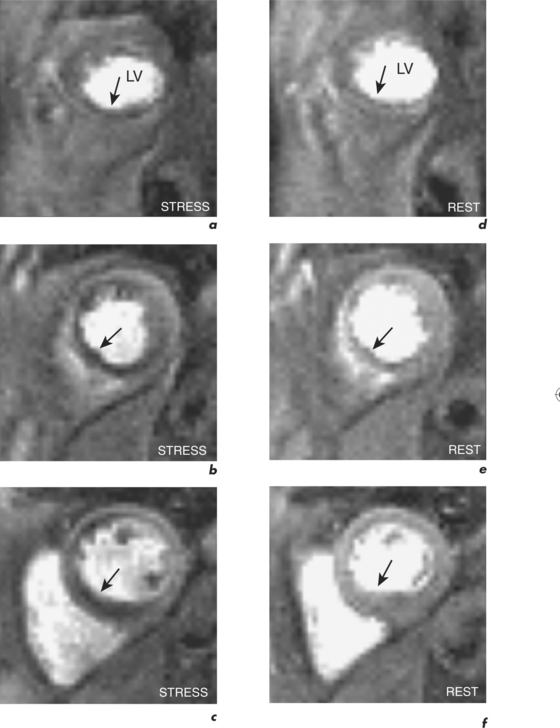
Resting coronary blood flow increases with exercise or other stress. This increase in coronary blood flow is the coronary flow reserve (Flowstress/Flowrest = CFR) with a normal range of approximately 4. With significant stenosis, coronary blood flow cannot increase adequately with stress and an inducible perfusion defect becomes apparent in the relevant coronary artery territory (Figure 2.12). Perfusion CMR can identify this perfusion defect and there is good correlation with myocardial scintigraphy. However, compared to scintigraphy, CMR allows improved resolution with no ionizing radiation. The optimal imaging sequence for perfusion CMR is currently multislice, single-shot hybrid GE using imaging acceleration during the first pass of a bolus of gadolinium. Good temporal (approximately 50–100 ms/image with certain sequences) and spatial resolution (approximately 2–3 mm) is essential in eliminating subendocardial artefacts which can mimic perfusion defects.
A perfusion CMR study incorporates functional and LGE evaluation and takes approximately 45 minutes to perform. Standard planes are obtained as described in the pre-contrast section outlined in Table 1.1. It is important to position the basal short-axis so as to avoid the LVOT throughout the cardiac cycle for avoidance of misinterpretation of abnormalities from the fibrous septum. The stress part of the perfusion examination is then performed during an infusion of intravenous adenosine (140 μg/kg/min for 4 minutes into the left antecubital vein) with a bolus of intravenous Gd-DTPA (0.1 mmol/kg at a rate of 7 ml/s followed by 15 ml of normal saline at the same rate via a large bore cannula in the right antecubital vein) given after 2 minutes and at the commencement of the perfusion sequence. Typically three ventricular short-axis slices are acquired in a breath-hold at end-expiration over the first cardiac cycles of the first pass. Image acquisition is over 60 seconds and patients are instructed to breathe gently when needed. Rest perfusion is delayed for 20 minutes after stress perfusion in order to reduce gadolinium levels, and is performed using the same doses and rates of gadolinium and saline as those for stress but without the adenosine.
The perfusion CMR scan report should follow the 17-segment model (Figure 2.11) and include:
Dobutamine stress testing
Viable myocardium that is hibernating will often improve contractility during stress. Pharmacological stress is usually with the catecholamine dobutamine which acts at cardiac β1 receptors to increase myocardial oxygen demand. Patients should avoid beta-blockers for 24 hours prior to the scan. Continuous ECG monitoring with pulse oximetry and blood pressure measurements every minute are required, along with direct questioning of patients during the study regarding adverse events. Side effects include nausea, dizziness, dyspnoea, chest pain and palpitations, and serious adverse events include induction of ventricular arrhythmias or prolonged ischaemia.
A dobutamine stress CMR examination takes 45 minutes to perform. Data analysis and reporting should follow the 17-segment model (Figure 2.11) and provide information on: