Fig. 19.1
Trial profile
The two groups did not differ in age, gender distribution, eGFR, urinary protein excretion, blood pressure, the proportion of patients’ given renin-angiotensin system (RAS) inhibitors, and histological grades (Table 19.1).
Table 19.1
Baseline patient characteristics
|
Group A
|
Group B
|
|
|---|---|---|
|
Tonsillectomy/steroid pulse therapy
|
Steroid pulse therapy alone
|
|
|
(n = 33)
|
(n = 39)
|
|
|
Age (years)
|
36 (13)
|
40 (13)
|
|
Gender
|
||
|
Male
|
17* (52)
|
18* (46)
|
|
Female
|
16* (48)
|
21* (54)
|
|
eGFR (ml/min/1‧73 m2)
|
75 (24)
|
69 (22)
|
|
Proteinuria (g/day)
|
1.6 (0.5)
|
1.6 (0.6)
|
|
Proteinuria (g/g creatinine)
|
1.7 (1.0)
|
1.7 (1.0)
|
|
Systolic blood pressure (mmHg)
|
117 (12)
|
121 (10)
|
|
Diastolic blood pressure (mmHg)
|
69 (9)
|
73 (8)
|
|
Mean arterial pressure (mmHg)
|
85 (9)
|
89 (8)
|
|
Patients receiving RAS-I (%)
|
16* (48)
|
18* (46)
|
|
Histological grade
|
||
|
Good prognosis
|
0*
|
0*
|
|
Relatively good prognosis
|
2* (6)
|
3* (8)
|
|
Relatively poor prognosis
|
20* (61)
|
23* (59)
|
|
Poor prognosis
|
11* (33)
|
13* (33)
|
19.2.2.1 Impact of Steroid Pulses and Tonsillectomy on Proteinuria
Figure 19.2 shows the percent changes in urinary protein excretion from baseline during the trial period. As revealed by a mixed effect model employing six fixed effects (group allocation, eGFR, mean arterial pressure, the use of RAS-I at baseline, time, and the interaction of group and time), the percentage decrease in urinary protein excretion during the 12 months from baseline was significantly larger in Group A than that in Group B (coefficient estimate −1.316, 95 % CI −2.617 to −0.015, P = 0.047). The percentage of patients with the disappearance of proteinuria (<0.3 g/gCr) was significantly higher in Group A than in Group B after 10 months (P = 0.029; Fig. 19.2). However, at 12 months, the difference was not statistically significant (Group A, 63 %; Group B, 39 %; P = 0.052).
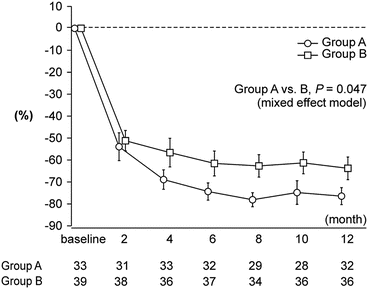

Fig. 19.2
Urinary protein excretion during the trial period. Mean values and standard errors are presented
19.2.2.2 Impact of Steroid Pulses and Tonsillectomy on Hematuria
The severity of microscopic hematuria gradually decreased following the initiation of therapy in both groups. However, the proportion of patients with the disappearance of hematuria was not different between the two groups at any time point (e.g., at 12 months, Group A, 68 %; Group B, 64 %, P = 0.672).
19.2.2.3 Impact of Steroid Pulses and Tonsillectomy on Clinical Remission
The disappearance of both proteinuria and hematuria (i.e., clinical remission) did not occur at a higher rate in Group A than in Group B at any time point (P = 0.160 at 10 months, P = 0.103 at 12 months).
19.2.2.4 Impact of Steroid Pulses and Tonsillectomy on Renal Function
eGFR remained stable throughout the trial period and was comparable between the two groups at 12 months (Group A, 75 mL/min/1.73 m2; Group B, 69 mL/min/1.73 m2). No patient in either group showed a 100 % increase in serum creatinine from baseline or a 50 % decrease in eGFR from baseline or had indications for renal replacement therapy.
No adverse effect related to tonsillectomy or general anesthesia was reported. One patient in Group A and three in Group B developed diabetes during the trial period, with one of these Group B patients requiring insulin therapy during the treatment with corticosteroid. At the end of the study, blood sugar levels of all four patients were restored to the normal range.
19.2.2.5 Logistic Regression Analysis
Logistic regression analysis was performed to evaluate the impact of multiple covariates on the disappearance of proteinuria or hematuria and the occurrence of clinical remission. Independent variables included the allocated treatment, eGFR, mean blood pressure, urinary protein excretion, and the use of RAS-I at baseline (Table 19.2). Only the allocated treatment had a significant and independent impact on the disappearance of proteinuria (hazard ratio, 2.98; 95 % confidence interval, 1.01–8.83; P = 0.049). No independent factors were identified as achieving the disappearance of hematuria or clinical remission.
Table 19.2
Logistic regression analysis of the impact of tonsillectomy, renal function, blood pressure, and urinary protein excretion at baseline and after disappearance of proteinuria, hematuria, or both at study completion
|
Odds ratio
|
95 % CI
|
P value
|
|
|---|---|---|---|
|
Disappearance of proteinuria
|
|||
|
Assigned treatment
|
2.98
|
1.01–8.83
|
0.049
|
|
eGFR (baseline)
|
0.99
|
0.97–1.02
|
0.560
|
|
Mean blood pressure (baseline)
|
1.04
|
0.97–1.11
|
0.297
|
|
Proteinuria (baseline)
|
0.61
|
0.33–1.13
|
0.115
|
|
RAS-I (baseline)
|
0.51
|
0.16–1.68
|
0.270
|
|
Disappearance of hematuria
|
|||
|
Assigned treatment
|
1.23
|
0.43–3.55
|
0.697
|
|
eGFR (baseline)
|
0.99
|
0.97–1.01
|
0.304
|
|
Mean blood pressure (baseline)
|
0.97
|
0.91–1.04
|
0.450
|
|
Proteinuria (baseline)
|
0.91
|
0.54–1.54
|
0.737
|
|
RAS-I (baseline)
|
0.95
|
0.29–3.13
|
0.930
|
|
Clinical remission
|
|||
|
Assigned treatment
|
2.24
|
0.77–6.51
|
0.140
|
|
eGFR (baseline)
|
0.99
|
0.97–1.02
|
0.554
|
|
Mean blood pressure (baseline)
|
1.01
|
0.94–1.08
|
0.858
|
|
Proteinuria (baseline)
|
0.75
|
0.41–1.38
|
0.348
|
|
RAS-I (baseline)
|
0.63
|
0.19–2.06
|
0.445
|
19.2.3 Discussion
For the first time, we performed a multicenter RCT of tonsillectomy combined with steroid pulse therapy in patients with IgAN. The findings of the present study indicated that the decrease in urinary protein excretion during follow-up was significantly greater in patients receiving tonsillectomy combined with steroid pulse therapy than in those receiving steroid pulse therapy alone, as shown by a mixed effect model and logistic regression analysis. However, 12 months after the initial treatment, the frequency of the disappearance of microscopic hematuria and clinical remission was comparable between the two groups. Thus, we conclude that tonsillectomy has no impact on the disappearance of hematuria but can have a beneficial effect on the decrease in proteinuria of IgAN patients, at least for those clinically comparable to the present patients. However, whether this subtle antiproteinuric effect by tonsillectomy indeed leads to better renal outcome remains to be elucidated.
This study had several limitations. First, the frequency of the disappearance of proteinuria at 12 months after the initiation of the treatment was 39 % in Group B, which was much higher than the value we expected (10 %). This unexpectedly high incidence may have resulted in the failure to find statistical difference between the two groups in comparison with 63 % in Group A (p = 0.052). More patients should be included for a more definitive conclusion. In addition, the unexpectedly higher number of excluded patients in Group A lessened the power of this RCT.
Second, the follow-up period was too short to be able to assess long-term renal survival, such as the progression of renal disease or the development of ESRD. Indeed, none of the patients were found to reach the secondary end points. Although the primary end points used in this study (e.g., the disappearance of proteinuria and/or hematuria after 12 months) were surrogate markers, many previous studies indicate that a marked reduction of proteinuria as an early response to the initial treatment ensures stable renal function after the cessation of treatment [4, 12, 13, 16, 17]. In addition to those studies that examined the relationship between the level of proteinuria after 12 months and the final renal outcome, Hirano et al. reported that, in the IgAN patients receiving 6 months of steroid therapy (Pozzi’s protocol), the achievement of proteinuria <0.4 g/day after 12 months could be a therapeutic indicator for a favorable renal outcome [18]. Therefore, a superior antiproteinuric effect of tonsillectomy plus steroid pulses compared with steroid pulses alone could lead to better preservation of renal function in the long term.
Third, RAS-I was administered only in nearly half of the patients in both groups at baseline. If all the patients were given RAS-I prior to the trial, some patients could show proteinuria <1 g/day at baseline. The differential use of RAS-I by different investigators could have potentially biased the results. Moreover, the impact of RAS-I on patients who started RAS-I during the trial was not clear.
In conclusion, the results indicate that the antiproteinuric effect was significantly greater in tonsillectomy combined with steroid pulse therapy, whereas it has no beneficial effect over steroid pulses alone to attenuate hematuria and to increase the incidence of clinical remission. Since the difference in the antiproteinuric effect was marginal (∼10–15 % between the two groups), whether it improves long-term renal outcome remains to be clarified.
19.3 Perspectives of Tonsillectomy in IgA Nephropathy
From the baseline characteristics of the patients (urinary protein excretion ranging from 1.0 to 3.5 g/day and moderate to severe histological damage), the present RCT excluded patients with mild IgAN. In view of the possible effectiveness of steroid pulses alone, as revealed in the present and previous studies [12, 13], a question remains as to whether the advantage of tonsillectomy seen in the present study is relevant to patients with severer or milder IgAN than those in the present patients. Concerning this issue, tonsillectomy combined with steroid pulse therapy might be more effective in patients with advanced IgAN, as suggested by a previous report [19], which found that renal outcome was better with tonsillectomy plus steroid pulses in IgAN patients, particularly in patients with serum creatinine of 1.5–2.0 mg/dL. Further studies are necessary to clarify the profiles of IgAN patients suited for treatment with tonsillectomy plus steroid pulses.
The renoprotective effect of tonsillectomy itself remains unclear, since it was used in the combination with steroid therapy in the present RCT and previous studies [4, 6]. The results of the RCT simply suggest the need for a larger RCT to clarify whether tonsillectomy can protect IgAN patients from the progressive deterioration of renal function or the relapse/recurrence of proteinuria during a long-term follow-up. In this regard, we are now in the process of a study to follow-up the present patients for 3 years. In addition, it is possible to examine the GFR-preserving effect of tonsillectomy plus steroid pulses in an ongoing prospective Japanese IgA nephropathy cohort study (J-IGACS). J-IGACS started from 2005, and now, 1064 patients were enrolled by May 13th in 2015. Clinical data sets were obtained at the time of renal biopsy and every 6 months during the follow-up. The biopsy specimens were circulated to five renal pathologists, and both Oxford classification [20] and Japanese histological grading [21] were determined by the consensus of those renal pathologists. Since each of tonsillectomy plus steroid pulses or steroid pulses alone was performed in 30–40 % of the whole patients recruited in J-IGACS, this prospective cohort study may clarify whether this surgical procedure has a role in IgAN in the future.
Conflict of Interest
The author declares that he has no conflict of interest.
References
1.
Hiki Y, Iwase H, Kokubo T, Horii A, Tanaka A, Nishikido J, et al. Association of asialo-galactosyl beta 1-3N-acetylgalactosamine on the hinge with a conformational instability of Jacalin-reactive immunoglobulin A1 in immunoglobulin A nephropathy. J Am Soc Nephrol. 1996;7:955–60.PubMed
2.
3.
4.
5.
6.
Komatsu H, Fujimoto S, Hara S, Sato Y, Yamada K, Kitamura K. Effect of tonsillectomy plus steroid pulse therapy on clinical remission of IgA nephropathy: a controlled study. Clin J Am Soc Nephrol. 2008;3:1301–7.CrossRefPubMedPubMedCentral
7.
Miura N, Imai H, Kikuchi S, Hayashi S, Endoh M, Kawamura T, et al. Tonsillectomy and steroid pulse (TSP) therapy for patients with IgA nephropathy: a nationwide survey of TSP therapy in Japan and an analysis of the predictive factors for resistance to TSP therapy. Clin Exp Nephrol. 2009;13:460–6.CrossRefPubMed
8.
9.
10.
KDIGO Clinical Practice Guideline for Glomerulonephritis. Chapter 10: immunoglobulin A nephropathy. Kidney Int Suppl. 2012;2:209–17.CrossRef
11.
Kawamura T, Yoshimura M, Miyazaki Y, Okamoto H, Kimura K, Hirano K, et al. A multicenter randomized controlled trial of tonsillectomy combined with steroid pulse therapy in patients with immunoglobulin A nephropathy. Nephrol Dial Transplant. 2014;29:1546–53.CrossRefPubMedPubMedCentral
12.
13.
14.
15.
16.
Reich HN, Troyanov S, Scholey JW, Cattran DC; Toronto Glomerulonephritis Registry. Remission of proteinuria improves prognosis in IgA nephropathy. J Am Soc Nephrol. 2007;18:3177–83.
17.
18.
Hirano K, Kawamura T, Tsuboi N, Okonogi H, Miyazaki Y, Ikeda M, et al. The predictive value of attenuated proteinuria at 1 year after steroid therapy for renal survival in patients with IgA nephropathy. Clin Exp Nephrol. 2012;17:555–62.CrossRefPubMedPubMedCentral
19.
20.
Working Group of the International IgA Nephropathy Network and the Renal Pathology Society, Cattran DC, Coppo R, Cook HT, Feehally J, Roberts IS. et al. The Oxford classification of IgA nephropathy: rationale, clinicopathological correlations, and classification. Kidney Int. 2009;76:534–45.


