CHAPTER 77 INVESTIGATIONS IN MULTIPLE SCLEROSIS
Investigations in the setting of multiple sclerosis have three main roles: to help support or refute the diagnosis, to provide insights into the mechanisms underlying pathogenesis of the illness and to provide a means of monitoring progression and thus assessing the effect of treatment.
BLOOD INVESTIGATIONS
In the absence of a diagnostic blood test, these are used broadly to exclude alternative conditions that are generally infective or inflammatory (Table 77-1).
| Blood Test | Differential Diagnosis |
|---|---|
| Vitamin B12/folate | Subacute combined degeneration |
| Autoantibodies | Autoimmune diseases |
| Immunoglobulins/ferritin | Inflammatory diseases |
| Lupus anticoagulant status | Antiphospholipid antibody syndrome |
| Extractable nuclear antigens | Sjögren’s syndrome |
| Lyme serology | Lyme borreliosis |
| HTLV-1 antibodies | Tropical spastic paraplegia |
| HIV | HIV |
| Leber’s mutation | Harding’s disease |
| NMO-IgG | Devic’s disease |
LUMBAR PUNCTURE
Abnormalities of Cerebrospinal Fluid Immunoglobulin Production
These abnormalities have been known for some 40 years.1 Detection of cerebrospinal fluid immunoglobulins remain one of the most sensitive, but not specific, tests for the disease. If isoelectric focusing is used, then evidence of intrathecal synthesis of oligoclonal immunoglobulin is found in approximately 95% of definite cases2 compared with 75% for quantitative techniques. These oligoclonal bands are indicative of the plasma cell expansion within the central nervous system. If the initial result is negative and clinical suspicion is high or there is only a single band, it is worth repeating the lumbar puncture. It is essential that paired serum and cerebrospinal fluid samples are analyzed in order to exclude the possibility of a systemic polyclonal response diffusing across the blood-brain barrier. Oligoclonal bands may be found in acute disseminated encephalomyelitis but tend to disappear, whereas in multiple sclerosis they persist.3 The investigation is nonspecific, and oligoclonal bands may be found in a wide range of other conditions such as infective and inflammatory processes as well as paraneoplastic phenomena. Therefore, although their presence may merely be supportive, their absence should strongly encourage the search for an alternative diagnosis.4
A committee brought together to support the McDonald (2001) guidance (see later) concluded that the most informative analysis is qualitative assessment, best performed using immunoelectrophoresis, together with some form of immunodetection (blotting or fixation).5 This should be performed using unconcentrated cerebrospinal fluid and must be compared directly with a serum sample run simultaneously. They highlight that the result should be interpreted with values from all other tests, including cell count protein, glucose, etc. In certain cases, evaluation using light chains for immunodetection can help resolve equivocal oligoclonal immunoglobulin G patterns. They emphasize that consideration should be given to repeating the lumbar puncture if clinical suspicion is high and the results are equivocal or show only a single band. It is, of course, important to emphasize that the procedure is moderately invasive and must be analyzed in the most effective manner. Five main patterns are found6 (Fig. 77-1):
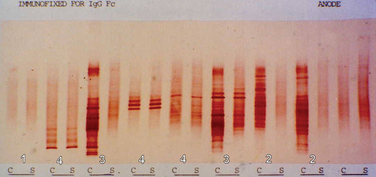
Figure 77-1 Patterns of cerebrospinal fluid immunoelectrophoresis.
(Courtesy of Dr. G. Giovanonni, Institute of Neurology, London, England.)
In primary progressive multiple sclerosis, in which the likelihood of a false-positive diagnosis is highest, the 2001 McDonald criteria required the presence of oligoclonal bands. This has been revised in the most recent guidance7 in view of the large study by Wolinsky in which one third of patients were negative.8 It was also suggested that this group had a less inflammatory illness. It is important to appreciate, however, that the cerebrospinal fluid analysis in this study was based on a quantitative technique and thus may have underestimated an isoelectrically focused result.
EVOKED POTENTIALS
The development of averaging techniques allows the recording of the arrival of an action potential by a scalp electrode placed over the appropriate cortical region. Its use in multiple sclerosis is in identifying clinically silent regions of the central nervous system. Furthermore, it is the only way in which the pathological process of the central nervous system demyelination may be demonstrated in vivo. Initially, somatosensory potentials were studied in a range of neurological diseases, including multiple sclerosis.9 It was not until the development of the technique of pattern reversal visual evoked potentials that the method was applied to diagnosis in multiple sclerosis. A prolonged latency was found in over 90% of patients with a history of optic neuritis.10 This done, attention was turned to multiple sclerosis patients without such a history, where a finding of a conduction delay within the visual pathways would demonstrate evidence of lesions that had not been clinically apparent.11 In clinical practice, potentials are recorded over the scalp after visual, somatosensory, and auditory stimuli or may be recorded peripherally after central magnetic stimulation of the motor cortex.
Visual Evoked Potentials
The visual evoked potential (V.E.P.) is an averaged response recorded from three occipital electrodes with a mid-frontal voltage reference. The main component is a wave of electropositivity at 100 milliseconds (P100). This is preceded by a smaller negative response at 75 milliseconds (Fig. 77-2). The stimulus takes the form of a high-contrast checkerboard, which reverses its pattern and occupies the central 40° of the visual field. Half-field stimulation is used as an adjunct to anatomical localization of a detected delay. The response is dependent on a level of visual acuity to the extent that, if this is worse than 6/24, the potential will be absent. This is of use in patients whom one suspects may have a nonorganic visual loss. The latency is shorter in women and increases with age over 60.
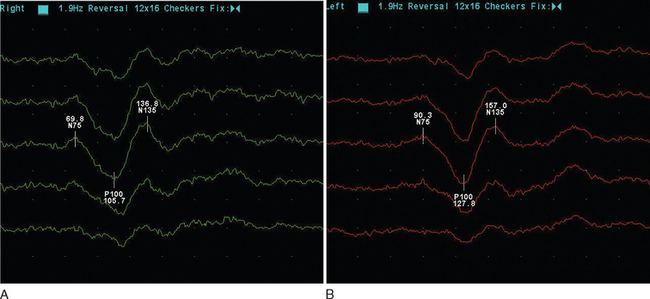
Figure 77-2 Normal (A) and abnormal (B) visual evoked potentials, showing delayed waveform of normal amplitude.
(Courtesy of the Department of Neurophysiology, Royal Free Hospital.)
The mean delay recorded is approximately 35m/sec and will persist in the majority of adult patients.12 The prospect for full recovery is much greater in children, perhaps reflecting a viral etiology. In the acute inflammatory phase, there may be conduction block, leading to reduced amplitude response or even its absence, which is then followed by a typical delayed normal amplitude waveform during recovery. From 85% to 95% of patients who eventually receive a diagnosis of clinical definite multiple sclerosis will have a visual evoked potential abnormality. It is important to stress that this is when using the more old-fashioned opticomechanical stimulator. More modern computer monitors, although appearing instantaneous visually, take up to 18m/sec to draw the checkerboard, resulting in a more dispersed stimulus.13 It is suggested that sensitivity may be as low as 25% in this setting.14 There may be a small increase in detection if central field stimulation (4° of visual field) is used. The asymmetry of the delay may be of diagnostic value. The interocular difference is rarely greater than 5 milliseconds in normal subjects. The asymmetry helps distinguish patchy processes as found in multiple sclerosis from more diffuse causes of optic neuropathy such as Friedreich’s ataxia or vitamin B12 deficiency.
Somatosensory Evoked Potentials
The response is recorded from electrodes placed over the primary somatosensory cortex (Brodmann area 3b) following a suprathreshold electrical stimulation within the territories of the median or posterior tibial nerve (Fig. 77-3). The potentials are characterized by a peak at an average of 20m/sec for median stimulation and 40m/sec for posterior tibial. Assuming normal peripheral conduction, delay will indicate an area of demyelination within the central sensory pathways. A normal median response with an abnormal posterior tibial indicates a lesion within the spinal cord. Central conduction time may be calculated by subtracting the recordings made over the cervical and lumber root entry zones. Very occasionally, the median evoked potential is delayed while the posterior tibial response is normal, indicating a discrete lesion within the gracile funiculus.
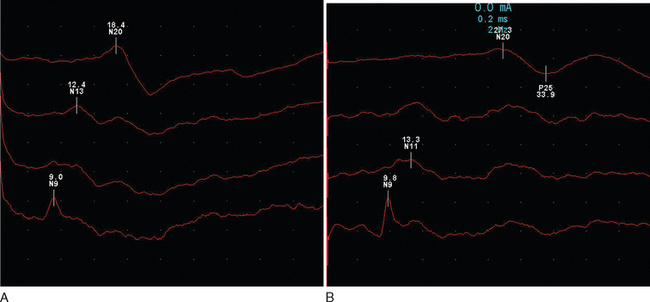
Figure 77-3 Normal (A) and abnormal (B) somatosensory evoked potentials.
(Courtesy of the Department of Neurophysiology, Royal Free Hospital.)
Abnormalities are found in approximately 80% of patients without sensory features in clinically definite multiple sclerosis15 and in 20% of patients with a clinically isolated syndrome.16 There is an expectedly higher yield (approximately 10%) following stimulation of the posterior tibial nerve. It is interesting that abnormalities may be purely unilateral in one third of patients.
Brainstem (Auditory) Evoked Potentials
These are obtained following a clicking auditory stimulation by electrodes placed over the vertex and ipsilateral mastoid (Fig. 77-4). It is a complex waveform, with five main peaks due to passage via brainstem and mid-brain structures:
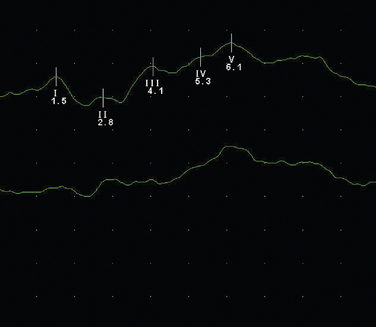
Figure 77-4 Normal brainstem evoked potential.
(Courtesy of the Department of Neurophysiology, Royal Free Hospital.)
The usefulness of evoked potentials was assessed by the Quality Standards Sub-Committee of the American Academy of Neurology.17 Following a review of 16 studies that included 715 patients, it was concluded that visual evoked potentials were probably useful in identifying patients with clinically isolated syndromes who are at increased risk of developing multiple sclerosis. Sensory evoked potentials were regarded as possibly useful, and it was believed that there was insufficient evidence to recommend brainstem evoked potentials.
Central Motor Conduction
Magnetic cortical stimulation over the motor cortex will induce a response in the appropriate muscle group,18 allowing, with certain caveats, an assessment of central motor conduction velocity. Delays may be found if there are lesions along the motor pathways.19 However, these invariably occur with clinical evidence of such lesions restricting the usefulness of the investigation. There is a correlation between central motor conduction delay, spinal cord lesion load, and disability. It has been suggested that this is due to axonal loss,20 as it appears to occur independent of demyelination.
IMAGING
Computed Tomography Scanning
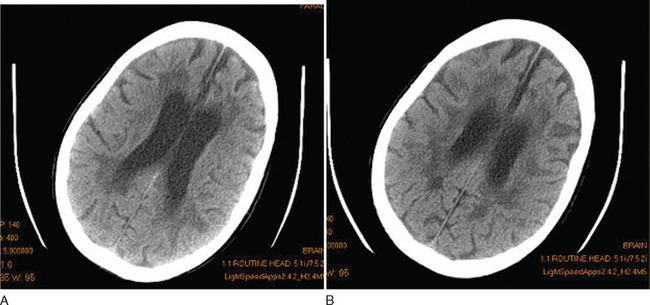
Although this is essentially a redundant technique in the investigation of multiple sclerosis, there are occasional patients in whom MRI is contraindicated or is unavailable. Computed tomography (CT) scanning was first demonstrated to be of use in multiple sclerosis in 1976.21 The main findings were of atrophy, but approximately one third of patients had periventricular low-density lesions (Fig. 77-5). The detection rate increased with increasing sophistication of imaging techniques and, within a few years, contrast enhancement was reported in acute lesions.22 Furthermore, with serial imaging, it became clear that the enhancement was a temporary phenomenon,23 which would resolve faster after steroid therapy. With optimization by increasing the dose of contrast, delaying imaging, and high-resolution scanners, up to 89% of patients were found to have enhancing lesions within 8 weeks of relapse.24
Magnetic Resonance Imaging
In 1981, Young25 demonstrated the exquisite sensitivity that MRI has in revealing the lesions of multiple sclerosis. They examined 10 patients in whom CT scanning had established 19 lesions. An additional 112 lesions were found on MRI. Furthermore, it was now possible to clearly see lesions in the posterior fossa. Virtually all lesions seen on CT are MRI visible.26
Imaging protocols use techniques to optimize tissue contrast. A routine MRI study will generally include proton density, fluid-attenuated inversion recovery (FLAIR), and T1- and T2-weighted images, as well as occasionally a postcontrast T1-weighted image. Periventricular deep white matter lesions are the most common finding. The corpus callosum and posterior fossa are also commonly affected and help different inflammatory lesions as occur in multiple sclerosis from the consequences of small vessel disease.
Cerebral MRI will reveal abnormalities in 95% of patients with multiple sclerosis.27 Of the remainder, one half tend to have primary progressive disease. In a study of 20 patients with negative cerebral MRI, all were found to have abnormalities on spinal imaging, 87% had cerebrospinal fluid oligoclonal bands, and 56% had abnormal evoked potentials.28
Cord lesions may be seen in up to 75% of clinically definite cases.
Conventional Imaging Protocols
T2-Weighted Imaging
T2 is prolonged with increasing mobility of bulk water, such as in inflammation, and in gliosis. For this reason, there is a lack of pathological specificity. T2 is so sensitive that subsequent pathological analysis demonstrates only subtle evidence of inflammatory infiltration,29 although it is likely that fixation methods would make the changes less apparent. Radiologists often incorrectly report the widespread periventricular lesions seen in T2-weighted scans as being due to the consequences of demyelination. The nature of multiple sclerosis is such that patho-radiological correlation is only rarely possible. There is a substantial heterogeneity to the pathological features of multiple sclerosis, and it has not been possible to distinguish the subtypes by MRI.


