CHAPTER 77 INVESTIGATIONS IN MULTIPLE SCLEROSIS
Investigations in the setting of multiple sclerosis have three main roles: to help support or refute the diagnosis, to provide insights into the mechanisms underlying pathogenesis of the illness and to provide a means of monitoring progression and thus assessing the effect of treatment.
BLOOD INVESTIGATIONS
In the absence of a diagnostic blood test, these are used broadly to exclude alternative conditions that are generally infective or inflammatory (Table 77-1).
| Blood Test | Differential Diagnosis |
|---|---|
| Vitamin B12/folate | Subacute combined degeneration |
| Autoantibodies | Autoimmune diseases |
| Immunoglobulins/ferritin | Inflammatory diseases |
| Lupus anticoagulant status | Antiphospholipid antibody syndrome |
| Extractable nuclear antigens | Sjögren’s syndrome |
| Lyme serology | Lyme borreliosis |
| HTLV-1 antibodies | Tropical spastic paraplegia |
| HIV | HIV |
| Leber’s mutation | Harding’s disease |
| NMO-IgG | Devic’s disease |
LUMBAR PUNCTURE
Abnormalities of Cerebrospinal Fluid Immunoglobulin Production
These abnormalities have been known for some 40 years.1 Detection of cerebrospinal fluid immunoglobulins remain one of the most sensitive, but not specific, tests for the disease. If isoelectric focusing is used, then evidence of intrathecal synthesis of oligoclonal immunoglobulin is found in approximately 95% of definite cases2 compared with 75% for quantitative techniques. These oligoclonal bands are indicative of the plasma cell expansion within the central nervous system. If the initial result is negative and clinical suspicion is high or there is only a single band, it is worth repeating the lumbar puncture. It is essential that paired serum and cerebrospinal fluid samples are analyzed in order to exclude the possibility of a systemic polyclonal response diffusing across the blood-brain barrier. Oligoclonal bands may be found in acute disseminated encephalomyelitis but tend to disappear, whereas in multiple sclerosis they persist.3 The investigation is nonspecific, and oligoclonal bands may be found in a wide range of other conditions such as infective and inflammatory processes as well as paraneoplastic phenomena. Therefore, although their presence may merely be supportive, their absence should strongly encourage the search for an alternative diagnosis.4
A committee brought together to support the McDonald (2001) guidance (see later) concluded that the most informative analysis is qualitative assessment, best performed using immunoelectrophoresis, together with some form of immunodetection (blotting or fixation).5 This should be performed using unconcentrated cerebrospinal fluid and must be compared directly with a serum sample run simultaneously. They highlight that the result should be interpreted with values from all other tests, including cell count protein, glucose, etc. In certain cases, evaluation using light chains for immunodetection can help resolve equivocal oligoclonal immunoglobulin G patterns. They emphasize that consideration should be given to repeating the lumbar puncture if clinical suspicion is high and the results are equivocal or show only a single band. It is, of course, important to emphasize that the procedure is moderately invasive and must be analyzed in the most effective manner. Five main patterns are found6 (Fig. 77-1):
Figure 77-1 Patterns of cerebrospinal fluid immunoelectrophoresis.
(Courtesy of Dr. G. Giovanonni, Institute of Neurology, London, England.)
In primary progressive multiple sclerosis, in which the likelihood of a false-positive diagnosis is highest, the 2001 McDonald criteria required the presence of oligoclonal bands. This has been revised in the most recent guidance7 in view of the large study by Wolinsky in which one third of patients were negative.8 It was also suggested that this group had a less inflammatory illness. It is important to appreciate, however, that the cerebrospinal fluid analysis in this study was based on a quantitative technique and thus may have underestimated an isoelectrically focused result.
EVOKED POTENTIALS
The development of averaging techniques allows the recording of the arrival of an action potential by a scalp electrode placed over the appropriate cortical region. Its use in multiple sclerosis is in identifying clinically silent regions of the central nervous system. Furthermore, it is the only way in which the pathological process of the central nervous system demyelination may be demonstrated in vivo. Initially, somatosensory potentials were studied in a range of neurological diseases, including multiple sclerosis.9 It was not until the development of the technique of pattern reversal visual evoked potentials that the method was applied to diagnosis in multiple sclerosis. A prolonged latency was found in over 90% of patients with a history of optic neuritis.10 This done, attention was turned to multiple sclerosis patients without such a history, where a finding of a conduction delay within the visual pathways would demonstrate evidence of lesions that had not been clinically apparent.11 In clinical practice, potentials are recorded over the scalp after visual, somatosensory, and auditory stimuli or may be recorded peripherally after central magnetic stimulation of the motor cortex.
Visual Evoked Potentials
The visual evoked potential (V.E.P.) is an averaged response recorded from three occipital electrodes with a mid-frontal voltage reference. The main component is a wave of electropositivity at 100 milliseconds (P100). This is preceded by a smaller negative response at 75 milliseconds (Fig. 77-2). The stimulus takes the form of a high-contrast checkerboard, which reverses its pattern and occupies the central 40° of the visual field. Half-field stimulation is used as an adjunct to anatomical localization of a detected delay. The response is dependent on a level of visual acuity to the extent that, if this is worse than 6/24, the potential will be absent. This is of use in patients whom one suspects may have a nonorganic visual loss. The latency is shorter in women and increases with age over 60.
Figure 77-2 Normal (A) and abnormal (B) visual evoked potentials, showing delayed waveform of normal amplitude.
(Courtesy of the Department of Neurophysiology, Royal Free Hospital.)
The mean delay recorded is approximately 35m/sec and will persist in the majority of adult patients.12 The prospect for full recovery is much greater in children, perhaps reflecting a viral etiology. In the acute inflammatory phase, there may be conduction block, leading to reduced amplitude response or even its absence, which is then followed by a typical delayed normal amplitude waveform during recovery. From 85% to 95% of patients who eventually receive a diagnosis of clinical definite multiple sclerosis will have a visual evoked potential abnormality. It is important to stress that this is when using the more old-fashioned opticomechanical stimulator. More modern computer monitors, although appearing instantaneous visually, take up to 18m/sec to draw the checkerboard, resulting in a more dispersed stimulus.13 It is suggested that sensitivity may be as low as 25% in this setting.14 There may be a small increase in detection if central field stimulation (4° of visual field) is used. The asymmetry of the delay may be of diagnostic value. The interocular difference is rarely greater than 5 milliseconds in normal subjects. The asymmetry helps distinguish patchy processes as found in multiple sclerosis from more diffuse causes of optic neuropathy such as Friedreich’s ataxia or vitamin B12 deficiency.
Somatosensory Evoked Potentials
The response is recorded from electrodes placed over the primary somatosensory cortex (Brodmann area 3b) following a suprathreshold electrical stimulation within the territories of the median or posterior tibial nerve (Fig. 77-3). The potentials are characterized by a peak at an average of 20m/sec for median stimulation and 40m/sec for posterior tibial. Assuming normal peripheral conduction, delay will indicate an area of demyelination within the central sensory pathways. A normal median response with an abnormal posterior tibial indicates a lesion within the spinal cord. Central conduction time may be calculated by subtracting the recordings made over the cervical and lumber root entry zones. Very occasionally, the median evoked potential is delayed while the posterior tibial response is normal, indicating a discrete lesion within the gracile funiculus.
Figure 77-3 Normal (A) and abnormal (B) somatosensory evoked potentials.
(Courtesy of the Department of Neurophysiology, Royal Free Hospital.)
Abnormalities are found in approximately 80% of patients without sensory features in clinically definite multiple sclerosis15 and in 20% of patients with a clinically isolated syndrome.16 There is an expectedly higher yield (approximately 10%) following stimulation of the posterior tibial nerve. It is interesting that abnormalities may be purely unilateral in one third of patients.
Brainstem (Auditory) Evoked Potentials
These are obtained following a clicking auditory stimulation by electrodes placed over the vertex and ipsilateral mastoid (Fig. 77-4). It is a complex waveform, with five main peaks due to passage via brainstem and mid-brain structures:
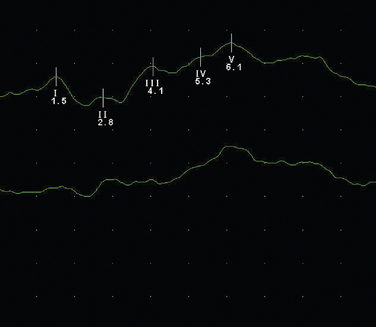
Figure 77-4 Normal brainstem evoked potential.
(Courtesy of the Department of Neurophysiology, Royal Free Hospital.)
The usefulness of evoked potentials was assessed by the Quality Standards Sub-Committee of the American Academy of Neurology.17 Following a review of 16 studies that included 715 patients, it was concluded that visual evoked potentials were probably useful in identifying patients with clinically isolated syndromes who are at increased risk of developing multiple sclerosis. Sensory evoked potentials were regarded as possibly useful, and it was believed that there was insufficient evidence to recommend brainstem evoked potentials.
Central Motor Conduction
Magnetic cortical stimulation over the motor cortex will induce a response in the appropriate muscle group,18 allowing, with certain caveats, an assessment of central motor conduction velocity. Delays may be found if there are lesions along the motor pathways.19 However, these invariably occur with clinical evidence of such lesions restricting the usefulness of the investigation. There is a correlation between central motor conduction delay, spinal cord lesion load, and disability. It has been suggested that this is due to axonal loss,20 as it appears to occur independent of demyelination.
IMAGING
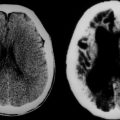
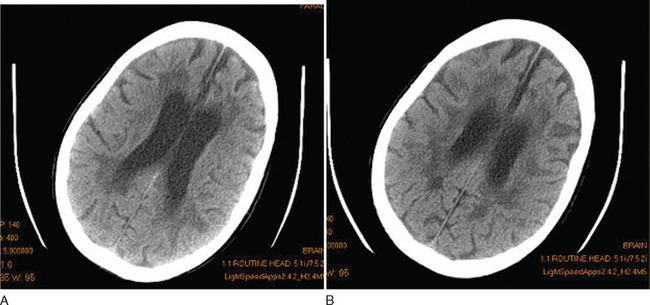
Computed Tomography Scanning
Although this is essentially a redundant technique in the investigation of multiple sclerosis, there are occasional patients in whom MRI is contraindicated or is unavailable. Computed tomography (CT) scanning was first demonstrated to be of use in multiple sclerosis in 1976.21 The main findings were of atrophy, but approximately one third of patients had periventricular low-density lesions (Fig. 77-5). The detection rate increased with increasing sophistication of imaging techniques and, within a few years, contrast enhancement was reported in acute lesions.22 Furthermore, with serial imaging, it became clear that the enhancement was a temporary phenomenon,23 which would resolve faster after steroid therapy. With optimization by increasing the dose of contrast, delaying imaging, and high-resolution scanners, up to 89% of patients were found to have enhancing lesions within 8 weeks of relapse.24
Magnetic Resonance Imaging
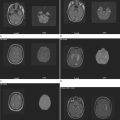
In 1981, Young25 demonstrated the exquisite sensitivity that MRI has in revealing the lesions of multiple sclerosis. They examined 10 patients in whom CT scanning had established 19 lesions. An additional 112 lesions were found on MRI. Furthermore, it was now possible to clearly see lesions in the posterior fossa. Virtually all lesions seen on CT are MRI visible.26
Imaging protocols use techniques to optimize tissue contrast. A routine MRI study will generally include proton density, fluid-attenuated inversion recovery (FLAIR), and T1- and T2-weighted images, as well as occasionally a postcontrast T1-weighted image. Periventricular deep white matter lesions are the most common finding. The corpus callosum and posterior fossa are also commonly affected and help different inflammatory lesions as occur in multiple sclerosis from the consequences of small vessel disease.
Cerebral MRI will reveal abnormalities in 95% of patients with multiple sclerosis.27 Of the remainder, one half tend to have primary progressive disease. In a study of 20 patients with negative cerebral MRI, all were found to have abnormalities on spinal imaging, 87% had cerebrospinal fluid oligoclonal bands, and 56% had abnormal evoked potentials.28
Cord lesions may be seen in up to 75% of clinically definite cases.
Conventional Imaging Protocols
T2-Weighted Imaging
T2 is prolonged with increasing mobility of bulk water, such as in inflammation, and in gliosis. For this reason, there is a lack of pathological specificity. T2 is so sensitive that subsequent pathological analysis demonstrates only subtle evidence of inflammatory infiltration,29 although it is likely that fixation methods would make the changes less apparent. Radiologists often incorrectly report the widespread periventricular lesions seen in T2-weighted scans as being due to the consequences of demyelination. The nature of multiple sclerosis is such that patho-radiological correlation is only rarely possible. There is a substantial heterogeneity to the pathological features of multiple sclerosis, and it has not been possible to distinguish the subtypes by MRI.
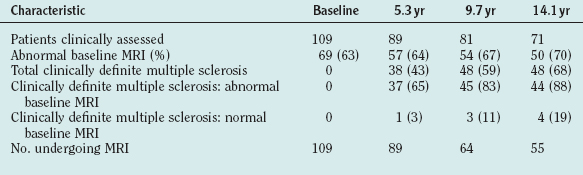
T2-weighted imaging reveals multiple sclerosis lesions as high signal foci contrasting against the low signal background. Problems arise if they are periventricular, as they often will merge with the cerebrospinal fluid, which has a similar signal (Fig. 77-6). Further lesions may be visualized in the spinal cord30 (Fig. 77-7). They are aligned longitudinally. Both gray and white matter tracts are involved, and in an acute lesion, there may some associated cord swelling. In multiple sclerosis, cord lesions tend to extend for a short length (one or two vertebral levels) whereas in acute disseminated encephalomyelitis they are substantially longer.
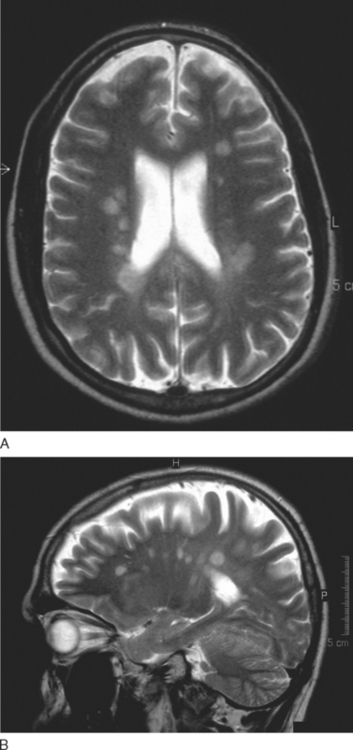
Figure 77-6 T2-weighted MRI demonstrating (A) periventricular and (B) corpus callosal lesions.
(Courtesy of the Department of Neuroradiology, Royal Free Hospital.)
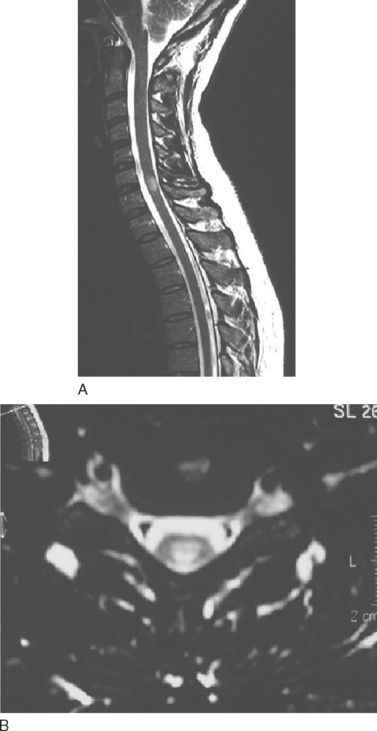
Figure 77-7 T2-weighted spinal MRI demonstrating a typical lesion at C6-7.
(Courtesy of the Department of Neuroradiology, Royal Free Hospital.)
There is a striking difference in the amount of T2 activity between the different types of multiple sclerosis. The greatest activity being found in relapsing and remitting compared with benign multiple sclerosis, which in turn exhibits more activity than patients with primary progressive disease.31
In patients who undergo serial imaging, new T2 hyperintensities occur at up to 10 times the rate of onset of new clinical symptoms.32 In clinically isolated syndromes, the number of T2-weighted lesions has prognostic value and correlates with the later likelihood of developing clinically definitive multiple sclerosis33 (Table 77-2). The lesion load over the first 5 years of disease is a predictor of cerebral atrophy 14 years later.34
Fully or semiautomated segmentation techniques allow quantification of the total burden of T2 lesional tissue. The overall volume of T2 lesion load increases with disease duration (by approximately 8% per annum, average volume approximately 20 mL for secondary progressive, 15 mL for primary progressive or relapsing and remitting), but there is no relationship between this and clinical deficit except for cognitive impairment.35 There are a number of possible reasons: (1) pathological heterogeneity of lesions, (2) insensitive methods of assessment such as the heavily motor function-biased Expanded Disability Status Scale (EDSS), and, most important, (3) cerebral lesions predominately occur in regions that are not clinically eloquent. There is an association between spinal cord cross-sectional area and EDSS, although not lesion load.36 Such automated techniques and the fact that T2-weighted MRI demonstrates considerably more evidence of disease activity have led to its being used in all major treatment trials, allowing fewer patients to be studied. However, despite considerable suppression of most MRI parameters (T2 lesion load, gadolinium-DTPA enhancement, T1 black holes), there is only modest suppression of relapses with most therapies.
Fluid-Attenuated Inversion Recovery
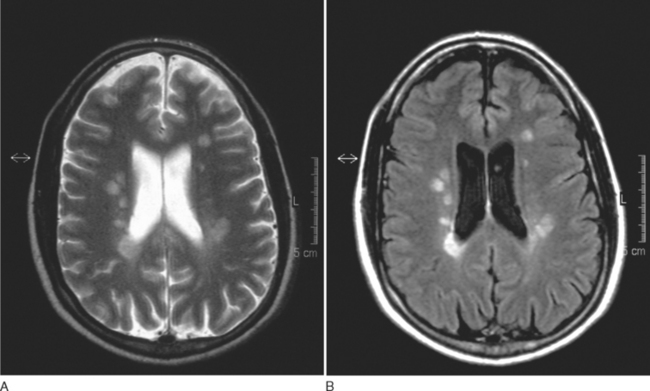
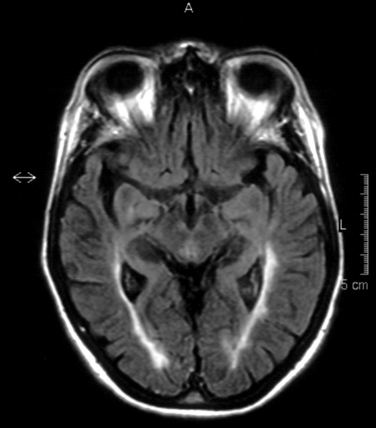
The FLAIR sequence was developed in order to overcome the difficulty due to high cerebrospinal fluid signal, which led to problems in differentiating subcortical lesions as well as cerebrospinal fluid from the commonly found periventricular lesions. More lesions are visualized37 (Fig. 77-8), although it is not especially good for detecting cord or posterior fossa lesions. Furthermore, normal brain tissue can give a misleadingly abnormal appearance (Fig. 77-9).
T1-Weighted Imaging
Gadolinium Enhancement
The paramagnetic and toxic rare earth metal gadolinium is rendered safe if chelated with EDTA. The chelation also serves to exclude from passage across a healthy brain barrier. One of the earliest magnetic resonance signs of new lesion activity is cerebral parenchymal enhancement (Fig. 77-10). This is invariably found at an anatomically appropriate site at the onset of a new clinical symptom.38 Experimental studies have demonstrated vesicular transendothelial passage of the brain barrier marker, as an active process.39 In multiple sclerosis, correlation with pathology has confirmed inflammatory change at the site of enhancement.40 The degree of enhancement in multiple sclerosis usually lasts for 4 to 6 weeks. It may be temporarily impeded by intravenous steroid therapy, possibly implying that restoration of blood-brain barrier function as a mode of action.41 A week after a 3-day course of intravenous methyl prednisolone, the degree of enhancement is at the level one would have predicted without steroids. As lesions age, the pattern of enhancement appears to be more peripheral and, despite the evolution of an area of T1 enhancement expanding, retracting, and then leaving an area of T2 high signal, brain mapping has demonstrated that areas of T1 enhancement tend to lie more deeply within the white matter rather than the periventricular areas favored by T2 lesions.
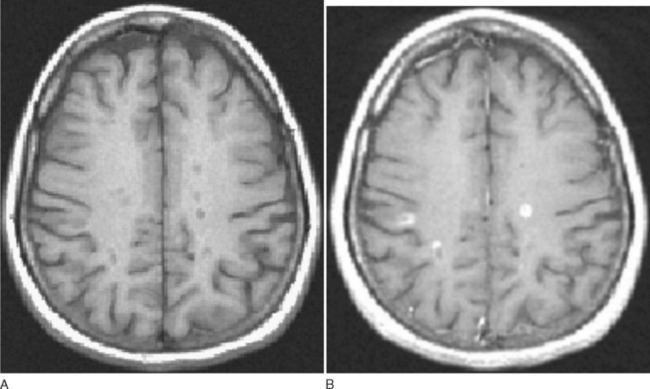
Figure 77-10 T1-weighted MRI demonstrating black holes (A) that enhance with gadolinium (B).
(Courtesy of Dr. G. Giovanonni, Institute of Neurology, London, England.)
If the lesion lies completely within white matter, an initial ring of enhancement that fills from the periphery is seen. But if it lies at the gray-white matter interface, then the ring is incomplete and open to the gray matter. The number of lesions detected increases with dose of contrast medium and the timing of imaging following infusion.42
T1 Hypointensities
A proportion of T2 lesions appear hypointense (also known as “black holes”) on T1 imaging (Fig. 77-10). These correlate best with hyperintensities seen with FLAIR sequences. The hypointensities related to T2 lesions occur more frequently in progressive rather than relapsing patients. A substantial proportion (approximately 50%)43 of the black holes resolve within 6 months; the remainder tend to persist and represent various degrees of axonal loss.44 Clinical disability is more strongly correlated with the burden of T1 black holes than T2 lesions.45
RESEARCH PROTOCOLS
Magnetization Transfer Imaging
This technique facilitates imaging of protons within large molecules. Ordinarily, they would not be visualized as they are rigidly bound and have a very short T2; their signal will have been dissipated before image acquisition. An initial radiofrequency pulse selectively saturates the magnetization within tightly bound protons. This is then exchanged with adjacent relatively mobile protons, that is, those within the cerebrospinal fluid (Fig. 77-11). By comparing the signal obtained with and without the saturating radiofrequency pulse, a magnetization transfer ratio is obtained. A high ratio implies a high degree of exchange of magnetization. Tissue disruption leads to a reduced ratio.
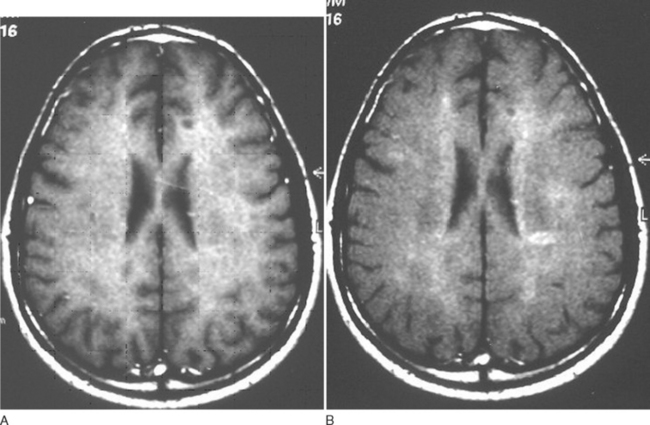
Figure 77-11 Magnetization transfer imaging before (A) and after (B) preexcitation pulse.
(Courtesy of the Department of Neuroradiology, Royal Free Hospital.)
Serial studies reveal reduction of magnetization transfer ratio before the appearance of gadolinium-enhancing lesions, which then reduces further at the onset of enhancement.46 The recovery has been shown to be greater in patients on interferon β-1B or steroids. A marked decline at the onset of inflammation is predictive of the subsequent development of a T1 black hole. If there is only a mild reduction, then an increase in the ratio tends to follow over the ensuing months. Reduction of magnetization transfer ratio has also been found within the normal-appearing white matter and gray matter. Reduction tends to be worse in patients with progressive illness. Two large studies have addressed this and revealed that reduction in magnetization transfer ratio at disease onset predicts disability in studies with follow-ups for 4.5 and 5 years.47,48 It has also been found to predict the development of clinically definite multiple sclerosis in patients with clinically isolated syndromes.49
Diffusion-Weighted Imaging
Diffusion-weighted imaging is a technique that measures the free random diffusion of mobile protons. Free diffusion is normally impeded by cellular structure. The usual pattern will be disrupted by disease processes altering the normal cytostructure. Diffusion-weighted imaging scans will show changes due to T2 effects and are distinguished by measuring the apparent diffusion coefficient. The apparent diffusion coefficient is especially high in acutely enhancing inflammatory lesions50 and in regions of axonal loss as evidenced by T1 black holes. Changes are particularly striking in areas where there is an obvious directional propensity, such as a white matter tract. There is close correlation between DTI of the pyramidal tracts and EDSS.51 The apparent diffusion coefficient is increased in normal-appearing white matter compared with healthy controls.52 Apparent diffusion coefficient also increases in normal-appearing white matter several weeks before the development of a new lesion, at which time there is a further substantial elevation.53
ATROPHY
Quantification techniques have been used to measure brain volumes and reveal evidence of atrophy occurring from very early in the disease course.54 The pathological basis is unclear and is not simply due to shrinkage in regions of T2 change. Atrophy within gray matter55 is a common feature not explained by the one sixth of lesions that are cortical but may perhaps be related to wallerian degeneration.56 The early onset of gray matter atrophy in the absence of similar changes in white matter suggests this is a more sensitive predictor of subsequent disability. The gray matter tends to be affected by a less inflammatory process.57 There seems to be no relationship between the degree of gadolinium-DTPA enhancement but possibly with T1 hypointensities58,59 It seems likely that there will be a contribution from the known but relatively unexplored changes seen in normal-appearing white matter. Patients with secondary progressive disease usually develop increasing paraplegia in the absence of a history of prior relapses leading to limb weakness. There is evidence of a genetic predisposition to the development of atrophy in that it is five times more common in carriers of the APOE e4 allele.60 Overall, there is an approximately 1.3% loss of cerebral parenchymal tissue per year with slightly higher rates in primary compared with secondary progressive disease. The highest rates seem to be in relapsing and remitting patients. As measures of atrophy are so readily reproducible and of great clinical relevance, they have been included as secondary outcome measures in trials of disease-modifying therapies. Both glatiramer and the β-interferons have been reported to reduce atrophic change.61
NUCLEAR MAGNETIC RESONANCE SPECTROSCOPY
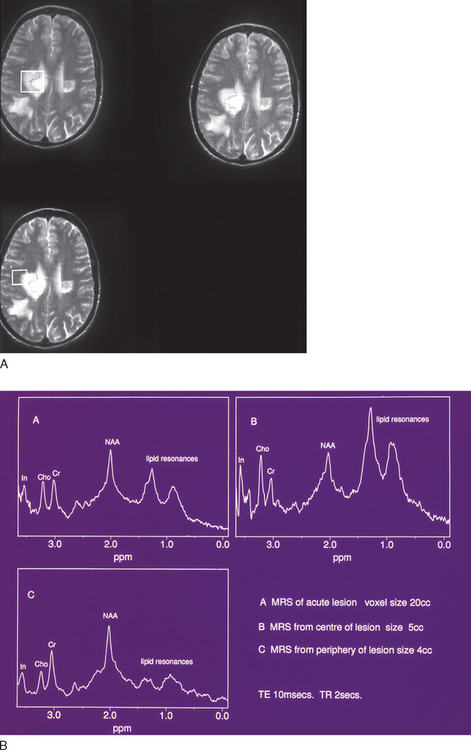
By suppression of the water resonance, other mobile protons that contribute to the MR signal may be visualized. However, due to the vast reduction in concentration (approximately 10,000-fold), either a very low resolution image or a spectrum is produced. In localized spectroscopy, three major peaks are resolved (Fig. 77-12). The first peak is the choline or, alternatively, the trimethylamine-containing peak, which is derived from compounds required for membrane synthesis and the products of its catabolism. The next peak is derived from creatine and phosphocreatine. These molecules are involved in energy metabolism and exist in equilibrium, the total concentration remaining constant. They are thus often used as an internal standard, semiquantitative results being quoted as ratios to the creatine/phosphocreatine peak. Finally, the N-acetyl-containing compound peak is formed predominantly from N-acetyl aspartate, an amino acid that resides solely within neurons. It has been described in the O2A progenitor cell and is believed to represent a marker for neuronal function. Other resonances may be resolved, attributed to amino acids such as glutamate, glutamine, γ-amino butyric acid, and myo-inositol. It is also possible to resolve peaks due to lactate and the products of myelin degradation.
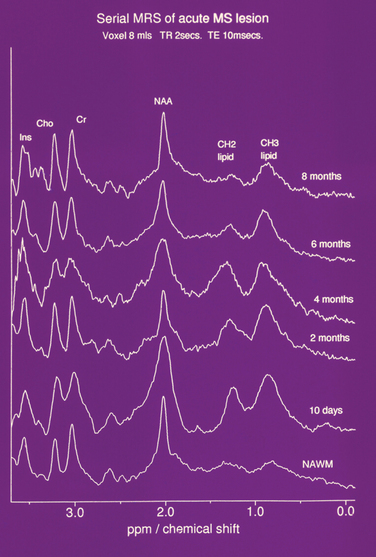
Figure 77-12 Serial NMR spectrum from an acute lesion compared with normal appearing white matter demonstrating lipid peaks.
(From Davie CA, Hawkins CP, Barker GJ, et al: Serial proton magnetic resonance spectroscopy in acute multiple sclerosis lesions. Brain 1994; 117:49-58. Reprinted by permission of Oxford University Press.)
Trimethylamine Resonance
The trimethylamine peak is elevated in new lesions,62 prompting speculation that it was due to demyelination (Fig. 77-13). However, there are similar findings in purely inflammatory experimental lesions. Furthermore, serial studies in multiple sclerosis have revealed an elevation localized to normal-appearing white matter several weeks before the onset of a new T2 and gadolinium-DTPA-enhancing lesion.63 The trimethylamine peak then increases further. These findings imply ongoing cellular activity before the onset of inflammatory change or impairment of blood-brain barrier function. We have studied by high-field nuclear magnetic resonance (NMR) spectroscopy the components of the trimethylamine peak and found that the elevation was due to increases in choline, phosphorylcholine, and especially betaine,64 an intracellular osmolyte.65 This may imply an abnormality in water homeostasis.
N-Acetyl Resonance
There is a reduction of N-acetyl aspartate in normal-appearing white and gray matter when compared with controls. In acute lesions, the N-acetyl aspartate resonance diminishes. It then gradually increases over ensuing weeks and months but may not recover to its previous level66 (Fig. 77-14). The reduction is most marked and persistent in the center of the lesion. Periventricular N-acetyl aspartate/creatine ratios have been found to be related to duration of disease as well as EDSS. As with other attempts at clinicoradiological correlation, the strongest association appears to be with cognition.
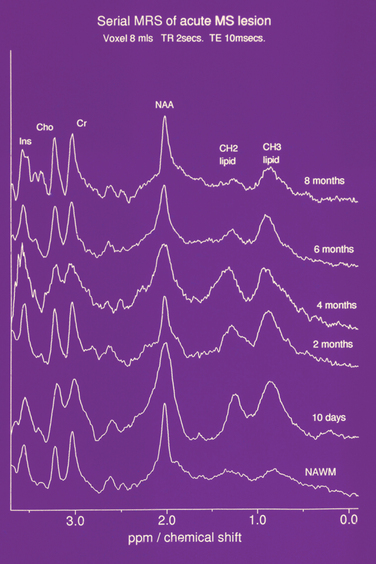
The partial reversibility of the reduction suggests that it may be metabolic. We have studied N-acetyl aspartate synthesis in intact cerebral mitochondrial preparations isolated from animals with acute EAE. We found a substantial reduction in synthesis rate in the experimental (37.4 ± 3.9nmol/min/mg protein) compared with controls (64.5 ± 7.5nmol/min/mg protein) (unpublished results). It has been proposed that N-acetyl aspartate functions as a molecular water pump. A single N-acetyl aspartate molecule has the ability to transport 32 molecules of water against a concentration gradient.67 It is thus feasible that the increase in trimethylamine at the onset of a new lesion is in response to neuronal mitochondrial dysfunction leading to reduced N-acetyl aspartate production and consequent impairment of osmoregulation. It is of course interesting to speculate on the pathogenic role of the recently described (NMO-Igg) NMO-immunoglobulin G to the water channel protein, aquaporin-4.
MAGNETIC RESONANCE IMAGING DIAGNOSIS OF MULTIPLE SCLEROSIS
In 2001, the International Panel on the Diagnosis of Multiple Sclerosis presented what was soon to be known as the “McDonald Criteria.”68 These criteria allowed the incorporation of new MRI activity as evidence of new lesions and thus formalize the diagnosis at an earlier stage. In 2005, following widespread support and after further suggestions, the criteria were revised69 (Table 77-3).
Note: A spinal lesion can be considered as infratentorial and may contribute to the total number of T2 hyperintensities.
An enhancing cord lesion is considered equivalent to an enhancing brain lesion.
Bakshi R, Minagar A, Jaisani Z, et al. Imaging of multiple sclerosis: role in neurotherapeutics. NeuroRx. 2005;2:277-303.
Freedman multiple sclerosis, Thompson EJ, Deisenhammer F, et al. Recommended standard of cerebrospinal fluid analysis in the diagnosis of multiple sclerosis: a consensus statement. Arch Neurol. 2005;62:865-870.
McDonald WI, Compston A, Edan G, et al. Recommended diagnostic criteria for multiple sclerosis: guidelines from the International Panel on the diagnosis of multiple sclerosis. Ann Neurol. 2001;50:121-127.
Polman CH, Reingold SC, Edan G, et al. Diagnostic criteria for multiple sclerosis: 2005 revisions to the McDonald criteria. Ann Neurol. 2005;58:840-846.
Walsh P, Kane N, Butler S. The clinical role of evoked potentials. J Neurol Neurosurg Psychiatry. 2005;76(Suppl 2):16-22.
1 Tourtellotte WW, Parker JA. Multiple sclerosis: correlation between immunoglobulin-G in cerebrospinal fluid and brain. Science. 1966;154:1044-1045.
2 McLean BN, Luxton RW, Thompson EJ. A study of immunoglobulin G in the cerebrospinal fluid of 1007 patients with suspected neurological disease using isoelectric focusing and the Log IgG-Index. A comparison and diagnostic applications. Brain. 1990;113:1269-1289.
3 Kesselring J, Miller DH, Robb SA, et al. Acute disseminated encephalomyelitis. MRI findings and the distinction from multiple sclerosis. Brain. 1990;113:291-302.
4 Zeman A, McLean B, Keir G, et al. The significance of serum oligoclonal bands in neurological diseases. J Neurol Neurosurg Psychiatry. 1993;56:32-35.
5 Freedman multiple sclerosis, Thompson EJ, Deisenhammer F, et al. Recommended standard of cerebrospinal fluid analysis in the diagnosis of multiple sclerosis: a consensus statement. Arch Neurol. 2005;62:865-870.
6 Andersson M, Alvarez-Cermeño J, Bernardi G, et al. Cerebrospinal fluid in the diagnosis of multiple sclerosis: a consensus report. J Neurol Neurosurg Psychiatry. 1994;57:897-902.
7 Polman CH, Reingold SC, Edan G, et al. Diagnostic criteria for multiple sclerosis: 2005 revisions to the McDonald criteria. Ann Neurol. 2005;58:840-846.
8 Wolinsky JS. The diagnosis of primary progressive multiple sclerosis. J Neurol Sci. 2003;206:145-152.
9 Halliday AM, Wakefield GS. Cerebral evoked potentials in patients with dissociated sensory loss. J Neurol Neurosurg Psychiatry. 1963;26:211-219.
10 Halliday AM, McDonald WI, Mushin J. Delayed visual evoked response in optic neuritis. Lancet. 1972;1:982-985.
11 Halliday AM, McDonald WI, Mushin J. Visual evoked response in diagnosis of multiple sclerosis. Br Med J. 1973;4:661-664.
12 Matthews WB, Small DG. Serial recording of visual and somatosensory evoked potentials in multiple sclerosis. J Neurol Sci. 1979;40:11-21.
13 Walsh P, Kane N, Butler S. The clinical role of evoked potentials. Journal of neurology neurosurgery and psychiatry. J Neurol Neurosurg Psychiatry. 2005;76(suppl 2):16-22.
14 Filippini G, Comi GC, Cosi V, et al. Sensitivities and predictive values of paraclinical tests for diagnosing multiple sclerosis. J Neurol. 1994;241:132-137.
15 Aminoff MJ, Eisen AA. AAEM minimonograph 19: somatosensory evoked potentials. Muscle Nerve. 1998;21:277-290.
16 Trojaborg W, Petersen E. Visual and somatosensory evoked cortical potentials in multiple sclerosis. J Neurol Neurosurg Psychiatry. 1979;42:323-330.
17 Gronseth GS, Ashman EJ. Practice parameter: the usefulness of evoked potentials in identifying clinically silent lesions in patients with suspected multiple sclerosis (an evidence-based review): Report of the Quality Standards Subcommittee of the American Academy of Neurology. Neurology. 2000;54:1720-1725.
18 Barker AT, Jalinous R, Freeston IL. Non-invasive magnetic stimulation of human motor cortex. Lancet. 1985;1:1106-1107.
19 Hess CW, Mills KR, Murray NM, et al. Magnetic brain stimulation: central motor conduction studies in multiple sclerosis. Ann Neurol. 1987;22:744-752.
20 Kidd D, Thompson PD, Day BL, et al. Central motor conduction time in progressive multiple sclerosis. Correlations with MRI and disease activity. Brain. 1998;121:1109-1116.
21 Cala LA, Mastaglia FL. Computerised axial tomography in multiple sclerosis. Lancet. 1976;1:689.
22 Lidegaard O, Gyldensted C, Juhler M, et al. CT findings in acute multiple sclerosis. Acta Neurol Scand. 1983;68:77-83.
23 Aita JF. Cranial CT and multiple sclerosis: contrast-enhancing lesions. Arch Neurol. 1978;35:183.
24 Drayer BP, Barrett L. Magnetic resonance imaging and CT scanning in multiple sclerosis. Ann N Y Acad Sci. 1984;436:294-314.
25 Young IR, Hall AS, Pallis CA, et al. Nuclear magnetic resonance imaging of the brain in multiple sclerosis. Lancet. 1981;2:1063-1066.
26 Poser CM. MRI and CT scan in multiple sclerosis. JAMA. 1985;253:3250.
27 Ormerod IE, Miller DH, McDonald WI, et al. The role of NMR imaging in the assessment of multiple sclerosis and isolated neurological lesions. A quantitative study. Brain. 1987;110:1579-1616.
28 Thorpe JW, Kidd D, Moseley IF, et al. Spinal MRI in patients with suspected multiple sclerosis and negative brain MRI. Brain. 1996;119:709-714.
29 Newcombe J, Hawkins CP, Henderson CL, et al. Histopathology of multiple sclerosis lesions detected by magnetic resonance imaging in unfixed postmortem central nervous system tissue. Brain. 1991;114:1013-1023.
30 Lycklama G, Thompson A, Filippi M, et al. Spinal-cord MRI in multiple sclerosis. Lancet Neurol. 2003;2:555-562.
31 Thompson AJ, Kermode AG, MacManus DG, et al. Patterns of disease activity in multiple sclerosis: clinical and magnetic resonance imaging study. BMJ. 1990;300:631-634.
32 Paty DW, Li DK, Oger JJ, et al. Magnetic resonance imaging in the evaluation of clinical trials in multiple sclerosis. Ann Neurol. 1994;36(suppl):S95-S96.
33 Brex PA, Ciccarelli O, O’Riordan JI, et al. A longitudinal study of abnormalities on MRI and disability from multiple sclerosis. N Engl J Med. 2002;346:158-164.
34 Chard DT, Brex PA, Ciccarelli O, et al. The longitudinal relation between brain lesion load and atrophy in multiple sclerosis: a 14 year follow up study. J Neurol Neurosurg Psychiatry. 2003;74:1551-1554.
35 Ron MA, Callanan MM, Warrington EK. Cognitive abnormalities in multiple sclerosis: a psychometric and MRI study. Psychol Med. 1991;21:59-68.
36 Kidd D, Thorpe JW, Thompson AJ, et al. Spinal cord MRI using multi-array coils and fast spin echo. II. Findings in multiple sclerosis. Neurology. 1993;43:2632-2637.
37 Filippi M, Yousry T, Baratti C, et al. Quantitative assessment of MRI lesion load in multiple sclerosis. A comparison of conventional spin-echo with fast fluid-attenuated inversion recovery. Brain. 1996;119:1349-1355.
38 Grossman RI, Gonzalez SF, Atlas SW, et al. Multiple sclerosis: gadolinium enhancement in MR imaging. Radiology. 1986;161:721-725.
39 Hawkins CP, Munro PM, Landon DN, et al. Metabolically dependent blood-brain barrier breakdown in chronic relapsing experimental allergic encephalomyelitis. Acta Neuropathol. 1992;83:630-635.
40 Brück W, Bitsch A, Kolenda H, et al. Inflammatory central nervous system demyelination: correlation of magnetic resonance imaging findings with lesion pathology. Ann Neurol. 1997;42:783-793.
41 Miller DH, Thompson AJ, Morrissey SP, et al. High dose steroids in acute relapses of multiple sclerosis: MRI evidence for a possible mechanism of therapeutic effect. J Neurol Neurosurg Psychiatry. 1992;55:450-453.
42 Silver NC, Good CD, Barker GJ, et al. Sensitivity of contrast enhanced MRI in multiple sclerosis. Effects of gadolinium dose, magnetization transfer contrast and delayed imaging. Brain. 1997;120:1149-1161.
43 Bagnato F, Jeffries N, Richert ND, et al. Evolution of T1 black holes in patients with multiple sclerosis imaged monthly for 4 years. Brain. 2003;126:1782-1789.
44 van Walderveen MA, Kamphorst W, Scheltens P, et al. Histopathologic correlate of hypointense lesions on T1-weighted spin-echo MRI in multiple sclerosis. Neurology. 1998;50:1282-1288.
45 Truyen L, van Waesberghe JH, van Walderveen MA, et al. Accumulation of hypointense lesions (black holes) on T1 spin-echo MRI correlates with disease progression in multiple sclerosis. Neurology. 1996;47:1469-1476.
46 Filippi M, Rocca MA, Martino G, et al. Magnetization transfer changes in the normal appearing white matter precede the appearance of enhancing lesions in patients with multiple sclerosis. Ann Neurol. 1998;43:809-814.
47 Rovaris M, Agosta F, Sormani MP, et al. Conventional and magnetization transfer MRI predictors of clinical multiple sclerosis evolution: a medium-term follow-up study. Brain. 2003;126:2323-2332.
48 Santos AC, Narayanan S, de Stefano N, et al. Magnetization transfer can predict clinical evolution in patients with multiple sclerosis. J Neurol. 2002;249:662-668.
49 Iannucci G, Tortorella C, Rovaris M, et al. Prognostic value of MR and magnetization transfer imaging findings in patients with clinically isolated syndromes suggestive of multiple sclerosis at presentation. AJNR Am J Neuroradiol. 2000;21:1034-1038.
50 Droogan AG, Clark CA, Werring DJ, et al. Comparison of multiple sclerosis clinical subgroups using navigated spin echo diffusion-weighted imaging. Magn Reson Imaging. 1999;17:653-661.
51 Wilson M, Tench CR, Morgan PS, et al. Pyramidal tract mapping by diffusion tensor magnetic resonance imaging in multiple sclerosis: improving correlations with disability. J Neurol Neurosurg Psychiatry. 2003;74:203-207.
52 Horsfield MA, Lai M, Webb SL, et al. Apparent diffusion coefficients in benign and secondary progressive multiple sclerosis by nuclear magnetic resonance. Magn Reson Med. 1996;36:393-400.
53 Werring DJ, Brassat D, Droogan AG, et al. The pathogenesis of lesions and normal-appearing white matter changes in multiple sclerosis: a serial diffusion MRI study. Brain. 2000;123:1667-1676.
54 Brex PA, Jenkins R, Fox NC, et al. Detection of ventricular enlargement in patients at the earliest clinical stage of multiple sclerosis. Neurology. 2000;54:1689-1691.
55 De Stefano N, Matthews PM, Filippi M, et al. Evidence of early cortical atrophy in multiple sclerosis: relevance to white matter changes and disability. Neurology. 2003;60:1157-1162.
56 Ge Y, Grossman RI, Udupa JK, et al. Brain atrophy in relapsingremitting multiple sclerosis: fractional volumetric analysis of gray matter and white matter. Radiology. 2001;220:606-610.
57 Peterson JW, Bö L, Mörk S, et al. Transected neurites, apoptotic neurons, and reduced inflammation in cortical multiple sclerosis lesions. Ann Neurol. 2001;50:389-400.
58 Rudick RA, Fisher E, Lee JC, et al. Use of the brain parenchymal fraction to measure whole brain atrophy in relapsingremitting multiple sclerosis. Multiple Sclerosis Collaborative Research Group. Neurology. 1999;53:1698-1704.
59 Bakshi R, Benedict RH, Bermel RA, et al. Regional brain atrophy is associated with physical disability in multiple sclerosis: semiquantitative magnetic resonance imaging and relationship to clinical findings. J Neuroimaging. 2001;11:129-136.
60 Enzinger C, Ropele S, Smith S, et al. Accelerated evolution of brain atrophy and black holes in multiple sclerosis patients with APOE-epsilon 4. Ann Neurol. 2004;55:563-569.
61 Bermel RA, Bakshi R. The measurement and clinical relevance of brain atrophy in multiple sclerosis. Lancet Neurol. 2006;5:158-170.
62 Matthews PM, Francis G, Antel J, et al. Proton magnetic resonance spectroscopy for metabolic characterization of plaques in multiple sclerosis. Neurology. 1991;41:1251-1256.
63 Narayana PA, Doyle TJ, Lai D, et al. Serial proton magnetic resonance spectroscopic imaging, contrast-enhanced magnetic resonance imaging, and quantitative lesion volumetry in multiple sclerosis. Ann Neurol. 1998;43:56-71.
64 Brenner RE, Munro PM, Williams SC, et al. The proton NMR spectrum in acute EAE: the significance of the change in the Cho:Cr ratio. Magn Reson Med. 1993;29:737-745.
65 Petronini PG, De Angelis EM, Borghetti P, et al. Modulation by betaine of cellular responses to osmotic stress. Biochem J. 1992;282:69-73.
67 Baslow MH. N-acetylaspartate in the vertebrate brain: metabolism and function. Neurochem Res. 2003;28:541-553.
68 McDonald WI, Compston A, Edan G, et al. Recommended diagnostic criteria for multiple sclerosis: guidelines from the International Panel on the diagnosis of multiple sclerosis. Ann Neurol. 2001;50:121-127.
69 Polman CH, Reingold SC, Edan G, et al. Diagnostic criteria for multiple sclerosis: 2005 revisions to the McDonald criteria. Ann Neurol. 2005;58:840-846.