Chapter 12 Investigation of the hereditary haemolytic anaemias
membrane and enzyme abnormalities
The various initial steps to be taken in the investigation of a patient suspected of having a haemolytic anaemia are outlined in Chapter 11 and the changes in red cell morphology that may be found in haemolytic anaemias are illustrated in Chapter 5. This chapter describes procedures useful in investigating haemolytic anaemias suspected to result from defects within the red cell membrane or deficiency of enzymes important in red cell metabolism.
Investigation of membrane defects
Procedures to assess red cell flexibility (rigidity) using polycarbonate membrane filtration,1 and red cell deformability measurements on specialized equipment such as the Laser-assisted Optical Rotational Cell Analyser (LORCA)2 have been described elsewhere.
Osmotic fragility as measured by lysis in hypotonic saline
Principle
The method to be described is based on that of Parpart et al.3 Small volumes of blood are mixed with a large excess of buffered saline solutions of varying concentration. The fraction of red cells lysed at each saline concentration is determined colorimetrically. The test is normally carried out at room temperature (15–25°C).
Method
Notes
Osmotic Fragility after Incubating the Blood at 37°C for 24 Hours
Method
Defibrinated blood should be used, care being taken to ensure that sterility is maintained.
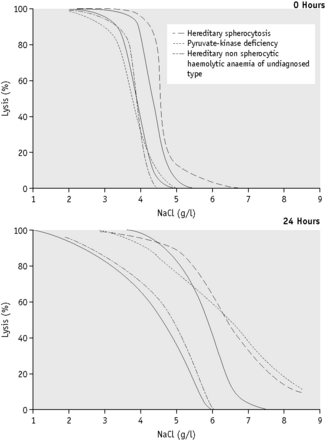
Because the fragility may be markedly increased (Fig. 12.2), set up additional hypotonic solutions containing 7.0 g/l and 8.0 g/l NaCl. In addition, use a solution equivalent to 12.0 g/l NaCl because sometimes, as in HS, lysis may take place in 9.0 g/l NaCl. In this case, use the supernatant of the tube containing 12.0 g/l NaCl as the blank in the colorimetric estimation.
The incubation fragility test is conveniently combined with the estimation of the amount of spontaneous autohaemolysis (p. 252).
Factors Affecting Osmotic Fragility Tests
The extent of the effect of pH and temperature on osmotic fragility was well illustrated in the paper of Parpart et al.3 The effect of pH is more important: a shift of 0.1 of a pH unit is equivalent to altering the saline concentration by 0.1 g/l, the fragility of the red cells being increased by a decrease in pH. An increase in temperature decreases the fragility, an increase of 5°C being equivalent to an increase in saline concentration of about 0.1 g/l.
Further details of the factors that affect and control haemolysis of red cells in hypotonic solutions were given by Murphy.4
Recording the Results of Osmotic Fragility Tests
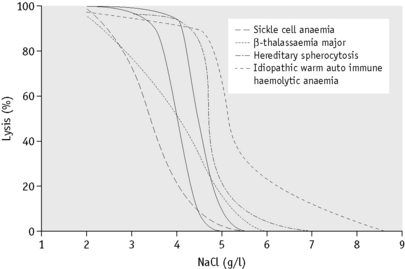
In the past, osmotic fragility most often has been expressed in terms of the highest concentration of saline at which lysis is just detectable (initial lysis or minimum resistance) and the highest concentration of saline in which lysis appears to be complete (complete lysis or maximum resistance). It is, however, useful also to record the concentration of saline causing 50% lysis (i.e. the median corpuscular fragility, MCF) and to inspect the entire fragility curve (Fig. 12.1). The findings in health are summarized in Table 12.1.
| Fresh blood (g/l NaCl) | Blood incubated 24 h, 37°C (g/l NaCl) | |
|---|---|---|
| Initial lysis | 5.0 | 7.0 |
| Complete lysis | 3.0 | 2.0 |
| MCF (50% lysis) | 4.0–4.45 | 4.65–5.9 |
MCF, median corpuscular fragility.
Alternative methods of recording osmotic fragility
In disease, tailed curves also skew the line to varying degrees at the other end of the probability plot. To obtain increment-haemolysis curves, the differences in lysis between adjacent tubes are plotted against the corresponding saline concentrations. Definitely bimodal curves may be obtained during recovery from a haemolytic episode.5
Interpretation of Results
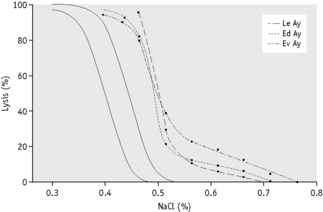
The osmotic fragility of freshly taken red cells reflects their ability to take up a certain amount of water before lysing. This is determined by their volume-to-surface area ratio. The ability of the normal red cell to withstand hypotonicity results from its biconcave shape, which allows the cell to increase its volume by about 70% before the surface membrane is stretched; once this limit is reached lysis occurs.6 Spherocytes have an increased volume-to-surface area ratio; their ability to take in water before stretching the surface membrane is thus more limited than normal and they are therefore particularly susceptible to osmotic lysis. The increase in osmotic fragility is a property of the spheroidal shape of the cell and is independent of the cause of the spherocytosis. Characteristically, osmotic fragility curves from patients with HS who have not been splenectomized show a ‘tail’ of very fragile cells (Fig. 12.3). When plotted on probability paper, the graph indicates two populations of cells: the very fragile and the normal or slightly fragile. After splenectomy the red cells are more homogeneous, the osmotic fragility curve indicating a more continuous spectrum of cells, from fragile to normal.
Decreased osmotic fragility indicates the presence of unusually flattened red cells (leptocytes) in which the volume-to-surface area ratio is decreased. Such a change occurs in iron deficiency anaemia and thalassaemia in which the red cells with a low mean cell haemoglobin (MCH) and mean cell volume (MCV) are unusually resistant to osmotic lysis (Fig. 12.1). A simple one-tube osmotic fragility is a useful screening test for β thalassaemia and some haemoglobinopathies in countries with a high incidence of these abnormalities (p. 612). Reticulocytes and red cells from patients who have been splenectomized also tend to have a greater amount of membrane compared with normal cells and are osmotically resistant. In liver disease, target cells may be produced by passive accumulation of lipid and these cells, too, are resistant to osmotic lysis.7
The osmotic fragility of red cells after incubation for 24 h at 37°C is also a reflection of their volume-to-surface area ratio, but the factors that alter this ratio are more complicated than in fresh red cells. The increased osmotic fragility of normal red cells, which occurs after incubation (Fig. 12.2), is mainly caused by swelling of the cells associated with an accumulation of sodium that exceeds loss of potassium. Such cation exchange is determined by the membrane properties of the red cell, which control the passive flux of ions, and the metabolic competence of the cell, which determines the active pumping of cations against concentration gradients. During incubation for 24 h, the metabolism of the red cell becomes stressed and the pumping mechanisms tend to fail, one factor being a relative lack of glucose in the medium.
The osmotic fragility of red cells that have an abnormal membrane, such as those of HS and hereditary elliptocytosis (HE), increases abnormally after incubation (Fig. 12.2). Similar results occur in hereditary stomatocytosis.8 The results with red cells with a glycolytic deficiency, such as those of pyruvate kinase (PK) deficiency, are variable. In severe deficiencies, osmotic fragility may increase substantially (Fig. 12.2), but, in other cases, the fragility may decrease owing to a greater loss of potassium than gain of sodium. In thalassaemia major and minor, osmotic fragility is frequently markedly reduced after incubation, again owing to a marked loss of potassium.9 A similar, although usually less marked, change is seen in iron deficiency anaemia.
To summarize, measurement of red cell osmotic fragility provides a useful indication as to whether a patient’s red cells are normal because an abnormal result invariably indicates abnormality. The reverse is, however, not true (i.e. a result that is within the normal range does not mean that the red cells are normal). The findings in some important haemolytic anaemias are summarized in Table 12.2.
Table 12.2 Osmotic fragility in haemolytic anaemias: a summary
| Condition | Notes |
|---|---|
| A. Associated with increased osmotic fragility (OF) | |
| Hereditary spherocytosis (HS) | Entire curve may be ‘shifted to the right’, or most of it may be within the normal range but with a ‘tail’ of fragile cells. Curve within normal range in 10–20% of cases. After incubation for 24 h, abnormalities usually more marked, but still some false-negative results. Splenectomy does not affect MCF but reduces the tail of fragile cells |
| Hereditary elliptocytosis (HE) | As in HS, but in general changes less marked. Abnormal OF usually correlates with severity of haemolysis (i.e. OF is normal in non-haemolytic HE) |
| Hereditary stomatocytosis | As in HS with large osmotically fragile cells with low MCHC |
| Other inherited membrane abnormalities | Results variable; with milder disorders curve more likely to be abnormal after incubation for 24 h |
| Autoimmune haemolytic anaemia | Tail of fragile cells roughly proportional to number of spherocytes; rest of curve normal (or even left-shifted on account of reticulocytosis) |
| B. Associated with decreased OF | |
| Thalassaemia | MCF decreased in all forms of thalassaemia, except in some α thalassaemia heterozygotes; usually the entire curve is left-shifted |
| Enzyme abnormalities | OF usually normal (anaemia originally referred to as hereditary nonspherocytic), but tail of highly resistant cells may be seen on account of high reticulocyte court. After incubation for 24 h, there may be a tail of fragile cells |
| Hereditary xerocytosis | Increased resistance to osmotic lysis and increased MCHC |
| Iron deficiency | Curve shifted to left, wholly or partly, depending on proportion of hypochromic red cells |
OF, osmotic fragility; HE, hereditary elliptocytosis; HS, hereditary spherocytosis; MCF, median corpuscular fragility; MCHC, mean cell haemoglobin concentration.
Flow cytometric (dye-binding) test
Principle
The osmotic fragility test lacks specificity and sensitivity and fails to detect atypical or mild HS. Moreover, it can be affected by factors unrelated to red cell cytoskeletal defects; for example, positive results may be obtained for red cells from patients who are pregnant or who have immune or other haemolytic anaemias or renal failure. The flow cytometric (dye-binding) test of King and colleagues10 measures the fluorescent intensity of intact red cells labelled with eosin-5-maleimide (EMA), which reacts covalently with Lys-430 on the first extracellular loop of Band 3 protein. The N-terminal cytoplasmic domain of Band 3 interacts with ankyrin and protein 4.2, which in turn crosslink with the spectrin-based cytoskeleton and stabilizes the membrane lipid bilayer.11 Deficiency or abnormality of Band 3 may result in decreased fluorescence. This is seen in HS red cells but has also been observed in cases of South-east Asian ovalocytosis, congenital dyserythropoietic anaemia Type II and the stomatocytic variant, cryohydrocytosis. Blood samples in ethylenediaminetetra-acetic acid (EDTA) may be analysed for up to 48 h after collection provided they have been stored in the refrigerator.
Glycerol lysis-time tests
The osmotic fragility test is somewhat cumbersome and requires 2 ml or more of whole blood. It is thus not suitable for use in newborn babies or as a population screening test. In 1974, Gottfried and Robertson12 introduced a glycerol lysis-time (GLT) test, a one-tube test, to measure the time taken for 50% haemolysis of a blood sample in a buffered hypotonic saline–glycerol mixture. The original method had greater sensitivity in the osmotic-resistant range, but it also could identify most patients with HS by a shorter GLT50. Better identification of HS blood from normal was obtained by 24-h incubation of samples and by modifying the glycerol reagent.13 Zanella et al modified the original test further by decreasing the pH.14 There is some loss of specificity for HS with the acidified glycerol lysis-time test (AGLT) compared with the original method, but in practice this loss is unimportant.
Acidified Glycerol Lysis-Time Test
Results
Normal blood takes more than 30 min (1800 s) to reach the AGLT50. The time taken is similar for blood from normal adults, newborn infants and cord samples. In patients with HS, the range of the AGLT50 is 25–150 s. A short AGLT50 may also be found in chronic renal failure, chronic leukaemias and autoimmune haemolytic anaemia; it also may be found in some pregnant women.14
Cryohaemolysis Test
Principle
Whereas osmotic fragility may be abnormal in any condition where spherocytes occur, it has been suggested that cryohaemolysis is specific for HS.15 This appears to result from the fact that the latter is dependent on factors that are related to molecular defects of the red cell membrane rather than to changes in the surface area-to-volume ratio. The test can be carried out on EDTA blood up to 1 day old.
Method15
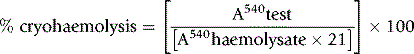
Interpretation
Streichman et al.15 report the range of cryohaemolysis in normal subjects to be 3–15%, whereas in hereditary spherocytosis there is >20% lysis. However, it is recommended that individual laboratories establish their own reference values for the method. We have found that most normal samples give <3% lysis. Increased lysis is not exclusive to hereditary spherocytosis and may be observed in hereditary stomatocytosis.
Autohaemolysis: spontaneous haemolysis developing in blood incubated at 37°c for 48 hours
The autohaemolysis test is useful as an initial screen in suspected cases of haemolytic anaemia. It provides information about the metabolic competence of the red cells and helps to distinguish membrane and enzyme defects if the results of the tests are taken together with other observations such as morphology, inheritance and the presence or absence of associated clinical disorders.16
Defibrinating Blood
Defibrinate blood, as described on p. 5.
Estimate the spontaneous lysis by means of a colorimeter or a spectrometer at 540 nm.
As a rule, it is convenient to make a 1 in 10 dilution of the incubated serum in cyanide-ferricyanide (Drabkin’s) solution (p. 25), unless there is marked haemolysis, when a 1 in 25 or 1 in 50 dilution is more suitable. A corresponding dilution of the preincubation serum is used as a blank and a 1 in 100 or 1 in 200 dilution of the whole blood in Drabkin’s solution indicates the total amount of Hb present and serves as a standard.
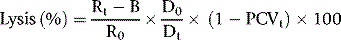
where R0 = reading of diluted whole blood; Rt = reading of diluted serum at 48 h; B = reading of blank; PCVt = packed cell volume at time t; D0 = dilution of whole blood (e.g. 1 in 200 = 0.005); and Dt = dilution of serum (e.g. 1 in 10 = 0.1).
Normal Range of Autohaemolysis
Lysis at 48 h: without added glucose, 0.2–2.0%; with added glucose, 0–0.9%.
The results obtained are sensitive to slight differences in technique and each laboratory should use a carefully standardized procedure and establish its own normal range. If the amount of liberated Hb is small, it is more accurate (although more time consuming) to measure lysis by a chemical method rather than by a direct spectrometric method (p. 231). It can also be measured directly by a simple and rapid procedure with a HemoCue Plasma/Low Hb system.17
Significance of Increased Autohaemolysis
Little or no lysis takes place when normal blood is incubated for 24 h under sterile conditions and the amount present after 48 h is small.16 If glucose is added so that it is present throughout the incubation, the development of lysis is markedly slowed. The amount of autohaemolysis that occurs after 48 h with and without glucose is determined by the properties of the membrane and the metabolic competence of the red cell. In membrane disorders such as HS, the rate of glucose consumption is increased to compensate for an increased cation leak through the membrane.8 During the 48-h incubation, glucose is therefore used up relatively rapidly so that energy production fails more quickly than normal unless glucose is added. This is one factor that contributes to the increased rate of autohaemolysis in HS. Usually, but not always, the addition of glucose to the blood decreases the rate of autohaemolysis in HS. This was referred to as Type 1 autohaemolysis.16 When the utilization of glucose via the glycolytic pathway is impaired, as in PK deficiency, the rate of autohaemolysis at 48 h is usually increased but glucose fails to correct or may even aggravate lysis (Type 2 autohaemolysis).8 Although a similar result may be seen in severe HS (Type B), in the absence of spherocytosis failure of glucose to diminish autohaemolysis is a strong indication of a glycolytic block. Blood from patients with G6PD deficiency or other disorders of the pentose phosphate pathway may undergo a slight increase in autohaemolysis (without additional glucose), which is corrected by the addition of glucose. Commonly, the result is normal, but examination of the incubated blood may show an increase in methaemoglobin (Hi) (discussed later). Not all glycolytic enzyme deficiencies give a Type 2 reaction so that a Type 1 result does not exclude the possibility of such a defect.
The nucleosides adenosine, guanosine and inosine, like glucose, diminish the rate of autohaemolysis when added to blood. Remarkably, adenosine triphosphate (ATP) strikingly retards haemolysis in PK deficiency, although glucose itself is ineffective.18 ATP does not pass the red cell membrane.
The autohaemolysis test lacks specificity. This has drawn much criticism on the test, including the suggestion that it has no place in the screening of blood for inherited defects.19 The best way to detect metabolic defects in red cells is undoubtedly to measure glucose consumption, lactate production and the contribution to metabolism of the pentose phosphate pathway. These measurements are, unfortunately, difficult and are likely to be undertaken only by specialized laboratories. The autohaemolysis test does provide some information about the metabolic competence of the red cells and helps to distinguish membrane defects from enzyme defects.
Membrane protein analysis
Defects of red cell membrane proteins that constitute the cytoskeleton are associated with congenital haemolytic anaemias accompanied by characteristic morphological features. Their analysis is generally only possible in the setting of a reference laboratory. Sodium dodecyl sulfate (SDS) – polyacrylamide gel electrophoresis of the membranes will identify qualitative and quantitative alterations in the specific proteins. Densitometry of protein bands on the gel gives an overall profile, showing spectrin, ankyrin, Band 3 (the anion transport protein) and protein 4.2. Spectrin variants may be detected after limited trypsin digestion of spectrin extracted from the red cell membranes; an increase in spectrin dimer is indicative of an unstable tetramer, leading to susceptibility to red cell fragmentation in hereditary elliptocytosis and hereditary pyropoikilocytosis.20
Membrane protein defects implicated in hereditary haemolytic anaemias are listed in Table 12.3.
Table 12.3 Haemolytic anaemias associated with defects of red cell membrane proteins20
| Band | Protein | Haemolytic anaemia |
|---|---|---|
| 1 | α Spectrin | HE, HS, HPP |
| 2 | β Spectrin | HE, HS |
| 2.1 | Ankyrin | HS |
| 3 | Anion exchanger | HS, SAO, CDAII |
| 4.1 | Protein 4.1 | HE |
| 4.2 | Pallidin | HS |
| 7 | Stomatin | HSt |
| PAS-1 | Glycophorin A | CDAII |
| PAS-2 | Glycophorin C | HE |
CDAII, congenital dyserythropoietic anaemia Type II; HE, hereditary elliptocytosis; HPP, hereditary pyropoikilocytosis; HS, hereditary spherocytosis; HSt, hereditary stomatocytosis; SAO, South-east Asian ovalocytosis.
Detection of enzyme deficiencies in hereditary haemolytic anaemias
It is feasible for most haematology laboratories to identify the enzyme deficiencies of G6PD and PK and to indicate where the probable defect lies in less common disorders. Detailed investigation of the aberrant enzymes and of the metabolism of the abnormal cells is probably best undertaken by specialized laboratories. Comprehensive accounts of methods available for studying red cell metabolism are to be found in Beutler’s Red Cell Metabolism, a Manual of Biochemical Methods21 and in the ICSH recommendations.22
There are two stages in the diagnosis of red cell enzyme defects: first, screening procedures; and second, specific enzyme assays. The simple nonspecific screening procedures such as the osmotic fragility and autohaemolysis tests, which have already been described, may indicate the presence of a metabolic disorder and simple biochemical tests are available to show whether the disorder is in the pentose phosphate or the Embden–Meyerhof pathways; these intermediate stages of glycolysis are illustrated in Figure 12.4.
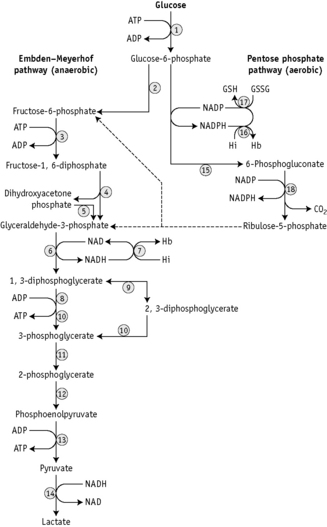
These investigations may be augmented by quantitation of the major red cell metabolites 2,3-DPG, ATP and GSH, which are present at millimolar concentrations and which can be assayed conveniently by spectrometric techniques. Metabolic block in the Embden–Meyerhof pathway is most accurately pinpointed by measurement of the concentration of glycolytic intermediates with demonstration of accumulation of metabolites proximal and depletion of metabolites distal to the defective step (Fig. 12.4). These assays, which are generally confined to specialized laboratories, must be performed on deproteinized red cell extracts immediately after preparation.
Screening Tests for G6PD Deficiency and Other Defects of the Pentose Phosphate Pathway
Many variants of the red cell enzyme G6PD have been detected and the methods used to identify variants have been standardized.23 Inheritance is sex-linked because the enzyme is controlled by one gene locus in the X chromosome. Variants that have deficient activity produce one of several types of clinical disorders. The two most common variants are the Mediterranean type, which has very low activity and which may lead to favism (i.e. acute intravascular haemolysis following the ingestion of broad beans), and the A– type found in Black populations in West Africa, the USA, the UK and elsewhere, which leads to primaquine sensitivity. Both groups are susceptible to haemolysis produced by oxidant drugs and infections.


NADPH is an important reducing compound for the conversion of oxidized glutathione (GSSG) to GSH (Fig. 12.4) and, under conditions of stress, the reconversion of Hi to Hb. Screening tests for G6PD deficiency depend on the inability of cells from deficient subjects to convert an oxidized substrate to a reduced state. The substrates used may be the natural one of the enzyme, NADP or other naturally occurring substrates linked by secondary reactions to the enzyme, for example, GSSG or Hi or artificial dyes such as methylene blue. The reaction is demonstrated by fluorescence,24 colour change when a dye is used,25 or deposit of a dye (e.g. a blue ring of formazan from diphenyltetrazolium bromide in the presence of phenazine methosulphate).26
Fluorescence Screening Test for G6PD Deficiency
The method of fluorescent screening test for G6PD deficiency is that of Beutler and Mitchell24 modified as recommended by ICSH.22
Reagents
Interpretation
Methaemoglobin Reduction Test
Principle
Sodium nitrite converts Hb to Hi. When no methylene blue is added, methaemoglobin persists, but incubation of the samples with methylene blue allows stimulation of the pentose phosphate pathway in subjects with normal G6PD levels. The Hi is reduced during the incubation period. In G6PD-deficient subjects, the block in the pentose phosphate pathway prevents this reduction.25
Reagents
Dextrose
280 mmol/l. Dissolve 5 g of dextrose (analytical grade) and 1.25 g of NaNO2 in 100 ml of water.
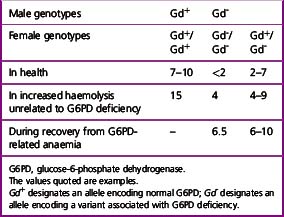
Detection of Heterozygotes for G6PD Deficiency
Females heterozygous for G6PD deficiency have two populations of cells, one with normal G6PD activity and the other with deficient G6PD activity. This is the result of inactivation of one of the two X chromosomes in individual cells early in the development of the embryo. All progeny cells (i.e. somatic cells) in females will have the characteristics of only the active X chromosome.27 The total G6PD activity of blood in the female will depend on the proportion of normal to deficient cells. In most cases, the activity will be between 20% and 80% of normal. However, a few heterozygotes (about 1%) may have almost only normal or almost only G6PD-deficient cells.
Test Kits
Several commercial kits are available for detection of G6PD deficiency. A fluorescent spot test (Trinity Biotech 203-A) and a test based on reduction of the dye dichloroindophenol to a colourless state in the presence of phenazine methosulphate (Trinity Biotech 400) are available commercially.*
The Quantase kit† is a photometric method for use on whole blood or dried blood spots; NADPH produced by oxidation of G6P to 6PG is measured by an increase in absorption at 340 nm.
Cytochemical tests for demonstrating defects of red cell metabolism
Cytochemical methods have been developed by means of which some of these defects are demonstrable in individual cells. Thus tests have been described for demonstrating red cells deficient in G6PD.28–30 The principle on which the methods are based is that red cells are treated with sodium nitrite to convert their oxyhaemoglobin (HbO2) to methaemoglobin (Hi). In the presence of G6PD, Hi reconverts to HbO2, but in G6PD deficiency, Hi persists. The blood is then incubated with a soluble tetrazolium compound (MTT), which will be reduced by HbO2 (but not by Hi) to an insoluble formazan form.
Attempts have been made to improve the reliability of the test for detecting heterozygotes (e.g. by controlled slight fixation of the red cells and accelerating the reaction with an exogenous electron carrier, 1-methoxyphenazine methosulphate).31 These cytochemical procedures are not more sensitive in the demonstration of G6PD deficiency than are the simple screening tests described above. They may, however, be useful in genetic studies and when assessing G6PD activity in women32; they may be the only way to detect deficiency in the heterozygous state.
Demonstration of G6PD-deficient Cells
Reagents
Sodium nitrite
0.18 mol/l (12.5 g/l). The solution must be stored in a dark bottle and made up monthly.
Method
Venous blood collected into ACD should be used. The test should be carried out within 8 h of collection and the blood should be kept at 4°C until it is tested. Centrifuge the blood at 4°C for 20 min at 1200–1500 g.28
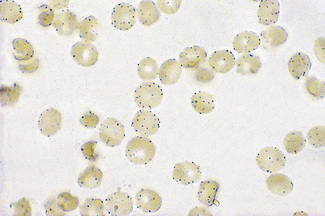
Examine the red cells with an oil-immersion objective, noting the presence of formazan granules (Fig. 12.5).
Pyrimidine-5′-nucleotidase screening test
Pyrimidine-5′-nucleotidase (P5N) was first described by Valentine et al.33 as a cytosolic enzyme in human red cells. Deficiency of P5N-1 (uridine monophosphate hydrolase-1), which shows autosomal recessive inheritance, is associated with congenital haemolytic anaemia. Heterozygotes are clinically and haematologically normal and typically have about half the normal red cell P5N activity. Homozygous P5N deficiency, in which enzyme activity is generally 5–15% of normal, results in a chronic non-spherocytic haemolytic anaemia. This is characterized by mild to moderate haemolysis, pronounced basophilic stippling visible in up to 5% of red cells and marked increase in both red cell glutathione and pyrimidine nucleotides. Osmotic fragility is normal. The rate of autohaemolysis is increased with little or no reduction in lysis by added glucose.8
Activity of P5N may be measured by a colorimetric method33 or by a radiometric method.34 For the screening of P5N deficiency, the method recommended by ICSH is the determination of the UV spectra of a blood extract.35
Reagents
Method
For sample preparation, centrifuge blood freshly collected in EDTA at 1200 g for 5 min, remove the plasma and wash the cells three times with ice-cold 9 g/l NaCl solution. Add 1 ml of a 50% suspension of the washed red cells to 4 ml of ice-cold 4% perchloric acid (PCA) solution and then shake vigorously for 30 s. Transfer the clear supernatant obtained after centrifugation at 1200 g for 15 min to a small test tube. Prepare a sham extract by adding 1 ml of 9 g/l NaCl to 4 ml of 4% PCA solution.35
Interpretation
Samples showing a significantly reduced absorbance ratio should have a specific assay for P5N carried out.36 This is likely to require referral to a reference laboratory where a nucleotide profile may also be undertaken. Nucleotide extraction followed by radiolabelling and separation by high-performance liquid chromatography can be performed. The nucleotides have characteristic UV absorption spectra and retention times, which permit subsequent radiodetection and quantification.
Red cell enzyme assays
As is illustrated in Figure 12.4, a large number of enzymes play a part in the metabolism of glucose in the red cell and genetically determined variants of almost all the enzymes are known to occur. This means that in investigating a patient suspected of suffering from a hereditary enzyme-deficiency haemolytic anaemia, multiple enzyme assays may be needed to identify the defect. In practice, however, G6PD deficiency and PK deficiency should be excluded first because of the relative frequency (common in the case of G6PD, not rare in the case of PK) with which variants of these enzymes are associated with deficiency and increased haemolysis.
Many methods are available for assaying each enzyme and for this reason the ICSH has produced simplified methods suitable for diagnostic purposes.37 These methods are not necessarily the most appropriate for detailed study of the kinetic properties of the variant enzymes, but they are relatively simple to set up and allow comparison of results between different laboratories.
General Points of Technique
Collection of Blood Samples
Blood samples may be anticoagulated with heparin (10 iu/ml blood), EDTA (1.5 mg/ml blood) or ACD (for formulae and volumes see below). In any of these anticoagulants, all normal enzymes are stable for 6 days (and most for 20 days) at 4°C and for 24 h at 25°C. However, enzyme variants in samples from patients may be less stable. Therefore, we recommend that ACD is used as anticoagulant and that the samples are tested promptly. Ideally, samples of blood should be transferred to central laboratories in tubes surrounded by wet ice at 4°C. Frozen samples are unsuitable because the cells are lysed by freezing. Further details of enzyme stability were given by Beutler.21 Approx. 1 ml of blood is required for each enzyme assay.
Separation of Red Cells from Blood Samples
Leucocytes and platelets generally have higher enzyme activities than red cells. Moreover, with many enzyme deficiencies, notably PK deficiency, the decrease in enzyme activity may be much less pronounced in leucocytes and platelets than in red cells or it even may be absent. It is therefore necessary to prepare red cells which are as free from contamination as possible. Various methods are suitable (see ICSH);37 two are described in the following.
Filtration through Microcrystalline Cellulose Mixtures
Determine the Hb and/or red cell count in a sample of the suspension.
G6PD Assay
The reactions involving G6PD have already been described (p. 255). The activity of the enzyme is assayed by following the rate of production of NADPH, which, unlike NADP, has a peak of UV light absorption at 340 nm.
Method
The assays are carried out at 30°C; the cuvettes containing the first four reagents and water are incubated for 10 min before starting the reaction by adding the substrate, as shown in Table 12.4. Commercial kits are also available.*
| Reagents | Assay (μl) | Blank (μl) |
|---|---|---|
| Tris-HCl EDTA buffer, pH 8.0 | 100 | 100 |
| MgCl2 100 mmol/l | 100 | 100 |
| NADP 2 mmol/l | 100 | 100 |
| 1:20 haemolysate | 20 | 20 |
| Water | 580 | 680 |
| Start reaction by adding: G6P 6 mmol/l | 100 | – |
EDTA, ethylenediaminetetra-acetic acid; NADP, nicotinamide adenine dinucleotide phosphate; G6P, glucose-6-phosphate.
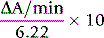
Calculation of Enzyme Activity
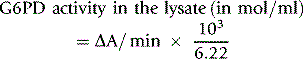
where 6.22 is the mmol extinction coefficient of NADPH at 340 nm and 103 is the factor appropriate for the dilutions in the reaction mixture. Results are expressed per 1010 red cells, per ml red cells or per g Hb by reference to the respective values obtained with the washed red cell suspension. However, the ICSH recommendation is to express values per g Hb and it is ideal to determine the Hb concentration of the haemolysate directly. When doing this, use a haemolysate to Drabkin’s solution ratio of 1:25.
Normal Values
For adults, these values are 8.83 ± 1.59 eu/g Hb at 30°C. However, newborns and infants may have enzyme activity that deviates appreciably from the adult value.37,38 In one study, the newborn mean activity was about 150% of the adult mean.39
Interpretation of Results
In practice, the following notes may be useful:
Identification of G6PD Variants
There are many variants of G6PD in different populations with enzyme activities ranging from nearly 0 to 500% of normal activity.40 Classification and provisional identification of variants are based on their physicochemical and enzymic characteristics.41 Criteria were laid down by a World Health Organization scientific group23 for the minimum requirements for identification of such variants and these recommendations have now been revised.42 The tests are carried out on male hemizygotes and are as follows:
The full amino acid sequence of G6PD has been established and definitive identification can be made by sequence analysis at the DNA level.43,44 Diagnosis of G6PD deficiency by molecular analysis may be clinically useful when a patient has received a large volume of transfused blood or when a reticulocytosis results in a normal enzyme assay level; also, females who are heterozygous deficient can readily be identified.
Pyruvate kinase assay
Many variants of PK have deficient enzyme activity in vivo.45,46 In most cases, deficient activity can be identified by simple enzyme assay. However, PK activity in red cells is subject to regulation by a number of effector molecules. With some PK variants, the maximum velocity (Vmax) of the enzyme is normal or nearly so, but at the low-substrate concentrations found in vivo PK activity may be sufficiently low to cause haemolysis, either because affinity for the substrates, phosphoenolpyruvate (PEP) and ADP, is low or because binding of the important allosteric ligand, fructose-1,6-diphosphate, is altered. Some of these unusual variants can be identified by carrying out the enzyme assay not only understandard conditions but also at low-substrate concentrations. Functional PK deficiency can also be identified by finding high concentrations of the substrates immediately above the block in the glycolytic pathway, particularly 2,3-DPG.47 (For measurement of 2,3-DPG, see p. 266).
PK deficiency is inherited as an autosomal recessive condition.
Method


The reaction conditions are established in a 1 ml cuvette at 30°C by adding all the reagents shown in Table 12.6, except the substrate PEP, to the cuvette and incubating them at 30°C for 10 min before starting the reaction by the addition of the PEP.
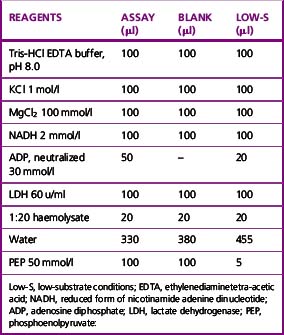
The amounts to be added for low-substrate conditions are also shown in Table 12.6.
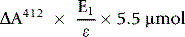
where 6.22 is the millimolar extinction coefficient of NADH at 340 nm.
A blank assay should be carried out to be certain that the LDH is free of PK activity. Use the 2-mercapto-ethanol-EDTA stabilizing solution (p. 261) in place of haemolysate for both the blank and system mixtures. If no change in absorbance is observed, indicating that the LDH is free of contaminating PK, it is unnecessary to recheck on subsequent assays. Otherwise, the blank rate must be subtracted in computing the true enzyme activity each time.
Normal Values
As with all enzyme assays, a normal range should be determined for each laboratory. Values should however, not be widely different between laboratories if the ICSH methods are used. The normal range of PK activity at 30°C is 10.3 ± 2 eu/g Hb. At a low-substrate concentration, the normal activity is 15 ± 3% of that at the high-substrate concentration. Mean neonatal value is about 140% that of adults.39
Estimation of reduced glutathione
The red cell has a high concentration of the sulphydryl containing tripeptide, GSH. An important function of GSH in the red cell is the detoxification of low levels of hydrogen peroxide, which may form spontaneously or as a result of drug administration. GSH may also function in maintaining the integrity of the red cell by reducing sulphydryl groups of Hb, membrane proteins and enzymes that may have become oxidized. Maintenance of normal levels of GSH is a major function of the hexose monophosphate shunt. Reduction of GSSG (oxidized glutathione) back to the functional GSH is linked to the rate of reduction of NADP+ in the initial step of the shunt.48
Reagents
Precipitating reagent
Metaphosphoric acid (sticks), 1.67 g; disodium EDTA, 0.2 g; NaCl, 30 g; water to 100 ml.
Disodium hydrogen phosphate
300 mmol/l. Na2HPO4.12H2O, 107.4 g/l or Na2HPO4.2H2O, 53.4 g/l or anhydrous Na2HPO4, 4.6 g/l.
Method
Add 3 ml of precipitating solution, mix the solution well and allow to stand for a further 5 min.
After re-mixing, filter through a single-thickness Whatman No. 42 filter paper.
A reagent blank is made using saline or plasma instead of whole blood.
Calculation of GSH Concentration
The amount of GSH in the cuvette sample (GSHc) is given by the following:
The concentration of GSH in the whole blood sample is as follows:
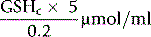
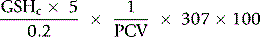
Normal Range
The normal range may be expressed in a number of ways (e.g. 6.57 ± 1.04 µmol/g Hb or 223 ± 35 µmol (or 69 ± 11 mg)/dl packed red cells). Neonatal mean value is about 150% that of adults.39
Glutathione Stability Test
Glutathione and Glutathione Stability in Infants
During the first few days after birth, the red cells have a normal or high content of GSH. On the addition of acetylphenylhydrazine, the GSH is unstable in both normal infants and infants who are G6PD deficient. In normal infants, however, the instability can be corrected by the addition of glucose and, by the time the normal infant is 3–4 days old, the cells behave like adult cells.49,50
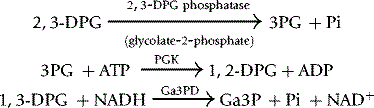
2,3-Diphosphoglycerate
The importance of the high concentration of 2,3-DPG in the red cells of man was recognized at about the same time by Chanutin and Curnish51 and Benesch and Benesch.52 2,3-DPG binds to a specific site in the β chain of Hb and it decreases its oxygen affinity by shifting the balance of the so-called T and R conformations of the molecule. The higher the concentration of 2,3-DPG, the greater the partial pressure of oxygen (pO2) needed to produce the same oxygen saturation of Hb. This is reflected in a 2,3-DPG-dependent shift in the oxygen dissociation curve.
Measurement of Red Cell 2,3-Diphosphoglycerate
Various methods have been used to assay 2,3-DPG. Krimsky53 used the catalytic properties of 2,3-DPG in the conversion of 3-phosphoglycerate (3PG) to 2-phosphoglycerate (2PG) by phosphoglycerate mutase (PGM). At very low concentrations of 2,3-DPG, the rate of conversion is proportional to the concentration of 2,3-DPG. This method is elegant and extremely sensitive but too cumbersome for routine use. A fluorometric method was described by Lowry et al.,54 and this has been modified for spectrometry. Rose and Liebowitz55 found that glycolate-2-phosphate increased the 2,3-DPG phosphatase activity of PGM and a quantitative assay of the substrate, 2,3-DPG, was evolved on this basis.
Reagents
NADH, sodium salt
10 mg/ml. When dissolved in buffer, this is relatively unstable and should be made freshly each day.
Reaction
Deliver the reagents into a silica or high-quality glass cuvette, with a 1 cm light path. The quantities in Table 12.7 are for a 4 ml cuvette:
| Test | Blank | |
|---|---|---|
| Triethanolamine buffer | 2.50 ml | 2.50 ml |
| ATP | 100 μl | 100 μl |
| NADH | 100 μl | 100 μl |
| Deproteinized extract | 250 μl | – |
| Ga-3-PD/PGK mixture | 30 μl | 30 μl |
| PGM | 20 μl | 20 μl |
| Water | – | 250 μl |
| 3.00 ml | 3.00 ml |
Remeasure the absorbance (at 35 min) of the test and blank mixtures on completion of the reaction.
Make further measurements after a further 5 min to make sure the reaction is complete.
Calculation
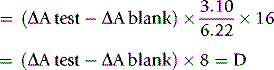
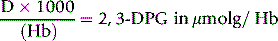
where 3.10 = the volume of reaction mixture, 6.22 = mmolar extinction coefficient of NADH at 340 nm and 16 = dilution of original blood sample (1 ml in 3.0 ml of TCA, 0.25 ml added to cuvette).
or
and

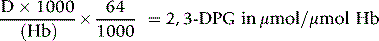
where Hb = Hb in g/l of whole blood and 64 is the molecular weight of Hb × 10–3.
The molar ratio of 2,3-DPG to Hb in normal blood is about 0.75:1.
Normal Range
The normal range is 4.5–5.1 µmol/ml packed red cells or 10.5–16.2 µmol/g Hb. Neonatal values are about 20% lower than adult.39
Significance of 2,3-DPG Concentration
2,3-DPG levels are generally slightly lower than normal in HS and this probably accounts for the slight erythrocytosis that is sometimes seen after splenectomy. Extremely low red cell 2,3-DPG concentration associated with erythrocytosis has been reported in a kindred with complete 2,3-diphosphoglycerate mutase deficiency.57
Oxygen dissociation curve
The oxygen dissociation curve is the expression of the relationship between the partial pressure of oxygen and oxygen saturation of Hb. Details of this relationship and the physiological importance of changes in this relationship were worked out in detail at the beginning of this century by the great physiologists Hüfner, Bohr, Barcroft, Henderson and many others. Their work was summarized by Peters and Van Slyke in Quantitative Clinical Chemistry.58 The relevant chapters of this book have been reprinted and it would be difficult to improve their description of the importance of the oxygen dissociation curve.
Measuring the Oxygen Dissociation Curve
The multiplicity of methods available for measuring the oxygen dissociation curve suggests that no method is ideal. The advantages and disadvantages of the various techniques have been reviewed.59,60 The standard method with which new methods are compared is the gasometric method of Van Slyke and Neill.61 This method is slow, demands considerable expertise and is not suitable for most haematology laboratories. Commercial instruments are now available for performing the test and drawing the complete oxygen dissociation curve.* Such analysers are extremely quick and accurate and are therefore ideal for laboratories performing multiple determinations. Approximate measurement of oxygen saturation of Hb can also be obtained at the bedside by non-invasive pulse oximetry.
Interpretation
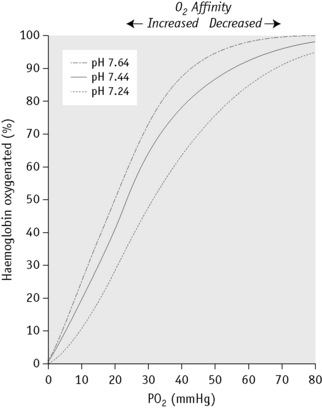
Figure 12.6 shows the sigmoid nature of the oxygen dissociation curve of Hb A and the effect of hydrogen ions on the position of the curve. A shift of the curve to the right indicates decreased affinity of the Hb for oxygen and hence an increased tendency to give up oxygen to the tissues; a shift to the left indicates increased affinity and so an increased tendency for Hb to take up and retain oxygen. Hydrogen ions, 2,3-DPG and some other organic phosphates such as ATP shift the curve to the right. The amount by which the curve is shifted may be expressed by the p50O2 (i.e. the partial pressure of oxygen at which the Hb is 50% saturated).
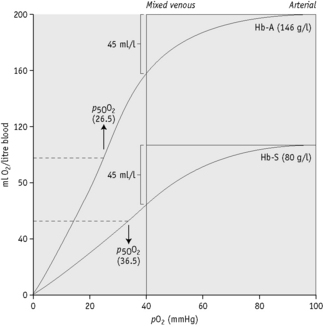
The oxygen affinity, as represented by the p50O2, is related to compensation in haemolytic anaemias;62 1 g of Hb can carry about 1.34 ml of O2. Figure 12.7 shows the O2 dissociation curves of Hb A and Hb S plotted according to the volume of oxygen contained in 1 litre of blood when the Hb concentrations is 146 g/l and 80 g/l, respectively. The p50O2 of Hb A is given as 26.5 mmHg (3.5 kPa) and Hb S as 36.5 mmHg (4.8 kPa). It will be seen that in the change from arterial to venous saturation, the same volume of oxygen is given up despite the difference in Hb concentration. Patients with a high p50O2 achieve a stable Hb at a lower level than normal and this should be taken into account when planning transfusion for these patients.
Bohr Effect
An increase in CO2 concentration produces a shift to the right (i.e. a decrease in oxygen affinity). This effect originally described by C. Bohr,63 is mainly a result of changes in pH, although CO2 itself has some direct effect. The Bohr effect is given a numeric value,  log p50O2/
 pH, where
  log p50O2 is the change in p50O2 produced by a change in pH (
 pH). The normal value of the Bohr effect at physiological pH and temperature is about 0.45.
Hill’s Constant (‘n’)
Hill’s constant (‘n’) represents the number of molecules of oxygen that combine with one molecule of Hb.64 Experiments showed that the value was 2.6 rather than the expected 4. The explanation for this lies in the effect of binding 1 molecule of oxygen by Hb on the affinity for binding further oxygen molecules by Hb, the so-called allosteric effect of haem–haem interaction: ‘n’ is a measure of this effect and the calculation of the ‘n’ value helps in identifying abnormal Hbs, the molecular abnormality of which leads to abnormal haem–haem interaction.65
1 Johnsson R., Vuopio P. Studies on red cell flexibility in spherocytosis using a polycarbonate membrane filtration method. Acta Haematol. 1978;60:329-340.
2 LORCA. Available at: www.mechatronics.nl/products/download/lorrca.pdf
3 Parpart A.K., Lorenz P.B., Parpart E.R., et al. The osmotic resistance (fragility) of human red cells. J Clin Invest. 1947;26:636-640.
4 Murphy J.R. The influence of pH and temperature on some physical properties of normal erythrocytes and erythrocytes from patients with hereditary spherocytosis. J Lab Clin Med. 1967;69:758-775.
5 Suess J., Limentani D., Dameshek W., et al. A quantitative method for the determination and charting of the erythrocyte hypotonic fragility. Blood. 1948;3:1290-1303.
6 Jacob H.S., Jandl J.H. Increased cell membrane permeability in the pathogenesis of hereditary spherocytosis. J Clin Invest. 1964;43:1704-1720.
7 Cooper R.A. Lipids of human red cell membrane normal composition and variability in disease. Semin Hematol. 1970;7:296-322.
8 John D.S. The Haemolytic Anaemias, Vol. 1. In: The Hereditary Haemolytic Anaemias, Part 1. Edinburgh: Churchill Livingstone; 1985:292. 146, 352
9 Gunn R.B., Silvers D.N., Rosse W.F. Potassium permeability in β-thalassaemia minor red blood cells. J Clin Invest. 1972;51:1043-1050.
10 King M.-J., Behrens J., Rogers C., et al. Rapid flow cytometric test for the diagnosis of membrane cytoskeleton-associated haemolytic anaemia. Br J Haematol. 2000;111:924-933.
11 Golan D.E., Corbett J.D., Korsgren C., et al. Control of band 3 lateral and rotational mobility by band 4.2 in intact erythrocytes: release of band 3 oligomers from low affinity binding sites. Biophys J. 1996;70:1534-1542.
12 Gottfried E.L., Robertson N.A. Glycerol lysis time as a screening test for erythrocyte disorders. J Lab Clin Med. 1974;83:323-333.
13 Gottfried E.L., Robertson N.A. Glycerol lysis time of incubated erythrocytes in the diagnosis of hereditary spherocytosis. J Lab Clin Med. 1974;84:746-751.
14 Zanella A., Izzo C., Rebulla P., et al. Acidified glycerol lysis test: a screening test for spherocytosis. Br J Haematol. 1980;45:481-486.
15 Streichman S., Gescheidt Y. Cryohemolysis for the detection of hereditary spherocytosis: correlation studies with osmotic fragility and autohemolysis. Am J Hematol. 1998;58:206-210.
16 Selwyn J.G., Dacie J.V. Autohemolysis and other changes resulting from the incubation in vitro of red cells from patients with congenital hemolytic anemia. Blood. 1954;9:414-438.
17 Morris L.D., Pont A., Lewis S.M. Use of the HemoCue for measuring haemoglobin at low concentrations. Clin Lab Haematol. 2001;23:91-96.
18 de Gruchy G.C., Santamaria J.N., Parsons I.C., et al. Nonspherocytic congenital hemolytic anemia. Blood. 1960;16:1371-1397.
19 Beutler E. Why has the autohemolysis test not gone the way of the cephalin flocculation test? Blood. 1978;51:109-110.
20 Palek J., Jarolim P. Clinical expression and laboratory detection of red blood cell membrane protein mutations. Semin Hematol. 1993;30:249-283.
21 Beutler E. Red Cell Metabolism. A Manual of Biochemical Methods, 2nd ed. Orlando: Grune & Stratton; 1984.
22 Beutler E., Blume K.G., Kaplan J.C., et al. International Committee for Standardization in Haematology. Recommended screening test for glucose-6-phosphate dehydrogenase (G-6-PD) deficiency. Br J Haematol. 1979;43:465-477.
23 World Health Organization Scientific Group. Standardization of procedures for the study of glucose-6-phosphate dehydrogenase. Geneva: WHO; 1967. Technical Report Series, No. 366
24 Beutler E., Mitchell M. Special modification of the fluorescent screening method for glucose-6-phosphate dehydrogenase deficiency. Blood. 1968;32:816-818.
25 Brewer G.J., Tarlov A.R., Alving A.S. The methemoglobin reduction test for primaquine-type sensitivity of erythrocytes. A simplified procedure for detecting a specific hypersusceptibility to drug hemolysis. JAMA. 1962;180:386-388.
26 Fujii H., Takahashi K., Miwa S. A new simple screening method for glucose-6-phosphate dehydrogenase deficiency. Acta Haematologica Japonica. 1984;47:185-188.
27 Lyon M.F. Gene action in the X-chromosomes of the mouse (Mus musculus L.). Nature (London). 1961;190:372-373.
28 Fairbanks V.F., Lampe L.T. A tetrazolium-linked cytochemical method for estimation of glucose-6-phosphate dehydrogenase activity in individual erythrocytes: applications in the study of heterozygotes for glucose-6-phoshate dehydrogenase deficiency. Blood. 1968;31:589-603.
29 Gall J.C., Brewer G.J., Dern R.J. Studies of glucose-6-phosphate dehydrogenase activity of individual erythrocytes: the methemoglobin-elution test for identification of females heterozygous for G6PD deficiency. Am J Hum Genet. 1965;17:350-363.
30 Tönz O., Rossi E. Morphological demonstration of two red cell populations in human females heterozygous for glucose-6-phosphate dehydrogenase deficiency. Nature (London). 1964;202:606-607.
31 Kleihauer E., Betke K. Elution procedure for the demonstration of methaemoglobin in red cells of human blood smears. Nature (London). 1963;199:1196-1197.
32 Vogels I.M.C., Van Noorden C.J.F., Wolf B.H.M., et al. Cytochemical determination of heterozygous glucose-6-phosphate dehydrogenase deficiency in erythrocytes. Br J Haematol. 1986;63:402-405.
33 Valentine W.N., Fink K., Paglia D.E., et al. Hereditary haemolytic anaemia with human erythrocyte pyrimidine 5′-nucleotidase deficiency. J Clin Invest. 1974;54:866-879.
34 Torrance J., West C., Beutler E. A simple radiometric assay for pyrimidine 5′-nucleotidase. J Lab Clin Med. 1977;90:563-568.
35 International Committee for Standardization in Haematology. Recommended screening test for pyrimidine 5′-nucleotidase deficiency. Clin Lab Haematol. 1989;11:55-56.
36 Fairbanks L.D., Jacomelli G., Micheli V., et al. Severe pyridine nucleotide depletion in fibroblasts from Lesch-Nyhan patients. Biochem J. 2002;366:265-272.
37 International Committee for Standardization in Haematology. Recommended methods for red-cell enzyme analysis. Br J Haematol. 1977;35:331-340.
38 Konrad P.N., Valentine W.N., Paglia D.E. Enzymatic activities and glutathione content of erythrocytes in the newborn. Comparison with red cells of older normal subjects and those with comparable reticulocytosis. Acta Haematol. 1972;48:193-201.
39 Oski F.A. Red cell metabolism in the newborn infant: V. Glycolytic intermediates and glycolytic enzymes. Pediatrics. 1969;44:84-91.
40 Luzzatto L., Mehta A. Glucose-6-phosphate dehydrogenase deficiency. In: Scriver C.R., Beaudet A., Sly W.S., Valle D., editors. The Metabolic Basis of Inherited Disease. New York: McGraw-Hill; 1989:2237-2265.
41 Yoshida A., Beutler E., Motulsky A.G. Human glucose-6-phosphate dehydrogenase variants. Bull World Health Organ. 1971;45:243-253.
42 World Health Organization Scientific Group on Glucose-6-Phosphate Dehydrogenase. Bull World Health Organ. 1990;67:601.
43 Vulliamy T.J., D’urso M., Battistuzzi G., et al. Diverse point mutations in the human glucose-6-phosphate dehydrogenase gene cause enzyme deficiency and mild or severe hemolytic anemia. Proc Natl Acad Sci U S A. 1988;85:5171-5175.
44 Beutler E. Glucose-6-phosphate dehydrogenase: new perspectives. Blood. 1989;73:1397-1401.
45 Miwa S., Fujii H., Takegawa S., et al. Seven pyruvate kinase variants characterised by the ICSH recommended methods. Br J Haematol. 1980;45:575-583.
46 Miwa S., Nakashima K., Ariyoshi K., et al. Four new pyruvate kinase (PK) variants and a classical PK deficiency. Br J Haematol. 1975;29:157-169.
47 International Committee for Standardization in Haematology. Recommended methods for the characterisation of red cell pyruvate kinase variants. Br J Haematol. 1979;43:275-286.
48 Beutler E., Duron O., Kelly B. Improved method for the determination of blood glutathione. J Lab Clin Med. 1963;61:882-888.
49 Lubin B.H., Oski F.A. An evaluation of screening procedures for red cell glucose-6-phosphate dehydrogenase deficiency in the newborn infant. J Pediatr. 1967;70:488-492.
50 Zinkham W.H. An in-vitro abnormality of glutathione metabolism in erythrocytes from normal newborns: mechanism and clinical significance. Pediatrics. 1959;23:18-32.
51 Chanutin A., Curnish R.R. Effect of organic and inorganic phosphates on the oxygen equilibrium of human erythrocytes. Arch Biochem Biophys. 1967;121:96-102.
52 Benesch R., Benesch R.E. The effect of organic phosphates from the human erythrocyte on the allosteric properties of haemoglobin. Biochem Biophys Res Commun. 1967;26:162-167.
53 Krimsky I. D-2,3-diphosphoglycerate. In: Bergmeyer H.U., editor. Methods of Enzymatic Analysis. New York: Academic Press, 1965.
54 Lowry O.H., Passonneau J.V., Hasselberger F.X., et al. Effect of ischemia on known substrates and cofactors of the glycolytic pathway in brain. J Biol Chem. 1964;239:18-30.
55 Rose Z.B., Liebowitz J. Direct determination of 2,3-diphosphoglycerate. Ann Biochem Exp Med. 1970;35:177-180.
56 Duhm J. Effects of 2,3-diphosphoglycerate and other organic phosphate compounds on oxygen affinity and intracellular pH of human erythrocytes. Pflügers Arch Gesamte Physiol Menschen Tiere. 1971;326:341-356.
57 Rosa R., Prehu M.O., Beuzard Y., et al. The first case of a complete deficiency of diphosphoglycerate mutase in human erythrocytes. J Clin Invest. 1978;62:907-915.
58 Peters J.P., Van Slyke D.D. Hemoglobin and oxygen. In: Quantitative Clinical Chemistry, Vol. 1. Interpretations. Baltimore: Williams & Wilkins; 1931:525.
59 Bellingham A.J., Lenfant C. Hb affinity for O2 determined by O2–Hb dissociation analyser and mixing technique. J Appl Physiol. 1971;30:903-904.
60 Torrance J.D., Lenfant C. Methods for determination of O2 dissociation curves, including Bohr effect. Respir Physiol. 1969;8:127-136.
61 Van Slyke D.D., Neill J.M. The determination of gases in blood and other solutions by vacuum extraction and manometric measurement. J Biol Chem. 1924;61:523-573.
62 Bellingham A.J., Huehns E.R. Compensation in haemolytic anaemias caused by abnormal haemoglobins. Nature (London). 1968;218:924-926.
63 Bohr C., Hasselbach K., Krogh A. Ueber einen in biologischer Beziehung wichtigen Einfluss, den die Kohlensäurespannung des Blutes auf dessen Sauerstoffbindungübt. Skandinavisches Archiv für Physiologie. 1904;16:402.
64 Hill A.V. The possible effect of the aggregation of the molecules of haemoglobin on its dissociation curves. J Physiol. 1910;40:4.
65 Bellingham A.J. The physiological significance of the Hill parameter ‘n’. Scand J Haematol. 1972;9:552-556.