Chapter 18 Investigation of haemostasis
Components of normal haemostasis
The Blood Vessel
Endothelial Cell Function
The luminal surface of the endothelial cell1 is covered by the glycocalyx, a proteoglycan coat. It contains heparan sulphate and other glycosaminoglycans, which are capable of activating antithrombin, an important inhibitor of coagulation enzymes. Tissue factor pathway inhibitor (TFPI) is present on endothelial cell surfaces bound to these heparans but also tethered to a glycophosphoinositol (GPI) anchor. The relative importance of these two TFPI pools is not known. Endothelial cells express a number of coagulation active proteins that play an important regulatory role such as thrombomodulin and the endothelial protein C (PC) receptor. Thrombin generated at the site of injury is rapidly bound to a specific product of the endothelial cell, thrombomodulin. When bound to this protein, thrombin can activate PC (which degrades factors Va and VIIIa) and a carboxypeptidase which inhibits fibrinolysis (discussed later). Thrombin also stimulates the endothelial cell to produce tissue plasminogen activator (tPA). The endothelium can also synthesize protein S, the cofactor for PC. Finally, endothelium produces von Willebrand factor (VWF), which is essential for platelet adhesion to the subendothelium and stabilizes factor VIII within the circulation. VWF is both stored in specific granules called Weibel Palade bodies and secreted constitutively, partly into the circulation and partly toward the subendothelium where it binds directly to collagen and other matrix proteins. The expression of these and other important molecules such as adhesion molecules and their receptors are modulated by inflammatory cytokines. The lipid bilayer membrane also contains adenosine diphosphatase (ADPase), an enzyme that degrades adenosine diphosphate (ADP), which is a potent platelet agonist (see p. 434). Many of the surface proteins are found localized in the specialized lipid rafts and invaginations called ‘caveolae’, which may provide an important level of regulation.2
The subendothelium consists of connective tissues composed of collagen (principally types I, III and VI), elastic tissues, proteoglycans and non-collagenous glycoproteins, including fibronectin and VWF. After vessel wall damage has occurred, these components are exposed and are then responsible for platelet adherence. This appears to be mediated by VWF binding to collagen. VWF then undergoes a conformational change and platelets are captured via their surface membrane glycoprotein Ib binding to VWF. Platelet activation follows and a conformational change in glycoprotein IIbIIIa allows further, more secure, binding to VWF via this receptor as well as to fibrinogen. At low shear rates (<1000 s−1) platelet binding directly to collagen appears to dominate.3
Vasoconstriction
Vessels with muscular coats contract following injury, thus helping to arrest blood loss. Although not all coagulation reactions are enhanced by reduced flow, this probably assists in the formation of a stable fibrin plug by allowing activated factors to accumulate to critical concentrations. Vasoconstriction1,4 also occurs in the microcirculation in vessels without smooth muscle cells. Endothelial cells themselves can produce vasoconstrictors such as angiotensin II. In addition, activated platelets produce thromboxane A2 (TXA2), which is a potent vasoconstrictor.
Platelets
Platelets5,6 are small fragments of cytoplasm derived from megakaryocytes. On average, they are 1.5–3.5 μm in diameter but may be larger in some disease states. They do not contain a nucleus and are bounded by a typical lipid bilayer membrane. Beneath the outer membrane lies the marginal band of microtubules, which maintain the shape of the platelet and depolymerize when aggregation begins. The central cytoplasm is dominated by the three types of platelet granules: the δ granules, α granules and lysosomal granules. The contents of these various granules are detailed in Table 18.1. Finally there exist the dense tubular system and the canalicular membrane system; the latter communicates with the exterior. It is not clear how all these elements act together to perform such functions as contraction and secretion, which are characteristic of platelet activation.
| Dense (δ) granules | α Granules | Lysosomal vesicles |
|---|---|---|
| ATP | PF4 | Galactosidases |
| ADP | β-Thromboglobulin | Fucosidases |
| Calcium | Fibrinogen | Hexosaminidase |
| Serotonin | Factor V | Glucuronidase |
| Pyrophosphate | Thrombospondin | Cathepsin |
| P selectin (CD62P) | Fibronectin | Glycohydrolases |
| Transforming growth factor-beta (1) | PDGF | + others |
| Catecholamines (epinephrine/norepinephrine) | PAI-1 | |
| GDP/GTP | Histidine-rich glycoprotein | |
| α2 Macroglobulin | ||
| Plasmin inhibitor | ||
| P selectin (CD62) | ||
ADP, adenosine 5′-diphosphate; ATP, adenosine 5′-triphosphate; GDP, guanosine 5′-diphosphate; GTP, guanosine 5′-triphosphate; PAI-1, plasminogen activator inhibitor-1; PDGF, platelet-derived growth factor; PF4, platelet factor 4.
Platelet Function in the Haemostatic Process
The main steps in platelet function7 are adhesion, activation with shape change and aggregation. When the vessel wall is damaged, the subendothelial structures, including basement membrane, collagen and microfibrils, are exposed. VWF binds to collagen and microfibrils and then captures platelets via initial binding to platelet GPIb, resulting in an initial monolayer of adhering platelets. Binding via GPIb initiates activation of the platelet via a G-protein mechanism. Once activated, platelets immediately change shape from a disc to a tiny sphere with numerous projecting pseudopods. After adhesion of a single layer of platelets to the exposed subendothelium, platelets stick to one another to form aggregates. Fibrinogen, fibronectin, further VWF released from platelets and the glycoprotein Ib-IX and IIbIIIa complexes are essential at this stage to increase the cell-to-cell contact and facilitate aggregation. Certain substances (agonists) react with specific platelet membrane receptors to promote platelet aggregation and further activation. The agonists include exposed collagen fibres, ADP, thrombin, adrenaline, (epinephrine) serotonin and certain arachidonic acid metabolites including TXA2. In areas of non-linear blood flow, such as may occur at the site of an injury, locally damaged red cells release ADP, which further activates platelets.
Blood Coagulation
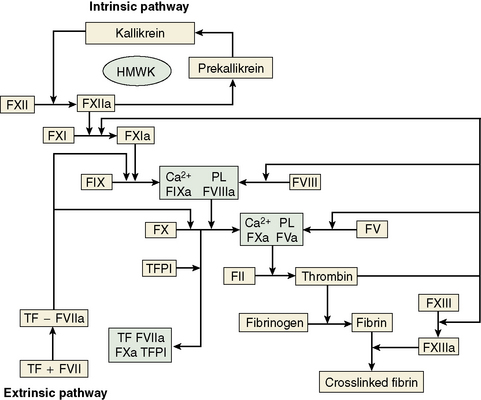
The central event in the coagulation pathways8 is the production of thrombin, which acts upon fibrinogen to produce fibrin and thus the fibrin clot. This clot is further strengthened by the crosslinking action of factor XIII, which itself is activated by thrombin. The two commonly used coagulation tests, the activated partial thromboplastin time (APTT) and the prothrombin time (PT), have been used historically to define two pathways of coagulation activation: the intrinsic and extrinsic paths, respectively. However, this bears only a limited relationship to the way coagulation is activated in vivo. For example, deficiencies of factor XII or of factor VIII both produce marked prolongation of the APTT, but only deficiency of the latter is associated with a haemorrhagic tendency. Moreover, there is considerable evidence that activation of factor IX (intrinsic pathway) by factor VIIa (extrinsic pathway) is crucial to establishing coagulation after an initial stimulus has been provided by factor VIIa-tissue factor (TF) activation of factor X (Fig. 18.1).8
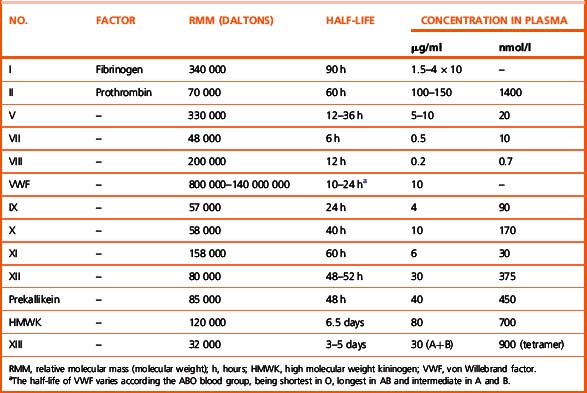
Investigation of the coagulation system centres on the coagulation factors, but the activity of these proteins is also greatly dependent on specific surface receptors and phospholipids largely presented on the surface of platelets and also by activated endothelium. The necessity for calcium in many of these reactions is frequently used to control their activity in vitro. The various factors are described in the following sections, as far as possible in their functional groups; their properties are detailed in Table 18.2.
The Contact Activation System
The contact activation system9 comprises factor XII (Hageman factor), high molecular weight kininogen (HMWK) (Fitzgerald factor) and prekallikrein/kallikrein (Fletcher factor). As mentioned earlier, these factors are not essential for haemostasis in vivo. Important activities are to activate the fibrinolytic system, to activate the complement system and to generate vasoactive peptides: in particular, bradykinin is released from HMWK by prekallikrein or FXIIa cleavage. Kallikrein and factor XIIa also function as chemoattractants for neutrophils. The contact activation system also has some inhibitory effect on thrombin activation of platelets and prevents cell binding to endothelium. Recent evidence implicates the contact system in thrombosis via activation by polyphosphate released from platelets.10
Fibrinogen
Fibrinogen11 is a large dimeric protein, each half consisting of three polypeptides named Aα, Bβ and γ held together by 12 disulphide bonds. The two monomers are joined together by a further three disulphide bonds. A variant γ chain denoted γ′ is produced by a variation in messenger RNA splicing. In the process a platelet binding site is lost and high-affinity binding sites for FXIII and thrombin are gained. The γ′ variant constitutes approximately 10% of plasma fibrinogen. A less common (<2%) γ chain variant ‘γE’ is also produced by splice variation. Fibrinogen is also found in platelets, but the bulk of this is derived from glycoprotein IIbIIIa-mediated endocytosis of plasma fibrinogen, which is then stored in alpha granules, rather than synthesis by megakaryocytes. Fibrin is formed from fibrinogen by thrombin cleavage releasing the A and B peptides from fibrinogen. This results in fibrin monomers that then associate and precipitate forming a polymer that is the visible clot. The central E domain exposed by thrombin cleavage binds with a complementary region on the outer or D domain of another monomer. The monomers thus assemble into a staggered overlapping two-stranded fibril. More complex interactions subsequently lead to branched and thickened fibre formation, making a complex mesh that binds and stabilizes the primary platelet plug.
Inhibitors of Coagulation
A number of mechanisms exist to ensure that the production of the fibrin clot is limited to the site of injury and is not allowed to propagate indefinitely.12,13 First, there are a number of proteins that bind to and inactivate the enzymes of the coagulation cascade. Probably the first of these to become active is TFPI, which rapidly quenches the factor VIIa–TF complex that initiates coagulation. It does this by combining first with factor Xa, so that further propagation of coagulation is dependent on the small amount of thrombin that has been generated during initiation being sufficient to activate the intrinsic pathway.
The Fibrinolytic System
The deposition of fibrin and its removal are regulated by the fibrinolytic system.14 Although this is a complex multicomponent system with many activators and inhibitors, it centres around the fibrinogen- and fibrin-cleaving enzyme plasmin. Plasmin circulates in its inactive precursor form, plasminogen, which is activated by proteolytic cleavage. The principal plasminogen activator (PA) in humans is tissue plasminogen activator (tPA), which is another serine protease. tPA and plasminogen are both able to bind to fibrin via the amino acid lysine. Binding to fibrin brings tPA and plasminogen into close proximity so that the rate of plasminogen activation is markedly increased and thus plasmin is generated preferentially at its site of action and not free in plasma. The second important physiological PA in humans is called urokinase (uPA). This single chain molecule (scu-PA or pro-urokinase) is activated by plasmin or kallikrein to a two-chain derivative (tcu-PA), which is not fibrin-specific in its action. However, the extent to which this is important in vivo is not clear and the identification of cell surface receptors for uPA suggests that its primary role may be extravascular. The contact activation system also appears to generate some plasminogen activation via factor XIIa and bradykinin-stimulated release of tPA. The degradation products released by the action of plasmin on fibrin are of diagnostic use and are discussed later in this chapter. The activation of plasmin on fibrin is restricted by the action of a carboxypeptidase, which removes the amino terminal lysine residues to which plasminogen and tPA bind. This carboxypeptidase is activated by thrombomodulin-bound thrombin and is referred to as thrombin-activated fibrinolysis inhibitor (TAFI).
General approach to investigation of haemostasis
This section begins with some general points regarding the clinical and laboratory approach to the investigation of haemostasis. Following this, the basic or first-line screening tests of haemostasis are described. These tests are generally used as the first step in investigation of an acutely bleeding patient, a person with a suspected bleeding tendency or as a precaution before an invasive procedure is carried out. They have the virtue that they are easily performed and the patterns of abnormalities obtained point clearly to the appropriate next set of investigations. It should be remembered, however, that these tests examine only a portion of the haemostatic mechanism and have limited sensitivity for the presence of significant bleeding diatheses such as von Willebrand disease (VWD) or disorders of platelets or vessels. Hence a normal ‘clotting screen’ should not be taken to mean that haemostasis is normal.15
Clinical Approach
The investigation of a suspected bleeding tendency may begin from three different points:
Principles of Laboratory Analysis
Assays using chromogenic peptide substrates (amidolytic assays)
The serine proteases of the coagulation cascade have narrow substrate specificities.17 It is possible to synthesize a short peptide specific for each enzyme that has a dye (p-nitroaniline, p-NA) attached to the terminal amino acid. When the synthetic peptide reacts with the specific enzyme, the dye is released and the rate of its release or the total amount released can be measured photometrically. This gives a measure of the enzyme activity present. Chromogenic substrate assays can be classified into direct and indirect assays. Direct assays can be further subclassified into primary assays, in which a substrate specific for the enzyme to be measured is used, and secondary assays, in which the enzyme or proenzyme measured is used to activate a second protease for which a specific substrate is available. Specific substrates are available for many coagulation enzymes. However, the substrate specificity is not absolute and most kits include inhibitors of other enzymes capable of cleaving the substrate to improve specificity. Indirect assays are used to measure naturally occurring inhibitors and some platelet factors.15
Coagulation assays
Coagulation assays are functional bioassays and rely on comparison with a control or standard preparation with a known level of activity. In the one-stage system optimal amounts of all the clotting factors are present except the one to be determined, which should be as near to nil as possible. The best one-stage system is provided by a substrate plasma obtained either from a patient with severe congenital deficiency or artificially depleted by immuno-adsorption. The principles of bioassay, its standardization and its limitations are considered in detail on p. 417.
Other Assays
Other assays include measurement of coagulation factors using snake venoms, assay of ristocetin cofactor and the clot solubility test for factor XIII. DNA analysis is becoming more useful and more prevalent in coagulation. However, this requires entirely different equipment and techniques (see Chapter 8).
Notes on equipment
Automated Coagulation Analysers
Pre-analytical variables including sample collection
Collection of Venous Blood
Whenever possible, venous samples should be collected without a pressure cuff, allowing the blood to enter the syringe by continuous free flow or by the negative pressure from an evacuated tube (see p. 3). Venous occlusion causes haemoconcentration, increase of fibrinolytic activity, platelet release and activation of some clotting factors. In the majority of patients, however, light pressure using a tourniquet is required; this should be applied for the shortest possible time (e.g. <1 min). The venepuncture must be ‘clean’; blood samples from an indwelling line or catheter should not be used for tests of haemostasis because they are prone to dilution and heparin contamination.
The blood is thoroughly mixed with the anticoagulant by inverting the container several times. The samples should be brought to the laboratory as soon as possible. If urgent fibrinolysis tests are contemplated, the blood samples should be kept on crushed ice until delivered to the laboratory. Assays of tPA and of PA1-1 antigen are preferably performed on samples taken into trisodium citrate to prevent continued tPA–PA1-1 binding (see p. 621).
Blood Sample Anticoagulation
The most commonly used anticoagulant for coagulation samples is trisodium citrate. A 32 g/1 (0.109 M) solution (see p. 621) is recommended. Other anticoagulants, including oxalate, heparin and ethylenediaminetetra-acetic acid (EDTA), are unacceptable. The labile factors (factors V and VIII) are unstable in oxalate, whereas heparin and EDTA directly inhibit the coagulation process and interfere with endpoint determinations. Additional benefits of trisodium citrate are that the calcium ion is neutralized more rapidly in citrate and APTT tests are more sensitive to the presence of heparin.
For routine blood coagulation testing, 9 volumes of blood are added to 1 volume of anticoagulant (i.e. 0.5 ml of anticoagulant for a 5 ml specimen). When the haematocrit is abnormal with either severe anaemia or polycythaemia, the blood:citrate ratio should be adjusted.18 For a 5 ml specimen (total), the amount of citrate should be as follows:
| Haematocrit | Citrate (ml) |
|---|---|
| 0.20 | 0.70 |
| 0.25 | 0.65 |
| 0.30 | 0.61 |
| 0.55 | 0.39 |
| 0.60 | 0.36 |
| 0.65 | 0.30 |
| 0.70 | 0.26 |
Time of Sample Collection
Desmopressin: at 30 min after intravenous infusion, 60 min after intranasal.
Calibration and Quality Control
Reference Standard (Calibrator)
International (WHO) and national standards are available for a number of coagulation factors (see p. 589). For diagnostic tests it is necessary to test a calibrated normal reference preparation alongside the patients’ plasmas.
Control Plasma
Controls are included alongside patient samples in a batch of tests. Inclusion of both normal and abnormal controls will enable detection of non-linearity in the standard curve. Whereas a reference standard (calibrator) is used for accuracy, controls are used for precision. Precision control, the recording of the day-to-day variation in control values, is an important procedure in laboratory coagulation. Participation in an external assessment scheme (see p. 594) is also important to ensure inter-laboratory harmonization. The use of lyophilized reference standard and control plasmas has become widespread, whereas locally calibrated standard pools are used especially in under-resourced countries. The results of participation in external qualitycontrol schemes require careful attention. The large number of different reagents, substrate plasmas, reference preparations and analysers available makes comparison of like with like difficult. Ideally all combinations should give similar results, but this is often not the case and the results should be used to carefully choose the combination used.
Performance of Coagulation Tests
Assay Monitoring and Endpoint Detection
Photo-Optical Analysis
 OD/min). Various wavelengths can be used such as 405 nm, 575 nm and 800 nm.
 OD/min). Some analysers detect light transmittance at multiple wavelengths between 395 and 710 nm.
Percentage Detection Method
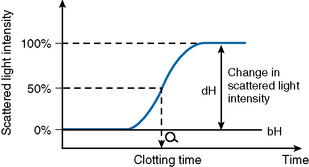
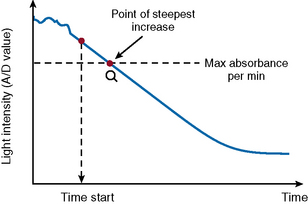
After initiating the clotting reaction, the transmitted light is monitored and a baseline A/D value (bH) is determined for the reaction (bH = 0%) (Fig. 18.2). The reaction is then monitored until the clotting reaction is completed (dH = 100%). The time to an optionally set endpoint, usually 50%, is then determined. At this point the A/D value per unit time shows the greatest change and the fibrin monomer polymerization reaction rate is high. Detection based on this principle enables coagulation analysis to be more accurate at low fibrinogen concentrations in samples with low A/D values and those samples for which the initial amount of A/D value is higher than usual, such as lipaemic and haemolysed samples.
Rate Method
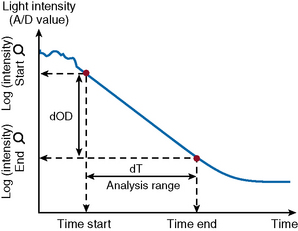
After the start of the reaction, the increase in absorbance per minute is monitored. At the predetermined end time, the final increase in absorbance per minute measurement is made. The rate of the absorbance increase per minute between these two time point measurements is calculated (Fig. 18.3). The calculated change in absorbance (dOD/min) is expressed as the raw data and used to construct a standard curve (i.e. there is no endpoint per se).
VLin Integral Method
The VLin integral method (Fig. 18.4) evaluates the absorbance per minute of an immunological reaction. This is monitored and mathematical analysis used to determine the peak rate of reaction (maximum velocity). Using this method allows for increase in analytical sensitivity, extended measuring range, reduced measurement time and improved antigen excess reliability when measuring an immunological reaction. The VLin integral evaluation method is used for immunological assays, including D-dimer and VWF antigen.
Analysis Time Over
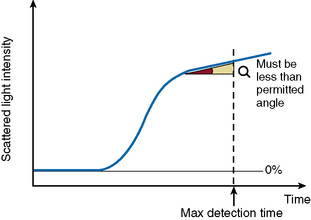
The ‘Analysis Time Over’ check (Fig. 18.5) is used to detect whether the reaction endpoint is correct. If the sample reaction end angle is greater than the permitted angle at maximum detection time, the result will be flagged with an ‘Analysis Time Over’ error. The situation occurs when testing samples with prolonged clotting times and satisfactory endpoint has not been reached by the end of the time allotted for analysis. When this occurs the following checks should be performed:
Turbidity Level Over
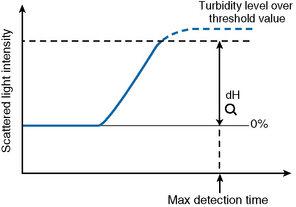
If the dH exceeds the detection capacity of the A/D converter, the result will not be reported and it may be suspected that sample plasma is turbid or lipaemic (Fig. 18.6). When this occurs, the following checks should be performed:
Clot Signatures: Normal and Abnormal APTT Clot Waveforms
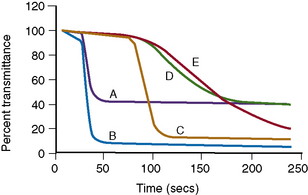
Information on the dynamics of clot formation may also be extracted from the optical profiles generated when performing the PT or APTT tests. It has been demonstrated that such profiles (clot waveforms) show a different pattern in certain clinical conditions compared to normal (Fig. 18.7). Furthermore, the shape of this pattern is predictable for the particular abnormality and the term ‘clot signature’ has been used in this context.
The A2 Flag on the MDA system identifies the presence of a biphasic APTT waveform often seen in patients with DIC and a high sensitivity (98%), specificity (98%) and positive predictive value (74%) have been reported.19
The ‘clotting screen’
Basic tests of coagulation are often performed with no specific diagnosis in mind and in the absence of any clinical indication of a haemostatic disorder. There may be numerous reasons for this and the tests performed may give clues to diagnosis or may detect an unsuspected hazard that increases the risk of postoperative bleeding. Equally, they may produce false-positive abnormalities that cause concern and confusion and delay procedures.15 The choice and extent of tests performed in this screening process will vary between hospitals. Our current practice is to perform PT, APTT, TT and fibrinogen assay.
Prothrombin Time
Reagents
Patient and control plasma samples
Platelet-poor plasma (PPP) from the patient and control is obtained as described on p. 404. Note that plasma stored at 4°C may have a shortened PT as a result of factor VII activation in the cold.
Thromboplastin
Thromboplastins were originally tissue extracts obtained from different species and different organs containing tissue factor and phospholipid. Because of the potential hazard of viral and other infections from handling human brain, it should no longer be used as a source of thromboplastin. The majority of animal thromboplastins now in use are extracts of rabbit brain or lung. A laboratory method for a rabbit brain preparation, of use in under-resourced laboratories, is described on p. 613.
Each preparation has a different sensitivity to clotting factor deficiencies and defects, in particular the defect induced by oral anticoagulants. For control of oral anticoagulation a preparation calibrated against the International Reference Thromboplastin should be used (see Chapter 20). It is important to remember that some thromboplastins are not sensitive to an isolated factor VII deficiency and that use of animal thromboplastin for analysis of human samples may produce abnormalities solely as a result of species differences.
Expression of Results
The results are expressed as the mean of the duplicate readings in seconds or as the ratio of the mean patient’s plasma time to the mean normal control plasma time. The control plasma is obtained from 20 normal men and women (not pregnant and not taking oral contraceptives) and the geometric mean normal PT (MNPT) is calculated. (For further details and a discussion of the importance of the PT in oral anticoagulant control, when results may be reported as an International Normalized Ratio [INR], see Chapter 20.)
Activated Partial Thromboplastin Time
Reagents
Thrombin Time
Reagents
Interpretation of Results
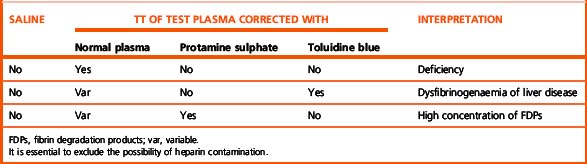
The common causes of prolonged TT are as follows:
Shortening of the TT occurs in conditions of coagulation activation.
A gross elevation of the plasma fibrinogen concentration may also prolong the TT. Correction can be obtained by diluting the patient’s plasma with saline (see p. 417).
Measurement of Fibrinogen Concentration
Numerous methods of determining fibrinogen concentration have been devised, including clotting, immunological, physical and nephelometric techniques, and all tend to give slightly different results, presumably partly because of the heterogeneous nature of plasma fibrinogen.21 Many automated analysers will now provide an estimate of fibrinogen concentration determined from the coagulation changes during the PT (PT-derived fibrinogen). This is simple, inexpensive and widely used. However, its use is not recommended because it is inaccurate (overestimates fibrinogen) in some disease states and in patients who are anticoagulated.22,23 Guidelines on fibrinogen assays have been published and recommend the Clauss technique for routine laboratory use.24
Fibrinogen Assay (Clauss Technique)
Principle
Diluted plasma is clotted with a strong thrombin solution; the plasma must be diluted to give a low level of any inhibitors (e.g. FDPs and heparin). A strong thrombin solution must be used so that the clotting time over a wide range is independent of the thrombin concentration.25
Reagents
Method
The clot formed in this method may be ‘wispy’ as a result of the plasma being diluted and endpoint detection may be easier with optical or mechanical automated equipment. These have been assessed with available substrates and give reasonably consistent results.26 The high concentration of thrombin used raises the risk of carry over into subsequent tests.
Interpretation
The Clauss fibrinogen assay is usually low in inherited dysfibrinogenaemia but is insensitive to heparin unless the level is very high (>0.8 u/ml). High levels of FDPs (>190 μg/ml) may also interfere with the assay.27 Because the chronometric Clauss assay is a functional assay it will generally give a relevant indication of fibrinogen function in plasma. When an inherited disorder of fibrinogen is suspected, a physicochemical estimation should be obtained (e.g. clot weight estimate of fibrinogen or total clottable fibrinogen or an immunological measure; see p. 424). If a dysfibrinogenaemia is present, it will reveal a discrepancy between the (functional) Clauss assay and the physical amount of fibrinogen present.
Interpretation of First-Line Tests
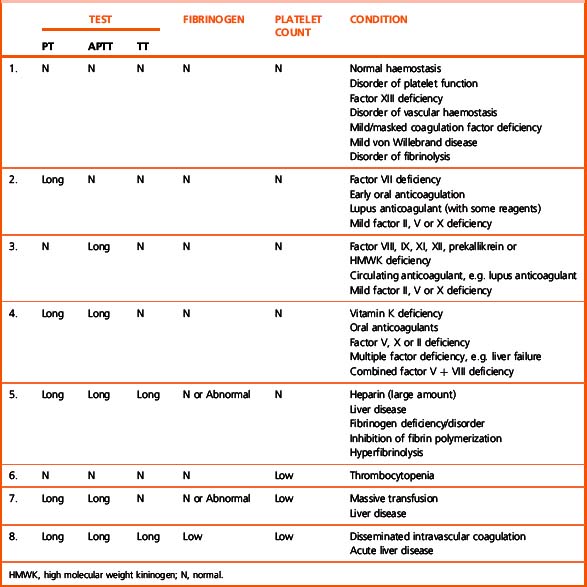
The pattern of abnormalities obtained using the first-line tests described earlier often gives a reasonably clear indication of the underlying defect and determines the appropriate further tests required to define it. The patterns are outlined in Table 18.3. The further tests that include specific factor assays and tests for DIC are described in the following sections.
Second-line investigations
1
| PT | Normal |
| APTT | Normal |
| Thrombin time | Normal |
| Fibrinogen concentration | Normal |
| Platelet count | Normal |
Second-line investigations required in this situation are specific factor assays for the suspected deficiencies or appropriate screening tests such as the PFA-100 system (see p. 425) or factor XIII assay. Note that some LMWH may be present at therapeutic levels without abnormality of the coagulation screening tests; an anti-Xa assay will reveal their presence.
2
| PT | Long |
| APTT | Normal |
| Thrombin time | Normal |
| Fibrinogen concentration | Normal |
| Platelet count | Normal |
This combination of results is found in the following:
3
| PT | Normal |
| APTT | Long |
| Thrombin time | Normal |
| Fibrinogen concentration | Normal |
| Platelet count | Normal |
An isolated prolonged APTT is found in the following:
The next diagnostic step is to establish whether the patient has a deficiency or an inhibitor by performing the 50:50 mixture test described on p. 421. Mixing tests should be done immediately, followed by the specific assay or tests, as described later.
4
| PT | Long |
| APTT | Long |
| Thrombin time | Normal |
| Fibrinogen concentration | Normal |
| Platelet count | Normal |
The main causes of a prolonged PT and APTT are as follows:
5
| PT | Long |
| APTT | Long |
| Thrombin time | Long |
| Fibrinogen concentration | Normal/abnormal |
| Platelet count | Normal |
Abnormalities in all three screening coagulation tests are found in the following:
7
| PT | Long |
| APTT | Long |
| Thrombin time | Normal |
| Fibrinogen concentration | Normal/abnormal |
| Platelet count | Low |
This pattern of abnormalities of the screening tests is found:
Specific factor assays may be useful if the situation persists. Consider the possibility that the low platelet count has a separate aetiology and that the situation is in fact the same as in Section 4.
8
| PT | Long |
| APTT | Long |
| Thrombin time | Long |
| Fibrinogen concentration | Low |
| Platelet count | Low |
Correction Tests Using the PT or APTT
Reagents
Method
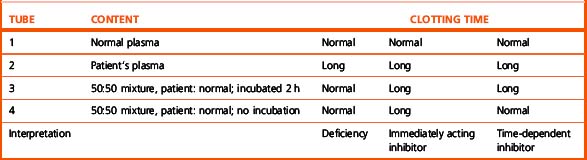
Perform a PT and/or APTT on control, patient’s and a 50:50 (0.05 ml of each) mixture of the control and patient plasma. Perform all the tests in duplicate using a balanced order to avoid time bias. Note that mixing experiments to detect factor VIII inhibitors may require incubation for 2 h (see p. 422).
Interpretation
However, mixing tests may be misleading in two particular circumstances:
Investigation of a bleeding disorder resulting from a coagulation factor deficiency or defect
General Principles of Parallel Line Bioassays of Coagulation Factors
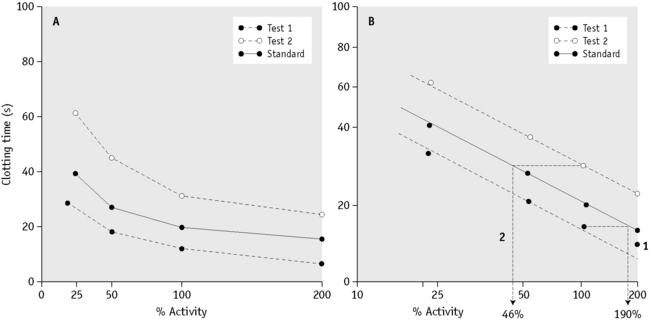
If two materials containing the same coagulation factor are assayed in a specific assay system in a range of dilutions and the clotting times are plotted against the plasma concentration on linear graph paper, curved dose–response lines are obtained. If the plot is redrawn on double-log paper, a sigmoid curve with a straight middle section is obtained (Fig. 18.8), although in some cases (e.g. factor VIII) semi-log paper is required. If the dilutions of the test and standard materials are chosen carefully, it should be possible to draw two straight parallel lines. The horizontal distance between the two lines represents the difference in potency (‘strength’ or concentration) of the factor assayed. If the test line is to the right of the standard, it contains less of the factor than the standard; if it is to the left, it contains more. The assay is based on the assumption that both test and control behave like simple dilutions of each other. This assumption has caused some problems when assaying samples containing factor VIII or IX concentrates (see below).
Assays Based on the Prothrombin Time
One-Stage Assay of Factor VII
Reagents
Calculation of Results
Plot the clotting times of the test and standard against the concentration of factor VII on log-log graph paper. Read the concentration as shown in Figure 18.8.
Assays Based on the Activated Partial Thromboplastin Time
One-Stage Assay of Factor VIII
Principle
The one-stage assay for factor VIII29,30 is based on the APTT according to the bioassay principle described earlier.
Reagents
Calculation of Results
Plot the clotting times of the test and standard against the concentration of factor VIII on semi-log paper. Read the concentration as shown in Figure 18.8. It is important to obtain straight and parallel lines if the result is to be accurate. The reasons for non-parallelism and curvature are as follows:
Normal Range
The normal range is 45–158 iu/dl. Each laboratory should determine its own normal range.
Further Tests in Haemophilia A
Reduction in factor VIII secondary to VWD should be excluded. VWF:Ag and VWF:RCo (described later) should be measured and the patient’s family history should be investigated. A low factor VIII with normal VWF:Ag and VWF:RCo may also result from the Normandy type VWD (Type 2N), which should be suspected when there is not a clear sex-linked family history and which can be confirmed by a VWD–factor VIII binding assay.31
Two-Stage and Chromogenic Assays for Factor VIII
The one-stage factor VIII assay is sensitive to preactivation of coagulation factors in the patient sample. The two-stage and chromogenic assays circumvent this problem by preactivating all the available factor VIII and then assaying this in a separate system by its ability to generate Xa. In the chromogenic assay this is measured using a chromogenic Xa substrate; in the two-stage assay it is measured by a clotting endpoint. In general these have proved too cumbersome or expensive for widespread use and preactivation is rarely a significant problem. However, a clinically significant discrepancy between the two types of assay has been reported in some cases of mild haemophilia. In these cases mutations destabilizing the interaction between the A1 and A2 domains result in a one-stage assay result that is higher than that obtained by two stage. Most significantly, the patient’s clinical problem is more in keeping with the two-stage assay result.32,33 The reverse phenomenon (two-stage higher than one stage) can also occur but is not associated with bleeding.34 The chromogenic assay has also found utility in avoiding some of the problems encountered assaying factor VIII concentrates.
Monitoring Replacement Therapy in Coagulation Factor Defects and Deficiencies
Estimations of factor VIII levels in patients with haemophilia treated with factor VIII concentrates often yield discrepant results. This is primarily because the factor VIII concentrate (diluted in haemophilic plasma) is compared with a plasma standard. In general, two-stage or chromogenic assays reveal greater potency than one-stage assays in this situation. This has been particularly noted in patients who have been treated with B domainless factor VIII (Refacto, Wyeth). In this case a product-specific reference preparation is available from the company. It is recommended that this is used in conjunction with a chromogenic assay, but this may not be necessary.35–37 In most other cases the clinical experience of using results from one-stage assays remains valid.
Assays of factor VIII concentrates are fraught with difficulty and a detailed discussion is beyond the scope of this chapter.35,38 The difficulties arise from several problems. First, the concentrate potency may be assigned using either a one-stage assay (as in the USA) or the chromogenic assay (as in Europe). Second, many concentrates, even when diluted in haemophilic plasma, behave differently in one-stage and chromogenic assays. As a result, there are separate WHO standards for factor VIII measurement: a plasma for measurement of factor VIII in plasma samples and a concentrate for measurement of factor VIII in concentrates. This is based on the principle of assaying like against like, although there are so many different concentrates with different characteristics that this is difficult to truly achieve and all must eventually be calibrated against a single plasma pool.37
Investigation of a Patient Whose APTT and PT are Prolonged
A prolonged APTT and PT but a normal TT in a patient with a bleeding disorder may be the result of a defect or deficiency of one of the factors of the common pathway: factor X, factor V or prothrombin. In addition, the patient could be suffering from the much rarer combined deficiency of factors V and VIII. Liver disease and vitamin K deficiency should always be excluded, even in the presence of a family history of bleeding. Mixing tests illustrated on p. 422 may help to pinpoint the defect; the missing factor or factors should be estimated quantitatively. Factor X, factor V and prothrombin can all be assayed satisfactorily using a prothrombin-based assay as described for factor VII. The Taipan venom assay for prothrombin and the Russell’s viper venom assay for factor X are described in the 8th edition of this book.
Investigation of a patient with a circulating anticoagulant (inhibitor)
The most common anticoagulant in haemostatically normal people is the LAC, but despite the prolongation of clotting tests in vitro, this anticoagulant predisposes to thrombosis and its diagnosis and investigation therefore are considered on p. 448. Of the anticoagulants that cause a bleeding tendency, antibodies to factor VIII are most common, either in haemophiliacs or as autoantibodies in previously normal individuals. Patients with haemophilia usually develop antibodies with simple kinetics; this inhibitor reacts with factor VIII in a linear fashion and the antigen–antibody complex has no factor VIII activity. Antibodies in non-haemophilic individuals or patients with mild/moderate haemophilia usually develop antibodies with complex kinetics: inactivation of factor VIII is at first rapid, but it then slows as the antigen–antibody complex either dissociates or displays some residual factor VIII activity. Addition of further factor VIII results to the same residual (equilibrium) factor VIII activity.
Inhibitors directed against other coagulation factors are very rare, but an acquired form of VWD may arise in this way, usually from a paraprotein. Hypoprothrombinaemia owing to autoantibodies is a rare complication of systemic lupus erythematosus.39 Only the factor VIII inhibitor assays are described in detail in this section.
Circulating Inhibitor (Anticoagulant) Screen Based on the APTT
Reagents
Results and Interpretation
See Table 18.5. Note that the incubation period results in a prolongation of the normal plasma APTT.
Method for Detecting Inhibitors in Patients with Haemophilia
A simple inhibitor screen has been reported to be more sensitive than a Bethesda assay in monitoring for the development of inhibitors in haemophilia A and B. Add 0.4 ml patient plasma (or factor-deficient control plasma) to 0.1 ml of 5 iu/ml factor VIII or IX concentrate, giving a final concentration of 1 iu/ml. Mix gently and incubate at 37°C for 60 min for haemophilia A patients and 10 min for haemophilia B patients. Perform appropriate factor assay for the patient and control sample; if the factor level in the patient sample is less than 90% of the control sample the inhibitor screen is positive.40
Quantitative Measurement of Factor VIII and Other Inhibitors
Principle
Factor VIII inhibitors41 are usually time dependent.38 Thus if factor VIII is added to plasma containing an inhibitor and the mixture is incubated, factor VIII will be progressively neutralized. If the amount of factor VIII added and the duration of incubation are standardized, the strength of the inhibitor may be measured in units according to how much of the added factor VIII is destroyed.
Inhibitor Assay Modifications
The Bethesda assay and Nijmegen modification give similar results at high levels of factor VIII inhibition. Reports have shown that shifts in pH and protein concentrations will lead to changes in factor VIII stability and inactivation. Factor VIII inactivation increases with pH and reduced protein concentration leads to further inactivation of factor VIII activity. This can result in false-positive results using the unmodified Bethesda method. The Nijmegen modification prevents these discrepancies by buffering normal plasma with 0.1 M imidazole buffer at pH 7.4 and using immunodepleted factor VIII-deficient plasma in the control mixture.42 The assay can also be modified to use factor VIII concentrate (Oxford method) or by increasing the incubation time to 4 h (New Oxford method).
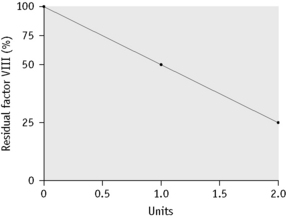
Calculation of Results
Record the residual factor VIII percentage for each mixture assuming the assay value of the control to be 100%. The dilution of test plasma that gives the residual factor VIII percentage nearest to 50% (between 30% and 60%) is chosen for calculating the strength of inhibitor. Results are calculated as shown in Figure 18.9 and in Table 18.6 for three different patients with a mild inhibitor only detected in undiluted plasma, a stronger inhibitor with simple kinetics and an inhibitor with complex kinetics, respectively.

Investigation of a patient suspected of afibrinogenaemia, hypofibrinogenaemia or dysfibrinogenaemia
A patient suspected of afibrinogenaemia, hypofibrinogenaemia or dysfibrinogenaemia43 usually has a prolonged APTT, PT and TT. The prolongation of the PT is usually less marked than that of the APTT and TT. There may be either a history of bleeding or of recurrent thrombotic events but many patients (c50%) are asymptomatic. It is important that a physical estimation of fibrinogen (such as the clot weight) is obtained as well as a function-based assay (e.g. Clauss).
Fibrinogen Estimation (Dry Clot Weight)
Principle
Fibrinogen in plasma is converted into fibrin by clotting with thrombin and calcium. The resulting clot is weighed and may include other proteins such as some FDPs. It is, however, simpler than the total clottable protein method used for the international standard44 and provides a useful comparison for the Clauss.
Further Investigations
Whenever a congenital fibrinogen abnormality is suspected, DIC and hyperfibrinolysis must be excluded; FDP should not be in excess and there should be no evidence of the consumption of other coagulation factors and platelets (see p. 440). Immunological or chemical determination of fibrinogen concentration is the next step in investigation. In dysfibrinogenaemias there is often a normal or even raised plasma fibrinogen concentration using these methods, although the functional assays indicate a deficiency. Other tests that may be helpful are the Reptilase time, fibrinopeptide release, factor XIII cross-linking, tests of polymerization, binding to thrombin and lysis by plasmin. DNA analysis to detect the mutation responsible may be useful to allow comparison with other reported phenotypes. Testing the parents or other family members is sometimes a useful means for establishing whether a hereditary fibrinogen abnormality is present.
Defects of primary haemostasis
Investigation of the Vascular Disorders of Haemostasis
In general, the tests of coagulation available in the laboratory will be of little help in elucidating such defects. The only test of possible use is the bleeding time. Tests of capillary resistance are of little value. A careful clinical history and physical examination are most likely to provide the basis for diagnosis. Particular attention should be paid to previous scars, associated signs of the inherited syndromes and evidence of systemic disease. In some cases a tissue biopsy may be useful, but confirmation of the diagnosis requires analysis of collagen from cultured fibroblasts or DNA analysis of the relevant candidate genes.45
Laboratory Tests of Platelet–von Willebrand Factor Function
The PFA-100 System
Studies have shown this system to be sensitive to platelet adherence and aggregation abnormalities and to be dependent on normal VWF, glycoprotein Ib and glycoprotein IIbIIIa levels but not on plasma fibrinogen or fibrin generation.46
The PFA-100 system may reflect VWF function better than the bleeding time, but it is not sensitive to vascular-collagen disorders.47,48 Studies have shown that many patients with minor platelet disorders such as secretion defects are not detected by the PFA-100.49
Investigation of suspected von willebrand disease
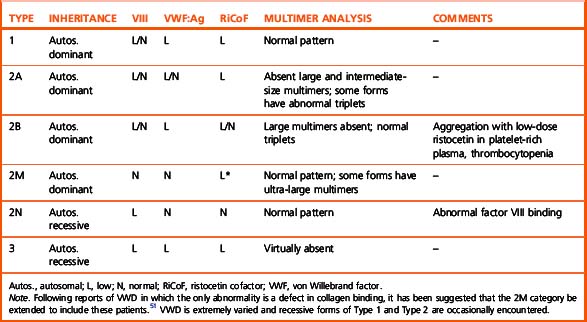
A diagnosis of VWD50,51 should be considered in individuals with a relevant history or family history of bleeding, particularly of the mucosal type. Although a prolonged bleeding time and APTT in screening tests is suggestive, these are normal in many patients with VWD and specific assays must be performed. Preliminary screening with a test such as the PFA-100 may be useful in excluding borderline cases. All relevant activities (i.e. factor VIII concentration; VWF:Ag concentration; collagen binding activity, VWF:CB; and ristocetin cofactor activity, VWF:RiCoF) should be measured. When interpreting the results, the very wide range of VWF levels in the normal population and the effect of ABO blood group should be borne in mind. It is apparent that many individuals with levels down to 30% of normal do not have any significant bleeding tendency and caution should be exercised in diagnosing VWD on the basis of moderately low VWF levels alone.50–53
Thus, if an abnormality is detected it should be considered in relation to the clinical history. When a discrepancy between antigen and function is found (i.e. function is <70% of the antigen) multimer analysis of the plasma should be performed. In normal plasma, each multimer of VWF (a large molecule consisting of 2 to >20 subunits of VWF) is seen to be composed of a ‘triplet,’ a dark central band sandwiched between two lighter bands; high molecular weight multimers predominate. In VWD, the multimer analysis may be superficially normal, there may be no VWF:Ag detectable, the high molecular weight forms necessary for normal platelet adhesion may be lacking or the triplet pattern may be abnormal. On the basis of these results VWD can be classified as shown in Table 18.7.50,51
Enzyme-Linked Immunosorbent Assay for Von Willebrand Factor Antigen
Principle
ELISA involves coating a special microtitre plate with a primary antibody to von Willebrand factor antigen (VWF:Ag).52 A suitable dilution of the test plasma is added to the wells, allowing the VWF:Ag to bind to the primary antibody. After removal of excess antigen by washing the plate, a second antibody, conjugated to an enzyme, usually peroxidase and called the ‘tag’ antibody, is added and this binds to the VWF:Ag already bound to the plate. On addition of a specific substrate, a colour change occurs. After the reaction has been stopped with acid, the optical density (OD) of each well can be measured using an electronic plate reader; the OD is directly proportional to the amount of VWF:Ag present in the test plasma.
Reagents
Ristocetin Cofactor Assay
Principle
Washed platelets do not ‘agglutinate’ in the presence of ristocetin unless normal plasma is added as a source of VWF. ‘Agglutination’ follows a dose–response curve dependent on the amount of plasma/VWF added. Freshly washed platelets or formalin-fixed platelets can be used in the assay. Fixed platelets take longer to prepare but are not susceptible to aggregation (as distinct from ‘agglutination’) with ristocetin and they can be stored so that they are available for emergency use. Freshly washed platelets are quicker to prepare and retain a functional platelet membrane, but they cannot be retained for later use. Commercial lyophilized, fixed, washed platelet preparations are available. Once reconstituted these preparations are stable for several weeks and should enhance assay standardization.54
Assay Using Fresh Platelets
Results
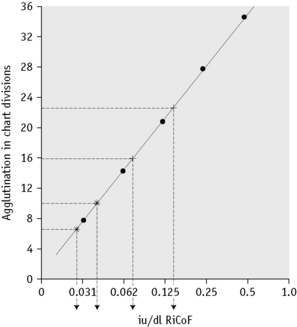
Plot the standard curve on semi-log paper with agglutination on the linear scale and the concentration of VWF in iu/dl on the log scale (Fig. 18.10). For assay purposes, assign the 1 in 2 dilution of standard plasma a value of 0.50 iu/ml. (Each batch of standard is precalibrated and may not necessarily be 1.0 iu/ml.)
Interpretation
The VWF concentration measured by ristocetin cofactor assay should be interpreted in conjunction with other factor VIII and VWF:Ag assays, as shown in Table 18.7.
Collagen Binding Assay (ELISA)
The collagen binding assay ELISA method is based on the ability of VWF to bind collagen. The source of collagen is an important variable and wells of the ELISA test strips are coated with human collagen type III although type I and type I/III mixtures have also been used.55 After incubation with the test plasma, the amount of VWF bound is detected using an anti-VWF peroxidase-conjugated antibody. Antibody-peroxidase binding is quantified in the usual way and the intensity of the colour generated is directly proportional to the VWF:CB concentration. Using a reference curve, the VWF:CB is quantified.
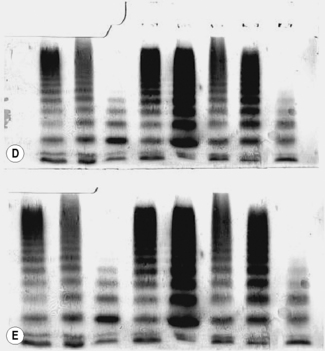
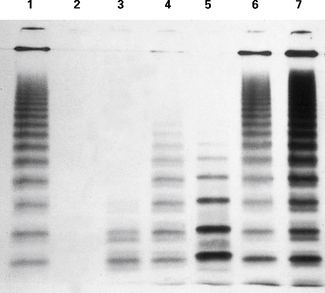
Multimeric Analysis of von Willebrand Factor Antigen in Plasma Samples
Non-Radioactive Multimer Method
Multimeric analysis of von Willebrand factor antigen is important in the diagnosis and treatment of VWD.56 The gold standard method is the autoradiographic method described by Enayat and Hill.56 This method uses radioactive iodine (I125) and is performed in only a few specialized centres.
Preparation of Buffers
Preparation of Gels
Scanning the Developing Gel
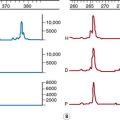
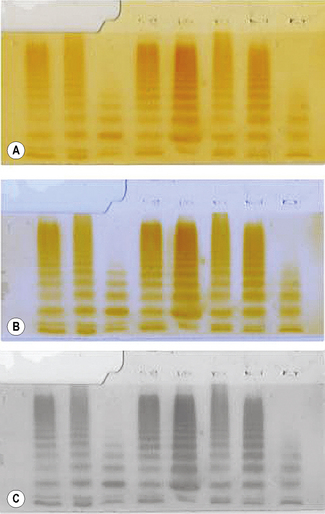
The scanned gel will appear as shown as in Figure 18.11A. The top section is the stacking gel where the samples were added prior to electrophoresis; the main body of the gel is the running gel showing the multimer patterns. The scan is manipulated using photographic editing software (see Fig. 18.11C,D) and the final result shown in Figure 18.11E.
Investigation of a Suspected Disorder of Platelet Function, Inherited or Acquired
(For investigation assays of VWD, see p. 425; for diagnosis of thrombocytopenia, see p. 610.)
Laboratory Investigation of Platelets and Platelet Function
The peripheral blood platelet count and, for some laboratories, PFA-100 are first-line tests of platelet function.58,59 However, some disorders of platelet function are not detected by these tests. Additional information may be obtained by inspecting a fresh blood film, which may show abnormalities of platelet size or morphology that may be of diagnostic importance.
If the screening procedures or clinical history suggest a disorder of primary haemostasis and VWF function is normal, further tests should be organized. Drugs and certain foods (Table 18.8) may affect platelet function tests and the patient must be asked to refrain from taking such substances for at least 7 days before the test.
Table 18.8 Substances that commonly affect platelet function
| Agents that affect prostanoid synthesis |
| Aspirin |
| Non-steroidal anti-inflammatory drugs |
| Corticosteroids |
| Agents that bind to platelet receptors and membranes |
| α-antagonists |
| β-blockers |
| Antihistamines |
| Tricyclic antidepressants |
| Local anaesthetics |
| Ticlopidine |
| Clopidogrel |
| IIbIIIa blocking agents |
| Selective serotonin reuptake inhibitors (SSRIs) |
| Antibiotics |
| Penicillin |
| Cephalosporins |
| Agents that increase cyclic adenosine monophosphate levels |
| Dipyridamole |
| Aminophylline |
| Prostanoids |
| Others |
| Heparin |
| Chondroitin sulphate and glucosamine |
| Dextran |
| Ethanol |
| Clofibrate |
| Phenothiazine |
| Garlic |
The usual sequence of investigation is shown in Figure 18.13. Platelet function tests can be divided into six main groups (Table 18.9): adhesion tests, aggregation tests, assessment of the granular content, assessment of the release reaction, investigation of the prostaglandin pathways and tests of platelet coagulant activity. Expression of platelet glycoproteins can be assessed by flow cytometry, although this does not necessarily correlate with functional activity.
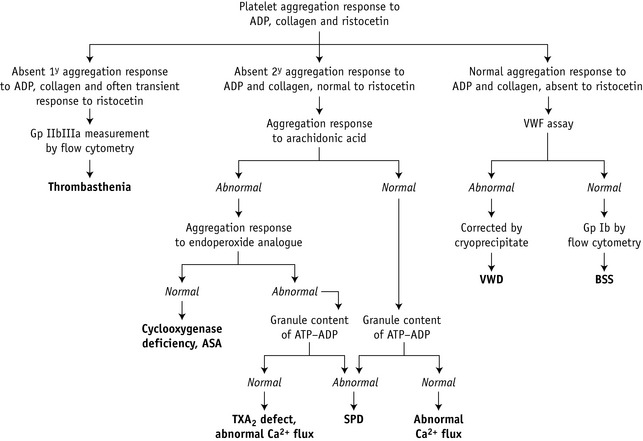
Table 18.9 Platelet function tests
| Adhesion tests |
| Retention in a glass-bead column |
| Baumgartner’s technique |
| PFA-100 |
| Aggregation tests |
| Turbidometric technique using |
| ADP |
| Collagen |
| Ristocetin |
| Adrenaline (epinephrine) |
| Thrombin |
| Arachidonic acid |
| Endoperoxide analogues |
| Calcium ionophore |
| Investigation of granule content and release |
| Dense bodies |
| Electron microscopy |
| ADP and ATP content (bioluminescence) |
| Serotonin release |
| Granules |
| β-thromboglobulin |
| Platelet factor 4 |
| VWF |
| Fluorescence by flow cytometry |
| Prostaglandin pathways |
| TXB2 radioimmunoassay |
| Platelet coagulant activity |
| Prothrombin consumption index |
| Flow cytometry |
| Glycoprotein surface expression |
| Activation |
| P selectin (CD62) surface expression |
| Fibrinogen binding |
| Annexin binding (to phosphatidyl serine) |
| Conformational changes in Gp IIbIIIa |
| Platelet granule fluorescence |
ADP, adenosine 5′-diphosphate; ATP, adenosine 5′-triphosphate; VWF, von Willebrand factor. Gp, glycoprotein.
Platelet Aggregation
Reagents
Test and control platelet-rich plasma
The patient and control subject should not have ingested any drugs, beverages or foods that may affect aggregation for at least 10 days (Table 18.8) and preferably should have fasted overnight because the presence of chylomicra may also disturb the aggregation patterns. Collect 20 ml of venous blood with minimal venous occlusion and add to a one-tenth volume of trisodium citrate (see p. 621) contained in a plastic or siliconized container. The blood should not be chilled because cold activates the platelets. PRP is obtained by centrifuging at room temperature (c 20°C) for 10–15 min at 150–200 g. Carefully remove the PRP, avoiding contamination with red cells or buffy coat, and place in a stoppered plastic tube. Store at room temperature until tested. This is stable for about 3 h. It is important to test all samples after a similar interval of time (say 1 h) and to store them at the same temperature to minimize variation.
Test and control platelet-poor plasma
Centrifuge the remaining blood at 2000 g for 20 min to obtain PPP.
Use of platelet-rich plasma
A platelet count is performed on the PRP. Adjustment of the platelet count in the PRP is not recommended because this inhibits platelet activation.60 PRP should always be stored in tightly stoppered tubes that are filled nearly to the top to avoid changes in pH, which also affect platelet aggregation and tests of nucleotide release.
Aggregating agents
The five aggregating agents listed in the following should be sufficient for the diagnosis of most functional disorders. A recent study recommended a minimal screening panel of 1.25 μg/ml collagen, 6 μM epinephrine, 1.6 mM arachidonic acid and 1.0 μM U44619 (endoperoxide analogue).61 This combination had high specificity but relatively poor sensitivity and was frequently coupled with additional tests such as nucleotide release. For research purposes and when investigating unusual kindreds, other agonists listed in Table 18.9 may also be used.
Interpretation
Normal and abnormal platelet aggregation curves are shown in Figures 18.14 and 18.15.
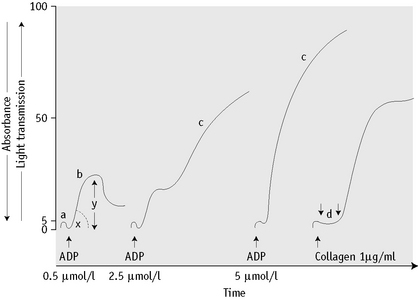
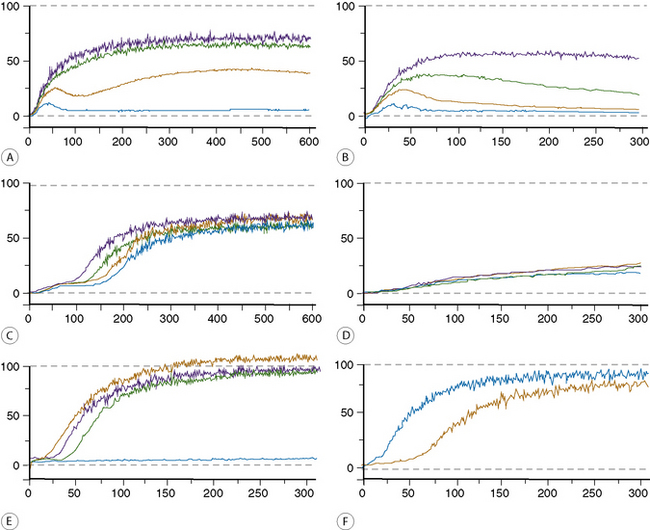
Figure 18.15 (A–F) Some examples of platelet aggregation analyses.
(A) Normal and (B) abnormal, responses to adenosine diphosphate.
(C) Normal and (D) abnormal, responses to epinephrine.
(E) Responses to collagen and ristocetin.
Blue Low-dose ristocetin 0.75 mg/ml
Yellow High-dose ristocetin 1.5 mg/ml
Green Low-dose collagen 5 μg/ml
Black High-dose collagen 10 μg/ml
(F) Responses to arachidonic acid.
Adenosine 5′-diphosphate
Low concentrations of ADP (<0.5 to 2.5 μmol/l) cause primary or reversible aggregation. First, ADP binds to a membrane receptor and releases Ca2+ ions. A reversible complex with extracellular fibrinogen forms and the platelets undergo a shape change reflected by a slight increase in absorbance. After this, the bound fibrinogen adds to the cell-to-cell contact and reversible aggregation occurs. At very low concentrations of ADP, platelets may disaggregate after the first phase. In the presence of higher concentrations of ADP an irreversible secondary wave aggregation is associated with the release of dense and α-granules as a result of activation of the arachidonic acid pathway. If only high doses of ADP are used, defects in the primary wave (measuring the second pathway as described on p. 396) will be missed.
Calculation of Results
Results can be expressed in one of three ways:59,60
Normal Range
The platelets of normal subjects usually produce a single reversible primary wave with 1 μmol/l ADP or less, biphasic aggregation with ADP at 2.5 μmol/l and a single irreversible wave at 5 or 10 μmol/l. A single-phase response is observed after a lag phase lasting not more than 1 min with 1 and 4 μg/ml of collagen. A single-phase or biphasic response is seen with 1.2 mg/ml of ristocetin and after 50 and 100 μmol/l of arachidonic acid. Normal ranges have been compiled for the common agonists.62 Interpretation can be difficult but reduced maximal aggregation with two or more agonists is highly indicative of a bleeding disorder.61 Biphasic aggregation is observed with 2–10 μmol/l of adrenaline. A response to a low concentration of ristocetin (0.5 mg/ml) is abnormal and is a feature of type 2B VWD (see below).
Interpretation and Technical Artefacts
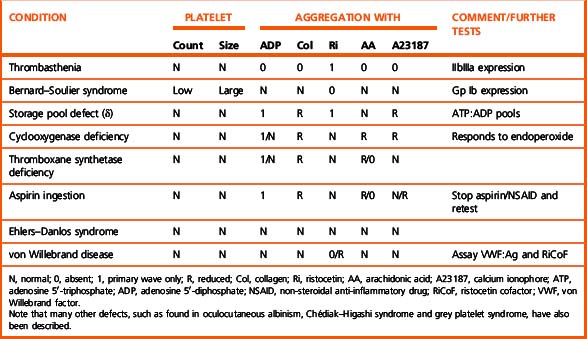
The pattern of responses in various disorders of platelet function is shown in Table 18.10. For a discussion of hyperaggregability, see p. 461.
Some common technical problems associated with platelet aggregation are described in Table 18.11.
Table 18.11 Technical factors that may influence platelet aggregation tests
| Centrifugation | At room temperature, not at 4°C. Should be sufficient to remove red cells and white cells but not the largest platelets. Residual red cells in the PRP may cause apparently incomplete aggregation. |
| Time | For 30 min after the preparation of the PRP, platelets are refractory to the effect of agonists. Progressive increase in reactiveness occurs thereafter; more marked from 2 h onward. |
| Platelet count | Slow and weak aggregation observed with platelet counts below 150 or over 400 × 109/l. |
| pH | <7.7 inhibits aggregation; pH >8.0 enhances aggregation. |
| Mixing speed | <800 rpm or >1200 rpm slows aggregation. |
| Haematocrit | >0.55 is associated with less aggregation, especially in the secondary phase owing to the increased concentration of citrate in PRP. Use a lower citrate:blood ratio. It may also be difficult to obtain enough PPP. Centrifuging twice may help. |
| Temperature | <35°C causes decreased aggregation except to low-dose ADP, which may be enhanced. |
| Dirty cuvette | May cause spontaneous platelet aggregation or interfere with the optics of the system. |
| Air bubbles in the cuvette | Cause large, irregular oscillations, even before the addition of agonists. |
| No stir bar | No response to any agonist obtained. |
PPP, platelet-poor plasma; PRP, platelet-rich plasma.
Further Investigation of Platelet Function
If an abnormal aggregation pattern is observed, it is advisable to check the assessment on at least one further occasion. If the aggregation tests are persistently abnormal and the patient is not taking any drugs or substances known to interfere with platelet function, the following tests should be done (Fig. 18.13 and Table 18.10):
Clot solubility test for factor XIII
Principle
Fibrin clots formed in the presence of factor XIII and thrombin are stable (as a result of crosslinking) for at least 1 h in 5 mol/l urea, whereas clots formed in the absence of factor XIII dissolve rapidly. Quality assurance surveys in the UK have shown that the solubility test for XIII is more sensitive when the sample is clotted with thrombin rather than calcium. Thrombin preparations containing calcium should not be used. The use of 5 M urea as described here will detect factor XIII deficiency of up to 5 iu/dl. One study suggested that deficiency of up to 10% could be detected by using 2% acetic acid as the lysing solution.64
Interpretation
The control clot, if normal, shows no sign of dissolving after 24 h. However, in the absence of factor XIII, the clot will have dissolved. The test is reported as normal if the clot is present and abnormal if the clot is absent. The clot solubility test has poor sensitivity and may only detect levels below approximately 5 iu/dl. The relationship between factor XIII level and adequate haemostasis is uncertain, but there is some evidence that levels of 5–40 iu/dl may also be associated with bleeding. In suspected cases photometric and ELISA assays of factor XIII are available for quantitative measurements.65 The introduction of these assays into routine practice may clarify the significance of intermediate levels of factor XIII activity.
Disseminated intravascular coagulation
The diagnosis of acute DIC can generally be made from abnormalities of the basic first-line screening tests described earlier occurring in an appropriate clinical context. Characteristically, the PT, APTT and TT are all prolonged and the fibrinogen level is markedly reduced. In association with the consumption of clotting factors responsible for these abnormalities there is also a fall in platelet count also resulting from consumption. As DIC develops, a decrease in platelet count is an early sign and hypofibrinogenaemia may be relatively late. This distinguishes it from dilutional coagulopathy in which the reverse is usually the case. Concomitantly there is activation of the fibrinolytic system and an increase in circulating fibrin(ogen) degradation products. These abnormalities form the basis for the diagnosis of DIC. Diagnostic guidelines are available but are most useful in clinical trials rather than routine practice.66 More elaborate tests are not usually performed but can demonstrate reductions in individual clotting factors, antithrombin and antiplasmin and increased levels of thrombin–antithrombin and plasmin–antiplasmin complexes and of activation peptides such as prothrombin F1+2. Some analysers provide a waveform analysis that can detect early stages of DIC.67
Detection of Fibrinogen/Fibrin Degradation Products Using a Latex Agglutination Method
Principle
A suspension of latex particles is sensitized with specific antibodies to the purified FDP fragments D and E. The suspension is mixed on a glass slide with a dilution of the serum to be tested. Agglutination indicates the presence of FDP in the sample. By testing different dilutions of the unknown sample, a semiquantitative assay can be performed.68
Reagents
Detection of Crosslinked Fibrin D-Dimers Using a Latex Agglutination Method
Normal Range
Plasma levels in normal subjects are <200 mg/l. There has been much study of D-dimer assays as a useful way of excluding thrombosis, but there is naturally a compromise between sensitivity and specificity, especially when a rapid turnaround time is required. The lack of an international standard and the poor correlation between kits mean that the use of kits for this purpose should be validated individually. A number of kits using ELISA methods for the detection of D-dimers are now available that have greater sensitivity but are more cumbersome to perform. Latex tests using automated analysers may provide an acceptable compromise.69 These tests have now been incorporated into clinical guidelines according to their sensitivity.70
Phenotype Investigation
When a detailed family study has been carried out it may be possible to establish the statistical chance of inheriting a coagulation defect. (For a review, see Graham et al.71)
Genotype Assignment
The techniques required for these analyses are described in Chapter 21. The problem of carrier determination and antenatal diagnosis has been dealt with in a comprehensive World Health Organization/World Federation of Hemophilia review.72 Although the options for affected families increase,73,74 approximately one-third of cases arise with no preceding family history.
1 Cines D.B., Pollak E.S., Buck C.A., et al. Endothelial cells in physiology and in the pathophysiology of vascular disorders. Blood. 1998;91(10):3527-3561.
2 Frank P.G., Woodman S.E., Park D.S., et al. Caveolin, caveolae and endothelial cell function. Arterioscler Thromb Vasc Biol. 2003;23(7):1161-1168.
3 Ruggeri Z.M. Von Willebrand factor, platelets and endothelial cell interactions. J Thromb Haemost. 2003;1(7):1335-1342.
4 May A.E., Neumann F.J., Preissner K.T. The relevance of blood cell-vessel wall adhesive interactions for vascular thrombotic disease. Thromb Haemost. 1999;82(2):962-970.
5 Nurden A.T. Inherited abnormalities of platelets. Thromb Haemost. 1999;82(2):468-480.
6 Ruggeri Z.M. Mechanisms initiating platelet thrombus formation. [published erratum appears in. Thromb Haemost, 1997;78(4); 1304. [see comments]. Thromb Haemost 1997;78(1):611–616
7 Wei A.H., Schoenwaelder S.M., Andrews R.K., et al. New insights into the haemostatic function of platelets. Br J Haematol. 2009;147(4):415-430.
8 Mann K.G. Biochemistry and physiology of blood coagulation. Thromb Haemost. 1999;82(2):165-174.
9 Colman R., Schmaier A. Contact system: a vascular biology modulator with anticoagulant, profibrinolytic, antiadhesive and proinflammatory attributes. Blood. 1997;90(10):3819-3843.
10 Muller F., Mutch N.J., Schenk W.A., et al. Platelet polyphosphates are proinflammatory and procoagulant mediators in vivo. Cell. 2009;139(6):1143-1156.
11 Lord S.T. Fibrinogen and fibrin: scaffold proteins in hemostasis. Curr Opin Hematol. 2007;14(3):236-241.
12 van Boven H.H., Lane D.A. Antithrombin and its inherited deficiency states. Semin Hematol. 1997;34(3):188-204.
13 Rezende S.M., Simmonds R.E., Lane D.A. Coagulation, inflammation and apoptosis: different roles for protein S and the protein S-C4b binding protein complex. Blood. 2004;103(4):1192-1201.
14 Rijken D.C., Lijnen H.R. New insights into the molecular mechanisms of the fibrinolytic system. J Thromb Haemost. 2009;7(1):4-13.
15 Chee Y.L., Crawford J.C., Watson H.G., et al. Guidelines on the assessment of bleeding risk prior to surgery or invasive procedures. British Committee for Standards in Haematology. Br J Haematol. 2008;140(5):496-504.
16 Bowman M., Mundell G., Grabell J., et al. Generation and validation of the Condensed MCMDM-1VWD Bleeding Questionnaire for von Willebrand disease. J Thromb Haemost. 2008;6(12):2062-2066.
17 Witt I. Test systems with synthetic peptide substrates in haemostaseology. Eur J Clin Chem Clin Biochem. 1991;29(6):355-374.
18 Ingram G.I., Hills M. The prothrombin time test: effect of varying citrate concentration. Thromb Haemost. 1976;36(1):230-236.
19 Toh C.H. Transmittance waveform of routine coagulation tests is a sensitive and specific method for diagnosing non-overt disseminated intravascular coagulation. Blood Rev. 2002;16(suppl 1):S11-S14.
20 Mumford A.D., O’Donnell J., Gillmore J.D., et al. Bleeding symptoms and coagulation abnormalities in 337 patients with AL-amyloidosis. Br J Haematol. 2000;110(2):454-460.
21 Palareti G., Maccaferri M., Manotti C., et al. Fibrinogen assays: a collaborative study of six different methods. C.I.S.M.E.L. Comitato Italiano per la Standardizzazione dei Metodi in Ematologia e Laboratorio. Clin Chem. 1991;37(5):714-719.
22 De Cristofaro R., Landolfi R. Measurement of plasma fibrinogen concentration by the prothrombin-time-derived method: applicability and limitations. Blood Coagul Fibrinolysis. 1998;9(3):251-259.
23 Lawrie A.S., McDonald S.J., Purdy G., et al. Prothrombin time derived fibrinogen determination on Sysmex CA-6000. J Clin Pathol. 1998;51(6):462-466.
24 Mackie I.J., Kitchen S., Machin S.J., Lowe G.D., Haemostasis and Thrombosis Task Force of the British Committee for Standards in Haematology. Guidelines on fibrinogen assays. Br J Haematol. 2003;121(3):396-404.
25 Clauss A. Rapid physiological coagulation method in determination of fibrinogen. Acta Haematologica (Basel). 1957;17:237.
26 Mackie J., Lawrie A.S., Kitchen S., et al. A performance evaluation of commercial fibrinogen reference preparations and assays for Clauss and PT-derived fibrinogen. Thromb Haemost. 2002;87(6):997-1005.
27 Jespersen J., Sidelmann J. A study of the conditions and accuracy of the thrombin time assay of plasma fibrinogen. Acta Haematol. 1982;67(1):2-7.
28 Funk C., Gmur J., Herold R., et al. Reptilase-R, a new reagent in blood coagulation. Br J Haematol. 1971;21(1):43-52.
29 Kirkwood T.B., Snape T.J. Biometric principles in clotting and clot lysis assays. Clin Lab Haematol. 1980;2(3):155-167.
30 Williams K.N., Davidson J.M., Ingram G.I. A computer program for the analysis of parallel-line bioassays of clotting factors. Br J Haematol. 1975;31(1):13-23.
31 Zhukov O., Popov J., Ramos R., et al. Measurement of von Willebrand factor-FVIII binding activity in patients with suspected von Willebrand disease type 2N: application of an ELISA-based assay in a reference laboratory. Haemophilia. 2009;15(3):788-796.
32 Keeling D.M., Sukhu K., Kemball-Cook G., et al. Diagnostic importance of the two-stage factor VIII:C assay demonstrated by a case of mild haemophilia associated with His1954Leu substitution in the factor VIII A3 domain. Br J Haematol. 1999;105(4):1123-1126.
33 Pipe S.W., Eickhorst A.N., McKinley S.H., et al. Mild hemophilia A caused by increased rate of factor VIII A2 subunit dissociation: evidence for nonproteolytic inactivation of factor VIIIa in vivo. Blood. 1999;93(1):176-183.
34 Mumford A.D., Laffan M., O’Donnell J., et al. A Tyr346Cys substitution in the interdomain acidic region a1 of factor VIII in an individual with factor VIII:C assay discrepancy. Br J Haematol. 2002;118(2):589-594.
35 Prowse C.V. In vivo recovery of factor VIII following transfusion: a survey of recent data and publications to assess the influence of standards used for potency assignment. On behalf of the Subcommittee on Factor VIII and IX of the Scientific and Standardization Committee of the ISTH. Thromb Haemost. 1995;74(4):1191-1196.
36 Sukhu K., Harrison P., Keeling D. Factor VIII assays in haemophilia a patients treated with ReFacto. Br J Haematol. 2003;121(2):379-380.
37 Ingerslev J., Jankowski M.A., Weston S.B., et al. Collaborative field study on the utility of a BDD factor VIII concentrate standard in the estimation of BDDr Factor VIII:C activity in hemophilic plasma using one-stage clotting assays. J Thromb Haemost. 2004;2(4):623-628.
38 Barrowcliffe T.W., Raut S., Hubbard A.R. Discrepancies in potency assessment of recombinant FVIII concentrates. Haemophilia. 1998;4(4):634-640.
39 Galli M., Barbui T. Antiprothrombin antibodies: detection and clinical significance in the antiphospholipid syndrome. Blood. 1999;93(7):2149-2157.
40 Keeling D., Beavis J., Sukhu K. A simple inhibitor screen is more sensitive than a Bethesda assay in monitoring for the development of inhibitors in haemophilia A and B. Br J Haematol. 2005;128(6):885.
41 Verbruggen B., van Heerde W.L., Laros-van Gorkom B.A.P. Improvements in factor VIII inhibitor detection: From Bethesda to Nijmegen. Semin Thromb Hemost. 2009;35(8):752-759.
42 Verbruggen B., Novakova I., Wessels H., et al. The Nijmegen modification of the Bethesda assay for factor VIII:C inhibitors: improved specificity and reliability. Thromb Haemost. 1995;73(2):247-251.
43 Hill M., Dolan G. Diagnosis, clinical features and molecular assessment of the dysfibrinogenaemias. Haemophilia. 2008;14(5):889-897.
44 Gaffney P.J., Wong M.Y. Collaborative study of a proposed international standard for plasma fibrinogen measurement. Thromb Haemost. 1992;68(4):428-432.
45 Callewaert B., Malfait F., Loeys B., et al. Ehlers-Danlos syndromes and Marfan syndrome. Baillières Best Pract Res Clin Rheumatol. 2008;22(1):165-189.
46 Favaloro E.J. Clinical utility of the PFA-100. Semin Thromb Hemost. 2008;34(8):709-733.
47 Cattaneo M., Federici A.B., Lecchi A., et al. Evaluation of the PFA-100 system in the diagnosis and therapeutic monitoring of patients with von Willebrand disease. Thromb Haemost. 1999;82(1):35-39.
48 Fressinaud E., Veyradier A., Truchaud F., et al. Screening for von Willebrand disease with a new analyzer using high shear stress: a study of 60 cases. Blood. 1998;91(4):1325-1331.
49 Quiroga T., Goycoolea M., Munoz B., et al. Template bleeding time and PFA-100 have low sensitivity to screen patients with hereditary mucocutaneous hemorrhages: comparative study in 148 patients. J Thromb Haemost. 2004;2(6):892-898.
50 Laffan M., Brown S.A., Collins P.W., et al. The diagnosis of von Willebrand disease: a guideline from the UK Haemophilia Centre Doctors’ Organization. Haemophilia. 2004:199-217.
51 Nichols W.L., Hultin M.B., James A.H., et al. von Willebrand disease (VWD): evidence-based diagnosis and management guidelines, the National Heart, Lung and Blood Institute (NHLBI) Expert Panel report (USA). Haemophilia. 2008;14(2):171-232.
52 Bartlett A., Dormandy K.M., Hawkey C.M., et al. Factor-VIII-related antigen: measurement by enzyme immunoassay. Br Med J. 1976;1(6016):994-996.
53 Riddell A.F., Gomez K., Millar C.M., et al. Characterization of W1745C and S1783A: 2 novel mutations causing defective collagen binding in the A3 domain of von Willebrand factor. Blood. 2009;114(16):3489-3496.
54 Macfarlane D.E., Stibbe J., Kirby E.P., et al. Letter: A method for assaying von Willebrand factor (ristocetin cofactor). Thromb Diath Haemorrh. 1975;34(1):306-308.
55 Favaloro E.J. Collagen binding assay for von Willebrand factor (VWF:CBA): detection of von Willebrands Disease (VWD) and discrimination of VWD subtypes, depends on collagen source. Thromb Haemost. 2000;83(1):127-135.
56 Enayat M.S., Hill F.G. Analysis of the complexity of the multimeric structure of factor VIII related antigen/von Willebrand protein using a modified electrophoretic technique. J Clin Pathol. 1983;36(8):915-919.
57 Sadler J.E., Budde U., Eikenboom J.C.J., et al. Update on the pathophysiology and classification of von Willebrand disease: a report of the Subcommittee on von Willebrand Factor. J Thromb Haemost. 2006;4(10):2103-2114.
58 Bolton-Maggs P.H., Chalmers E.A., Collins P.W., et al. A review of inherited platelet disorders with guidelines for their management on behalf of the UKHCDO. Br J Haematol. 2006;135(5):603-633.
59 BCSH. Guidelines on platelet function testing. The British Society for Haematology BCSH Haemostasis and Thrombosis Task Force. J Clin Pathol. 1988;41(12):1322-1330.
60 Cattaneo M., Lecchi A., Zighetti M.L., et al. Platelet aggregation studies: autologous platelet-poor plasma inhibits platelet aggregation when added to platelet-rich plasma to normalize platelet count. Haematologica. 2007;92(5):694-697.
61 Hayward C.P., Pai M., Liu Y., et al. Diagnostic utility of light transmission platelet aggregometry: results from a prospective study of individuals referred for bleeding disorder assessments. J Thromb Haemost. 2009;7(4):676-684.
62 Dawood B.B., Wilde J., Watson S.P. Reference curves for aggregation and ATP secretion to aid diagnose of platelet-based bleeding disorders: effect of inhibition of ADP and thromboxane A(2) pathways. Platelets. 2007;18(5):329-345.
63 David J.L., Herion F. Assay of platelet ATP and ADP by the luciferase method: some theoretical and practical aspects. Adv Exp Med Biol. 1972;34:341-354.
64 Jennings I., Kitchen S., Woods T.A., et al. Problems relating to the laboratory diagnosis of factor XIII deficiency: a UK NEQAS study. J Thromb Haemost. 2003;1(12):2603-2608.
65 Oertel K., Hunfeld A., Specker E., et al. A highly sensitive fluorometric assay for determination of human coagulation factor XIII in plasma. Anal Biochem. 2007;367(2):152-158.
66 Levi M., Toh C.H., Thachil J., et al. Guidelines for the diagnosis and management of disseminated intravascular coagulation. British Committee for Standards in Haematology. Br J Haematol. 2009;145(1):24-33.
67 Toh C.H., Samis J., Downey C., et al. Biphasic transmittance waveform in the APTT coagulation assay is due to the formation of a Ca(++)-dependent complex of C-reactive protein with very-low-density lipoprotein and is a novel marker of impending disseminated intravascular coagulation. Blood. 2002;100(7):2522-2529.
68 Garvey M.B., Black J.M. The detection of fibrinogen-fibrin degradation products by means of a new antibody-coated latex particle. J Clin Pathol. 1972;25(8):680-682.
69 Keeling D.M., Wright M., Baker P., et al. D-dimer for the exclusion of venous thromboembolism: comparison of a new automated latex particle immunoassay (MDA D-dimer) with an established enzyme-linked fluorescent assay (VIDAS D-dimer). Clin Lab Haematol. 1999;21(5):359-362.
70 Keeling D.M., Mackie I.J., Moody A., Watson H.G., Haemostasis, Thrombosis Task Force of the British Committee for Standards in Haematology. The diagnosis of deep vein thrombosis in symptomatic outpatients and the potential for clinical assessment and D-dimer assays to reduce the need for diagnostic imaging. Br J Haematol. 2004;124(1):15-25.
71 Graham J., Elston R., Barrrow E., et al. The hemophilias: statistical methods for carrier detection in hemophilias. Methods in Hematology. 1982;5:156.
72 Peake I.R., Lillicrap D.P., Boulyjenkov V., et al. Report of a joint WHO/WFH meeting on the control of haemophilia: carrier detection and prenatal diagnosis. Blood Coagul Fibrinolysis, 1993;4(2); 313-344. [Erratum in: Blood Coagul Fibrinolysis. 1994;5(1):148.
73 Oyesiku J.O., Turner C.F. Reproductive choices for couples with haemophilia. Haemophilia. 2002;8(3):348-352.
74 Pruthi R.K. Hemophilia: a practical approach to genetic testing. Mayo Clin Proc. 2005;80(11):1485-1499.