Chapter 14 Investigation of abnormal haemoglobins and thalassaemia
The haemoglobin molecule
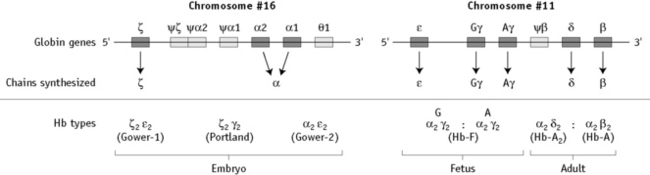
α chain synthesis is directed by two α genes, α1 and α2, on chromosome 16 and β and δ chain synthesis by single β and δ genes on chromosome 11; γ chain synthesis is directed by two genes, Gγ and Aγ, also on chromosome 11. The globin genes are shown diagrammatically in Figure 14.1.
There are many naturally occurring, genetically determined variants of human haemoglobin (>1000)1 and although many are harmless, some have serious clinical effects. Collectively, the clinical syndromes resulting from disorders of haemoglobin synthesis are referred to as ‘haemoglobinopathies’. They can be grouped into three main categories:
An individual can also have a combination of two or more of these abnormalities.
Structural variants of haemoglobin
Haemoglobins with Reduced Solubility
Hb S
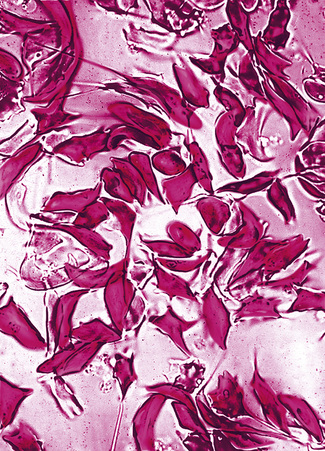
By far the most common haemoglobin variant in this group is sickle haemoglobin or Hb S. As a result of the replacement of glutamic acid by valine in position 6 of the β chain, Hb S has poor solubility in the deoxygenated state and can polymerize within the red cells. The red cell shows a characteristic shape change because of polymer formation and becomes distorted and rigid, the so-called sickle cell (see p. 90, Fig. 5.71). In addition, intracellular polymers lead to red cell membrane changes, generation of oxidant substances and abnormal adherence of red cells to vascular endothelium.
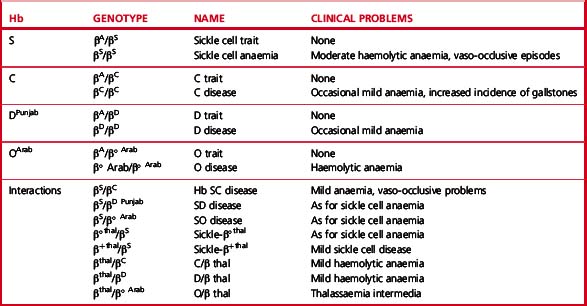
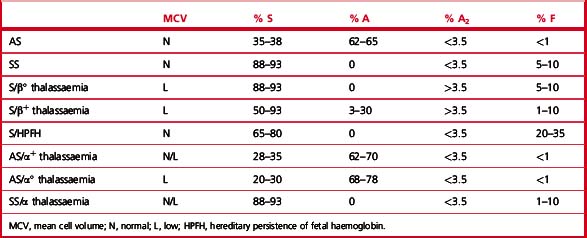
Clinical syndromes associated with common structural variants and those owing to their interaction with β thalassaemia are shown in Table 14.1.
Sickle Cell Disease
Sickle cell disease2 (also called disorder) is a collective name for a group of conditions causing clinical symptoms that result from the formation of sickle red cells. It is common in people originating from Africa, but it is also found in considerable numbers of people of Indian, Arabic and Greek descent.
The homozygous state or sickle cell anaemia (β genotype SS) causes moderate anaemia resulting both from haemolysis and from the reduced oxygen affinity of haemoglobin S. The main clinical disability arises from repeated episodes of vascular occlusion by sickled red cells resulting in acute crises and eventually in end-organ damage. The clinical severity of sickle cell anaemia is extremely variable. This is partly due to the effects of inherited modifying factors, such as interaction with α thalassaemia or increased synthesis of Hb F and partly to socioeconomic conditions and other factors that influence general health.2
Other Forms of Sickle Cell Disease
Sickle β/thalassaemia arises as a result of inheritance of one Hb S and one β thalassaemia gene. Africans and Afro-Caribbeans with this condition are often heterozygous for a mild β+ thalassaemia allele resulting in the production of about 20% of Hb A. This gives rise to a mild sickling disorder. Inheritance of Hb S and β° thalassaemia trait is associated with severe sickle cell disease. Interaction of Hb S with haemoglobin DPunjab (Hb DLos Angeles) or with Hb OArab gives rise to severe sickle cell disease.2
Hb C
Hb C is the second most common structural haemoglobin variant in people of African descent. The substitution of glutamic acid in position 6 of the β chain by lysine results in a haemoglobin molecule with a highly positive charge, decreased solubility and a tendency to crystallize. However, Hb C does not give a positive sickle solubility test. Heterozygotes are asymptomatic, but target cells and irregularly contracted cells may be present in blood films. Homozygotes may have mild anaemia with numerous target cells and irregularly contracted cells (see Chapter 5, Fig. 5.32). Interaction with β° or β+ thalassaemia trait results in mild or moderate haemolytic anaemia.
Unstable Haemoglobins
Amino acid substitutions close to the haem group, or at the points of contact between globin chains, can affect protein stability and result in intracellular precipitation of globin chains. The precipitated globin chains attach to the red cell membrane giving rise to Heinz bodies, and the associated clinical syndromes were originally called the congenital Heinz body haemolytic anaemias. Changes in membrane properties may lead to haemolysis, often aggravated by oxidant drugs. There is considerable heterogeneity in the haematological and clinical effects of unstable haemoglobins. Many are almost silent and are detected only by specific tests, whereas others are severe, causing haemolytic anaemia in the heterozygous state. Hb Köln is the most common variant in this rare group of disorders.3,4
Haemoglobins with Altered Oxygen Affinity
Haemoglobin variants with altered oxygen affinity are a rare group of variants that result in increased or reduced oxygen affinity.5 Mutations that increase oxygen affinity are generally associated with benign lifelong erythrocytosis. This may be confused with polycythaemia vera and may be inappropriately treated with cytotoxic drugs or 32P.
Hb M
The Hb M group is another rare group of variants.6 Such haemoglobins have a propensity to form methaemoglobin, generated by the oxidation of ferrous iron in haem to ferric iron, which is incapable of binding oxygen. Despite marked cyanosis, there are few clinical problems. Most are associated with substitutions that disrupt the normal six-ligand state of haem iron.
Thalassaemia syndromes
The thalassaemia syndromes7 are a heterogeneous group of inherited conditions characterized by defects in the synthesis of one or more of the globin chains that form the haemoglobin tetramer. The clinical syndromes associated with thalassaemia arise from the combined consequences of inadequate haemoglobin production and of unbalanced accumulation of one type of globin chain. The former causes anaemia with hypochromia and microcytosis; the latter leads to ineffective erythropoiesis and haemolysis. Clinical manifestations range from completely asymptomatic microcytosis to profound anaemia that is incompatible with life and can cause death in utero (Table 14.2). This clinical heterogeneity arises as a result of the variable severity of the primary genetic defect in haemoglobin synthesis and the coinheritance of modulating factors, such as the capacity to synthesize increased amounts of Hb F.
| Clinically asymptomatic |
| Silent carriers |
| α+ thalassaemia heterozygotes (some cases) |
| Rare forms of β thalassaemia trait |
| Thalassaemia minor (low MCH and MCV, with or without mild anaemia) |
| α+ thalassaemia heterozygotes (some cases) |
| α° thalassaemia heterozygotes |
| α+ thalassaemia homozygotes |
| β° thalassaemia trait |
| β+ thalassaemia trait |
| Some cases of Hb E/β thalassaemia |
| Thalassaemia intermedia (transfusion independent)a |
| Some β+/β+ thalassaemia homozygotes and compound heterozygotes |
| Interaction of β°/β°, β°/β+ or β+/β+ with |
| α thalassaemia |
| Interaction of β°/β or β+/β with triple α |
| Hb H disease |
| α°/Hb Constant Spring thalassaemia |
| β°/δβ or β+/δβ thalassaemia compound heterozygotes |
| δβ/δβ thalassaemia |
| Some cases of Hb E/β thalassaemia and Hb Lepore/β thalassaemia |
| Rare cases of heterozygotes for β thalassaemia mutation, particularly involving exon 3 (‘dominant β thalassaemia’) |
| Thalassaemia major (transfusion dependent) |
| β°/β° thalassaemia |
| β+/β+ thalassaemia |
| β°/β+ thalassaemia |
| Some cases of β°/Hb Lepore and β+/Hb Lepore thalassaemia |
| Some cases of β°/Hb E and β+/Hb E thalassaemia |
MCH, mean cell haemoglobin; MCV, mean cell volume.
a β thalassaemia intermedia is defined as a symptomatic condition in which regular transfusion is not essential to maintain life; however some patients have a poor quality of life and may benefit from transfusion as their condition progresses.
Thalassaemias are generally inherited as alleles of one or more of the globin genes located on either chromosome 11 (for β, γ and δ chains) or on chromosome 16 (for α chains). They are encountered in every population in the world but are most common in the Mediterranean littoral and near equatorial regions of Africa and Asia. Gene frequencies for the α and β thalassaemias on a global basis range from 1% to more than 80% in areas where malaria is endemic.8
β Thalassaemia Syndromes
Many different mutations cause β thalassaemia and related disorders.9 These mutations can affect every step in the pathway of globin gene expression: transcription, processing of the messenger ribonucleic acid (mRNA) precursor, translation of mature mRNA and preservation of post-translational integrity of the β chain. More than 200 mutations have been described.10 Most types of β thalassaemia are the result of point mutations affecting the globin gene, but some large deletions are also known. Certain mutations are particularly common in some communities. This helps to simplify prenatal diagnosis, which is carried out by detection or exclusion of a particular mutation in fetal DNA.
The effect of different mutations varies greatly. At one end of the spectrum are a group of rare mutations, mainly involving exon 3 of the β globin gene, which are so severe that they can produce the clinical syndrome of thalassaemia intermedia in the heterozygous state. At the other end are mild alleles that produce thalassaemia intermedia in the homozygous or compound heterozygous state and some that are so mild that they are completely haematologically silent, with normal mean cell volume (MCV) and Hb A2 in the heterozygous state. In between are the great majority of β+ and β° alleles, which cause β thalassaemia major in the homozygous or compound heterozygous state and in the heterozygous state give rise to a mild anaemia (or Hb at the low end of the normal range), with microcytic, hypochromic indices and raised Hb A2.11
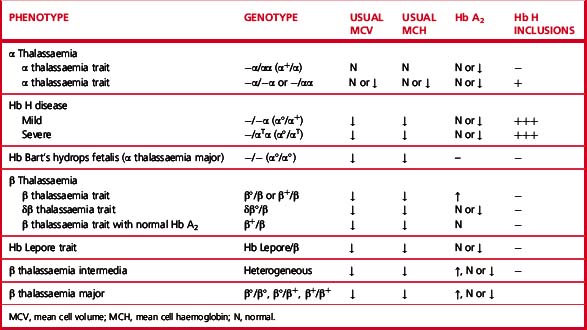
Heterozygotes for β thalassaemia alleles usually have either a normal haemoglobin with microcytosis or a mild microcytic hypochromic anaemia; Hb A2 is elevated and Hb F is sometimes also elevated. Laboratory features of various β thalassaemia syndromes are shown in Table 14.3.
α Thalassaemia Syndromes
There are four syndromes of α thalassaemia:12 α+ thalassaemia trait, where one of the two globin genes on a single chromosome fails to function; α° thalassaemia trait, where two genes on a single chromosome fail to function; Hb H disease, with three genes affected; and Hb Bart’s hydrops fetalis, where all four are absent or defective. These syndromes are usually a result of deletions of one or more genes, although approximately 20% of the mutations described are non-deletional. α+ thalassaemia is particularly common in Africa and α° thalassaemia is common in South-east Asia. The laboratory features are shown in Table 14.3.
Hb H disease gives rise to haemolytic anaemia; patients rarely require transfusion or splenectomy.
Increased Hb F in Adult Life
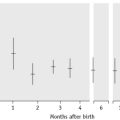
Haemoglobin production in man is characterized by two major switches in the haemoglobin composition of the red cells. During the first 3 months of gestation, human red cells contain embryonic haemoglobins (see p. 302), whereas during the last 6 months of gestation, red cells contain predominantly fetal haemoglobin. The major transition from fetal to adult haemoglobin synthesis occurs in the perinatal period and by the end of the first year of life red cells have a haemoglobin composition that usually remains constant throughout adult life. The major haemoglobin is then Hb A, but there are small amounts of Hb A2 and Hb F. Only 0.2–1.0% of total haemoglobin in human red cells is Hb F and it is restricted to a few cells called ‘F’ cells. Both the number of F cells and the amount of Hb F per cell can be increased in various conditions, particularly if there is rapid bone marrow regeneration.13
The general organization of human globin gene clusters is shown in Figure 14.1. The products of two γ genes differ in only one amino acid: Gγ has glycine in position 136, whereas Aγ has alanine. In fetal red cells, the ratio of Gγ to Aγ is approximately 3:1; in adult red cells, it is approximately 2:3.
Inherited Abnormalities That Increase Hb F Concentration
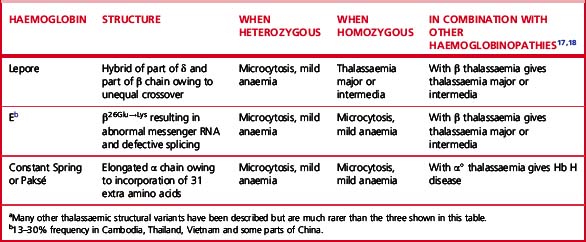
More than 50 mutations that increase Hb F synthesis have been described.13,14 They result in one of two phenotypes, HPFH or δβ thalassaemia; differentiation between these two types is not always simple but has clinical relevance. In general, HPFH has a higher percentage of Hb F and much more balanced chain synthesis. The most common, the African type of HPFH, is associated with a high concentration of Hb F (15–45%), pancellular distribution of Hb F on Kleihauer staining and normal red cell indices. Mutations causing increased synthesis of Hb F are mostly deletions, but some non-deletion mutations have also been described. In contrast, subjects with δβ thalassaemia have lower levels of Hb F accompanied by microcytic, hypochromic indices. The major clinical significance of these abnormalities is their interaction with β thalassaemia and Hb S. Compound heterozygotes for either of these conditions and HPFH have much milder clinical syndromes than the homozygotes for haemoglobin S or β thalassaemia. Compound heterozygotes for either of these conditions and δβ thalassaemia have a condition much closer in severity to the homozygous states.
Investigation of patients with a suspected haemoglobinopathy
Investigation of a person at risk of a haemoglobinopathy encompasses the confirmation or exclusion of the presence of a structural variant, thalassaemia trait or both. If a structural haemoglobin variant is present, it is necessary to ascertain the clinical significance of the particular variant so that the patient is appropriately managed. If it is confirmed that thalassaemia trait is present, it is not usually necessary to determine the precise mutation present because the clinical significance is usually negligible. The exception to this is an antenatal patient whose partner has also been found to have thalassaemia trait. If prenatal diagnosis is being considered, it may be necessary to undertake mutation analysis to predict fetal risk accurately and to facilitate prenatal diagnosis (see p. 146).
In the majority of patients, the presence of a haemoglobinopathy can be diagnosed with sufficient accuracy for clinical purposes from knowledge of the patient’s ethnic origin and clinical history (including family history) and the results of physical examination combined with relatively simple haematological tests. Initial investigations should include determination of haemoglobin concentration and red cell indices. A detailed examination of a well-stained blood film should be carried out. In some instances, a reticulocyte count and a search for red cell inclusions give valuable information. Assessment of iron status by estimation of serum iron and total iron binding capacity and/or serum ferritin is sometimes necessary to exclude iron deficiency. Other important basic tests are haemoglobin electrophoresis or high-performance liquid chromatography (HPLC), a sickle solubility test and measurement of Hb A2 and Hb F percentage. In cases of common haemoglobin variants and classical β thalassaemia trait, accurate data from these tests will facilitate a reliable diagnosis without the need for more sophisticated investigations. However, definitive diagnosis of some thalassaemia syndromes can only be obtained using DNA technology (see p. 147 and p. 330). Similarly, in particular situations, haemoglobin variants will require unequivocal identification by the use of DNA technology or protein analysis by mass spectrometry.15 Individuals or families who require such investigation must be carefully selected on the basis of family history and on the results of the basic investigations described later in this chapter. Large-scale screening programmes are increasingly being undertaken in some countries where individual case histories and the results of other laboratory tests are not usually available. The problems of such programmes are discussed on p. 318.
Laboratory investigation of a suspected haemoglobinopathy should follow a defined protocol, which should be devised to suit individual local requirements. The data obtained from the clinical findings, blood picture and electrophoresis or HPLC will usually indicate in which direction to proceed. The investigation for a structural variant is described in the first section and that for a suspected thalassaemia syndrome is described in the second section of this chapter. Screening tests for thalassemia trait and haemoglobin E trait that may be especially applicable in under-resourced areas are described in Chapter 26.
Laboratory detection of haemoglobin variants
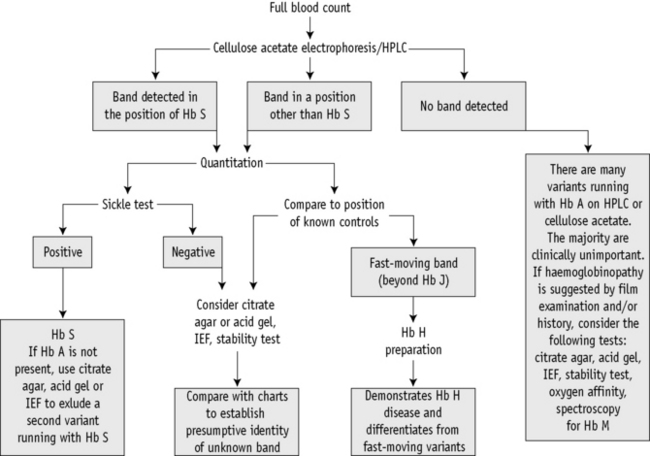
A proposed scheme of investigation is shown in Figure 14.2 and a list of procedures follows:15,16
Blood Count and Film
The blood count, including Hb and red cell indices, provides valuable information useful in the diagnosis of both α and β thalassaemia interactions with structural variants (see Chapter 3). A film examination may reveal characteristic red cell changes such as target cells in Hb C trait, sickle cells in sickle cell disease and irregularly contracted cells in the presence of an unstable haemoglobin (see Chapter 5).
Discriminant functions using various formulae have been proposed as a basis for further testing for thalassaemia,17,18 but we do not advise their use. Although such functions and formulae do indicate whether thalassaemia or iron deficiency is more likely, they may lead to individuals who have both iron deficiency and thalassaemia trait not being tested promptly. Generally this is not a problem and indeed it may be preferable to keep the patient under observation until iron deficiency has been treated and then to reassess the likelihood of thalassaemia trait. However, many of the patients who require testing for thalassaemia are women who are already pregnant. In such patients the likely delay in testing is unacceptable. Moreover, these formulae do not appear to have been validated for use during pregnancy. For these reasons, we advise that whenever genetic counselling might be required, testing for β thalassaemia trait should be carried out in all individuals with an MCH <27 pg and screening for α thalassaemia trait should be carried out in those individuals with an MCH <25 pg who belong to an ethnic group in which α° thalassaemia is prevalent.11
Collection of Blood and Preparation of Haemolysates
EDTA is the most convenient anticoagulant because it is used for the initial full blood count and film (see Chapter 1), although samples taken into any anticoagulant are satisfactory. Cells freed from clotted blood can also be used.
Control Samples
Quality Assurance
Because the haemoglobinopathies are inherited conditions, some of which carry considerable clinical and genetic implications, precise documentation and record-keeping are of paramount importance.19 The use of cumulative records when reviewing a patient’s data is very useful because it of itself constitutes an aspect of quality assurance. In some situations, repeat sampling, family studies or both may be required to elucidate the nature of the abnormality in an individual.
In-house standard operating procedures should be followed carefully, particularly in this field of haematology, where a small difference in technique can make a significant difference in the results obtained and can lead to misdiagnosis. Many of the techniques described have attention drawn to specific technical details that are important for ensuring valid results.20
It is necessary to use reference standards and control materials in each of the analyses undertaken and in some cases to use duplicate analysis to demonstrate precision. There are international standards for Hb F and Hb A2 (see p. 591), whereas in some countries national reference preparations are also available from national standards institutions. These are extremely valuable because the target values have been established by collaborative studies. Control materials can be prepared in-house or obtained commercially. Samples stored as whole blood at 4°C can be used reliably for several weeks. All laboratories should confirm the normal range for their particular methods and the normal range obtained should not differ significantly from published data.
All laboratories undertaking haemoglobin analysis should participate in an appropriate proficiency testing programme (see p. 594). In the UK, the National External Quality Assessment Scheme (NEQAS) provides samples for sickle solubility tests; for detection and quantitation of variant haemoglobins; and for quantitation of Hbs A2, F and S.
National and international guidelines have been published for all aspects of the investigations given here.11,21–23,20,24,25
Cellulose Acetate Electrophoresis at Alkaline pH
Haemoglobin electrophoresis at pH 8.4–8.6 using cellulose acetate membrane is simple, reliable and rapid. It is satisfactory for the detection of most common clinically important haemoglobin variants.23–25
Reagents
Fixative/stain solution. Ponceau S, 5 g; trichloroacetic acid, 7.5 g; water to 1 litre
Destaining solution. 3% (v/v) acetic acid, 30 ml; water to 1 litre
Haemolysing reagent. 0.5% (v/v) Triton X-100 in 100 mg/l potassium cyanide.
Method
Interpretation and Comments
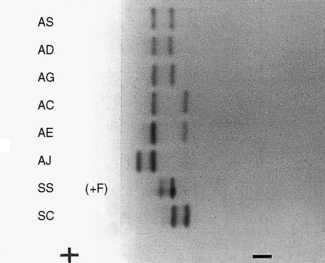
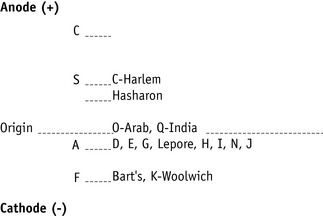
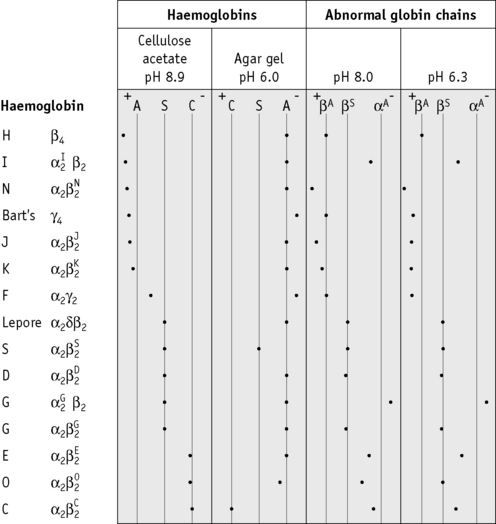
Figure 14.3 shows the relative electrophoretic mobilities of some common haemoglobin variants at pH 8.5 on cellulose acetate. Satisfactory separation of Hbs C, S, F, A and J is obtained (Fig. 14.4). In general, Hbs S, D and G migrate closely together, as do Hbs C, E and OArab. Differentiation between these haemoglobins can be obtained by using acid agarose gels, citrate agar electrophoresis, HPLC or IEF. However, there are slight differences in mobility between Hbs S, Lepore and DPunjab and also between Hbs C and E; optimization of the technique will facilitate detection of the difference. Generally, the Lepore Hbs and Hb DPunjab migrate slightly anodal to Hb S (i.e. they are slightly faster than S); Hb C migrates slightly cathodal to Hb E (i.e. it is slightly slower than E).
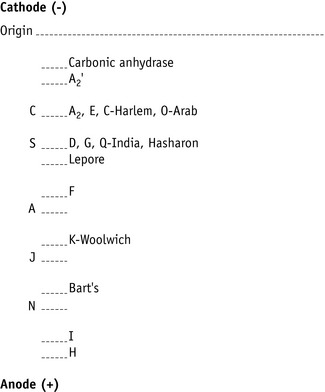
Figure 14.3 Schematic representation of relative mobilities of some abnormal haemoglobins. Cellulose acetate, pH 8.5.
When an abnormal haemoglobin is found, it may be of diagnostic importance to measure the percentage of the variant; this can be done by the electrophoresis with elution procedure for Hb A2 estimation given on p. 322. Quantitation of Hb S is often clinically useful, both in patients with sickle cell disease who are being treated by transfusion and for the diagnosis of conditions in which Hb S is coinherited with α and β thalassaemia, as outlined in Table 14.5. Quantitation of Hb S can be done with HPLC, electrophoresis with elution or by microcolumn chromatography.
Citrate Agar Electrophoresis at pH 6.0
Equipment26,27
Cooling bars (Helena Laboratories)
Perspex trays, 80 × 100 × 2 mm
Buffer
Stock buffer. Trisodium citrate dihydrate, 73.5 g; 0.5 mol/l citric acid, 34.0 ml; water to 1 litre
Working buffer. Dilute stock buffer 1 in 5 with water. Prepare on day of use
5 g/dl potassium cyanide. Potassium cyanide, 0.5 g; distilled water to 100 ml
Wetting agent. For example, Zip-prep solution (Helena Laboratories); 1 drop in 100 ml water.
3% Acetic acid. 120 ml glacial acetic acid made up to 4 litres with water
Method
Automated High-Performance Liquid Chromatography
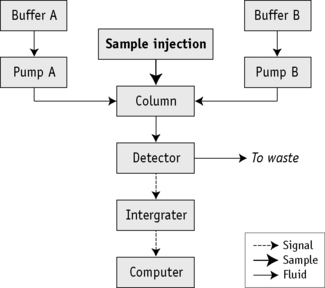
Automated cation-exchange HPLC28 is being used increasingly as the initial diagnostic method in haemoglobinopathy laboratories with a high workload.29 Both capital and consumable costs are higher than with haemoglobin electrophoresis, but labour costs are less; overall costs may be similar.30 In comparison with haemoglobin electrophoresis, HPLC has four advantages:
Principle
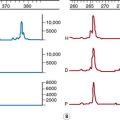
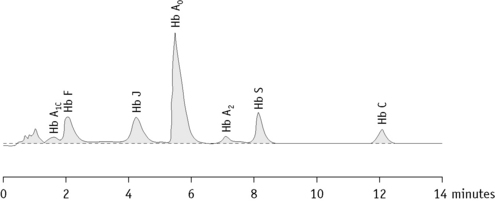
Figure 14.6 shows a schematic representation of an HPLC system and Figure 14.7 shows a chromatogram of a mixture of different haemoglobins. Systems are available from various manufacturers.
Interpretation and Comments
Results are accurate and reproducible, but as with every method of haemoglobin analysis, controls should be run with every batch. If the system is being used for the detection of haemoglobin variants, elution times can be compared with those of known controls; actual times, however, are affected by the batch of buffer and column, the age of the column and the laboratory temperature. A better comparison may be obtained using the relative elution time, which is calculated by dividing the elution time of the variant with that of the main Hb A fraction. It should be noted that Hb A is separated into its component fractions of A0 and A1 and the A1 fraction frequently subdivides into several peaks. Skill is required in interpretation of the results because various normal and abnormal haemoglobins may have the same retention time and a glycosylated variant haemoglobin will have a different retention time from the non-glycosylated form. HPLC usually separates Hbs A, A2, F, S, C, DPunjab and GPhiladelphia from each other.29,32 However, both Hb E and Hb Lepore co-elute with haemoglobin A2 (as other haemoglobins co-elute with A, S and F). The retention time of glycosylated and other derivatives of Hb S can be the same as those of Hb A0 and A2. For example, derivatives of haemoglobin S co-elute with haemoglobin A2, so that percentages of A2 by this method are inaccurate and therefore do not have the same significance as percentage of haemoglobin A2 measured by alternative methods.33 For these reasons, and because there are more than 1000 variants identified, HPLC can never definitively identify any haemoglobin. It is important to analyse variants found using second-line techniques, such as a sickle solubility test, alkaline and acid electrophoresis, or iso-electric focusing.
HPLC is also applicable for the quantification of Hb A1c for the monitoring of diabetes mellitus; to make optimal use of staff and equipment, this procedure is sometimes carried out in haematology laboratories. In fact, an increased glycosylated fraction is not infrequently noted when HPLC is performed for investigation of a suspected haemoglobinopathy.34 Unless the patient is already known to suffer from diabetes mellitus, this abnormality should be drawn to the attention of clinical staff.
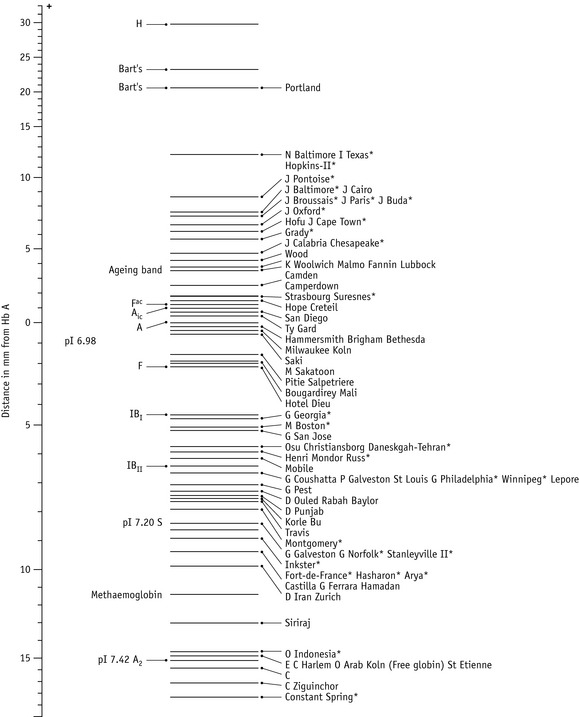
Isoelectric Focusing
Principle
IEF utilizes a matrix containing carrier ampholytes of low molecular weight and varying isoelectric points (pIs). These molecules migrate to their respective pIs when a current is applied, resulting in a pH gradient being formed; for haemoglobin analysis, a pH gradient of 6–8 is usually used. Haemoglobin molecules migrate through the gel until they reach the point at which their individual pIs equal the corresponding pH on the gel. At this point, the charge on the haemoglobin is neutral and migration ceases. The pH gradient counteracts diffusion and the haemoglobin variant forms a discrete narrow band.35,36
Tests for Hb S
Sickling in Whole Blood
Reagents
Disodium hydrogen phosphate (Na2HPO4). 0.114 mol/l (16.2 g/l)
Sodium dithionite (Na2S2O4). 0.114 mol/l (19.85 g/l). Prepare freshly just before use
Method
Add 5 drops of the freshly prepared reagent to 1 drop of anticoagulated blood on a slide. Seal between slide and coverglass with a petroleum jelly/paraffin wax mixture or with nail varnish. Sickling takes place almost immediately in sickle cell anaemia and should be obvious in sickle cell trait within 1 h (Fig. 14.10). A test on a positive control of Hb A plus Hb S must be performed at the same time.
Hb S Solubility Test
Principle
Sickle cell haemoglobin is insoluble in the deoxygenated state in a high molarity phosphate buffer. The crystals that form refract light and cause the solution to be turbid.37
Method
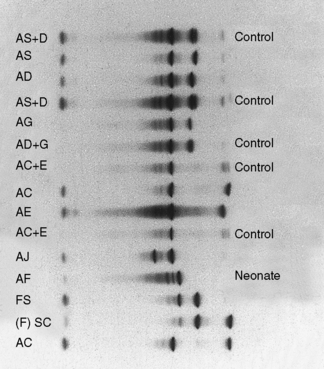
Neonatal (newborn) screening
In areas where the frequency of haemoglobinopathies is high, universal neonatal (newborn) screening should be undertaken where possible. Universal neonatal screening is now being carried out in England and will be gradually extended to the rest of the UK.38 The screening programme is linked to the existing dried blood spot screening programme in place for phenylketonuria and congenital hypothyroidism. The same dried blood spot sample is tested for sickle cell disease. It must be emphasized that the main function of this screening is to detect sickle cell disease, although many cases of β thalassaemia major are also detected, dependent on the mutations present. Dried blood spot samples are tested using HPLC and IEF – HPLC is typically the first-line test and abnormalities are confirmed by IEF. Haemoglobin electrophoresis is not recommended for the analysis of dried blood spots. Analysis of cord blood samples is undertaken as a clinician-led request rather than for general screening. If umbilical cord blood samples are used, they can be examined by haemoglobin electrophoresis using cellulose acetate at alkaline pH or citrate agar at acid pH,23 or by HPLC or IEF. If any abnormality is detected, a confirmatory technique should also be undertaken.
Babies provisionally diagnosed as having Hbs SS, SC, SDPunjab, SOArab or Sβ thalassaemia should be retested within 6–8 weeks of birth. After confirmation of the diagnosis, they should be followed in a paediatric clinic, immediately started on prophylactic penicillin to prevent pneumococcal infections, and appropriately managed in the long term.3 β thalassaemia major is suspected when Hb A is either absent or greatly reduced at birth. Such babies are retested for confirmation. The diagnosis of β thalassaemia trait cannot be reliably made until 12 months of age unless DNA techniques are used (see p. 146).
Detection of an unstable haemoglobin
Haemoglobin variants exhibit a wide range of instability but the clinically unstable haemoglobins can be detected by both the heat stability test and the isopropanol test.39 However, minor degrees of instability that have little or no clinical significance may need other techniques. The unstable haemoglobins are frequently silent using electrophoretic or chromatographic techniques and tests for haemoglobin instability are essential in the detection or exclusion of an unstable haemoglobin.
Heat Stability Test
Principle
When haemoglobin in solution is heated, the hydrophobic van der Waals bonds are weakened and the stability of the molecule is decreased.40,41 Under controlled conditions, unstable haemoglobins precipitate, whereas stable haemoglobins remain in solution.
Isopropanol Stability Test
Principle
When haemoglobin is dissolved in a solvent such as isopropanol, which is less polar than water, the hydrophobic van der Waals bonds are weakened and the stability of the molecule is decreased. Under controlled conditions, unstable haemoglobins precipitate, whereas stable haemoglobins remain in solution. This method has the advantage that it does not require a 37°C waterbath and positive controls can be made by modification of the reagent buffer.42
Method
Detection of Hb Ms
Methaemoglobin (Hi) has iron present in the ferric form. Inherited variants of haemoglobin that undergo oxidation to methaemoglobin more readily than Hb A are referred to as Hb Ms. This is one of the causes of a very rare condition, congenital methaemoglobinaemia. The other cause of inherited methaemoglobinaemia is methaemoglobin reductase deficiency (see p. 240). Methaemoglobin levels vary, but may be as high as 40% of the total haemoglobin. Methaemoglobinaemia per se may also be caused by oxidant chemicals.
Methaemoglobin variants may be detected by haemoglobin electrophoresis at pH 7, but almost all can be distinguished from methaemoglobin A (Hi A) by their absorption spectra. Each methaemoglobin has its own distinct absorption spectrum. Hi A has two absorption peaks at 502 nm and 632 nm, whereas the peak absorbances for the variant Hb Ms are at different wavelengths (Fig. 14.11).
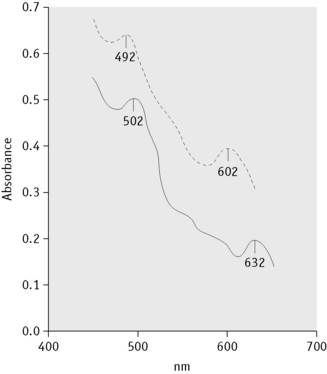
(Reproduced with permission from Lehmann H, Huntsman KG 1974 Man’s Haemoglobins, 2nd edition, p. 214. North-Holland, Amsterdam.)
Detection of altered affinity haemoglobins
The most informative investigation is the measurement of the oxygen dissociation curve (see p. 268). The most significant finding is a decreased Hill’s constant (‘n’ value) because this can only come about by a change in the structure of the haemoglobin. The p50 may be either increased (low-affinity haemoglobin) or decreased (high-affinity haemoglobin). High-affinity haemoglobins result in an increase in Hb level, whereas low-affinity haemoglobins result in a decrease in Hb level. The p50 alone may be affected by other factors such as the high concentration of 2,3-DPG in pyruvate kinase deficiency. (Aspects of this are discussed in Chapter 11.)
Differential diagnosis of common haemoglobin variants
Suggested methods for differential diagnosis are given in Table 14.6 and Figure 14.12 gives a comparison of some common variants using different techniques.
Table 14.6 Methods helpful in the differential diagnosis of common structural variants
| Initial Finding on Cellulose Acetate Electrophoresis | Most Likely Variant | Differentiation |
|---|---|---|
| Band in position of Hb S | Hb S, D, G-Philadelphia, Lepore | Blood count, quantitation, solubility test, citrate agar/acid gel electrophoresis, IEF, HPLC |
| Band in position of Hb C | Hb C, E, O-Arab | Quantitation, citrate agar/acid gel electrophoresis, IEF, HPLC |
| Very fast band | Hb I, H | H bodies |
IEF, isoelectric focusing; HPLC, high-performance liquid chromatography.
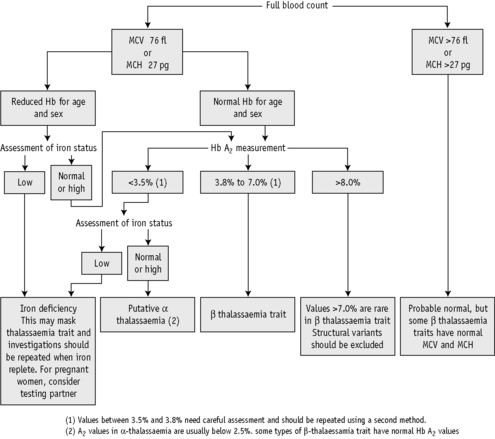
Investigation of suspected thalassaemia
A suggested scheme of investigations is shown in Figure 14.13; the methods used are listed in the following.
Quantitation of Hb A2
Equipment
Electrophoresis tank and power pack. see p. 310
Method
Interpretation and Comments
For interpretation of results and normal ranges, see p. 325. Duplicate values obtained should be within 0.2%. This method is inaccurate in the presence of Hb C, Hb E and Hb OArab because they do not separate from Hb A2.
Measurement of Hb A2 by Microcolumn Chromatography
Principle
Microcolumn chromatography depends on the interchange of charged groups on the ion exchange cellulose with charged groups on the haemoglobin molecule. When a mixture of haemoglobins is adsorbed onto the cellulose, a particular haemoglobin component may be eluted from the column using a buffer (developer) with a specific pH and/or ionic strength, whereas other components (either a single haemoglobin or a mixture of haemoglobins) may be eluted by changing the pH or ionic strength of the developer. The separation of haemoglobin components depends on the pH and/or ionic strength of the developers used for the equilibration of the column and for the elution, the type of cellulose, the volume of the sample added, the size of the column, the gradient, flow rates and temperature. The following methods use the anion exchanger diethylaminoethyl (DEAE) cellulose (Whatman DE-52 microgranular pre-swollen), with Tris-HCl developers45 or glycine-KCN developers.46
Measurement of Hb A2 by Microcolumn Chromatography with Tris-HCl Buffers
Method
Calculate the Hb A2 as follows:
Interpretation and Comments
For interpretation and normal ranges, see p. 325. The technique is inappropriate in the presence of haemoglobin variants (see below). Factors affecting quality assurance include the concentration of haemoglobin applied to the column – excess haemoglobin will cause contamination of the Hb A2 fraction with Hb A. An inadequate amount of haemoglobin will result in an eluate with an absorbance too low for accurate measurement.
Measurement of Hb A2 by Microcolumn Chromatography with Glycine-Potassium Cyanide Developers
The method described as follows is suitable for samples containing variants such as Hb S. The elution of Hb A2 is dependent on the pH of the ion exchanger and on the molarity of the developer.46
Reagents
Developer A. Glycine, 15.0 g; KCN, 0.1 g; water to 1 litre
Method
Calculate the Hb A2 as follows:
Modification for the Measurement of Hb S
To estimate the percentage of Hb S and the remaining haemoglobin as well as that of Hb A2, Hb A2 is eluted in the first 3–4 ml with developer A, Hb S is eluted in the next 15–20 ml of the same developer A, and the remaining haemoglobin is eluted with developer B. The eluate containing Hb A2 is diluted to 5 ml and the eluates containing Hb S and the remaining haemoglobin are diluted to 25 ml. To ensure elution of all the Hb A2 in the first 3–4 ml and all the Hb S in the next 15–20 ml, the pH of the ion exchanger may need adjustment following a test chromatogram.46
Interpretation and Comments
Hb A2 percentages tend to be very slightly lower using the Tris buffer system, but with either procedure there should be a distinction between normal and classical β thalassaemia trait subjects.45 An advantage of the glycine-KCN method is less sensitivity to minor changes in the pH of the developer; also it may be used for samples containing Hb S.
Measurement of Hb A2 by High-Performance Liquid Chromatography
The principle of HPLC has been explained on p. 314. When this technology is used as the primary method for detecting variant haemoglobins, simultaneous quantitation of Hb A2 and Hb F means that it can replace three separate traditional methods: haemoglobin electrophoresis, quantitation of Hb A2 and quantification of Hb F. Each laboratory should establish its own reference range for the quantitation of Hb A2 by this method, which should be similar to published ranges. Because the quantitation of Hb A2 may be inaccurate in the presence of certain variant haemoglobins, such as Hb E, Hb Lepore and Hb S,32 each chromatogram should always be inspected. Inspection will also permit identification of specimens with a split A2 band as the result of heterozygosity for a δ chain variant. If the quantity of a haemoglobin with the retention time of Hb A2 is higher than expected, an alternative technique should be applied to confirm its identity because a peak labelled as Hb A2 can be Hb E or another haemoglobin that elutes with Hb A2.
Interpretation of Hb A2 values
Hb A2 values should be interpreted in relation to a reference range established in each individual laboratory using blood samples from the local population with a normal Hb and red cell indices.11,47–50 The standard operating procedure for the relevant method should be strictly followed and 95% reference ranges should be determined. Ranges may differ slightly between methods and between laboratories. For example, in one of our laboratories the range determined for microcolumn chromatography was 2.2–3.3%, whereas in the other it was 2.3–3.5%. Technical variables affecting the range may include the use of packed cells rather than whole blood. Results obtained by HPLC analysis may be 0.1–0.2% higher than the results obtained by electrophoresis with elution. Once a reference range is determined, there is still a practical problem with borderline results, given that repeat estimates may vary by 0.1–0.2%. We recommend that Hb A2 levels of 3.4–3.7% be regarded as borderline and that the assay should be repeated both on the same sample and on a fresh sample. There is also evidence that Hb A2 is elevated in patients with HIV infection.51,52
The Hb A2 percentage should be interpreted with knowledge of the Hb and red cell indices (Table 14.7).
| Hb A2 RANGE (%) | Interpretation |
|---|---|
| >7.0 | Hb A2 values of >7.0% are extremely rare |
| Exclude a structural variant | |
| Repeat Hb A2 estimation | |
| Rare β thalassaemia mutations | |
| 3.8–7.0 | β thalassaemia trait, unstable haemoglobin |
| 3.4–3.7 | Severe iron deficiency in β thalassaemia trait |
| Additional δ chain variant with β thalassaemia trait | |
| (Total A2 must be measured) | |
| Interaction of α and β thalassaemia | |
| Rare β thalassaemia mutations | |
| Presence of Hb S, making accurate measurement difficult | |
| Interaction of α thalassaemia and Hb S | |
| Analytical error, including carryover; repeat analysis | |
| 2.0–3.3 | Normal |
| δβ thalassaemia (if Hb F elevated) | |
| Rare cases of | |
| β thalassaemia trait, including coexisting | |
| β and δ thalassaemia and coexisting | |
| β and α thalassaemia | |
| α thalassaemia trait | |
| α or δ chain variant (total A2 must be measured) | |
| <2.0 | δβ thalassaemia (if Hb F elevated) |
| α thalassaemia trait | |
| Hb H disease | |
| Additional δ chain variant present (total Hb A2 must be measured) | |
| δ thalassaemia | |
| Iron deficiency |
Quantitation of Hb F
Hb F may be estimated by several methods based on its resistance to denaturation at alkaline pH, by HPLC or by an immunological method.53 Of the alkaline denaturation methods, that of Betke et al.54 is reliable for small amounts (<10–15%) of Hb F, whereas for levels of more than 50% and in cord blood, the method of Jonxis and Visser55 is preferable; however, this method is not reliable at levels of less than 10%.
Immunological methods have been devised to measure Hb F by immunodiffusion,56 for which commercial kits are available (Helena Laboratories, Beaumont, Texas, USA) and by enzyme-linked immunoassay (ELISA).57
Modified Betke Method for the Estimation of Hb F
Principle
To measure the percentage of Hb F in a mixture of haemoglobins,54 sodium hydroxide is added to a lysate and, after a set time, denaturation is stopped by adding saturated ammonium sulphate. The ammonium sulphate lowers the pH and precipitates the denatured haemoglobin. After filtration, the quantity of undenatured (unprecipitated) haemoglobin is measured. The proportion of alkali-resistant (fetal) haemoglobin is then calculated as a percentage of the total amount of haemoglobin present.
Method
Interpretation and Comments
Elevation of Hb F has a variety of causes (see p. 307). In very exceptional situations, other abnormal haemoglobins will also exhibit resistance to alkali, giving high results. It is imperative that haemoglobin electrophoresis or HPLC is done on these samples tested for Hb F to exclude the possibility of an unusual variant being present.
Zago et al.58 reported variability in the capacity of different batches of filter paper to absorb haemoglobin from the filtrate, which caused low results. It is necessary to equilibrate the temperature of the reagents to 20°C and to control the reaction temperature to 20°C to obtain accurate and reproducible results.
Method of Jonxis and Visser
Principle
The increased resistance of Hb F to denaturation by alkali is detected by recording the change in absorption at 576 nm in each minute, caused by the addition of ammonium hydroxide.55 At this wavelength, the absorption of oxyhaemoglobin differs from that of the alkali haemochromogen that is formed on denaturation.
Reagents
Ammonium hydroxide solution. NH4OH, 100 g; water to 1 litre
Sodium hydroxide solution, 0.06 mol/l. Sodium hydroxide, 2.4 g; water to 1 litre.
Method
Interpretation and Comments
Comments regarding controls and normal ranges given for the Betke method are also applicable to this method. In addition, the Jonxis and Visser method requires an accurate spectrometer because the maximum absorption peak at 576 nm is very narrow and the difference in extinction between oxyhaemoglobin and alkali haemochromogen is relatively small. For interpretation of results, see p. 307.
Assessment of the intracellular distribution of Hb F
Two techniques have been widely used for demonstrating intracellular Hb F distribution. The most frequently used is the acid elution test of Kleihauer59 that was originally developed for the detection of fetal red cells in the maternal circulation following transplacental haemorrhage. This method is described on p. 338. Less frequently used is the more sensitive immunofluorescent technique described in the following.
Immunofluorescent Method
Principle
Anti-Hb F antibody binds specifically and quantitatively to Hb F in fixed red cells. These cells can be identified after treatment with a second fluorescent-labelled antibody directed against the anti-Hb F.14
Equipment
Microscope. Equipped with accessories for ultraviolet (UV) fluorescence
Moist chamber. Made from a Petri dish with moistened filter paper in the bottom.
Method
Comments
In normal adults, from 0.1 to 7.0% of cells show detectable fluorescence. The proportion of positive cells correlates well with the percentage of Hb F as measured by alkali denaturation at levels between 0.5% and 5.0%. As little as 1 pg of Hb F per cell can be detected, giving much greater sensitivity than the acid elution method. This increased sensitivity, however, may make a heterocellular distribution appear pancellular if the proportion of Hb F is greater than 10%.53
Interpretation of Hb F values
| Hb F range (%) | Interpretation |
|---|---|
| 0.2–1.0 | Normal results |
| 1.0–5.0 | In approximately 30% of β thalassaemia traits |
| Some heterozygotes for a variant haemoglobin | |
| Some homozygotes for a variant haemoglobin | |
| Some compound heterozygotes for a variant haemoglobin and β thalassaemia | |
| Some individuals with haematological disorders (aplastic anaemia, myelodysplastic syndromes, juvenile myelomonocytic leukaemia) | |
| Some pregnant women (2nd trimester) | |
| Sporadically in the general population, particularly in Afro-Caribbeans (representing heterozygosity for non-deletional HPFH) | |
| 5.0–20.0 | Occasional cases of β thalassaemia trait |
| Some homozygotes for a variant haemoglobin including some sickle cell anaemiaa | |
| Some compound heterozygotes for a variant haemoglobin and β thalassaemia | |
| Some types of heterozygous HPFH δβ thalassaemia | |
| 15.0–45.0 | Heterozygous HPFH African type (usually >20%) |
| Some cases of β thalassaemia intermedia | |
| >45.0 | β thalassaemia major |
| Some cases of β thalassaemia intermedia | |
| Neonates | |
| >95.0 | Homozygous African-type (deletional) HPFH |
| Some neonates (particularly if premature) |
a Highest levels seen with Arab-Indian haplotype and in patients treated with hydroxycarbamide.
Assessment of iron status in thalassaemia
Concurrent iron deficiency makes the diagnosis of thalassaemia trait more difficult because it masks the typical blood picture and can reduce Hb A2 synthesis.47,48,50 In β thalassaemia trait, dependent on the severity of the anaemia, the Hb A2 value may be reduced to borderline or even to normal levels (3.0–3.5%). However, in many patients with β thalassaemia trait and iron deficiency, the Hb A2 will still be raised.
Whenever possible, individuals should not be investigated for the presence of thalassaemia trait if they are iron deficient. Iron stores are usually replete after 3–4 months of treatment with iron. However, if a pregnant woman is suspected of having a thalassaemia trait, it is not possible to wait for the correction of iron deficiency to establish the diagnosis. The woman and her partner should be tested without delay, with DNA analysis of globin genes being carried out if both are suspected of having thalassaemia trait (see Chapter 8, p. 146).
In addition to traditional methods for iron assessment, such as measurement of serum ferritin or serum iron plus total iron-binding capacity, estimation of zinc protoporphyrin (see pp. 192) is of potential value. This test can be carried out on an EDTA sample within a haematology laboratory and is a measure of iron incorporation at the cellular level.
Red cell inclusions
The most important red cell inclusions found in the haemoglobinopathies are Hb H inclusion bodies (precipitated β chain tetramers) found in α thalassaemia,60 α chain inclusions found in β thalassaemia major7,61 and Heinz bodies found in unstable haemoglobin diseases.41,62
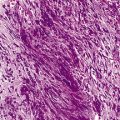
Precipitated α chains are found in the cytoplasm of nucleated red cell precursors of patients with β thalassaemia major; they can be demonstrated by supravital staining of the bone marrow with methyl violet (as can Heinz bodies) and appear as irregularly shaped bodies close to the nucleus of normoblasts. After splenectomy they may also be found in the peripheral blood normoblasts and reticulocytes. Heinz bodies (insoluble denatured globin chains) form as a result of exposure to oxidant drugs or chemicals and develop spontaneously in glucose-6-phosphate dehydrogenase (G6PD) deficiency and in the unstable haemoglobin diseases. In unstable haemoglobin diseases, they are usually only seen in the peripheral blood after splenectomy but may be demonstrated in patients with an intact spleen if their blood is kept at 37°C for 24–48 h. The use of methyl violet and of brilliant cresyl blue in the demonstration of precipitated α chain and Heinz bodies is described on p. 336.
Demonstration of Hb H Inclusion Bodies
Method
Fetal diagnosis of globin gene disorders
Prenatal diagnosis of globin gene disorders21 is carried out if the fetus is at risk of thalassaemia major or a severe form of sickle cell disease such as sickle cell anaemia. Two approaches to fetal diagnosis are available: globin chain synthesis (used if the putative father is not available) and DNA analysis. DNA can be obtained from a chorionic villus sample or from amniotic fluid. Methods used for DNA analysis are described in Chapter 8.
1 (Updated)Hardison R., Miller W. Globin gene server. Available at: www.globin.cse.psu.edu
2 Serjeant G.R., Serjeant B.E. Sickle Cell Disease, 3rd ed., Oxford: Oxford University Press, 2001.
3 Dacie J.V. The Haemolytic Anaemias, Vol. 2: The Hereditary Haemolytic Anaemias, 3rd ed., Edinburgh: Churchill Livingstone; 1988:322.
4 White J.M. The unstable haemoglobin disorders. Clin Haematol. 1974;3:333-356.
5 Stephens A.D. Annotation: Polycythaemia and high affinity haemoglobins. Br J Haematol. 1977;36:153-159.
6 Kiese M. Methemoglobinemia: A Complete Treatise. Cleveland, OH: CRC Press, 1974.
7 Weatherall D.J., Clegg J.B. The Thalassaemia Syndromes, 4th ed., Oxford: Blackwell Science, 2001.
8 Flint J., Harding R.M., Boyce A.J., et al. The population genetics of haemoglobinopathies. Baillières Clin Haematol. 1998;11:1-51.
9 Thein S.L. β-thalassaemia. Baillières Clin Haematol. 1998;11:91-126.
10 Thein S.L. β thalassaemia. In: Green A.R., editor. Educational Book. Birmingham: Fifth Congress of the European Haematology Association; 2000:132-137.
11 British Committee for Standards in Haematology. Guidelines for the investigation of the α and β thalassaemia traits. J Clin Pathol. 1994;47:289-295.
12 Higgs D.R. β-Thalassaemia. Baillières Clin Haematol. 1993;6:117-150.
13 Wood W.G. Increased HbF in adult life. Baillières Clin Haematol. 1993;6:177-213.
14 Wood W.G., Stamatoyannopoulos G., Lim G., et al. F cells in the adult: normal values and levels in individuals with hereditary and acquired elevations of Hb F. Blood. 1975;46:671-682.
15 Wild B.J., Green B.N., Cooper E.K., et al. Rapid identification of hemoglobin variants by electrospray ionization mass spectrometry. Blood Cells Mol Dis. 2001;27:691-704.
16 Wild B.J., Bain B.J. Detection and quantitation of normal haemoglobins: an analytical review. Ann Clin Biochem. 2004;41:1-15.
17 Lafferty J.D., Crowther M.A., Ali M.A., et al. The evaluation of various mathematical RBC indices and their efficacy in discriminating between thalassemic and non-thalassemic microcytosis. Am J Clin Pathol. 1996;106:201-205.
18 Eldibany M.M., Totonchi K.F., Joseph N.J., et al. Usefulness of certain red blood cell indices in diagnosing and differentiating thalassemia trait from iron deficiency anemia. Am J Clin Pathol. 1999;111:676-682.
19 Stephens A.D., Wild B.J. Quality control in haemoglobinopathy investigations. Methods in Hematology. 1990;22:72-85.
20 British Committee for Standards in Haematology Working Party of the General Haematology Task Force. The laboratory diagnosis of haemoglobinopathies. Br J Haematol. 1998;101:783-792.
21 British Committee for Standards in Haematology. Guidelines for haemoglobinopathy screening. Clin Lab Haematol. 1988;10:87-94.
22 British Committee for Standards in Haematology. Guidelines for fetal diagnosis of globin gene disorders. J Clin Pathol. 1994;47:199-204.
23 International Committee for Standardization in Haematology. Recommendations for neonatal screening for haemoglobinopathies. Clin Lab Haematol. 1988;10:335-345.
24 International Committee for Standardization in Haematology. Simple electrophoretic system for presumptive identification of abnormal hemoglobins. Blood. 1978;52:1058-1064.
25 International Committee for Standardization in Haematology. Recommendations for a system for identifying abnormal hemoglobins. Blood. 1978;52:1065-1067.
26 Schneider R.G. Identification of hemoglobin by electrophoresis. In: Schmidt R.M., Huisman T.H.J., Lehmann H., editors. The Detection of Hemoglobinopathies. Cleveland, OH: CRC Press; 1974:11.
27 Marder V.J., Conley C.L. Electrophoresis of hemoglobin on agar gel. Frequency of hemoglobin D in a Negro population. Bulletin of the Johns Hopkins Hospital. 1959;105:77-88.
28 Schroeder W.A., Shelton J.B., Shelton J.R. Separation of hemoglobin peptides by high performance liquid chromatography (HPLC). Hemoglobin. 1980;4:551-559.
29 Wild B.J., Stephens A.D. The use of automated HPLC to detect and quantitate haemoglobins. Clin Lab Haematol. 1997;19:171-176.
30 Phelan L., Bain B.J., Roper D., et al. An analysis of relative costs and potential benefits of different policies for antenatal screening for β thalassaemia trait and variant haemoglobins. J Clin Pathol. 1999;52:697-700.
31 Bain B.J., Wild B.J., Stephens A.D., et al. Variant Haemoglobins: a Guide to Identification. Oxford: Blackwell Publishing, 2010.
32 Riou J., Godart C.M., Hurtrel D., et al. Cation-exchange HPLC evaluated for presumptive identification of hemoglobin variants. Clin Chem. 1997;43:34-39.
33 Head C.E., Conroy M., Jarvis M., et al. Some observations on the measurement of haemoglobin A2 and S percentages by high performance liquid chromatography in the presence and absence of thalassaemia. J Clin Pathol. 2004;57:276-280.
34 Millar C.M., Phelan L., Bain B.J. Diabetes mellitus diagnosed following request for haemoglobin electrophoresis. Lancet. 2002;117:778.
35 Righetti P.G., Gianazza E., Bianchi-Bosisio A., et al. The hemoglobinopathies: conventional isoelectric focusing and immobilized pH gradients for hemoglobin separation and identification. Methods in Hematology. 1986;15:47-71.
36 Basset P., Beuzard Y., Garel M.C., et al. Isoelectric focusing of human hemoglobins: its application to screening to characterization of 70 variants and to study of modified fractions of normal hemoglobins. Blood. 1978;51:971-982.
37 Evatt B.L., Gibbs W.N., Lewis S.M., et al. Fundamental Diagnostic Hematology: Anemia, 2nd ed., Geneva: U.S. Department of Health and Human Services, Atlanta and World Health Organization, 1992.
38 . NHS Sickle cell and thalassemia screening programme. Available at: www.kcl-phs.org.uk/haemscreening
39 Carrell R.W. The hemoglobinopathies: methods of determining hemoglobin instability (unstable hemoglobins). Methods in Haematology. 1986;15:109-124.
40 Grimes A.J., Meisler A. Possible cause of Heinz bodies in congenital Heinz body anaemia. Nature. 1962;194:190-191.
41 Grimes A.J., Meisler A., Dacie J.V. Congenital Heinz-body anaemia: further evidence on the cause of Heinz-body production in red cells. Br J Haematol. 1964;10:281-290.
42 Carrell R.W., Kay R. A simple method for the detection of unstable haemoglobins. Br J Haematol. 1972;23:615-619.
43 Marengo-Rowe A.J. Rapid electrophoresis and quantitation of hemoglobins on cellulose acetate. J Clin Pathol. 1965;18:790-792.
44 International Committee for Standardization in Haematology. Recommendations for selected methods for quantitative estimation of Hb A2 and for Hb A2 reference preparation. Br J Haematol. 1978;38:573-578.
45 Efremov G.D., Huisman T.H.J., Bowman K., et al. Microchromatography of hemoglobins: II A rapid method for the determination of Hb A2. J Lab Clin Med. 1974;83:657-664.
46 Huisman T.H.J., Schroeder W.A., Brodie A.R., et al. Microchromatography of hemoglobins III. A simplified procedure for the determination of hemoglobin A2. J Lab Clin Med. 1975;86:700-702.
47 Kattamis C., Lagos P., Metaxotou-Mavromati A., et al. Serum iron and unsaturated iron-binding capacity in the β-thalassaemia trait: their relation to the levels of haemoglobins A, A2 and F. J Med Genet. 1972;9:154-159.
48 Alperin J.B., Dow P.A., Peteway M.B. Hemoglobin A2 levels in health and various hematological disorders. Am J Clin Pathol. 1977;67:219-226.
49 Efremov G.D. The hemoglobinopathies: quantitation of hemoglobins by microchromatography. Methods in Hematology. 1986;15:72-90.
50 Wasi P., Na-Nakorn S., Pootrakul S., et al. Alpha- and beta-thalassemia in Thailand. Ann N Y Acad Sci. 1969;165:60-82.
51 Routy J., Monte M., Beaulieu R., et al. Increase of haemoglobin A2 in human immuno-deficiency virus-1-infected patients treated with zidovudine. Am J Hematol. 1993;43:86-90.
52 Howard J., Henthorn J.S., Murphy S., et al. Implications of increased haemoglobin A2 values in HIV positive women in the antenatal clinic. J Clin Pathol. 2005;58:556-558.
53 Felice A.E. The hemoglobinopathies: quantitation of fetal hemoglobin. Methods in Hematology. 1986;15:91-108.
54 Betke K., Marti H.R., Schlicht L. Estimation of small percentage of foetal haemoglobin. Nature. 1959;184:1877-1878.
55 Jonxis J.H.P., Visser H.K.A. Determination of low percentages of fetal hemoglobin in blood of normal children. Am J Dis Child. 1956;92:588-591.
56 Chudwin D.S., Rucknagel D.L. Immunological quantification of hemoglobins F and A2. Clin Chim Acta. 1974;50:413-418.
57 Makler M.T., Pesce A.J. ELISA assay for measurement of hemoglobin A and hemoglobin F. Am J Clin Pathol. 1980;74:673-676.
58 Zago M.A., Wood W.G., Clegg J.B., et al. Genetic control of F-cells in human adults. Blood. 1979;53:977-986.
59 Kleihauer E. Determination of fetal hemoglobin: elution technique. In: Schmidt R.M., Huisman T.H.J., Lehmann H., editors. The Detection of Hemoglobinopathies. Cleveland, OH: CRC Press; 1974:20.
60 Weatherall D.J. The thalassemias: haematologic methods. Methods in Haematology. 1983;6:27-30.
61 Fessas P. Inclusions of hemoglobin in erythroblasts and erythrocytes of thalassemia. Blood. 1963;21:21-32.
62 White J.M., Dacie J.V. The unstable hemoglobins – molecular and clinical features. Prog Hematol. 1971;7:69-102.