CHAPTER 35 Interpretation and Reporting in Obstructive Coronary Disease
TECHNIQUES
Indications
Potential indications for coronary CTA are many and continue to evolve. Recently, the American College of Cardiology Foundation Quality Strategic Directions Committee Appropriateness Criteria Working Group, the American College of Radiology, and others have published a joint review on the appropriateness of cardiac CTA.1 This report scored the appropriateness of cardiac CTA in several clinical applications on a scale from 1 to 9 based on the available literature. The information and experience available with cardiac CTA at this time are not robust enough to support categorical recommendations and guidelines. This is so because the technology continues to change rapidly, there are not enough prospective studies on different groups of patients, and there are no outcome studies on the prognostic value of cardiac CTA. Therefore, the appropriateness criteria are not guidelines but rather temporary recommendations until official guidelines are published.
Pitfalls and Solutions
In CT, the term artifact applies to any systematic discrepancy between the CT numbers in the reconstructed image and the true attenuation coefficients of the object. CT images are inherently prone to artifacts because the image is reconstructed from multiple independent detector measurements. The reconstruction algorithm assumes that all these measurements are consistent, so any error of measurement will usually be reflected as an error in the reconstructed image.2,3
Artifacts can seriously degrade the quality of CT images, sometimes to the point of making them diagnostically unusable. Furthermore, accuracy of cardiac CTA for detection of stenoses depends highly on image artifacts,3 which are a major cause of false-positive and false-negative interpretations.
To optimize image quality, it is necessary to understand why artifacts occur and how they can be prevented (Table 35-1). CT artifacts originate from a range of sources. Physics-based artifacts result from the physical processes involved in the acquisition of CT data. Patient-based artifacts are caused by such factors as movement of the patient or the presence of metallic materials inside or on the patient.
Beam Hardening
An x-ray beam is composed of individual photons with a range of energies. As the beam passes through the patient, it becomes “harder”; its mean energy increases because the lower energy photons are absorbed. As a result of this effect, dark bands or streaks can appear on the image adjacent to dense objects such as calcifications, dense contrast material, or metallic clips (Fig. 35-1). Beam hardening can be minimized by filtration.
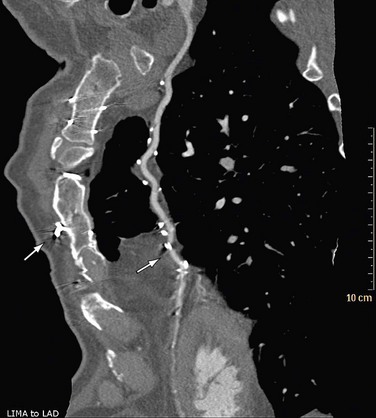
 FIGURE 35-1
Partial Volume (Blooming)
CT numbers are based on attenuation coefficients for a voxel of tissue. If the voxel contains more than one tissue type, the CT number will be based on an average of the different tissues involved. For example, a dense calcified plaque or stent, lying off-center, may appear larger than it actually is in the reconstructed image because of partial volume effects and create an exaggerated luminal narrowing (Fig. 35-2). This problem is magnified if there are also motion artifacts (Fig. 35-3).
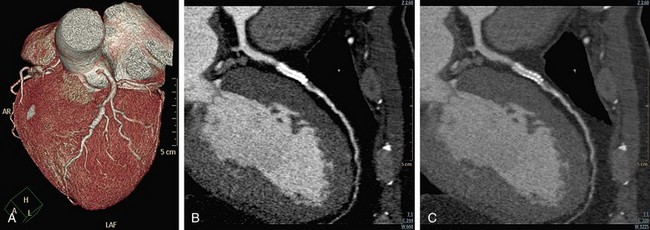
 FIGURE 35-2
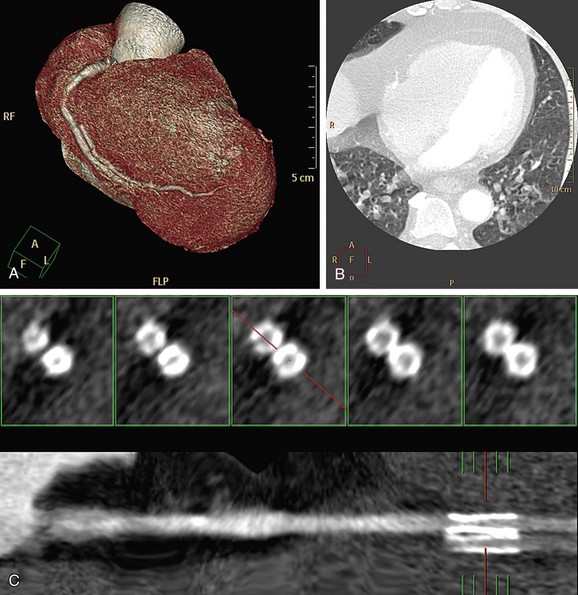
 FIGURE 35-3
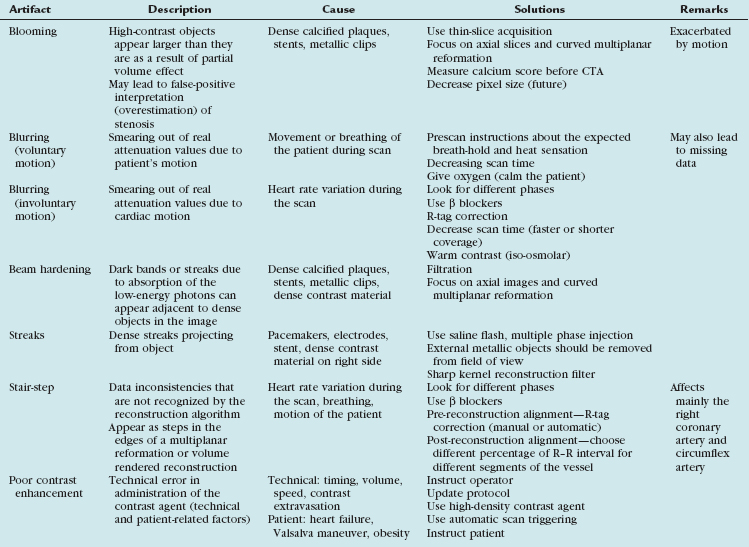
Metallic Materials (Streaks)
The presence of metal objects (such as pacemakers, electrodes, stents, and surgical clips) in the scan field can generate severe streak artifacts (Figs. 35-4 and 35-5). They occur because the metal object absorbs the radiation, resulting in incomplete projection profiles.
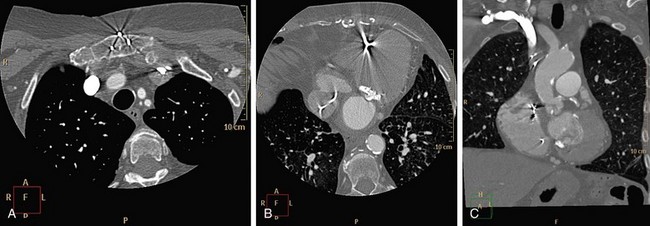
 FIGURE 35-4
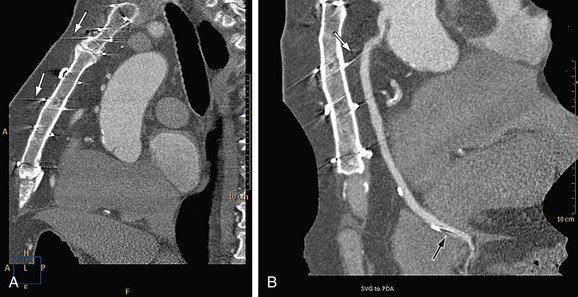
 FIGURE 35-5
Patient Motion (Blurring)
Motion of the patient can cause misregistration artifacts, which usually appear as shading or streaking in the reconstructed image (Fig. 35-6). Steps can be taken to prevent voluntary motion (due to movement or breathing during the scan), but some involuntary motion may be unavoidable. Prescan instructions about the expected breath-hold are critical to minimize motion artifacts as well as to decrease scan time. Involuntary motion artifacts may be caused by heart rate irregularities during the scan and will appear as blurring or stair-step artifacts. Looking for a motion-free phase can sometimes help improve visualization of the coronary arteries (Fig. 35-7).
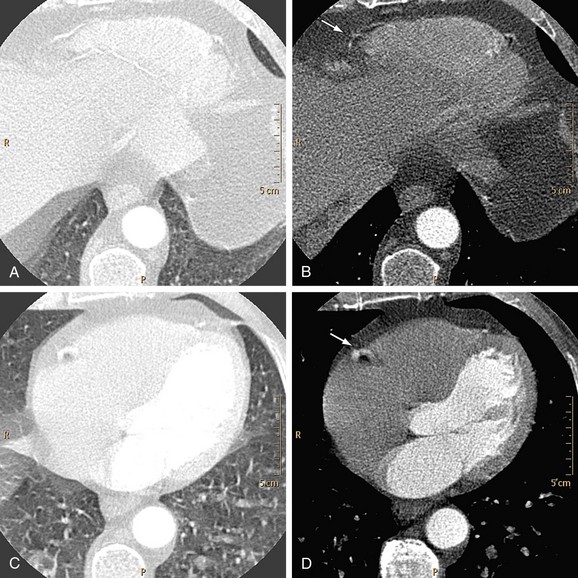
 FIGURE 35-6
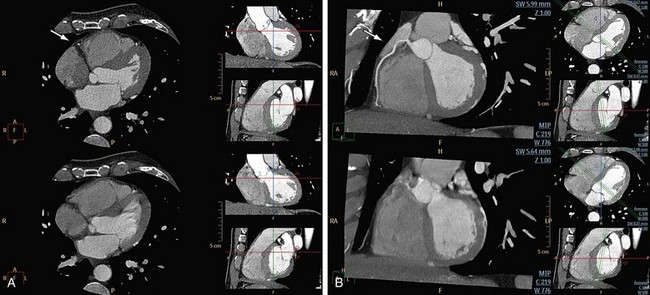
 FIGURE 35-7
Stair-Step Artifacts
In ECG-gated scans, an irregular R–R interval may cause data inconsistencies that are not recognized by the reconstruction algorithm, resulting in stair-step artifacts through the heart (Fig. 35-8).
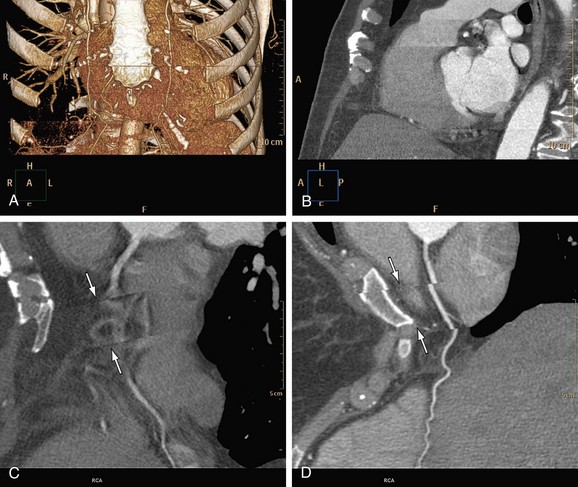
 FIGURE 35-8
Administration of β blockers to lower the heart rate and to try to stabilize it may prevent arrhythmia during the scan. Some manufacturers provide software for R-tag correction in case an arrhythmia has occurred (Fig. 35-9). Looking for a quiet phase of the cardiac cycle with minimal motion may help minimize cardiac motion–induced artifacts. If prospective gating with sequential (axial) acquisition mode is used, heart rate changes during the scan cause stair-step artifacts through the volume (Fig. 35-10).
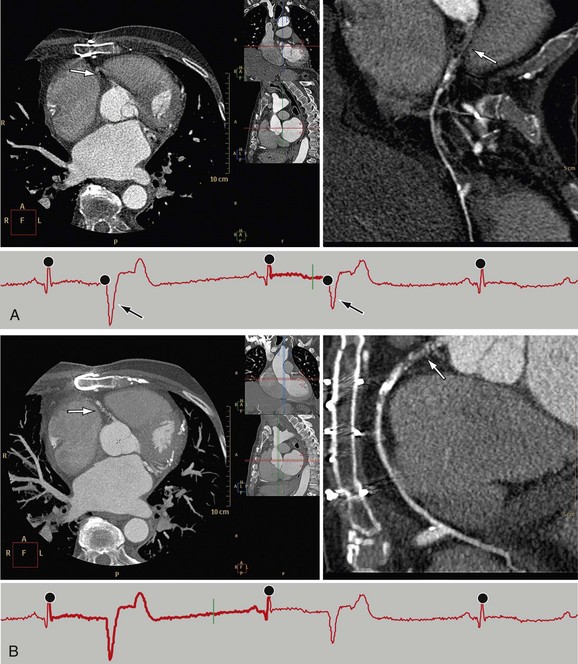
 FIGURE 35-9
 FIGURE 35-10
Image Interpretation
Postprocessing
Multiplanar Reformation
In multiplanar reformation (MPR), a plane is defined within the three-dimensional volume of the scan, and only the data in this plane are displayed. MPR can be performed in either a straight plane or a curved plane (along a vessel’s “centerline”). In performing MPR, the thickness of the selection is set to be as thin as the collimation allows. When a greater thickness is selected, a slab MPR is created, and it is usually rendered with maximum intensity projection (see later). MPR can be created in any plane; it is very fast and easy to use and provides images containing all available information (all Hounsfield unit values are retained). Curved MPR with cross-sectional images is the best method for stenosis assessment, particularly in patients with calcified lesions or stents (Fig. 35-11). It is possible to rotate the image around the centerline and to view any plaque from different rotational angles to differentiate between eccentric and concentric plaques. A major disadvantage of MPR is the dependence on manual orientation of the planes that may cause false-positive or false-negative interpretation of stenoses. Interactive viewing of these types of images from multiple viewing angles is therefore required. Furthermore, for each vessel branch, a separate MPR image is required, and only one branch can be displayed at a time. Advanced software is available to allow semiautomatic segmentation of the coronary arteries, to determine the vessel’s centerline, and to reconstruct curved MPR as well as cross-sectional images.
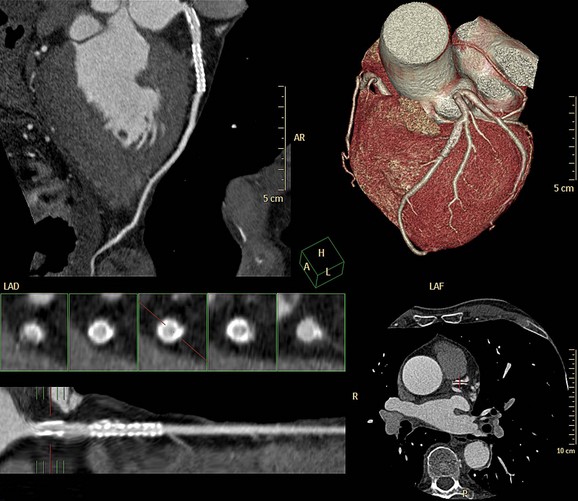
 FIGURE 35-11
Stenosis Assessment
The percentage of unassessable segments was more than 30% on a 4-slice scanner4,5 and around 22% to 29% with 16-slice scanners.6,7 One study stated that if these unassessable segments were excluded or considered negative, 25% of patients with a significant stenosis would have been missed.7 With 64-MDCT, only 3% to 11% of coronary artery segments still cannot be evaluated.8–11
Sensitivities and specificities for detection of significant (>50%) coronary artery stenoses based on segmental analysis with 64-MDCT (with conventional x-ray coronary angiography as the standard of reference) have been found to be good to excellent, in the range of 76% to 99% and 95% to 97%, respectively.11–15 However, these study outcomes are difficult to compare, mainly because of the different selection of patients and the prevalence of significant coronary artery disease. Moreover, these study results should be interpreted with care because of exclusion of unassessable segments from analysis as well as studies with reduced image quality. In an unselected population of patients referred for coronary catheterization with a high prevalence of risk factors, we found high specificity (95%) and negative predictive value (95%) and moderate sensitivity (72%) for significant coronary narrowing with use of a 40-slice scanner.16 All studies found that cardiac CTA has a very high negative predictive value (95% or higher) for exclusion of significant coronary stenosis.
Accuracy for detection of stenoses depends highly on image quality and artifacts. False-positive and false-negative interpretations were attributed to image artifacts in 91% to 100% of cases,10,12–14,17,18 mainly because of the presence of calcifications. Less frequent causes were motion artifacts and obesity, resulting in a poor contrast-to-noise ratio.
As mentioned, calcified plaques are a major cause of overestimation of stenosis, mainly with the older generation of scanners (4- and 16-slice scanners). It was recommended to perform a non–contrast-enhanced scan before the cardiac CTA and to avoid scanning patients with high calcium scores (usually above 400 to 600). In our experience, using the 64-slice scanner, with improved temporal and spatial resolution, it is possible to cope with most calcified plaques. Curved MPR with cross-sectional images through the plaque is the method of choice (Fig. 35-12). If a lumen is visible adjacent to a calcification (regardless of its size), significant stenosis (>50%) can be excluded.
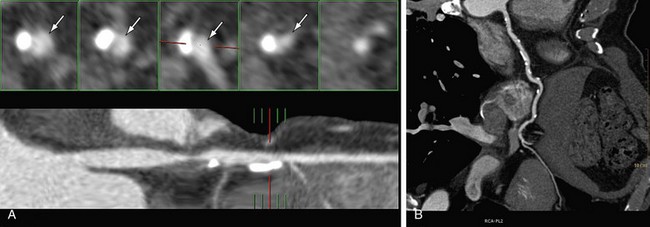
 FIGURE 35-12
Plaque Characterization
Acute coronary events are usually caused by rupture of atherosclerotic plaque (in most cases, nonobstructive plaque), platelet aggregation, and thrombosis with partial or complete occlusion of the arterial lumen. This is one of the reasons that many patients do not have symptoms before their first coronary event. When individuals at increased risk for acute coronary events are identified while still asymptomatic, initiation of preventive therapy, including antiplatelet, antihypertensive, and lipid-lowering medications as indicated, can substantially reduce the risk of coronary artery events. Traditionally, the classic risk factors have been used to identify individuals at risk (quantification of their risk by the Framingham score), but they have limited predictive accuracy. Cardiac CTA is a noninvasive imaging modality allowing identification, quantification, and to some extent characterization of the atherosclerotic process at a subclinical stage. Quantification of coronary calcium (calcium scoring) is an established method to estimate the coronary plaque burden, with a high predictive value for occurrence of future cardiac events in asymptomatic individuals, independently of the traditional risk factors.19 However, the calcium score (calcified plaques) represents only about 20% of the total plaque burden,20 and it is the noncalcified component of the plaque that is considered less stable and prone to rupture.
The ability of CT to identify and to characterize nonobstructive plaque composition (calcified, noncalcified, and mixed) has been demonstrated before,21,22 and Achenbach and coworkers23 demonstrated vessel wall remodeling in high-quality 16-slice scans. Schroeder and associates24 studied 12 patients and found that “hypoechoic” plaques on IVUS had a lower mean CT attenuation (14 ± 26 HU) compared with “fibrotic” plaques (91 ± 21 HU) or “calcified” plaques (419 ± 194 HU). Leber and colleagues25 found a mean density of 49 ± 22 HU for soft plaque, 91 ± 226 HU for intermediate (fibrous) plaque, and 391 ± 156 HU for calcified plaque, as defined by IVUS. Even though CT is able to detect a variety of densities within the plaque, in our experience and that of others, there is substantial overlap between those groups. Furthermore, contrast enhancement within the vessel lumen may affect plaque enhancement, leading to variability in readings for any given plaque.
Comparing the performance of the 64-slice scanner with IVUS for noncalcified plaque detection, Leber and colleagues26 found 84% sensitivity and 91% specificity, with good correlation between plaque and lumen area measured, especially in proximal segments of the coronary tree. Caussin and associates27 found that 16-detector row CT can accurately assess certain vulnerable plaque characteristics, such as hypodense areas (representing lipid), eccentricity, arterial remodeling, and calcifications, in comparison to IVUS. However, detailed microanatomy and detection of inflammatory changes in unstable lesions are beyond the resolution of current CT scanners.
We compared the total coronary plaque burden (segmental analysis), visualized by cardiac CT, with the traditional risk factors in 97 patients who underwent invasive coronary angiography. We found that nonobstructive coronary plaques were better detected on cardiac CT (277 of 737) than on invasive coronary angiography (111 of 737). The overall plaque burden was significantly higher in patients with diabetes, hypertension, or longer history of coronary artery disease and correlated with the number of risk factors. Furthermore, we found that among symptomatic patients without evidence of calcifications in the coronary arteries, 20% had noncalcified plaques and 7% had significant stenosis on 64-slice cardiac CT.28 Because the long-term prognostic significance of these findings is currently unknown, additional experience and especially follow-up are needed to determine whether the additional “effort” (radiation, contrast material, time) to detect noncalcified plaques is justified.
Reporting
The next step is to report on each of the coronary artery segments visible (Fig. 35-13). Invasive angiography will usually visualize more distal segments than is possible with CTA, but vessels smaller than 1.5 mm are currently not suitable for an intervention (with stent placement or bypass grafting) anyway.
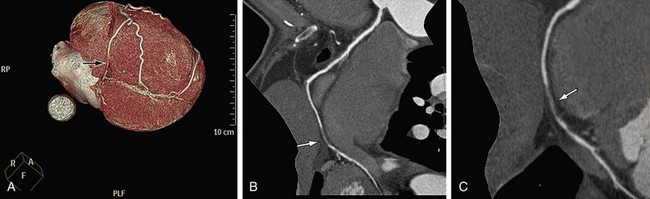
 FIGURE 35-13
After the initial navigation with slab maximum intensity projection images to locate areas of suspected stenosis, we perform a curved MPR for each coronary artery and for each visible branch. Because CTA provides three-dimensional information, the view that shows the largest lumen is the correct one (Fig. 35-14). Invasive angiography, on the other hand, is a two-dimensional imaging modality that provides projections of the coronary tree, in which the tightest view is the correct answer. Therefore, it is important to look at every segment from different viewing angles (by rotating the MPR around the centerline) to appreciate correct lumen size. Plaques (especially calcified plaques) should be carefully evaluated in cross-sectional images to assess for a visible lumen adjacent to the calcification. Any abnormality should be confirmed in more than one phase to exclude artifacts.
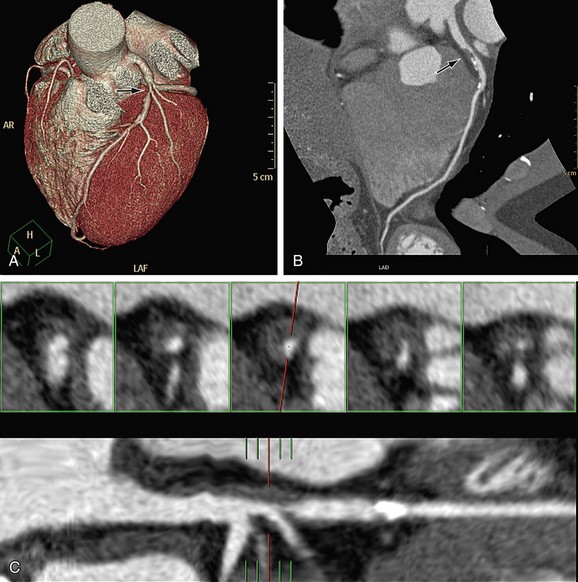
 FIGURE 35-14
Instead of giving precise stenosis percentage, we prefer to categorize each lesion into groups according to suspected severity of stenosis and clinical relevance (Table 35-2). Our categories include normal (when the vessel is smooth and there is no evidence of plaque), nonsignificant or mild stenosis (when there is some irregularity or plaques causing up to 40% stenosis), borderline lesions (when a lesion is suspected to cause 40% to 60% stenosis), and significant stenosis (when a lesion is suspected to cause more than 70% stenosis up to total occlusion). Alternatively, quartile gradations can be used, such as 0% to 25%, 26% to 50%, 51% to 75%, and 76% to 100%. Remember to underestimate stenosis caused by a calcified plaque (because of the blooming effect), and as long as a lumen is visible, significant stenosis can safely be excluded. The term total occlusion should be used only when no contrast material is visible distal to a stenosis because it is not possible to differentiate on CTA between antegrade and retrograde filling of a segment (Fig. 35-15). It is important to comment on presence of calcifications within the occluded segment, indicating chronic or acute on chronic lesion, which may be more difficult to treat invasively. When a lesion is difficult to assess (because of artifacts or calcifications), use of a statement such as “stenosis cannot be excluded” may be reasonable.
TABLE 35-2 Optional Categories for CTA Stenosis Assessment with Clinical Impression and Recommended Next Steps
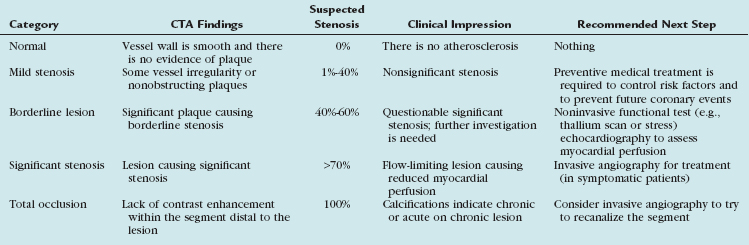
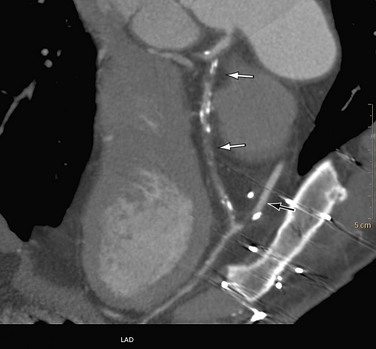
 FIGURE 35-15


1 Hendel RC, Patel MR, Kramer CM, Poon M. ACCF/ARC/SCCT/SCMR/ASNC/NASCI/SCAI/SIR 2006 appropriateness criteria for cardiac computed tomography and cardiac magnetic resonance imaging: a report of the American College of Cardiology Foundation Quality Strategic Directions Committee Appropriateness Criteria Working Group, American College of Radiology, Society of Cardiovascular Computed Tomography, Society for Cardiovascular Magnetic Resonance, American Society of Nuclear Cardiology, North American Society for Cardiac Imaging, Society for Cardiovascular Angiography and Interventions, and Society of Interventional Radiology. J Am Coll Cardiol. 2006;48:1475-1497.
2 Barrett JF, Keat N. Artifacts in CT: recognition and avoidance. Radiographics. 2004;24:1679-1691.
3 Kroft LJM, de Roos A, Geleijns J. Artifacts in ECG-synchronized MDCT coronary angiography. AJR Am J Roentgenol. 2007;189:581-591.
4 Giesler T, Baum U, Ropers D, et al. Noninvasive visualization of coronary arteries using contrast-enhanced multidetector CT: influence of heart rate on image quality and stenosis detection. AJR Am J Roentgenol. 2002;179:911-916.
5 Nieman K, Rensing BJ, van Geuns RJ, et al. Usefulness of multislice computed tomography for detecting obstructive coronary artery disease. Am J Cardiol. 2002;89:913-918.
6 Heuschmid M, Kuettner A, Schroeder S, et al. ECG-gated 16-MDCT of the coronary arteries: assessment of image quality and accuracy in detecting stenosis. AJR Am J Roentgenol. 2005;184:1413-1419.
7 Garcia MJ, Lessick J, Hoffmann MHK. Accuracy of 16-row multidetector computed tomography for the assessment of coronary artery stenosis. JAMA. 2006;296:403-411.
8 Ferencik M, Nomura CH, Maurovich-Horvat P, et al. Quantitative parameters of image quality in 64-slice computed tomography angiography of the coronary arteries. Eur J Radiol. 2006;57:373-379.
9 Pannu HK, Jacobs JE, Lai S, Fishman EK. Coronary CT angiography with 64-MDCT: assessment of vessel visibility. AJR Am J Roentgenol. 2006;187:119-126.
10 Leshka S, Husmann L, Desbiolles LM, et al. Optimal image reconstruction intervals for non-invasive coronary angiography with 64-slice CT. Eur Radiol. 2006;16:1964-1972.
11 Nikolaou K, Knez A, Rist C, et al. Accuracy of 64-MDCT in the diagnosis of ischemic heart disease. AJR Am J Roentgenol. 2006;187:111-117.
12 Mollet NR, Cademartiri F, van Mieghem CAG, et al. High-resolution spiral computed tomography coronary angiography in patients referred for diagnostic conventional coronary angiography. Circulation. 2005;112:2318-2323.
13 Leber AW, Knez A, von Ziegler F, et al. Quantification of obstructive and nonobstructive coronary lesions by 64-slice computed tomography: a comparative study with quantitative coronary angiography and intravascular ultrasound. J Am Coll Cardiol. 2005;46:147-154.
14 Raff GL, Gallagher MJ, O’Neill WW, Goldstein JA. Diagnostic accuracy of noninvasive coronary angiography using 64-slice spiral computed tomography. J Am Coll Cardiol. 2005;46:552-557.
15 Pugliese F, Mollet NRA, Runza G, et al. Diagnostic accuracy of non-invasive 64-slice CT coronary angiography in patients with stable angina pectoris. Eur Radiol. 2006;16:575-582.
16 Halon DA, Gaspar T, Adawi S, et al. Uses and limitations of 40 slice multi-detector row spiral computed tomography for diagnosing coronary lesions in unselected patients referred for routine invasive coronary angiography. Cardiology. 2006;108:200-209.
17 Leschka S, Alkadhi H, Plass A, et al. Accuracy of MSCT coronary angiography with 64-slice technology: first experience. Eur Heart J. 2005;26:1482-1487.
18 Ropers D, Rixe J, Anders K, et al. Usefulness of multidetector row spiral computed tomography with 64- × 0.6-mm collimation and 330-ms rotation for the non-invasive detection of significant coronary artery stenoses. Am J Cardiol. 2006;97:343-348.
19 Shaw LJ, Raggi P, Schisterman E, et al. Prognostic value of cardiac risk factors and coronary artery calcium screening for all-cause mortality. Radiology. 2003;228:826-833.
20 Rumberger JA, Simons DB, Fitzpatrick LA, et al. Coronary artery calcium area by electron beam computed tomography and coronary atherosclerotic plaque area: a histopathologic correlative study. Circulation. 1995;92:2157-2162.
21 Achenbach S, Moselewski F, Ropers D, et al. Detection of calcified and noncalcified coronary atherosclerotic plaque by contrast-enhanced, submillimeter multidetector spiral computed tomography. A segment-based comparison with intravascular ultrasound. Circulation. 2004;109:14-17.
22 Schoenhagen P, Tuzcu EM, Stillman AE, et al. Non-invasive assessment of plaque morphology and remodeling in mildly stenotic coronary segments: comparison of 16-slice computed tomography and intravascular ultrasound. Coron Artery Dis. 2003;14:459-462.
23 Achenbach S, Ropers D, Hoffmann U, et al. Assessment of coronary remodeling in stenotic and nonstenotic coronary atherosclerotic lesions by multidetector spiral computed tomography. J Am Coll Cardiol. 2004;43:842-847.
24 Schroeder S, Kopp AF, Baumbach A, et al. Noninvasive detection and evaluation of atherosclerotic coronary plaques with multislice computed tomography. J Am Coll Cardiol. 2001;37:1430-1435.
25 Leber AW, Knez A, Becker A, et al. Accuracy of multidetector spiral computed tomography in identifying and differentiating the composition of coronary atherosclerotic plaques. J Am Coll Cardiol. 2004;43:1241-1247.
26 Leber AW, Knez A, Ziegler F, et al. Quantification of obstructive and nonobstructive coronary lesions by 64-slice computed tomography—a comparative study with quantitative coronary angiography and intravascular ultrasound. J Am Coll Cardiol. 2005;46:147-154.
27 Caussin C, Ohanessian A, Ghostine S, et al. Characterization of vulnerable nonstenotic plaque with 16-slice computed tomography compared with intravascular ultrasound. Am J Cardiol. 2004;94:99-104.
28 Rubinshtein R, Gaspar T, Halon DA, et al. Prevalence and extent of obstructive coronary artery disease in patients with zero or low calcium score undergoing 64-slice cardiac multidetector computed tomography for evaluation of chest pain syndrome. Am J Cardiol. 2007;99:472-475.
