[level-membership-for-hematology-oncology-and-palliative-medicine-category]
Chapter 4 Interaction of Chemotherapy and Radiation
Historical Perspective
Radiosensitization and chemosensitization are each complex concepts that have many different interpretations and have been used to describe a variety of interactions.1,2 The combination of irradiation and chemotherapy for mutual or even simultaneous sensitization increases the intricacies of these interactions. For example, over 100 years ago radiation treatment and benzene systemic therapy were combined for leukemia treatment.3 However, probably the best historical model of chemotherapy and radiation therapy interaction is the use of 5-fluorouracil.
5-Fluorouracil
In the 1950s, the halogenated pyrimidine 5-fluorouracil (5-FU) was combined with external beam irradiation therapy (EBRT) after this class of drug was determined to have anticancer properties.4 In the past 50 years, 5-FU has been successfully combined with radiation to treat a variety of gastrointestinal cancers, as well as cervical cancer and head and neck cancer.5 The route of administration and scheduling of 5-FU doses have been reconfigured many times to reduce toxicity and maximize tumor control. What began as bolus delivery at the beginning and end of a fractionated radiation treatment course (Moertel regimen) has progressed to protracted venous infusion (PVI), and now to twice-daily doses of oral 5-FU analog formulations. These approaches have allowed for an increase in cumulative dose of the drug, decreased chemotherapy toxicity, and improved radiosensitization. 5-FU has proven to be a staple drug in the armamentarium of medical oncologists as well as a key radiosensitizer for the radiation oncologist.
Rationale
Limitations in Current Therapeutic Approach
Tumor Detection
If ionizing radiation were not toxic to normal tissues, tumor detection would be immaterial and radiotherapy could be delivered to the entire body much as chemotherapy is given. Obviously, this is not the case. Just as surgeons must identify tumor tissue and remove it with a scalpel, radiation oncologists must be able to identify tumor tissue so that they can precisely and accurately target it with radiation. Fortunately, advances in radiology have dramatically improved the ability to detect tumor location and extent. CT and MRI scanning provide excellent anatomic information, but when they are combined with biologic or functional imaging techniques such as positron emission tomography (PET) or single-photon emission computed tomography (SPECT), they are even more precise at differentiating tumor tissue from nontumor tissue. Emerging MRI sequences, including dynamic contrast-enhanced MRI or CT scanning, fast imaging employing steady-state acquisition (FIESTA), and ultrafast pulse sequence approaches, provide improved anatomic imaging for surgeons and radiation oncologists. Nevertheless, the resolution of current techniques (on the order of 5 mm for PET resolution6) and the high rate of false-negatives with small tumors still limit the ability to identify microscopic tumor extent and micrometastatic disease. Technologies currently being explored, such as PET/MRI, as well as novel radiopharmaceuticals may provide improvements in the near future.
Inherent and Acquired Resistance
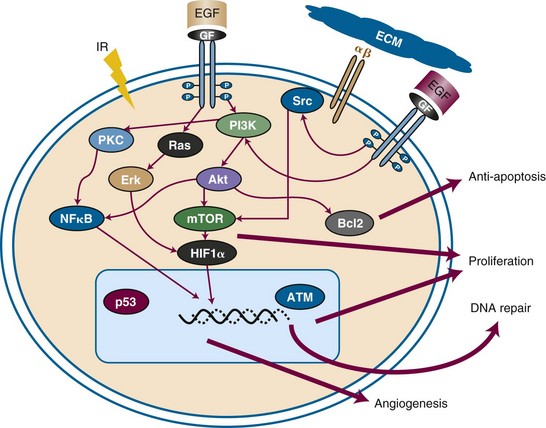
Certain tumors have inherent radiation resistance pathways that manifest with high rates of local failure following irradiation. In some cases, such as pancreatic cancer, it is difficult to deliver adequate doses of radiation to the target because of the limitations in dose tolerance of surrounding bowel, kidney, and liver tissues. Other tumors have extremely high local failure rates despite dose escalation; for example, glioblastoma multiforme has local recurrence rates approaching 100%. Biologic factors within the tumor or tumor microenvironment also generate resistance. Figure 4-1 summarizes some of the major resistance pathways within tumors. Later in this chapter we will describe how chemotherapeutic agents can potentially mitigate these resistance pathways.
Increased Toxicity
In the original treatise by Steel and Peckham7 on combining chemotherapy and radiation therapy, it was assumed that each modality functioned independently in both beneficence and toxicity. However, concurrent chemoradiation therapy has shown increased toxicity, indicating some level of overlapping toxicity, chemosensitization by radiation, or radiosensitization by chemotherapeutic agents. Because chemoradiation is often used when tumors have wide anatomic extension (and thus surgery is precluded), the volume of normal tissue irradiated—and at risk for toxicity—is larger. In some cases, a patient has co-morbid conditions that prevent aggressive therapy.
Therapeutic Index
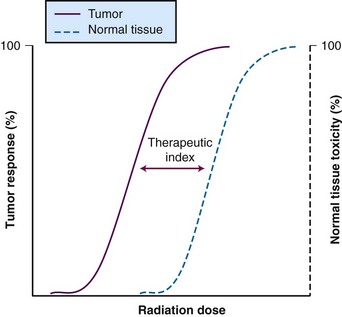
A metric is necessary to determine the efficacy of a therapy relative to its toxicity, so that newer approaches can be compared. This metric, known as the therapeutic index (or therapeutic ratio), is the ratio of the probability of tumor control to the probability of normal tissue toxicity. Typically, the ratio is calculated based on the 50% control rate of tumor tissue versus the 50% rate of normal tissue toxicity. These sigmoid-shaped curves determine estimated efficacy versus toxicity of treatment (Fig. 4-2). The therapeutic index is the “holy grail” of cancer therapy, and it takes careful treatment planning to achieve maximal tumor cell destruction while also sparing normal tissue in hopes of preserving function. There are a host of technologic factors that affect the therapeutic ratio, one in particular is the ability to correctly identify tumor tissue and normal tissue. Use of PET, MRI, and SPECT imaging, as described earlier, allows radiation oncologists to better differentiate target tissue from other tissues. The ability to precisely deliver radiation through techniques such as intensity-modulated radiation therapy (IMRT), stereotactic procedures, and proton therapy permits radiation oncologists to avoid normal tissue while targeting tumor tissue. Increasingly accurate delivery of radiation via image guidance (IGRT) enables smaller margin expansions, thus limiting the size of the dose that reaches normal tissue. However, because of the anatomic location of some tumors, there are still technological limits as to what can be accomplished with radiation alone. Additional improvements are likely to rely on the interaction of systemic agents with technologically advanced radiation delivery methods.
General Strategies to Improve the Therapeutic Index
In 1979, Steel and Peckham7 defined four potential ways that combined modality therapy might be used to improve the therapeutic index: (1) independent toxicity, (2) normal tissue protection, (3) spatial cooperation, and (4) enhanced tumor response. As discussed later, the first theoretical concept may not function as originally intended. However, the latter three concepts are relevant for modern strategies of combining drugs with radiation. Recent innovative concepts of biologic cooperation and temporal modulation that expand on Steel and Peckham’s “exploitable mechanisms in combined radiotherapy-chemotherapy”7 are having an impact on current investigative strategies for improving the therapeutic index.
Normal Tissue Protection
Only a few clinically relevant, therapeutic agents have been identified as promoting normal tissue protection without protecting tumors. There has been limited success with the free-radical scavenging agent amifostine (WR-2721). The drug appears to be selectively taken up by normal tissue relative to tumor tissue, where it is converted into the active thiol metabolite WR-1065.8 Although amifostine has been shown to protect against xerostomia in head and neck cancer treatment (Table 4-1) and to limit renal toxicity from cisplatin, several clinical trials have failed to show an advantage of amifostine use. Undoubtedly, clinical trials will continue to investigate novel radioprotectors that have the potential to affect the therapeutic ratio.
| Mechanism | Example | Notes |
|---|---|---|
| Normal tissue protection | Amifostine in head and neck cancer | Reduces xerostomia rates from RT alone |
| Spatial cooperation | Early-stage breast cancer with adjuvant CT PCI in SCLC |
RT provides locoregional control for breast cancer but no impact on DM SCLC CT does not effectively cross BBB → RT can effectively treat the brain |
| Biologic cooperation | Targeted therapies inhibit prosurvival/proliferation pathways within tumors | Kinase-targeted agents, including tyrosine kinase inhibitors such as dasatinib and sunitinib, as well as monoclonal antibodies such as cetuximab and bevacizumab; mTOR inhibitors |
| Temporal modulation | Drugs that affect tumor response between fractions, namely, targeting repair, repopulation, reoxygenation, and redistribution | This is essentially a composite of several of the other mechanisms but requires concomitant, rather than sequential, delivery of the drug |
| Increased DNA damage | Drugs that incorporate into DNA | 5-FU and platinum are classic examples |
| Inhibition of DNA repair | DNA intercalators and nucleoside analogs can disrupt repair and enhance radiation cytotoxicity | Alkylators, antimetabolites, platinum, and topoisomerase inhibitors are a few examples |
| Cell cycle effects | Most chemotherapeutics are cell cycle specific (except alkylators) Cell cycle arrest in radiosensitive phases (microtubule-targeting agents at M phase) Elimination of radioresistant cells (S phase) |
Taxanes, epothilones, 5-FU, gemcitabine, topoisomerase inhibitors are good examples |
| Targeting repopulation | Conceivably, any systemic agent that has at least cytostatic properties can prevent repopulation | Molecularly targeted agents as well as chemotherapeutics (particularly antimetabolites) can function this way |
| Hypoxia targeting | Mitomycin C and tirapazamine selectively targeting hypoxic cells Tumor shrinkage by CT decreases interstitial pressure and improves oxygenation |
Taxanes and other chemotherapeutics that can produce tumor shrinkage are indirect means (given as induction therapy), whereas mitomycin C and tirapazamine are directly affecting hypoxic cells |
| Tumor microenvironment targeting | Anti-angiogenesis promotes vascular renormalization | Bevacizumab in glioma |
BBB, blood-brain barrier; CT, chemotherapy; DM, distant metastases; 5-FU, 5-fluorouracil; PCI, prophylactic cranial irradiation; RT, radiation therapy; SCLC, small cell lung carcinoma.
Spatial Cooperation
The concept of spatial cooperation implies that chemotherapy and radiation therapy are independent “players,” with chemotherapy acting systemically (i.e., targeting micrometastatic disease) and radiation therapy acting locoregionally. Because these therapies function independently, it could be assumed that a full dose of each would be required to achieve the desired outcome. If the chemotherapy drug and irradiation did function completely independently, then concurrent administration should be possible with nonoverlapping toxicities. It is unclear whether a completely independent action can actually be achieved with the chemotherapeutics currently used with radiation treatment. Some in-field toxicities do occur, suggesting some level of localized radiation sensitization. Therefore, sequential therapy is probably the best means to exploit spatial cooperation. There are many clinical examples supporting this approach, such as adjuvant chemotherapy followed by irradiation for breast cancer, consolidative irradiation for bulky disease in lymphoma, and prophylactic cranial irradiation in small cell lung cancer (see Table 4-1).
Biologic Cooperation
The term biologic cooperation is a more recent concept9 that involves independent targeting of subpopulations of cells within the tumor itself (see Table 4-1). Although similar to the concept of spatial cooperation, biologic cooperation implies that some portion of the actual radiation target (i.e., in-field) is resistant to radiation and that this portion becomes the target of the drug given concomitantly. The most prominent example of an agent used in biologic cooperation is the hypoxic cell cytotoxin, tirapazamine. Hypoxia is a known condition of radiation resistance; tirapazamine targets the hypoxic subpopulations of cells because it is most potent in anoxic conditions. Tirapazamine is discussed in more detail later in this chapter.
Temporal Modulation
The four Rs of classical radiobiology, reoxygenation, repair, redistribution, and repopulation,10 refer to factors that are particularly important for fractionated radiation therapy. For example, antiproliferative therapies could prevent accelerated repopulation between fractions that might not be detectable using single-fraction assays in vitro. Conversely, although the DNA damage repair blockade may enhance radiation sensitivity in a tumor, if DNA repair is also inhibited in normal tissue, outcomes may be worse in fractionated therapy.9 Depending on which factors are most prominent in normal and tumor cells, the therapeutic index can be shifted in either a beneficial or a detrimental direction. Therefore temporal modulation implies therapeutics that optimize the four Rs between fractionated radiation treatments9 (see Table 4-1).
Potential Biologic Mechanisms of Drug-Radiation Interactions
The many potential mechanisms by which a drug may affect radiation efficacy are summarized in Table 4-1. The classic definition of a radiosensitizer had an enhancement of DNA damage as the critical factor. However, with increased understanding of cancer cell biology, it is apparent that targets other than DNA damage can enhance radiation efficacy. Therefore a more broadly defined “radiation enhancer” can affect several potential mechanisms to increase the effect of radiation.
Cell Cycle Effects
The G2/M phase has been identified as the most radiation-sensitive phase of the cell cycle and the S phase as the most radiation-resistant phase.11,12 In addition, many cytotoxic chemotherapeutic agents are cell cycle specific. Therefore agents that can maintain cells in radiation-sensitive phases or eliminate those cells in radiation-resistant phases will cooperate with radiation for enhanced efficacy. Although this is clearly seen in preclinical settings, there is much less direct evidence for this phenomenon in clinical data. Nevertheless, taxanes, nucleoside analogs, and modified pyrimidines appear to work in this manner.13–16
Hypoxia and Tumor Microenvironment
Hypoxia is one of the most potent factors of radiation protection known. Radiation relies on the production of oxygen free radicals, and hypoxic tissue is two to three times less sensitive to radiation than nonhypoxic tissue.17 There are four general chemotherapeutic approaches to mitigate hypoxia and enhance radiation efficacy:
Cell Death Pathway Effects
All of the above potential mechanisms of drug-radiation interaction display their efficacy through the consequences of cytotoxicity. However, recently it has become clear that there are several ways in which cytotoxicity is manifest. The Nomenclature Committee on Cell Death (NCCD)’s 2005 classification system,25 based purely on morphologic criteria, defined four modes of cell death: (type 1) apoptosis; (type 2) autophagy; (type 3) necrosis, or oncosis; and (type 4) mitotic catastrophe. Although these are distinct forms of cell death, the stimuli and processes involved are interrelated. There is also evidence that ionizing radiation can manifest its cytotoxicity by each type of cell death. As the understanding of the cell death pathways improves, novel therapeutics targeting each type could enhance radiation efficacy. The cell death mechanisms are briefly described below.
Apoptosis
Apoptosis is the most clearly defined and studied mechanism of cell death. This “programmed cell death” involves characteristic morphologic changes, including chromatin condensation (nuclear pyknosis) and nuclear fragmentation (karyorrhexis). Apoptotic bodies ultimately form, and the cell is removed through phagocytosis without generation of an inflammatory response. Apoptosis can occur with or without caspase activation26,27 and does not require DNA fragmentation,25 though this is a classic hallmark. Apoptosis is considered the major mechanism for chemotherapy-induced cell death. As a mechanism for radiation-induced cytotoxicity, apoptosis occurs readily in “liquid tumors” as opposed to most solid tumors, where apoptosis is a minor component of cell death. As such, drugs targeting the apoptosis pathway may enhance radiation cytotoxicity in solid tumors.
Autophagy
Whereas apoptosis is a clear self-destructive mechanism for a cell, the role of autophagy in cell death is more controversial. Autophagy, literally meaning “self-eating,” can provide a protective mechanism for a cell during times of stress (such as nutrient deprivation) because it allows recycling of cellular building blocks through controlled breakdown of cytoplasmic components. However, autophagic cell death does occur; it differs from apoptosis mainly because of the lack of chromatin condensation.25
Necrosis
Type 3 cell death, or necrosis, is a mechanism in which a cell swells (oncosis) until the plasma membrane ruptures and the cell contents are released, resulting in a local inflammatory response.25 The best example of this type of cell death is ischemic injury. Large, single-fraction radiation or radio-ablative doses can produce this type of cell death (e.g., stereotactic radiosurgery of brain lesions).
Analyzing Drug-Radiation Interactions
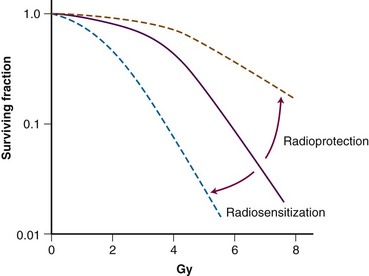
Several methodologies for determining the interaction between a drug and radiation have been detailed in the literature. Several definitions for possible interactions have also been described. The concept of radiosensitization originated many years ago, and classic radiosensitization has been defined as an increased amount of radiation-induced cell death that results from exposure to a second agent, after correction for the cytotoxicity of the agent. Clonogenic survival assay, which measures all forms of cell death as well as prolonged or irreversible cell cycle arrest, is the most encompassing method of measuring radiation cytotoxicity in vitro (Figure 4-3). Survival curves are generated by plating known quantities of cells, treating them with various doses of radiation and/or drug, and plotting the surviving fraction of colonies formed in a semilogarithmic fashion. Normalization is performed by dividing the surviving fraction for treated groups by the plating efficiency, which is defined as the surviving fraction of the untreated cells. Modification in radiosensitization, therefore, is demonstrated in clonogenic survival curve data in which a downward or leftward shift of the normalized surviving fraction implies a radiosensitizing interaction and an upward or rightward shift implies a radioprotective interaction. Although survival curves can show interaction between chemotherapy and irradiation, a better description of radiation modulation is necessary because neither chemotherapy nor radiation cytotoxicity typically follows a linear relationship.
One of the early attempts at providing a more descriptive system was by Tyrell.28 His system may be a better starting point for describing various interactions among therapies:
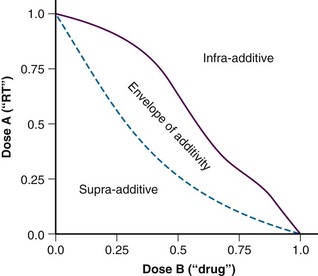
These terms seem to have been supplanted by the “additivity” descriptors, including supra-additive, additive, and infra-additive. Once again, the classic paper by Steel and Peckham7 describes the construction of an “envelope of additivity” for evaluating the interaction of two treatments using isobologram analysis. This envelope of additivity is constructed from cytotoxicity data by calculating a mode 1 curve that assumes that both agents have completely independent mechanisms of action as well as a mode 2 curve that assumes that the two agents have exactly the same mechanism of action (see Expert Consult website for isobologram construction detail).  When combination therapy data points are plotted on the isobologram, they may fall between mode 1 and mode 2 (additive interaction; within the envelope), above mode 1 (infra-additive interaction), or below mode 2 (supra-additive, or synergistic, interaction). An idealized isobologram is shown in Figure 4-4, and a step-by-step method for constructing an isobologram is included on the Expert Consult website.
The following is a step-by-step procedure for calculating isobolograms using Steel and Peckham’s method7,29 (see Fig. 4-WO1).
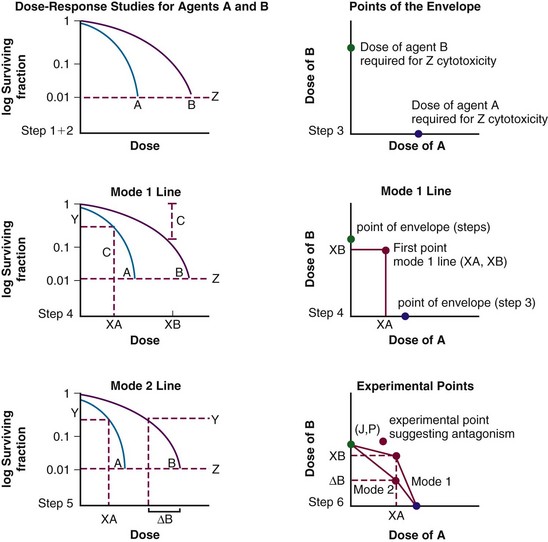
Step 1. The investigator must choose to make the assessments at one level of cytotoxicity (e.g., construct an isobologram that represents the interaction of the agents for a cumulative cytotoxicity of 50%, 10%, or 1%). The example in Figure 4-3 depicts the chosen level of cytotoxicity as horizontal line Z: 1% cytotoxicity (0.01 surviving fraction) in this case.
Step 2. Plots are made of dose-response data for both agents. In Figure 4-WO1, the dose-response data for the two agents are represented by curves A and B.
Step 3. The extreme points of the envelope of additivity are determined. Initially, a separate cartesian graph is created. The y-axis represents the dose of agent B and the x-axis the dose of agent A. The first extreme point of the envelope is placed on the y-axis at the dose of agent B alone that causes a specific level of cytotoxicity, as determined by the dose-response curve of agent B, at the intersection of line Z (Fig. 4-WO1). The second extreme point of the envelope is placed on the x-axis, at the dose of agent A alone that results in the level of cytotoxicity at the intersection of the dose-response curve with line Z (Fig. 4-WO1).
Median Dose-Effect Principle
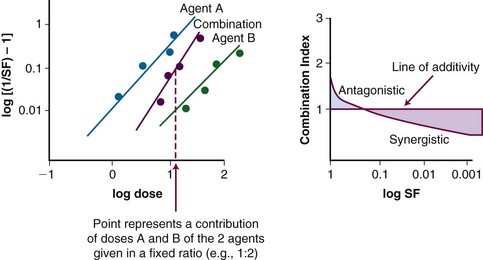
A mathematical modeling system that has gained fairly widespread use for interactions of cytotoxic agents is the median effect principle of Chou and Talalay.29,30,31 This system was derived from Michaelis-Menten equations and basic mass-action law considerations and has been useful for describing competitive enzyme interactions and interactions of cytotoxic agents. The primary relationship of the median effect principle is described by the following equation: fa/fu = (D/Dm)m, in which D is dose, fa is the fraction affected, fu is the fraction unaffected, Dm is the dose required to produce the median effect (50%), and m is a Hill-type coefficient used to describe the sigmoid nature of the curve. For first-order Michaelis-Menten kinetics, m = 1.

The general equation is y = mx + b.
A plot of log[(1/SF) – 1] on the y-axis and log(D) on the x-axis results in a line with a slope of m and a y-intercept of mlog(Dm). The survival curves for the individual agents and for the combination treatment (the individual agents given together in some fashion) can be fitted to the equation for a line by linear regression. If the interaction of two agents is assessed, three lines (i.e., median effect plots) are produced: one for each agent and one for the combination treatment. A graph of the median effect plots for mock individual agents A and B and for the combination of A and B is shown in Figure 4-5. For the combination treatment, D is the sum of the doses of the two agents given concomitantly; it is helpful to perform the experiments with the two agents given together in a fixed ratio of doses (e.g., 1 : 2). By using various total doses (i.e., the sum), with the agents given in the same ratio, it is possible to determine the contribution of the individual agents to the combination treatment in a later calculation.
This concept can be visualized in Figure 4-5. For instance, in the case of log[(1/SF) – 1] = 0, where SF is surviving fraction, the corresponding log(D), D indicating the sum of the doses of the two agents, can be calculated from the median effect plot for the combination treatment. An example of an actual combination treatment that has been assessed in this manner is radiation followed by a 24-hour exposure to etoposide.29 In this example, a set of experiments was performed with the dose ratio fixed as 32 Gy to 1 µg/mL of etoposide. In this example, the dose D that resulted in log[(1/SF) – 1] equaling a given value was a combination of radiation and etoposide given in the ratio of 32 : 1. The radiation and etoposide components could be discerned, from the median effect plot of the combination treatment, by dividing the resulting dose into the appropriate components based on the ratio of delivery of the two agents.
Definitions used in the median effect principle include the following:
For a mutually nonexclusive interaction,

in which
CI represents the doses of the agents required for a given effect when they are given together, divided by the doses required when the agents are given alone; in this way, CI less than 1 represents a synergistic interaction. A diagram of a CI plot for various levels of surviving fraction is shown in Figure 4-5.
Chemotherapy and Radiation Therapy and Combinations of Cytotoxic Agents
General Concepts
From the Bench to the Clinic
Occasionally, the process of quantifying interactions of chemotherapy and irradiation has frustrated clinicians attempting to interpret in vitro and in vivo laboratory information, as exemplified by Charles Moertel (quoted by Tannock32) in his keynote speech at the first International Conference on Combined-Modality Therapy in 1978:
This was not meant as disrespect for the radiobiology community but to point out that, at that time, the laboratory models were potentially quite different from the clinical setting. Because it has been difficult to extrapolate from laboratory results to clinical results, many clinicians have used combination treatments on a trial-and-error basis. However, the reverse order of study has occasionally been fruitful, and efficacious combinations of treatments demonstrated in clinical studies have inspired laboratory investigations that revealed interesting molecular bases of interaction.29,30 Translational research ideally occurs with a concept that arises from laboratory findings and subsequently is shown to have clinical efficacy. However, preclinical model systems have not always allowed investigators to take findings from the laboratory to the clinic, as indicated by the quotation of Moertel and by many of the early hypoxic cell sensitizer studies.
Therapeutic Benefits
Tannock32 mentioned another problem with translating findings from the laboratory to the clinical setting, emphasizing that investigators must not merely explore combinations of therapeutic agents to find synergistic interactions but must also find interactions that will produce a therapeutic benefit (e.g., provide greater cytotoxicity in tumor cells than in normal cells). To categorize potentially exploitable differences, Tannock32 described three main categories of biologic diversity between tumor cells and normal cells: tumor cells may display genetic instability compared with normal tissues; tumor cells and normal cells may be different with respect to cellular proliferation or proliferation that occurs after treatment; and environmental factors such as oxygenation and pH may affect tumor cells and normal cells differently. As findings are translated from the laboratory to the clinical setting, it is important to consider the effects of the host mechanisms on these three areas.
Chemotherapeutic Classes
In this section, several classes of systemic agents will be presented, followed by a brief review of clinical data describing combination treatment of these agents with radiation. There are a host of chemotherapeutic classes that are used in patients that will undergo radiation treatment. Although not all of these agents are used concurrently with radiation, it is helpful to understand their predominant mechanisms of action. Below is a brief description of several of the major classes of chemotherapeutics with some information regarding possible means of interaction with radiation. In addition, Figure 4-6 summarizes the cell cycle phase specificity of these agents.
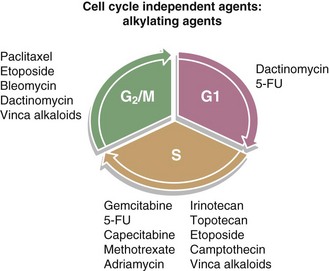
Figure 4-6 Diagram of the cell cycle with the cell cycle phase dependence of various chemotherapeutics.
Antimetabolites
The origin of antimetabolite chemotherapy dates back to the 1940s, when aminopterin was used to treat pediatric leukemia.33 Since then, a large number of antimetabolite chemotherapeutics have been developed with tremendous success. The targets for these drugs include folate metabolism and nucleoside analogs. The major antimetabolites are presented below.
Fluoropyrimidines: Fluorouracil, Fluorodeoxyuridine, Capecitabine
The fluoropyrimidines, as the name implies, are halogenated pyrimidines that function as antifolates by inhibiting thymidylate synthesis. As mentioned previously in historical perspectives, 5-FU is one of the most established drugs used in combination with radiation. It has been used in both a bolus infusion as well as a continuous venous infusion when combined with radiation and appears to target the radioresistant cells in S phase.16 The two delivery methods have some differences in terms of side effect profile, but both seem to have good efficacy. In a phase III rectal cancer postoperative adjuvant chemoradiation trial, concurrent continuous infusion of 5-FU during external beam radiation therapy (EBRT) was more effective than the bolus delivery.34 Moreover, data show that 5-FU plasma levels and intracellular metabolite levels are rather short-lived,35 also suggesting a need for continuous administration of the drug for it to be effective with radiation. Because of this, oral formulations have been developed, most notably capecitabine, a fluoropyrimidine carbamate prodrug of 5-FU, which must be converted through the action of thymidine phosphorylase. In addition to the improved patient comfort of taking an oral medication rather than having an infusion pump, another potential advantage of capecitabine in combination with radiation is that it appears that radiation increases thymidine phosphorylase levels in tumors, allowing potential bioaccumulation of active metabolite within irradiated tumor.36,37
Gemcitabine
Gemcitabine is an analog of deoxycytidine that specifically functions during the S phase by preventing dNTP production. There is both preclinical and clinical evidence demonstrating dramatic radiation-sensitizing properties to combined gemcitabine and radiation.38,39–41 In fact, a significant amount of toxicity has been demonstrated in clinical trials for pancreatic cancer,42 necessitating either a decreased dose of gemcitabine or limited field size for radiation treatment ports.
Antifolates: Methotrexate, Trimetrexate, Pemetrexed
The antifolate methotrexate tightly binds dihydrofolate reductase (DHFR), thereby inhibiting folate metabolism. Through this inhibition, thymidylate synthesis is blocked and, therefore, purine biosynthesis as well. In addition, some amino acid synthesis is impaired through blockade of this enzyme, resulting in cytotoxicity.43 Pemetrexed is a pyrrolopyrimidine that functions as an antifolate that inhibits multiple enzymes, including thymidylate synthase, dihydrofolate reductase, glycinamide ribonucleotide formyltransferase, and aminoimidazole carboxamide formyltransferase in a cell cycle–independent manner. Pemetrexed is effective against many solid tumors and has shown radiosensitizing properties in preclinical systems.44,45,46
Alkylating Agents
Nitrogen Mustard: Chlorambucil, Melphalan
Mustard gas was the first in a long series of alkylating agents that were developed for clinical use. During World War I, people and animals were exposed to mustard gas and were then followed clinically. The effects, particularly those on bone marrow, were noted.33,47 Later, nitrogen mustards were developed for lymphoma therapy as mechlorethamine (Mustargen), eventually used in the MOPP (Mustargen, vincristine [Oncovin], procarbazine, prednisone) regimen for Hodgkin’s lymphoma. The most commonly used nitrogen mustards are chlorambucil and melphalan (L-phenylalanine mustard); they are principally used for the treatment of chronic lymphocytic leukemia and multiple myeloma, respectively. Because of the bone marrow effect of these drugs, caution should be used when irradiating large volumes of bone marrow.
Mitomycin C
Mitomycin C is an antibiotic with alkylating characteristics derived from Streptomyces. This agent is an aziridine ring–containing compound that resembles nitrogen mustard. Mitomycin C blocks DNA synthesis but also causes cell cycle arrest during G2/M-phase transition.48,49 Mitomycin C has also been shown to function well as a hypoxic cell radiosensitizer,50 which may help to explain why mitomycin C–based chemoradiation is so effective in anal cancer treatment,51,52 as discussed later in the chapter.
Triazenes: Procarbazine, Dacarbazine, Temozolomide
Temozolomide has revolutionized the treatment of high-grade gliomas when it is used in combination with irradiation. It effectively crosses the blood-brain barrier (cerebrospinal fluid levels may be 30% of plasma levels).53 Temozolomide generates DNA damage through methylation of DNA at the O-6 position of guanine. Interestingly, O-6-methylguanine-DNA methyltransferase (MGMT) is a p53 DNA repair enzyme that, when its gene is methylated (i.e., epigenetically silenced), appears to predict for response to temozolomide-based chemoradiation because of the inability of the cancer cell to remove the O-6-methylguanine causing cytotoxicity.54 The DNA methylation from temozolomide triggers the mismatch repair pathway with a G2/M-phase arrest, yielding apoptosis and radiosensitive cells.55 Ongoing clinical trials are examining the importance of MGMT status and the combination of temozolomide with other agents.54
Nitrosoureas: BCNU (Carmustine), Methyl CCNU (Semustine), CCNU (Lomustine), Streptozocin
Several members of the nitrosourea group of alkylating agents are capable of crossing the blood-brain barrier and cross-linking DNA. BCNU (carmustine), has been used to treat brain tumors, predominantly gliomas, but has also been used for multiple myeloma and in high-dosage transplant regimens. Gliadel, a BCNU-impregnated wafer, can be placed in a glioma resection cavity, where it biodegrades slowly to release the chemotherapeutic agent. CCNU (lomustine) is a related compound with increased lipid solubility and is also used for brain tumors.56
Platinum Agents: Cisplatin, Carboplatin, Oxaliplatin, Satraplatin
Cisplatin (cis-diamminedichloroplatinum[II]) is the prototypical, most widely studied member of the platinum family. It has been used for decades as an anticancer treatment. Preclinical work in the late 1970s by Soloway and colleagues57 demonstrated radiosensitization in a murine model of transitional cell carcinoma. Since then, both clinical and preclinical data have indicated several mechanisms of interaction between cisplatin and radiation. Potential cooperation between the two modalities can occur at the level of DNA because radiation often causes repairable single-strand breaks in DNA, which can be converted to lethal double-strand breaks when they occur close to cisplatin-DNA adducts (intrastrand and interstrand cross-links). Cisplatin’s function as a free-electron scavenger may also impair the DNA repair mechanism and, therefore, the ability “fix” the radiation-induced DNA damage.58 In addition, radiation may enhance the uptake of cisplatin into the cell as well as help generate active platinum metabolites.1 The other family members—carboplatin, oxaliplatin, and the orally active agent satraplatin—appear to have similar mechanisms of action. Differences among the members may be the result of the three-dimensional structure of the DNA adducts that each platinum agent generates, which influences binding to various polymerases and DNA repair enzymes.59 For these reasons, the platinums function independently of the cell cycle phase.
Microtubule Targeting
Estramustine
Estramustine is an interesting hybrid molecule derived from both nitrogen mustard and 17β-estradiol. Estramustine effectively blocks microtubules by binding β-tubulin and microtubule-associated proteins, thus destabilizing the microtubules. This targets the mitotic spindle and leads to cell cycle arrest during M phase, causing radiosensitization.60 This drug has been approved for treating hormone-refractory prostate cancer for almost three decades.
Vinca Alkaloids: Vincristine, Vinblastine, Vinorelbine
The vinca alkaloids have been used as anticancer agents for well over 40 years and function by targeting microtubules. They force depolymerization of microtubules and, therefore, disrupt the mitotic spindle, resulting in an M-phase blockade.61 These drugs have been used to treat a wide variety of malignancies, both in pediatric patients and adults. In terms of radiosensitization, vincristine, vinblastine, and vinorelbine have an impact on cell cycle effects and DNA damage repair.9,61
Taxanes: Paclitaxel, Docetaxel, Albumin-Bound Paclitaxel
Unlike the vinca alkaloids, the taxanes stabilize microtubules and promote further tubulin polymerization, which inhibits centrosome mechanics during mitosis. In terms of enhancing radiation effect, the taxanes appear to manipulate several of the factors listed in Table 4-1. First, the taxanes can block the metaphase-anaphase cell cycle checkpoint, which could allow for accumulation of cells in the radiosensitive G2/M phase.61,62 Furthermore, taxanes can cause tumor shrinkage,63,64 thereby decreasing interstitial pressure and allowing improved oxygenation.18 In addition, taxanes can manipulate signal transduction cascades involved in radiation response.65
Epothilones: Epothilone B, Aza-epothilone B (Ixabepilone)
The epothilones are considered next-generation microtubule-targeting agents with functions similar to that of taxanes but derived from Mycobacterium. They stabilize microtubules with high potency and halt mitosis in a manner similar to taxanes.61 These drugs were developed to be independent of the p-glycoprotein efflux–resistance mechanisms that target taxanes and vinca alkaloids.61,66 These drugs are likely to become a popular choice for concurrent chemoradiation regimens in the future.
Topoisomerase Inhibitors
Topoisomerases are critical enzymes in DNA replication of all cells because of their ability to unwind DNA. There are two major classes of topoisomerases in mammalian cells that are clinically relevant for oncology therapeutics: topoisomerase I and II. Topoisomerase I (TopI) is involved in DNA replication fork movement and unwinding supercoils during DNA transcription, whereas topoisomerase II (TopII) is important for untangling DNA during transcription and remodeling of chromatin.35,43 These classes are named based on how many DNA strand breaks are created during enzymatic action; that is, a single-strand break for TopI and a double-strand break for TopII.43 These breaks are required for TopI and TopII to unwind and disentangle DNA but are temporary, because the enzyme will reconnect the broken strands (re-ligation). TopI/II inhibitors cause cytotoxicity by disrupting the process and generating DNA double-strand breaks.
Topoisomerase I Inhibitors
Camptothecins Irinotecan, Topotecan
Camptothecin is a naturally occurring alkaloid derived from the plant Camptotheca acuminata that was identified in an anticancer drug discovery screen in the 1960s.67 Camptothecin forms a stable ternary complex, preventing normal DNA re-ligation, and causes the complex to collide with the replication fork, leading to a DNA double-strand break and cytotoxicity.68 The S-phase specificity of this drug class provides some of the rationale for radiosensitization. The drug was unsuccessful in the clinic because it caused severe urinary complications, though camptothecin is still used as a research tool and for positive control for cytotoxicity and apoptosis. However, derivatives of camptothecin, notably irinotecan and topotecan, are used as chemotherapeutic agents. Irinotecan is approved by the Food and Drug Administration (FDA) to treat colorectal cancer, but data related to concomitant administration with radiation have also been generated in both small cell69–71 and non–small cell lung cancer patients.72,73 Topotecan is approved for ovarian, small cell, and cervical cancer. It has been combined with radiation to treat glioblastoma in clinical trials.74,75
Topoisomerase II Inhibitors
Podophyllotoxins: Etoposide, Etoposide Phosphate, Teniposide
The plant extract podophyllotoxin has microtubule-binding activity. The clinically used derivatives do not function through microtubule action but actually are TopII poisons.76 These epipodophyllotoxins, most notably etoposide and teniposide, are glycoside derivatives used to treat both childhood and adult tumors.35 In addition, these drugs have been used with radiation in both sequential and concomitant regimens.77–79,80
Anthracyclines: Idarubicin, Doxorubicin, Epirubicin, Daunorubicin
Anthracyclines are naturally occurring substances that intercalate into the DNA when they target TopII, leading to DNA double-strand breaks.35,81 These drugs have a wide range of clinical indications, including both liquid and solid tumors. In terms of radiation sensitization, the interaction of doxorubicin and radiation is well known, so concurrent administration is generally avoided. In fact, when doxorubicin is given after radiation, an inflammatory reaction known as radiation recall can occur.82,83
Other Agents: Mitoxantrone, Dactinomycin
Mitoxantrone is an anthracenedione designed to function like an anthracycline, but it has less cardiotoxicity84 because it is less likely to form free radicals35 and it may affect calcium release differently.85 Like anthracyclines, mitoxantrone can intercalate in DNA and poison TopII to form DNA double-strand breaks. This drug is approved to treat hormone-refractory prostate cancer. Dactinomycin is a Streptomyces-derived antibiotic that can intercalate in DNA, block TopII, and cause DNA double-strand breaks.35 Dactinomycin is used in pediatric sarcoma therapeutic regimens, including treatment of rhabdomyosarcoma.
Chemoradiation for Specific Types of Cancer
Gastrointestinal Cancers
Anal Cancer
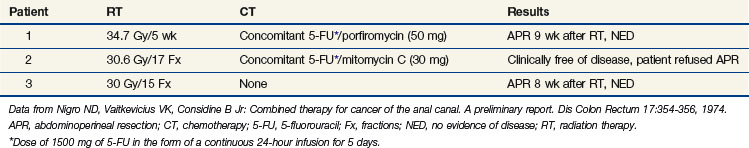
A classic example of the evolution of an efficacious interaction of chemotherapy and radiotherapy is combined-modality treatment for anal cancer. In the early 1970s, researchers discovered that anal cancer could be treated successfully with a combination of 5-fluorouracil (5-FU), mitomycin C, and irradiation.52 In 1974, Nigro and others52 reported on three patients who received variations of these three treatments, with excellent responses to the preoperative therapy (Table 4-2). This article became a classic in the oncology literature, and the regimen became prominent in the treatment of anal cancer. Because of this regimen, many patients were spared abdominal perineal resection.
After the initial report of Nigro and colleagues,52 several other groups confirmed the efficacy of chemotherapy and irradiation (without surgery) as the standard treatment for primary anal cancer52,86,87,88 (Table 4-3). Subsequently, an intergroup effort was undertaken by the Radiation Therapy Oncology Group (RTOG) and Eastern Cooperative Oncology Group (ECOG) to determine whether mitomycin C could be removed from the regimen, because its inclusion resulted in increased toxicity compared with that of 5-FU and radiation without mitomycin C. With 5-FU alone, however, fewer patients were able to avoid colostomy (Table 4-3).
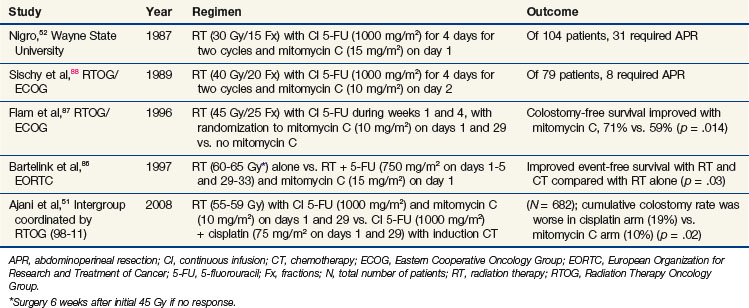
Additional attempts at replacing mitomycin C with less toxic concurrent chemotherapy agents have been undertaken, most notably in the United States. The GI Intergroup study (Table 4-3), coordinated by the RTOG (RTOG 98-11), compared an induction chemotherapy regimen (5-FU and cisplatin) followed by the same chemotherapy concurrently with radiation versus the standard regimen of concurrent chemotherapy (5-FU and mitomycin C) with radiation. The hypothesis was that the induction chemotherapy would decrease the tumor bulk, making radiotherapy more effective and improving local control, and that the additional cycles of induction chemotherapy might improve overall survival rates by decreasing distant metastases. However, these hypotheses were disproven because the cisplatin arm not only failed to show a benefit in terms of local control, disease-free survival rates, and overall survival rates but was clearly inferior to mitomycin C in terms of colostomy-free survival rates.51 Therefore the combination of 5-FU, mitomycin C, and irradiation remains the standard regimen for anal cancer. A subsequent phase II RTOG chemoradiation trial for anal cancer found that intensity-modulated radiation therapy (IMRT) techniques can reduce the toxicity of the standard of care by limiting normal tissue toxicity.

Laboratory Investigations in Anal Cancer
The clinical finding of the efficacious combination of 5-FU, mitomycin C, and radiation led to laboratory studies. Dobrowsky and associates89 performed a complex isobologram analysis using the same agents reported by Nigro and colleagues.52 The assessment by Dobrowsky and co-workers,89 using an in vitro system of a squamous tumor cell line, illustrated some of the difficulties with the ideal progression of taking laboratory discoveries to the clinic. Two different endpoints were used: colony formation (cells plated after treatment and allowed to form colonies) and viable cells per flask (obtained by multiplying the cell number per flask at 96 hours by the surviving fraction, as stipulated by a standard colony formation assay). In an attempt to duplicate the clinical treatment of Nigro and colleagues,52 mitomycin C was given as a 1-hour exposure and 5-FU as a 4-day exposure after initial radiation.
On the basis of the experiments without irradiation, specific concentrations of mitomycin C (0.5 µg/mL) and 5-FU (0.15 µg/mL) were selected for subsequent experiments involving radiation;89 these concentrations resulted in 60% and 80% surviving fractions, respectively. With colony formation as the endpoint, it was discovered that the interaction of irradiation and 5-FU or irradiation and mitomycin C (at the levels of cytotoxicity assessed) produced experimental points below the envelope of additivity. These results corroborated those reported previously by Byfield and colleagues,90 in which some level of 5-FU cytotoxicity was required for a positive interaction with irradiation. However, the results of irradiation in conjunction with mitomycin C were not entirely consistent with those of previous reports, which had suggested that a positive interaction of these agents did not exist.91
The previous example illustrates several important points. If the protocol of Nigro and associates52 had been designed on the basis of laboratory studies (if all of the just-mentioned studies had existed in 1974), it would have been difficult to assess where to begin. First, the investigator would need to decide which in vitro endpoint would be most relevant to anal cancer (viable cells per flask or colony formation), and this decision would affect whether one believed that 5-FU and mitomycin C interacted synergistically. Second, the investigator would need to decide which assessment of mitomycin C and radiation was most relevant to the treatment of anal cancer, because authors disagreed about whether this interaction was synergistic. This example also illustrates the challenges that are faced when interpretations of in vitro or in vivo experimental data are used to guide the design of clinical trials. These challenges can be exciting as we learn more about the significance of various endpoints at the molecular level and how these molecular events may be manipulated in a particular tumor.
Esophageal Cancer
Esophageal cancer remains a very challenging cancer to treat, primarily because of the locally advanced stage that is typically found at diagnosis. For nonsurgical approaches to treatment, radiation alone has been shown to be quite limited in terms of controlling the disease. Indeed, chemoradiation has been clearly shown to be the treatment of choice following several landmark trials comparing chemoradiation with radiation alone. The Intergroup trial coordinated by RTOG (85-01), originally published by Herskovic and colleagues92 and later updated by Cooper and associates,93 randomized patients to either 64 Gy radiation alone at 2 Gy/fraction or 50 Gy at 2 Gy/fraction concurrent with 5-FU (1000 mg/m2/day for days 1 to 4) and cisplatin (75 mg/m2 on day 1). In the concurrent arm, the chemotherapy was given every 28 days during radiation (weeks 1 to 5 of EBRT) and every 21 days thereafter for two additional cycles. This trial established that radiation alone was inferior to combined-modality chemoradiation (5-year overall survival [OS] was 0% vs. 26%; p = .0001).93 A meta-analysis by Wong and associates94 confirmed that concurrent chemoradiation was beneficial in terms of survival, with a hazard ratio (HR) of 0.73, 95% confidence interval of 0.64 to 0.84, p <.0001. Sequential chemotherapy and radiation did not show a statistically significant benefit, however.94
Recently, Tepper and colleagues95 published the results of the U.S. GI Intergroup study (CALGB 9781) that randomized patients to neoadjuvant cisplatin/5-FU/EBRT (50.4 Gy) before esophagectomy versus esophagectomy alone. Although the trial was closed early because of poor accrual, the 56 patients enrolled were analyzed on an intent-to-treat analysis. This revealed a significant difference in median and 5-year overall survival (OS) with trimodality treatment versus surgery alone (median: 54 mo vs. 21.6 mo; 5-yr OS: 39% vs. 16%, p = .002).95 In the future, more trials will combine molecularly targeted agents with standard chemotherapies concurrently with radiation.96
Gastric Cancer
The U.S. GI Intergroup 0116 phase III trial, reported by Macdonald and colleagues,97 compared adjuvant postoperative chemoradiation with surgery alone for patients with resected high-risk gastric or gastroesophageal cancers. Bolus 5-FU/leucovorin was given before EBRT (one 5-day cycle), concurrently with EBRT (two cycles: 4-day for week 1, 3-day for week 5), and after EBRT (two additional 5-day cycles). A survival advantage of concurrent chemoradiation was shown (3-year OS, 50% vs. 41%, p = .005; 3-year relapse-free survival, 48% vs. 31%, p = .001),97 and this treatment became the standard of care for gastric cancer in the United States. In the United Kingdom, the MAGIC trial established a nonirradiation regimen that involves perioperative (neoadjuvant and adjuvant) epirubicin, cisplatin, and 5-FU (ECF) chemotherapy as an appropriate standard of care for resectable gastric cancer.98 The recently completed postoperative adjuvant U.S. GI Intergroup phase III trial essentially “married” the INT-0116 trial and the MAGIC trial by investigating the role of chemoradiation in the setting of more modern ECF chemotherapy as the experimental arm versus the control arm of GI INT 0116, and results are awaited.
Rectal Cancer
Although resectable rectal cancer is a surgically managed disease, the addition of adjuvant preoperative or postoperative chemoradiation for high-risk patients is well recognized as a vital component of therapy. Four randomized trials99,100–102 investigating the addition of chemotherapy to neoadjuvant EBRT in stage II and III rectal cancer are summarized in Table 4-4 (the Bujko trial did not use the same dose/duration of EBRT, so it is not a true comparison of EBRT alone and EBRT with concurrent chemotherapy). Furthermore, a recently published meta-analysis analyzed these four trials.103 Although this analysis showed an improved complete pathologic response rate and local control with the addition of chemotherapy to preoperative radiation, no benefit was found in terms of sphincter preservation, disease-free survival rates, or overall survival rates. Of note, when preoperative chemoradiation was given, grades 3 and 4 toxicity were increased over that of preoperative EBRT given alone.
TABLE 4-4 Randomized Trials of Neoadjuvant Concomitant Radiation Therapy and Chemotherapy for Rectal Cancer
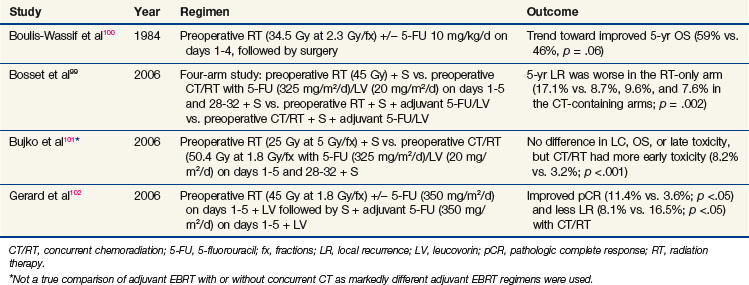
The current standard-of-care approach, however, was defined in the phase III German Rectal Trial.104 Preoperative chemoradiation was shown to be superior to postoperative chemoradiation in terms of local control, sphincter preservation rates, and toxicity.
As in other disease sites, more recent trials are investigating the addition of molecularly targeted agents to the standard preoperative chemoradiation regimen. The antivascular endothelial growth factor antibody bevacizumab has shown promising results in a recently published phase I/II trial in which all 32 patients showed tumor regression following neoadjuvant therapy, with an actuarial 5-year disease-free survival rate of 75%.105
Head and Neck Cancers
Treatment of locally advanced head and neck tumors was traditionally managed with surgery and postoperative radiation. However, over the past two decades, an explosion of chemoradiation trials shifted management toward an organ preservation approach (summarized in Table 4-5). One of the most impressive results for a randomized trial in head and neck cancer was that of Intergroup 0099 (RTOG 8817), originally published by Al-Sarraf and colleagues in 1998.106 In this trial of nasopharyngeal cancer patients, radiation alone (70 Gy at 2 Gy/fx) versus radiation with concurrent cisplatin plus adjuvant cisplatin/5-FU demonstrated a dramatic 67% versus 37% 5-year overall survival (OS) advantage in favor of the chemoradiation arm. More than 90 randomized clinical trials have been performed examining chemoradiation in head and neck cancer. Several meta-analyses have been published showing an absolute survival benefit for chemoradiation. Indeed, the most recent update of the MACH-NC in 2009 analyzed over 17,000 patients in 93 randomized trials and showed an absolute overall survival benefit of 6.5% at 5 years.107 Although two large, randomized trials of neoadjuvant chemotherapy followed by radiation have shown a benefit in terms of laryngeal organ preservation,108,109 subsequent studies, including RTOG 9111110 and the MACH-NC,107 suggest that concurrent chemoradiation is more effective than sequential administration. Currently, one of the questions being asked in clinical trials is whether or not induction chemotherapy followed by concurrent chemoradiation will be superior to concurrent chemoradiation alone in locally advanced head and neck cancer.
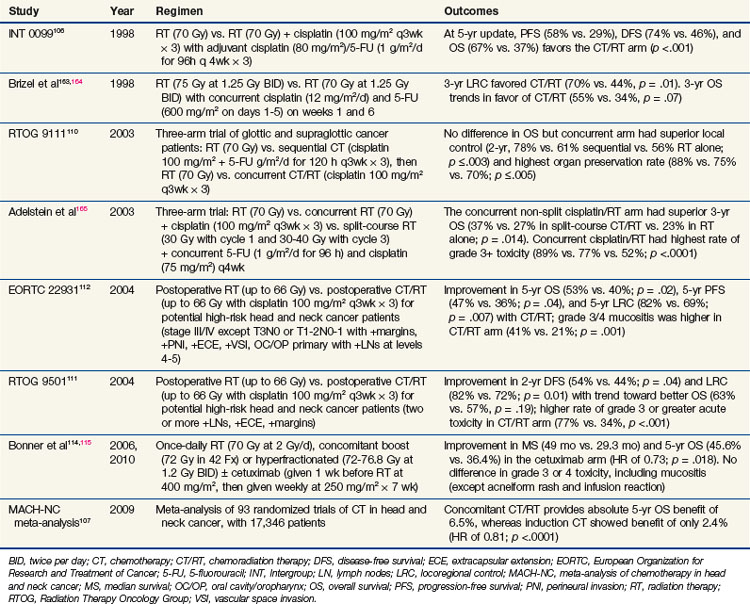
As mentioned above, the RTOG 9111 was a landmark Intergroup trial for patients with what would currently be staged as T2 and T3 glottic and supraglottic squamous cell carcinomas.110 This trial randomized patients to one of three arms: (1) neoadjuvant chemotherapy, (2) concurrent chemoradiation, and (3) radiation alone. Although overall survival was not different among the groups, the disease-free survival and locoregional control rates favored the concurrent chemoradiation arm.110 This benefit is not restricted to organ preservation studies. Two trials published in the same issue of the New England Journal of Medicine detailed the RTOG111 and EORTC112 trials randomizing patients to postoperative radiation with or without concurrent chemotherapy. Although the two trials had slight differences in their inclusion criteria, they both established the importance of adjuvant chemoradiation in the setting of high-risk postoperative patients. A pooled data analysis from the two trials identified positive margins and extracapsular extension as the two significant risk factors for combining chemotherapy with radiation in the adjuvant setting.113
In 2004, Bonner and associates114 published the results of a randomized phase III trial incorporating a molecularly targeted therapy with radiation in locally advanced head and neck cancer. This trial used cetuximab, a monoclonal chimeric (mouse and human) antibody to EGFR. This trial showed not only a local control benefit but also an overall survival benefit when cetuximab was combined with radiation, including altered fractionation schedules. In addition, the incidence of serious toxicity (other than rash and transfusion reactions) was similar between the groups; this finding is in stark contrast to chemoradiation regimens, which invariably have increased toxicity. These results have held up in the most recently published update,115 which shows a 49-month median survival rate in the cetuximab arm and a 29.3-month survival rate in the radiation-alone arm. Five-year overall survival rates were 45.6% in the cetuximab group and 36.4% in the radiation-alone group (hazard ratio of 0.73; p = .018).
Non–Small Cell Lung Carcinoma
The treatment of stage III NSCLC has evolved over the past two decades. For unresectable stage III patients, EBRT alone produced poor 2-year overall survival rates on the order of 20%. A modest improvement (up to 29%) was achieved with more intense radiation schedules such as the continuous hyperfractionated accelerated radiotherapy (CHART) regimen.116
To improve upon these outcomes, the approach most heavily tested was the addition of systemic agents to EBRT, which is summarized in Table 4-6. Three major trials of sequential chemotherapy followed by irradiation were published in the 1990s that showed improvement with the addition of platinum-based chemotherapy.117,118,119 Around the same time, a meta-analysis demonstrated a small but significant improvement with the addition of chemotherapy.120 However, because the various trials included many different sequences of chemotherapy and radiation, it was unclear what would be the best regimen. Therefore several randomized phase III trials compared sequential with concurrent chemoradiation.121,122,123,124 In all but one trial,124 the concurrent arm showed a significant improvement relative to sequential chemotherapy and irradiation. This established concurrent chemoradiation as the treatment of choice. What was not clear, however, was whether adjuvant chemotherapy could be added to concurrent chemoradiation regimens and, if so, whether it would be better to administer the chemotherapy neoadjuvantly or adjuvantly.
TABLE 4-6 Concomitant Radiation Therapy and Chemotherapy for Non–Small Cell Lung Cancer
| Study | Regimen | Outcome |
|---|---|---|
| Dillman et al117 (CALGB 8433 updated166) | Sequential cisplatin (100 mg/m2 on days 1 and 29) and vinblastine (5 mg/m2 weekly × 5) followed by RT (60 Gy) vs. RT alone (60 Gy) | Improved MS (13.7 mo vs. 9.6 mo; p = .012) with CT/RT |
| Sause et al118 (RTOG 8808 updated167) | Three-arm trial: sequential cisplatin (100 mg/m2 on days 1 and 29) and vinblastine (5 mg/m2 weekly × 5) followed by RT (60 Gy) vs. HyperFx RT (69.6 Gy at 1.2 Gy BID) vs. RT alone (60 Gy) | Improved MS (13.2 mo vs. 12 mo vs. 11.4 mo; p = .04) with CT/RT |
| Furuse et al122 | CT of cisplatin (80 mg/m2 on days 1 and 29), vindesine (3 mg/m2 on days 1, 8, 29, and 36), and mitomycin C (8 mg/m2 on days 1 and 29) given either concurrently with split-course RT (28 Gy × 2, 10 days apart) or sequentially with RT (56 Gy) | Improved MS (16.5 mo vs. 13.3 mo; p = .03998) with concurrent CT/RT |
| Curran et al121 (RTOG 9410) | Three-arm trial: cisplatin (100 mg/m2) and vinblastine (5 mg/m2) given before (arm 1) or concurrently with once-daily RT (arm 2, 60 Gy), or concurrent cisplatin (50 mg/m2) and oral etoposide (50 mg BID) with HyperFx RT (arm 3, 69.6 Gy at 1.2 Gy BID) | Improved MS (17 mo) in concurrent once-daily CT/RT arm (arm 2) vs. 15.6 mo (arm 3) vs. 14.6 mo (arm 1) (p = .038) |
| Albain et al126 (INT 0139) | Stage IIIA patients received two cycles of CT: cisplatin (50 mg/m2 on days 1, 8, 29, and 36) and etoposide (50 mg/m2 on days 1-5 and 29-33) plus 45 Gy. If no progression, they were randomized to surgery or 16-Gy boost. All patients received two adjuvant cycles of cisplatin/etoposide. | No difference in MS or 5-yr OS; improved median PFS in trimodality arm (12.8 mo vs. 10.5 mo; p = .017); in subset analysis, improved OS in patients who underwent lobectomy vs. CT/RT, but CT/RT was better if patient underwent pneumonectomy. |
| Thomas et al127 (GLCCG) | Patients received three cycles of cisplatin and etoposide and were randomized to CT/RT with concurrent carboplatin and vindesine followed by S or S followed by RT alone | Preoperative CT/RT resulted in increased pathologic response but no improvement in PFS. For patients requiring pneumonectomy, preoperative CT/RT had trend to increased Tx-related mortality (14% vs. 6%; p = .14). |
BID, twice daily; CALGB, Cancer and Leukemia Group B; CT, chemotherapy; CT/RT, chemoradiation therapy; GLCCG, German Lung Cancer Cooperative Group; HyperFx, hyperfractionation; INT, Intergroup; MS, median survival; OS, overall survival; PFS, progression-free survival; RT, radiation therapy; RTOG, Radiation Therapy Oncology Group; S, surgery; Tx, treatment.
A phase II trial called the LAMP (Locally Advanced Multimodality Protocol) trial attempted to determine what would be the best approach.125 The three arms in this trial included (1) neoadjuvant chemotherapy followed by irradiation, (2) neoadjuvant chemotherapy followed by concurrent chemoradiation, and (3) concurrent chemoradiation followed by adjuvant chemotherapy. Although the concurrent chemoradiation followed by adjuvant chemotherapy arm had the best outcome, the trial had some limitations, including insufficient power to determine the best regimen.125
Although concurrent chemoradiation is the standard approach for stage III NSCLC, there are certain instances in which surgery can be combined with chemoradiation in a trimodality approach. Two major randomized trials have been published regarding this trimodality approach; they are also included in Table 4-6 (U.S. Lung Intergroup 0139126 and the German Lung Cancer Cooperative Group127 trials). Both trials appeared to show that trimodality therapy was feasible but that preoperative chemoradiation should be avoided if pneumonectomy would be performed because excessive treatment-related deaths occurred following pneumonectomy.
Cervical Cancer
One of the clearest clinical examples demonstrating improved outcomes of combined chemoradiation is in locally advanced cervical cancer. Cisplatin-based chemoradiation regimens have had clear success in a series of randomized phase III trials showing not only improvement in locoregional control but also in overall survival rates. This series of clinical trials (summarized in Table 4-7) had differing inclusion criteria and various treatment approaches, yet these trials presented convincing evidence that cisplatin, when combined with irradiation, improves outcome in locally advanced cervical cancer. An excellent review of the historical context and remaining controversies regarding these trials is available,128 so they will be discussed only briefly here.
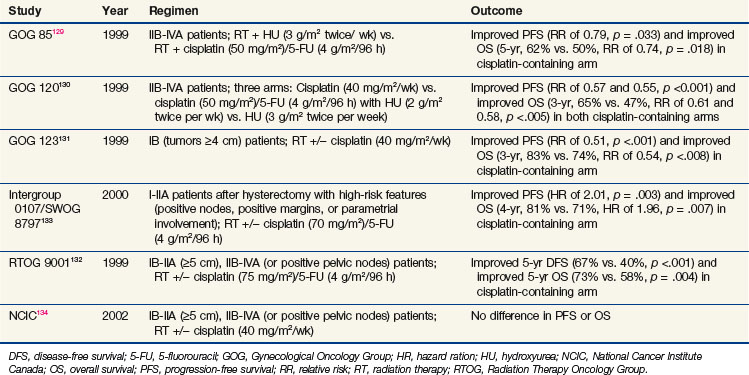
The Gynecological Oncology Group (GOG) had three positive trials for chemoradiation as a component of treatment. The GOG 85 trial investigated two different concurrent chemotherapy regimens (hydroxyurea vs. cisplatin/5-FU) with irradiation for patients with locally advanced cervical cancer.129 This trial demonstrated that concurrent cisplatin/5-FU was superior to hydroxyurea (5-year OS, 62% vs. 50%, p = .018). GOG 120 was a three-arm trial that compared radiation plus hydroxyurea with radiation plus two different concurrent cisplatin-containing regimens (one with cisplatin alone and the other with cisplatin plus 5-FU and hydroxyurea).130 The two cisplatin-containing arms were superior to the control arm (3-year OS for both cisplatin-based arms of 65% vs. 47%, p <.005). Because cisplatin alone was less toxic than the 5-FU/hydroxyurea combination, the concurrent cisplatin/irradiation approach was preferred. The GOG also investigated the importance of chemotherapy with irradiation for bulky stage IB patients treated with hysterectomy in GOG 123. In this trial, the patients were randomized to radiation alone versus radiation plus weekly cisplatin before undergoing hysterectomy.131 Once again, the cisplatin-containing arm was superior (3-year OS, 83% vs. 74%; p = .008).
In the 1990s, the RTOG also examined the importance of cisplatin with radiation for patients with locally advanced cervical cancer. RTOG 9001 compared extended field radiation alone with pelvic radiation plus cisplatin and 5-FU.132 The chemoradiation arm was superior to the extended field irradiation (5-year OS, 73% vs. 58%; p = .004).
The fifth trial to support concurrent cisplatin/irradiation was the Intergroup 0107/SWOG 8797, which tested chemoradiation in the adjuvant setting for patients who underwent hysterectomy with high-risk features at the time of surgery, including positive pelvic nodes, positive margins, and parametrial involvement.133 Patients were randomly assigned to receive radiation alone or radiation with cisplatin/5-FU. The chemoradiation group was again superior (4-year OS, 81% vs. 71%; p = .007).
Only one major trial, from the National Cancer Institute of Canada (NCIC), failed to demonstrate an overall survival benefit for this approach.134 However, that trial has been criticized because of the small size and wide confidence intervals that may have prevented a difference from being detected.
Genitourinary Cancer
Chemoradiation is established as the standard bladder-preserving management strategy for muscle invasive bladder cancer. Shipley and associates135 published a single institution experience using a neoadjuvant chemoradiation approach similar to the larynx preservation trials discussed above in which a cisplatin-containing chemoradiation regimen is given (following a maximal TURBT, or transurethral resection of bladder tumor). An evaluation for tumor response is then performed, followed either by surgery (for anything less than a complete response) or by consolidative chemoradiation. With this approach, the 5-year overall survival rate is comparable to that of the surgical series at 54%. Bladder preservation rates without invasive local recurrence are around 50%.
Another genitourinary example involves the use of hormone ablation therapy plus EBRT for high-risk prostate cancer demonstrated to have benefits in local control, disease-free survival rates, biochemical disease-free survival rates, and, possibly, overall survival as opposed to EBRT alone, based on both the RTOG136–138 and EORTC139,140 trials. It has been postulated that androgen deprivation therapy used in concomitant radiation regimens not only provides a spatial cooperation interaction but also a biologic cooperation function.
Glioblastoma
The treatment of glioblastoma has dramatically changed in recent years based on the encouraging findings from the phase III trial from EORTC and NCIC. This trial, first published by Stupp and colleagues in 2005141 and recently updated with 5-year data,142 demonstrated a remarkable improvement in median survival (14.6 months vs. 12.1 months) and 5-year OS (9.8% vs. 1.9%; HR, 0.63; p <.0001) with the use of concurrent temozolomide and radiation with adjuvant temozolomide. Prognostic143,144,145 and possibly predictive146 information can be garnered from evaluating the MGMT methylation status, because patients whose tumors have MGMT epigenetic silencing as a result of hypermethylation do better. Currently, there are several trials evaluating temozolomide, including not only optimization of drug scheduling (dose-dense approaches) but also use of the drug in combination with other therapies.
Molecular Prediction
Genomics
The most actively studied component of molecular prediction uses genomic technology. Genomics refers to the genome-wide evaluation of individual gene expression. Pharmacogenomics refers to the study of genetic information to predict treatment response. There are many platforms for analyzing genetic information within a biologic specimen. One means is the evaluation of polymorphisms, which refers to a variation within a gene such that at least two alleles occur in 1% or more of the general population. When the variation occurs at a single nucleotide, this is termed a single-nucleotide polymorphism (SNP). Several groups have identified SNPs within DNA synthesis/DNA repair genes that could potentially serve as markers of response to radiation,147 chemotherapy,148 or chemoradiation.149 Advances in DNA microarray technology allow for genome-wide evaluation of SNPs and gene expression. The most widely used platform at present is the glass slide microarray, such as the GeneChip from Affymetrix (Santa Clara, California). These arrays enable the analysis of relative expression of more than 38,000 genes on a single chip. By identifying differences in gene expression between good and poor responders it may be possible to use that information to guide therapy. A significant amount of work has been done in predicting breast cancer response to chemotherapy in vivo.150 Similar studies for irradiation and chemoradiation response are under way.
Proteomics
Proteomics is becoming an established platform for biomarker discovery. The predominant approach involves mass spectrometry to identify levels of proteins based on peptide fragments generated from enzymatic digestion of all of the proteins within a biologic specimen, such as biopsy tissue, a tissue sample, blood, or urine. This approach has been used for prognostic purposes in NSCLC151 as well as for prediction of sensitivity to chemoradiation in cervical cancer patients.152 Miniaturization with nanofluidic assays153 and novel dynamic-proteomics154 approaches are providing more information and understanding regarding cellular response to drugs.
Kinomics
Although genomic and proteomic strategies are being used in translational components of several clinical trials with RTOG and other cooperative groups, these technologies have significant difficulty in detecting transient signaling events such as kinase activation. This is because kinases are predominantly regulated posttranslationally, that is, they are subject to phosphorylation events, conformational changes, subcellular translocation, binding partnerships, and so on. Kinomics, therefore, refers to the global detection of kinase-signaling events within a cell or tissue. There is a tremendous amount of preclinical data that demonstrates robust but transient activation of kinase-based resistance pathways downstream of ionizing radiation and chemotherapy.155–159 Arguably, the most prominent class of next-generation therapeutics for oncology are kinase-targeted agents. Soon there may be a large repertoire of kinase inhibitors available for therapy if the patients most likely to benefit from them can be identified. Kinomic analysis may help guide therapy by identifying the critical kinase activations that predict sensitivity to or resistance to particular drugs. Although this technology is still in its infancy, kinomics may one day provide a complementary clinical tool to the genomic and proteomic strategies that are making their way into oncology practice. Translational research examples include kinomic profiling of pediatric brain tumors,160 chondrosarcomas,161 preclinical xenograft treatment response prediction,162 and most recently, chemoradiation response prediction in locally advanced rectal cancer patients.163
2 Tannock IF. Treatment of cancer with radiation and drugs. J Clin Oncol. 1996;14:3156-3174.
7 Steel GG, Peckham MJ. Exploitable mechanisms in combined radiotherapy-chemotherapy. The concept of additivity. Int J Radiat Oncol Biol Phys. 1979;5:85-91.
9 Bentzen SM, Harari PM, Bernier J. Exploitable mechanisms for combining drugs with radiation. Concepts, achievements and future directions. Nat Clin Pract Oncol. 2007;4:172-180.
18 Milas L, Hunter N, Mason KA, et al. Tumor reoxygenation as a mechanism of taxol-induced enhancement of tumor radioresponse. Acta Oncol. 1995;34:409-412.
19 Batchelor TT, Sorensen AG, di Tomaso E, et al. AZD2171, a pan-VEGF receptor tyrosine kinase inhibitor, normalizes tumor vasculature and alleviates edema in glioblastoma patients. Cancer Cell. 2007;11:83-95.
23 Hentosh P. Induction and repair of DNA damage in gamma-irradiated human lymphoblasts. Irradiation in the presence and absence of misonidazole. Radiat Res. 1988;115:436-447.
25 Galluzzi L, Maiuri MC, Vitale I, et al. Cell death modalities. Classification and pathophysiological implications. Cell Death Differ. 2007;14:1237-1243.
28 Tyrrell R. Radiation synergism and antagonism. Photochemical and photobiological reviews. 1978;3:35-113.
31 Chou TC, Talalay P. Quantitative analysis of dose-effect relationships: The combined effects of multiple drugs or enzyme inhibitors. Adv Enzyme Regul. 1984;22:27-55.
33 DeVita VT, Chu E. A history of cancer chemotherapy. Cancer Res. 2008;68:8643-8653.
34 O’Connell MJ, Martenson JA, Wieand HS, et al. Improving adjuvant therapy for rectal cancer by combining protracted-infusion fluorouracil with radiation therapy after curative surgery. N Engl J Med. 1994;331:502-507.
36 Sawada N, Ishikawa T, Sekiguchi F, et al. X-ray irradiation induces thymidine phosphorylase and enhances the efficacy of capecitabine (Xeloda) in human cancer xenografts. Clin Cancer Res. 1999;5:2948-2953.
38 Chun PY, Feng FY, Scheurer AM, et al. Synergistic effects of gemcitabine and gefitinib in the treatment of head and neck carcinoma. Cancer Res. 2006;66:981-988.
42 McGinn CJ, Zalupski MM, Shureiqi I, et al. Phase I trial of radiation dose escalation with concurrent weekly full-dose gemcitabine in patients with advanced pancreatic cancer. J Clin Oncol. 2001;19:4202-4208.
45 Bischof M, Huber P, Stoffregen C, et al. Radiosensitization by pemetrexed of human colon carcinoma cells in different cell cycle phases. Int J Radiat Oncol Biol Phys. 2003;57:289-292.
51 Ajani JA, Winter KA, Gunderson LL, et al. Fluorouracil, mitomycin, and radiotherapy vs fluorouracil, cisplatin, and radiotherapy for carcinoma of the anal canal. A randomized controlled trial. JAMA. 2008;299:1914-1921.
52 Nigro ND, Vaitkevicius VK, Considine BJr. Combined therapy for cancer of the anal canal. A preliminary report. Dis Colon Rectum. 1974;17:354-356.
61 Perez EA. Microtubule inhibitors. differentiating tubulin-inhibiting agents based on mechanisms of action, clinical activity, and resistance. Mol Cancer Ther. 2009;8:2086-2095.
80 Turrisi AT3rd, Kim K, Blum R, et al. Twice-daily compared with once-daily thoracic radiotherapy in limited small-cell lung cancer treated concurrently with cisplatin and etoposide. N Engl J Med. 1999;340:265-271.
86 Bartelink H, Roelofsen F, Eschwege F, et al. Concomitant radiotherapy and chemotherapy is superior to radiotherapy alone in the treatment of locally advanced anal cancer. Results of a phase III randomized trial of the European Organization for Research and Treatment of Cancer Radiotherapy and Gastrointestinal Cooperative Groups. J Clin Oncol. 1997;15:2040-2049.
87 Flam M, John M, Pajak TF, et al. Role of mitomycin in combination with fluorouracil and radiotherapy, and of salvage chemoradiation in the definitive nonsurgical treatment of epidermoid carcinoma of the anal canal. Results of a phase III randomized intergroup study. J Clin Oncol. 1996;14:2527-2539.
92 Herskovic A, Martz K, al-Sarraf M, et al. Combined chemotherapy and radiotherapy compared with radiotherapy alone in patients with cancer of the esophagus. N Engl J Med. 1992;326:1593-1598.
93 Cooper JS, Guo MD, Herskovic A, et al. Chemoradiotherapy of locally advanced esophageal cancer. Long-term follow-up of a prospective randomized trial (RTOG 85-01). Radiation Therapy Oncology Group. JAMA. 1999;281:1623-1627.
95 Tepper J, Krasna MJ, Niedzwiecki D, et al. Phase III trial of trimodality therapy with cisplatin, fluorouracil, radiotherapy, and surgery compared with surgery alone for esophageal cancer. CALGB 9781. J Clin Oncol. 2008;26:1086-1092.
97 Macdonald JS, Smalley SR, Benedetti J, et al. Chemoradiotherapy after surgery compared with surgery alone for adenocarcinoma of the stomach or gastroesophageal junction. N Engl J Med. 2001;345:725-730.
98 Cunningham D, Allum WH, Stenning SP, et al. Perioperative chemotherapy versus surgery alone for resectable gastroesophageal cancer. N Engl J Med. 2006;355:11-20.
99 Bosset JF, Collette L, Calais G, et al. Chemotherapy with preoperative radiotherapy in rectal cancer. N Engl J Med. 2006;355:1114-1123.
104 Sauer R, Becker H, Hohenberger W, et al. Preoperative versus postoperative chemoradiotherapy for rectal cancer. N Engl J Med. 2004;351:1731-1740.
105 Willett CG, Duda DG, di Tomaso E, et al. Efficacy, safety, and biomarkers of neoadjuvant bevacizumab, radiation therapy, and fluorouracil in rectal cancer. A multidisciplinary phase II study. J Clin Oncol. 2009;27:3020-3026.
106 Al-Sarraf M, LeBlanc M, Giri PG, et al. Chemoradiotherapy versus radiotherapy in patients with advanced nasopharyngeal cancer. Phase III randomized Intergroup study 0099. J Clin Oncol. 1998;16:1310-1317.
107 Pignon JP, le Maitre A, Maillard E, et al. Meta-analysis of chemotherapy in head and neck cancer (MACH-NC). An update on 93 randomised trials and 17,346 patients. Radiother Oncol. 2009;92:4-14.
108 Induction chemotherapy plus radiation compared with surgery plus radiation in patients with advanced laryngeal cancer. The Department of Veterans Affairs Laryngeal Cancer Study Group. N Engl J Med. 1991;324:1685-1690.
110 Forastiere AA, Goepfert H, Maor M, et al. Concurrent chemotherapy and radiotherapy for organ preservation in advanced laryngeal cancer. N Engl J Med. 2003;349:2091-2098.
111 Cooper JS, Pajak TF, Forastiere AA, et al. Postoperative concurrent radiotherapy and chemotherapy for high-risk squamous-cell carcinoma of the head and neck. N Engl J Med. 2004;350:1937-1944.
112 Bernier J, Domenge C, Ozsahin M, et al. Postoperative irradiation with or without concomitant chemotherapy for locally advanced head and neck cancer. N Engl J Med. 2004;350:1945-1952.
114 Bonner JA, Harari PM, Giralt J, et al. Radiotherapy plus cetuximab for squamous-cell carcinoma of the head and neck. N Engl J Med. 2006;354:567-578.
117 Dillman RO, Seagren SL, Propert KJ, et al. A randomized trial of induction chemotherapy plus high-dose radiation versus radiation alone in stage III non-small-cell lung cancer. N Engl J Med. 1990;323:940-945.
121 Curran WJJr, Scott CB, Langer CJ, et al. Long-term benefit is observed in a phase III comparison of sequential v. concurrent chemo-radiation for patients with unresectable stage III NSCLC: RTOG 9410. Proc Am Soc Clin Oncol, 2003, 621. (Abst 2499)
122 Furuse K, Fukuoka M, Kawahara M, et al. Phase III study of concurrent versus sequential thoracic radiotherapy in combination with mitomycin, vindesine, and cisplatin in unresectable stage III non-small-cell lung cancer. J Clin Oncol. 1999;17:2692-2699.
126 Albain KS, Swann RS, Rusch VW, et al. Radiotherapy plus chemotherapy with or without surgical resection for stage III non-small-cell lung cancer. A phase III randomised controlled trial. Lancet. 2009;374:379-386.
130 Rose PG, Bundy BN, Watkins EB, et al. Concurrent cisplatin-based radiotherapy and chemotherapy for locally advanced cervical cancer. N Engl J Med. 1999;340:1144-1153.
131 Keys HM, Bundy BN, Stehman FB, et al. Cisplatin, radiation, and adjuvant hysterectomy compared with radiation and adjuvant hysterectomy for bulky stage IB cervical carcinoma. N Engl J Med. 1999;340:1154-1161.
132 Morris M, Eifel PJ, Lu J, et al. Pelvic radiation with concurrent chemotherapy compared with pelvic and para-aortic radiation for high-risk cervical cancer. N Engl J Med. 1999;340:1137-1143.
133 Peters WA3rd, Liu PY, Barrett RJ2nd, et al. Concurrent chemotherapy and pelvic radiation therapy compared with pelvic radiation therapy alone as adjuvant therapy after radical surgery in high-risk early-stage cancer of the cervix. J Clin Oncol. 2000;18:1606-1613.
135 Shipley WU, Zietman AL, Kaufman DS, et al. Selective bladder preservation by trimodality therapy for patients with muscularis propria-invasive bladder cancer and who are cystectomy candidates—the Massachusetts General Hospital and Radiation Therapy Oncology Group experiences. Semin Radiat Oncol. 2005;15:36-41.
139 Bolla M, Collette L, Blank L, et al. Long-term results with immediate androgen suppression and external irradiation in patients with locally advanced prostate cancer (an EORTC study). A phase III randomised trial. Lancet. 2002;360:103-106.
142 Stupp R, Hegi ME, Mason WP, et al. Effects of radiotherapy with concomitant and adjuvant temozolomide versus radiotherapy alone on survival in glioblastoma in a randomised phase III study. 5-year analysis of the EORTC-NCIC trial. Lancet Oncol. 2009;10:459-466.
145 Hegi ME, Diserens AC, Gorlia T, et al. MGMT gene silencing and benefit from temozolomide in glioblastoma. N Engl J Med. 2005;352:997-1003.
160 Sikkema AH, Diks SH, den Dunnen WF, et al. Kinome profiling in pediatric brain tumors as a new approach for target discovery. Cancer Res. 2009;69:5987-5995.
163 Folkvord S, Flatmark K, Dueland S, et al. Prediction of response to preoperative chemoradiotherapy in rectal cancer by multiplex kinase activity profiling. Int J Radiat Oncol Biol Phys. 2010;78(2):555-562.
1 Hennequin C, Favaudon V. Biological basis for chemo-radiotherapy interactions. Eur J Cancer. 2002;38:223-230.
2 Tannock IF. Treatment of cancer with radiation and drugs. J Clin Oncol. 1996;14:3156-3174.
3 D’Angio G. Historical perspective. In: John M, Flam M, Legha S, Phillips T, editors. Chemoradiation: An Integrated Approach to Cancer Treatment. Lea & Febiger: Philadelphia; 1993:36.
4 Heidelberger C, Chaudhuri NK, Danneberg P, et al. Fluorinated pyrimidines, a new class of tumour-inhibitory compounds. Nature. 1957;179:663-666.
5 Rich TA, Shepard RC, Mosley ST. Four decades of continuing innovation with fluorouracil. Current and future approaches to fluorouracil chemoradiation therapy. J Clin Oncol. 2004;22:2214-2232.
6 Rodrigues RS, Bozza FA, Christian PE, et al. Comparison of whole-body PET/CT, dedicated high-resolution head and neck PET/CT, and contrast-enhanced CT in preoperative staging of clinically M0 squamous cell carcinoma of the head and neck. J Nucl Med. 2009;50:1205-1213.
7 Steel GG, Peckham MJ. Exploitable mechanisms in combined radiotherapy-chemotherapy. The concept of additivity. Int J Radiat Oncol Biol Phys. 1979;5:85-91.
8 Kouvaris JR, Kouloulias VE, Vlahos LJ. Amifostine. The first selective-target and broad-spectrum radioprotector. Oncologist. 2007;12:738-747.
9 Bentzen SM, Harari PM, Bernier J. Exploitable mechanisms for combining drugs with radiation. Concepts, achievements and future directions. Nat Clin Pract Oncol. 2007;4:172-180.
10 Withers HR. Four R’s of radiotherapy. Adv Radiat Biol. 1975;5:241-247.
11 Terasima T, Tolmach LJ. Changes in x-ray sensitivity of HeLa cells during the division cycle. Nature. 1961;190:1210-1211.
12 Sinclair WK, Morton RA. X-ray sensitivity during the cell generation cycle of cultured Chinese hamster cells. Radiat Res. 1966;29:450-474.
13 Choy H, Rodriguez FF, Koester S, et al. Investigation of taxol as a potential radiation sensitizer. Cancer. 1993;71:3774-3778.
14 Tishler RB, Geard CR, Hall EJ, Schiff PB. Taxol sensitizes human astrocytoma cells to radiation. Cancer Res. 1992;52:3495-3497.
15 Tishler RB, Schiff PB, Geard CR, Hall EJ. Taxol. A novel radiation sensitizer. Int J Radiat Oncol Biol Phys. 1992;22:613-617.
16 McGinn CJ, Kinsella TJ. The experimental and clinical rationale for the use of S-phase-specific radiosensitizers to overcome tumor cell repopulation. Semin Oncol. 1992;19:21-28.
17 Olive PL. Detection of hypoxia by measurement of DNA damage in individual cells from spheroids and murine tumours exposed to bioreductive drugs. I. Tirapazamine. Br J Cancer. 1995;71:529-536.
18 Milas L, Hunter N, Mason KA, et al. Tumor reoxygenation as a mechanism of taxol-induced enhancement of tumor radioresponse. Acta Oncol. 1995;34:409-412.
19 Batchelor TT, Sorensen AG, di Tomaso E, et al. AZD2171, a pan-VEGF receptor tyrosine kinase inhibitor, normalizes tumor vasculature and alleviates edema in glioblastoma patients. Cancer Cell. 2007;11:83-95.
20 Jain RK. Normalization of tumor vasculature. An emerging concept in antiangiogenic therapy. Science. 2005;307:58-62.
21 Lin MI, Sessa WC. Antiangiogenic therapy. Creating a unique “window” of opportunity. Cancer Cell. 2004;6:529-531.
22 Maione F, Molla F, Meda C, et al. Semaphorin 3A is an endogenous angiogenesis inhibitor that blocks tumor growth and normalizes tumor vasculature in transgenic mouse models. J Clin Invest. 2009;119:3356-3372.
23 Hentosh P. Induction and repair of DNA damage in gamma-irradiated human lymphoblasts. Irradiation in the presence and absence of misonidazole. Radiat Res. 1988;115:436-447.
24 Dische S. Chemical sensitizers for hypoxic cells. A decade of experience in clinical radiotherapy. Radiother Oncol. 1985;3:97-115.
25 Galluzzi L, Maiuri MC, Vitale I, et al. Cell death modalities. Classification and pathophysiological implications. Cell Death Differ. 2007;14:1237-1243.
26 Constantinou C, Papas KA, Constantinou AI. Caspase-independent pathways of programmed cell death. The unraveling of new targets of cancer therapy? Curr Cancer Drug Targets. 2009;9:717-728.
27 Madeo F, Carmona-Gutierrez D, Ring J, et al. Caspase-dependent and caspase-independent cell death pathways in yeast. Biochem Biophys Res Commun. 2009;382:227-231.
28 Tyrrell R. Radiation synergism and antagonism. Photochemical and photobiological reviews. 1978;3:35-113.
29 Haddock MG, Ames MM, Bonner JA. Assessing the interaction of irradiation with etoposide or idarubicin. Mayo Clin Proc. 1995;70:1053-1060.
30 Bonner JA, Kozelsky TF. The significance of the sequence of administration of topotecan and etoposide. Cancer Chemother Pharmacol. 1996;39:109-112.
31 Chou TC, Talalay P. Quantitative analysis of dose-effect relationships.: The combined effects of multiple drugs or enzyme inhibitors. Adv Enzyme Regul. 1984;22:27-55.
32 Tannock IF. Potential for therapeutic gain from combined-modality treatment. Front Radiat Ther Oncol. 1992;26:1-15.
33 DeVita VT, Chu E. A history of cancer chemotherapy. Cancer Res. 2008;68:8643-8653.
34 O’Connell MJ, Martenson JA, Wieand HS, et al. Improving adjuvant therapy for rectal cancer by combining protracted-infusion fluorouracil with radiation therapy after curative surgery. N Engl J Med. 1994;331:502-507.
35 DeVita VT, Lawrence TS, Rosenberg SA, editors. DeVita, Hellman, and Rosenberg’s Cancer: Principles and Practice of Oncology, ed 8, Philadelphia: Wolters Kluwer/Lippincott Williams & Wilkins, 2008.
36 Sawada N, Ishikawa T, Sekiguchi F, et al. X-ray irradiation induces thymidine phosphorylase and enhances the efficacy of capecitabine (Xeloda) in human cancer xenografts. Clin Cancer Res. 1999;5:2948-2953.
37 Endo M, Shinbori N, Fukase Y, et al. Induction of thymidine phosphorylase expression and enhancement of efficacy of capecitabine or 5′-deoxy-5-fluorouridine by cyclophosphamide in mammary tumor models. Int J Cancer. 1999;83:127-134.
38 Chun PY, Feng FY, Scheurer AM, et al. Synergistic effects of gemcitabine and gefitinib in the treatment of head and neck carcinoma. Cancer Res. 2006;66:981-988.
39 Symon Z, Davis M, McGinn CJ, et al. Concurrent chemoradiotherapy with gemcitabine and cisplatin for pancreatic cancer. From the laboratory to the clinic. Int J Radiat Oncol Biol Phys. 2002;53:140-145.
40 Chen M, Hough AM, Lawrence TS. The role of p53 in gemcitabine-mediated cytotoxicity and radiosensitization. Cancer Chemother Pharmacol. 2000;45:369-374.
41 Lawrence TS, Eisbruch A, McGinn CJ, et al. Radiosensitization by gemcitabine. Oncology (Williston Park). 1999;13:55-60.
42 McGinn CJ, Zalupski MM, Shureiqi I, et al. Phase I trial of radiation dose escalation with concurrent weekly full-dose gemcitabine in patients with advanced pancreatic cancer. J Clin Oncol. 2001;19:4202-4208.
43 Wang JC. DNA topoisomerases. Annu Rev Biochem. 1996;65:635-692.
44 Teicher BA, Chen V, Shih C, et al. Treatment regimens including the multitargeted antifolate LY231514 in human tumor xenografts. Clin Cancer Res. 2000;6:1016-1023.
45 Bischof M, Huber P, Stoffregen C, et al. Radiosensitization by pemetrexed of human colon carcinoma cells in different cell cycle phases. Int J Radiat Oncol Biol Phys. 2003;57:289-292.
46 Bischof M, Weber KJ, Blatter J, et al. Interaction of pemetrexed disodium (ALIMTA, multitargeted antifolate) and irradiation in vitro. Int J Radiat Oncol Biol Phys. 2002;52:1381-1388.
47 Adair FE, Bagg HJ. Experimental and clinical studies on the treatment of cancer by dichlorethylsulphide (mustard gas). Ann Surg. 1931;93:190-199.
48 Heinrich MC, Hoatlin ME, Zigler AJ, et al. DNA cross-linker-induced G2/M arrest in group C Fanconi anemia lymphoblasts reflects normal checkpoint function. Blood. 1998;91:275-287.
49 Sugiyama K, Shimizu M, Akiyama T, et al. UCN-01 selectively enhances mitomycin C cytotoxicity in p53 defective cells which is mediated through S and/or G(2) checkpoint abrogation. Int J Cancer. 2000;85:703-709.
50 De Ridder M, Van Esch G, Engels B, et al. Hypoxic tumor cell radiosensitization: role of the iNOS/NO pathway. Bull Cancer. 2008;95:282-291.
51 Ajani JA, Winter KA, Gunderson LL, et al. Fluorouracil, mitomycin, and radiotherapy vs fluorouracil, cisplatin, and radiotherapy for carcinoma of the anal canal. A randomized controlled trial. JAMA. 2008;299:1914-1921.
52 Nigro ND, Vaitkevicius VK, Considine BJr. Combined therapy for cancer of the anal canal. A preliminary report. Dis Colon Rectum. 1974;17:354-356.
53 Patel M, McCully C, Godwin K, Balis FM. Plasma and cerebrospinal fluid pharmacokinetics of intravenous temozolomide in non-human primates. J Neurooncol. 2003;61:203-207.
54 Stupp R, Hegi ME, Gilbert MR, Chakravarti A. Chemoradiotherapy in malignant glioma. Standard of care and future directions. J Clin Oncol. 2007;25:4127-4136.
55 Palanichamy K, Chakravarti A. Combining drugs and radiotherapy: from the bench to the bedside. Curr Opin Neurol. 2009;22(6):625-632.
56 Amarasingh S, Macleod MR, Whittle IR. What is the translational efficacy of chemotherapeutic drug research in neuro-oncology? A systematic review and meta-analysis of the efficacy of BCNU and CCNU in animal models of glioma. J Neurooncol. 2009;91:117-125.
57 Soloway MS, Morris CR, Sudderth B. Radiation therapy and cis-diammine-dichloroplatinum (II) in transplantable and primary murine bladder cancer. Int J Radiat Oncol Biol Phys. 1979;5:1355-1360.
58 Amorino GP, Freeman ML, Carbone DP, et al. Radiopotentiation by the oral platinum agent, JM216. Role of repair inhibition. Int J Radiat Oncol Biol Phys. 1999;44:399-405.
59 Wilson GD, Bentzen SM, Harari PM. Biologic basis for combining drugs with radiation. Semin Radiat Oncol. 2006;16:2-9.
60 Ryu S, Gabel M, Khil MS, et al. Estramustine. A novel radiation enhancer in human carcinoma cells. Int J Radiat Oncol Biol Phys. 1994;30:99-104.
61 Perez EA. Microtubule inhibitors. differentiating tubulin-inhibiting agents based on mechanisms of action, clinical activity, and resistance. Mol Cancer Ther. 2009;8:2086-2095.
62 Schiff PB, Horwitz SB. Taxol stabilizes microtubules in mouse fibroblast cells. Proc Natl Acad Sci U S A. 1980;77:1561-1565.
63 Cmelak AJ, Li S, Goldwasser MA, et al. Phase II trial of chemoradiation for organ preservation in resectable stage III or IV squamous cell carcinomas of the larynx or oropharynx. Results of Eastern Cooperative Oncology Group Study E2399. J Clin Oncol. 2007;25:3971-3977.
64 Cmelak AJ, Murphy BA, Burkey B, et al. Taxane-based chemoirradiation for organ preservation with locally advanced head and neck cancer. Results of a phase II multi-institutional trial. Head Neck. 2007;29:315-324.
65 Ganansia-Leymarie V, Bischoff P, Bergerat JP, Holl V. Signal transduction pathways of taxanes-induced apoptosis. Curr Med Chem Anticancer Agents. 2003;3:291-306.
66 Fumoleau P, Coudert B, Isambert N, Ferrant E. Novel tubulin-targeting agents. Anticancer activity and pharmacologic profile of epothilones and related analogues. Ann Oncol. 2007;18(Suppl 5)):v9-15.
67 Wall ME, Wani MC. Camptothecin and taxol. Discovery to clinic—thirteenth Bruce F. Cain Memorial Award Lecture. Cancer Res. 1995;55:753-760.
68 Hsiang YH, Lihou MG, Liu LF. Arrest of replication forks by drug-stabilized topoisomerase I-DNA cleavable complexes as a mechanism of cell killing by camptothecin. Cancer Res. 1989;49:5077-5082.
69 Abdelwahab S, Abdulla H, Azmy A, et al. Integration of irinotecan and cisplatin with early concurrent conventional radiotherapy for limited-disease SCLC (LD-SCLC). Int J Clin Oncol. 2009;14:230-236.
70 de Jong WK, de Jonge MJ, van der Leest AH, et al. Irinotecan and cisplatin with concurrent thoracic radiotherapy in a once-every-three-weeks schedule in patients with limited-disease small-cell lung cancer. A phase I study. Lung Cancer. 2008;61:123-128.
71 Sohn JH, Moon YW, Lee CG, et al. Phase II trial of irinotecan and cisplatin with early concurrent radiotherapy in limited-disease small-cell lung cancer. Cancer. 2007;109:1845-1950.
72 Langer CJ, Somer R, Litwin S, et al. Phase I study of radical thoracic radiation, weekly irinotecan, and cisplatin in locally advanced non-small cell lung carcinoma. J Thorac Oncol. 2007;2:203-209.
73 Takeda K, Negoro S, Kudoh S, et al. Phase I/II study of weekly irinotecan and concurrent radiation therapy for locally advanced non-small cell lung cancer. Br J Cancer. 1999;79:1462-1467.
74 Grabenbauer GG, Gerber KD, Ganslandt O, et al. Effects of concurrent topotecan and radiation on 6-month progression-free survival in the primary treatment of glioblastoma multiforme. Int J Radiat Oncol Biol Phys. 2009;75:164-169.
75 Gross MW, Altscher R, Brandtner M, et al. Open-label simultaneous radio-chemotherapy of glioblastoma multiforme with topotecan in adults. Clin Neurol Neurosurg. 2005;107:207-213.
76 Ross W, Rowe T, Glisson B, et al. Role of topoisomerase II in mediating epipodophyllotoxin-induced DNA cleavage. Cancer Res. 1984;44:5857-5860.
77 Saynak M, Aksu G, Fayda M, et al. The results of concomitant and sequential chemoradiotherapy with cisplatin and etoposide in patients with locally advanced non-small cell lung cancer. J BUON. 2005;10:213-218.
78 Dasgupta A, Dasgupta C, Basu S, Majumdar A. A prospective and randomized study of radiotherapy, sequential chemotherapy radiotherapy and concomitant chemotherapy-radiotherapy in unresectable non small cell carcinoma of the lung. J Cancer Res Ther. 2006;2:47-51.
79 Beauchesne P, Soler C, Boniol M, Schmitt T. Response to a phase II study of concomitant-to-sequential use of etoposide and radiation therapy in newly diagnosed malignant gliomas. Am J Clin Oncol. 2003;26:e22-27.
80 Turrisi AT3rd, Kim K, Blum R, et al. Twice-daily compared with once-daily thoracic radiotherapy in limited small-cell lung cancer treated concurrently with cisplatin and etoposide. N Engl J Med. 1999;340:265-271.
81 Tewey KM, Rowe TC, Yang L, et al. Adriamycin-induced DNA damage mediated by mammalian DNA topoisomerase II. Science. 1984;226:466-468.
82 Cassady JR, Richter MP, Piro AJ, Jaffe N. Radiation-adriamycin interactions. Preliminary clinical observations. Cancer. 1975;36:946-949.
83 Donaldson SS, Glick JM, Wilbur JR. Letter. Adriamycin activating a recall phenomenon after radiation therapy. Ann Intern Med. 1974;81:407-408.
84 Posner LE, Dukart G, Goldberg J, et al. Mitoxantrone. An overview of safety and toxicity. Invest New Drugs. 1985;3:123-132.
85 Chugun A, Uchide T, Tsurimaki C, et al. Mechanisms responsible for reduced cardiotoxicity of mitoxantrone compared to doxorubicin examined in isolated guinea-pig heart preparations. J Vet Med Sci. 2008;70:255-264.
86 Bartelink H, Roelofsen F, Eschwege F, et al. Concomitant radiotherapy and chemotherapy is superior to radiotherapy alone in the treatment of locally advanced anal cancer. Results of a phase III randomized trial of the European Organization for Research and Treatment of Cancer Radiotherapy and Gastrointestinal Cooperative Groups. J Clin Oncol. 1997;15:2040-2049.
87 Flam M, John M, Pajak TF, et al. Role of mitomycin in combination with fluorouracil and radiotherapy, and of salvage chemoradiation in the definitive nonsurgical treatment of epidermoid carcinoma of the anal canal. Results of a phase III randomized intergroup study. J Clin Oncol. 1996;14:2527-2539.
88 Sischy B, Doggett RL, Krall JM, et al. Definitive irradiation and chemotherapy for radiosensitization in management of anal carcinoma. Interim report on Radiation Therapy Oncology Group study no. 8314. J Natl Cancer Inst. 1989;81:850-856.
89 Dobrowsky W, Dobrowsky E, Rauth AM. Mode of interaction of 5-fluorouracil, radiation, and mitomycin C. In vitro studies. Int J Radiat Oncol Biol Phys. 1992;22:875-880.
90 Byfield JE, Calabro-Jones P, Klisak I, Kulhanian F. Pharmacologic requirements for obtaining sensitization of human tumor cells in vitro to combined 5-Fluorouracil or ftorafur and X rays. Int J Radiat Oncol Biol Phys. 1982;8:1923-1933.
91 Rockwell S. Cytotoxicities of mitomycin C and x rays to aerobic and hypoxic cells in vitro. Int J Radiat Oncol Biol Phys. 1982;8:1035-1039.
92 Herskovic A, Martz K, al-Sarraf M, et al. Combined chemotherapy and radiotherapy compared with radiotherapy alone in patients with cancer of the esophagus. N Engl J Med. 1992;326:1593-1598.
93 Cooper JS, Guo MD, Herskovic A, et al. Chemoradiotherapy of locally advanced esophageal cancer. Long-term follow-up of a prospective randomized trial (RTOG 85-01). Radiation Therapy Oncology Group. JAMA. 1999;281:1623-1627.
94 Wong R, Malthaner R: Combined chemotherapy and radiotherapy (without surgery) compared with radiotherapy alone in localized carcinoma of the esophagus, Cochrane Database Syst Rev 1:CD002092, 2006.
95 Tepper J, Krasna MJ, Niedzwiecki D, et al. Phase III trial of trimodality therapy with cisplatin, fluorouracil, radiotherapy, and surgery compared with surgery alone for esophageal cancer. CALGB 9781. J Clin Oncol. 2008;26:1086-1092.
96 Berger B, Belka C. Evidence-based radiation oncology. Oesophagus. Radiother Oncol. 2009;92:276-290.
97 Macdonald JS, Smalley SR, Benedetti J, et al. Chemoradiotherapy after surgery compared with surgery alone for adenocarcinoma of the stomach or gastroesophageal junction. N Engl J Med. 2001;345:725-730.
98 Cunningham D, Allum WH, Stenning SP, et al. Perioperative chemotherapy versus surgery alone for resectable gastroesophageal cancer. N Engl J Med. 2006;355:11-20.
99 Bosset JF, Collette L, Calais G, et al. Chemotherapy with preoperative radiotherapy in rectal cancer. N Engl J Med. 2006;355:1114-1123.
100 Boulis-Wassif S, Gerard A, Loygue J, et al. Final results of a randomized trial on the treatment of rectal cancer with preoperative radiotherapy alone or in combination with 5-fluorouracil, followed by radical surgery. Trial of the European Organization on Research and Treatment of Cancer Gastrointestinal Tract Cancer Cooperative Group. Cancer. 1984;53:1811-1818.
101 Bujko K, Nowacki MP, Nasierowska-Guttmejer A, et al. Long-term results of a randomized trial comparing preoperative short-course radiotherapy with preoperative conventionally fractionated chemoradiation for rectal cancer. Br J Surg. 2006;93:1215-1223.
102 Gerard JP, Conroy T, Bonnetain F, et al. Preoperative radiotherapy with or without concurrent fluorouracil and leucovorin in T3-4 rectal cancers. Results of FFCD 9203. J Clin Oncol. 2006;24:4620-4625.
103 Ceelen W, Fierens K, Van Nieuwenhove Y, Pattyn P. Preoperative chemoradiation versus radiation alone for stage II and III resectable rectal cancer. A systematic review and meta-analysis. Int J Cancer. 2009;124:2966-2972.
104 Sauer R, Becker H, Hohenberger W, et al. Preoperative versus postoperative chemoradiotherapy for rectal cancer. N Engl J Med. 2004;351:1731-1740.
105 Willett CG, Duda DG, di Tomaso E, et al. Efficacy, safety, and biomarkers of neoadjuvant bevacizumab, radiation therapy, and fluorouracil in rectal cancer. A multidisciplinary phase II study. J Clin Oncol. 2009;27:3020-3026.
106 Al-Sarraf M, LeBlanc M, Giri PG, et al. Chemoradiotherapy versus radiotherapy in patients with advanced nasopharyngeal cancer. Phase III randomized Intergroup study 0099. J Clin Oncol. 1998;16:1310-1317.
107 Pignon JP, le Maitre A, Maillard E, Bourhis J. Meta-analysis of chemotherapy in head and neck cancer (MACH-NC). An update on 93 randomised trials and 17,346 patients. Radiother Oncol. 2009;92:4-14.
108 Induction chemotherapy plus radiation compared with surgery plus radiation in patients with advanced laryngeal cancer. The Department of Veterans Affairs Laryngeal Cancer Study Group. N Engl J Med. 1991;324:1685-1690.
109 Lefebvre JL, Chevalier D, Luboinski B, et al. Larynx preservation in pyriform sinus cancer. Preliminary results of a European Organization for Research and Treatment of Cancer phase III trial. EORTC Head and Neck Cancer Cooperative Group. J Natl Cancer Inst. 1996;88:890-899.
110 Forastiere AA, Goepfert H, Maor M, et al. Concurrent chemotherapy and radiotherapy for organ preservation in advanced laryngeal cancer. N Engl J Med. 2003;349:2091-2098.
111 Cooper JS, Pajak TF, Forastiere AA, et al. Postoperative concurrent radiotherapy and chemotherapy for high-risk squamous-cell carcinoma of the head and neck. N Engl J Med. 2004;350:1937-1944.
112 Bernier J, Domenge C, Ozsahin M, et al. Postoperative irradiation with or without concomitant chemotherapy for locally advanced head and neck cancer. N Engl J Med. 2004;350:1945-1952.
113 Bernier J, Cooper JS, Pajak TF, et al. Defining risk levels in locally advanced head and neck cancers. A comparative analysis of concurrent postoperative radiation plus chemotherapy trials of the EORTC (#22931) and RTOG (# 9501). Head Neck. 2005;27:843-850.
114 Bonner JA, Harari PM, Giralt J, et al. Radiotherapy plus cetuximab for squamous-cell carcinoma of the head and neck. N Engl J Med. 2006;354:567-578.
115 Bonner JA, Harari PM, Giralt J, et al. Radiotherapy plus cetuximab for locoregionally advanced head and neck cancer. 5-year survival data from a phase 3 randomised trial, and relation between cetuximab-induced rash and survival. Lancet Oncol. 2010;11:21-28.
116 Saunders M, Dische S, Barrett A, et al. Continuous hyperfractionated accelerated radiotherapy (CHART) versus conventional radiotherapy in non-small-cell lung cancer. A randomised multicentre trial. CHART Steering Committee. Lancet. 1997;350:161-165.
117 Dillman RO, Seagren SL, Propert KJ, et al. A randomized trial of induction chemotherapy plus high-dose radiation versus radiation alone in stage III non-small-cell lung cancer. N Engl J Med. 1990;323:940-945.
118 Sause WT, Scott C, Taylor S, et al. Radiation Therapy Oncology Group (RTOG) 88-08 and Eastern Cooperative Oncology Group (ECOG) 4588. Preliminary results of a phase III trial in regionally advanced, unresectable non-small-cell lung cancer. J Natl Cancer Inst. 1995;87:198-205.
119 Le Chevalier T, Arriagada R, Quoix E, et al. Radiotherapy alone versus combined chemotherapy and radiotherapy in nonresectable non-small-cell lung cancer. First analysis of a randomized trial in 353 patients. J Natl Cancer Inst. 1991;83:417-423.
120 Chemotherapy in non-small cell lung cancer. A meta-analysis using updated data on individual patients from 52 randomised clinical trials. Non-small Cell Lung Cancer Collaborative Group. BMJ. 1995;311:899-909.
121 Curran WJJr, Scott CB, Langer CJ, et al. Long-term benefit is observed in a phase III comparison of sequential v. concurrent chemo-radiation for patients with unresectable stage III NSCLC: RTOG 9410. Proc Am Soc Clin Oncol. 2003;22:621. (Abst 2499)
122 Furuse K, Fukuoka M, Kawahara M, et al. Phase III study of concurrent versus sequential thoracic radiotherapy in combination with mitomycin, vindesine, and cisplatin in unresectable stage III non-small-cell lung cancer. J Clin Oncol. 1999;17:2692-2699.
123 Zatloukal P, Petruzelka L, Zemanova M, et al. Concurrent versus sequential chemoradiotherapy with cisplatin and vinorelbine in locally advanced non-small cell lung cancer. A randomized study. Lung Cancer. 2004;46:87-98.
124 Fournel P, Robinet G, Thomas P, et al. Randomized phase III trial of sequential chemoradiotherapy compared with concurrent chemoradiotherapy in locally advanced non-small-cell lung cancer. Groupe Lyon-Saint-Etienne d’Oncologie Thoracique-Groupe Francais de Pneumo-Cancerologie NPC 95-01 Study. J Clin Oncol. 2005;23:5910-5917.
125 Belani CP, Choy H, Bonomi P, et al. Combined chemoradiotherapy regimens of paclitaxel and carboplatin for locally advanced non-small-cell lung cancer. A randomized phase II locally advanced multi-modality protocol. J Clin Oncol. 2005;23:5883-5891.
126 Albain KS, Swann RS, Rusch VW, et al. Radiotherapy plus chemotherapy with or without surgical resection for stage III non-small-cell lung cancer. A phase III randomised controlled trial. Lancet. 2009;374:379-386.
127 Thomas M, Rube C, Hoffknecht P, et al. Effect of preoperative chemoradiation in addition to preoperative chemotherapy. A randomised trial in stage III non-small cell lung cancer. Lancet Oncol. 2008;9:636-648.
128 Eifel PJ. Concurrent chemotherapy and radiation therapy as the standard of care for cervical cancer. Nat Clin Pract Oncol. 2006;3:248-255.
129 Whitney CW, Sause W, Bundy BN, et al. Randomized comparison of fluorouracil plus cisplatin versus hydroxyurea as an adjunct to radiation therapy in stage IIB-IVA carcinoma of the cervix with negative para-aortic lymph nodes. A Gynecologic Oncology Group and Southwest Oncology Group study. J Clin Oncol. 1999;17:1339-1348.
130 Rose PG, Bundy BN, Watkins EB, et al. Concurrent cisplatin-based radiotherapy and chemotherapy for locally advanced cervical cancer. N Engl J Med. 1999;340:1144-1153.
131 Keys HM, Bundy BN, Stehman FB, et al. Cisplatin, radiation, and adjuvant hysterectomy compared with radiation and adjuvant hysterectomy for bulky stage IB cervical carcinoma. N Engl J Med. 1999;340:1154-1161.
132 Morris M, Eifel PJ, Lu J, et al. Pelvic radiation with concurrent chemotherapy compared with pelvic and para-aortic radiation for high-risk cervical cancer. N Engl J Med. 1999;340:1137-1143.
133 Peters WA3rd, Liu PY, Barrett RJ2nd, et al. Concurrent chemotherapy and pelvic radiation therapy compared with pelvic radiation therapy alone as adjuvant therapy after radical surgery in high-risk early-stage cancer of the cervix. J Clin Oncol. 2000;18:1606-1613.
134 Pearcey R, Brundage M, Drouin P, et al. Phase III trial comparing radical radiotherapy with and without cisplatin chemotherapy in patients with advanced squamous cell cancer of the cervix. J Clin Oncol. 2002;20:966-972.
135 Shipley WU, Zietman AL, Kaufman DS, et al. Selective bladder preservation by trimodality therapy for patients with muscularis propria-invasive bladder cancer and who are cystectomy candidates—the Massachusetts General Hospital and Radiation Therapy Oncology Group experiences. Semin Radiat Oncol. 2005;15:36-41.
136 Pilepich MV, Winter K, John MJ, et al. Phase III radiation therapy oncology group (RTOG) trial 86-10 of androgen deprivation adjuvant to definitive radiotherapy in locally advanced carcinoma of the prostate. Int J Radiat Oncol Biol Phys. 2001;50:1243-1252.
137 Hanks GE, Pajak TF, Porter A, et al. Phase III trial of long-term adjuvant androgen deprivation after neoadjuvant hormonal cytoreduction and radiotherapy in locally advanced carcinoma of the prostate. The Radiation Therapy Oncology Group Protocol 92-02. J Clin Oncol. 2003;21:3972-3978.
138 Horwitz EM, Bae K, Hanks GE, et al. Ten-year follow-up of radiation therapy oncology group protocol 92-02. A phase III trial of the duration of elective androgen deprivation in locally advanced prostate cancer. J Clin Oncol. 2008;26:2497-2504.
139 Bolla M, Collette L, Blank L, et al. Long-term results with immediate androgen suppression and external irradiation in patients with locally advanced prostate cancer (an EORTC study). A phase III randomised trial. Lancet. 2002;360:103-106.
140 Bolla M, de Reijke TM, Van Tienhoven G, et al. Duration of androgen suppression in the treatment of prostate cancer. N Engl J Med. 2009;360:2516-2527.
141 Stupp R, Mason WP, van den Bent MJ, et al. Radiotherapy plus concomitant and adjuvant temozolomide for glioblastoma. N Engl J Med. 2005;352:987-996.
142 Stupp R, Hegi ME, Mason WP, et al. Effects of radiotherapy with concomitant and adjuvant temozolomide versus radiotherapy alone on survival in glioblastoma in a randomised phase III study. 5-year analysis of the EORTC-NCIC trial. Lancet Oncol. 2009;10:459-466.
143 Karayan-Tapon L, Quillien V, Guilhot J, et al. Prognostic value of O(6)-methylguanine-DNA methyltransferase status in glioblastoma patients, assessed by five different methods. J Neurooncol. 2010;97(3):311-322.
144 Dunn J, Baborie A, Alam F, et al. Extent of MGMT promoter methylation correlates with outcome in glioblastomas given temozolomide and radiotherapy. Br J Cancer. 2009;101:124-131.
145 Hegi ME, Diserens AC, Gorlia T, et al. MGMT gene silencing and benefit from temozolomide in glioblastoma. N Engl J Med. 2005;352:997-1003.
146 Weller M, Felsberg J, Hartmann C, et al. Molecular predictors of progression-free and overall survival in patients with newly diagnosed glioblastoma. A prospective translational study of the German Glioma Network. J Clin Oncol. 2009;27(34):5743-5750.
147 Carles J, Monzo M, Amat M, et al. Single-nucleotide polymorphisms in base excision repair, nucleotide excision repair, and double strand break genes as markers for response to radiotherapy in patients with Stage I to II head-and-neck cancer. Int J Radiat Oncol Biol Phys. 2006;66:1022-1030.
148 Nayak MS, Yang JM, Hait WN. Effect of a single nucleotide polymorphism in the murine double minute 2 promoter (SNP309) on the sensitivity to topoisomerase II-targeting drugs. Cancer Res. 2007;67:5831-5839.
149 Terrazzino S, Agostini M, Pucciarelli S, et al. A haplotype of the methylenetetrahydrofolate reductase gene predicts poor tumor response in rectal cancer patients receiving preoperative chemoradiation. Pharmacogenet Genomics. 2006;16:817-824.
150 Bonnefoi H, Potti A, Delorenzi M, et al. Validation of gene signatures that predict the response of breast cancer to neoadjuvant chemotherapy. A substudy of the EORTC 10994/BIG 00-01 clinical trial. Lancet Oncol. 2007;8:1071-1078.
151 Taguchi F, Solomon B, Gregorc V, et al. Mass spectrometry to classify non-small-cell lung cancer patients for clinical outcome after treatment with epidermal growth factor receptor tyrosine kinase inhibitors. A multicohort cross-institutional study. J Natl Cancer Inst. 2007;99:838-846.
152 Zhu H, Pei HP, Zeng S, et al. Profiling protein markers associated with the sensitivity to concurrent chemoradiotherapy in human cervical carcinoma. J Proteome Res. 2009;8:3969-3976.
153 Fan AC, Deb-Basu D, Orban MW, et al. Nanofluidic proteomic assay for serial analysis of oncoprotein activation in clinical specimens. Nat Med. 2009;15:566-571.
154 Cohen AA, Geva-Zatorsky N, Eden E, et al. Dynamic proteomics of individual cancer cells in response to a drug. Science. 2008;322:1511-1516.
155 Tu T, Thotala D, Geng L, et al. Bone marrow X kinase-mediated signal transduction in irradiated vascular endothelium. Cancer Res. 2008;68:2861-2869.
156 Tan J, Geng L, Yazlovitskaya EM, Hallahan DE. Protein kinase B/Akt-dependent phosphorylation of glycogen synthase kinase-3beta in irradiated vascular endothelium. Cancer Res. 2006;66:2320-2327.
157 Razis E, Selviaridis P, Labropoulos S, et al. Phase II study of neoadjuvant imatinib in glioblastoma. Evaluation of clinical and molecular effects of the treatment. Clin Cancer Res. 2009;15:6258-6266.
158 Liu L, Greger J, Shi H, et al. Novel mechanism of lapatinib resistance in HER2-positive breast tumor cells. Activation of AXL. Cancer Res. 2009;69:6871-6878.
159 Brozovic A, Osmak M. Activation of mitogen-activated protein kinases by cisplatin and their role in cisplatin-resistance. Cancer Lett. 2007;251:1-16.
160 Sikkema AH, Diks SH, den Dunnen WF, et al. Kinome profiling in pediatric brain tumors as a new approach for target discovery. Cancer Res. 2009;69:5987-5995.
161 Schrage YM, Briaire-de Bruijn IH, de Miranda NF, et al. Kinome profiling of chondrosarcoma reveals SRC-pathway activity and dasatinib as option for treatment. Cancer Res. 2009;69:6216-6222.
162 Versele M, Talloen W, Rockx C, et al. Response prediction to a multitargeted kinase inhibitor in cancer cell lines and xenograft tumors using high-content tyrosine peptide arrays with a kinetic readout. Mol Cancer Ther. 2009;8:1846-1855.
163 Folkvord S, Flatmark K, Dueland S, et al. Prediction of response to preoperative chemoradiotherapy in rectal cancer by multiplex kinase activity profiling. Int J Radiat Oncol Biol Phys. 2010;78(2):555-562.
164 Brizel DM, Albers ME, Fisher SR, et al. Hyperfractionated irradiation with or without concurrent chemotherapy for locally advanced head and neck cancer. N Engl J Med. 1998;338:1798-1804.
165 Adelstein DJ, Li Y, Adams GL, et al. An intergroup phase III comparison of standard radiation therapy and two schedules of concurrent chemoradiotherapy in patients with unresectable squamous cell head and neck cancer. J Clin Oncol. 2003;21:92-98.
166 Dillman RO, Herndon J, Seagren SL, et al. Improved survival in stage III non-small-cell lung cancer. Seven-year follow-up of cancer and leukemia group B (CALGB) 8433 trial. J Natl Cancer Inst. 1996;88:1210-1215.
167 Sause W, Kolesar P, Taylor SI, et al. Final results of phase III trial in regionally advanced unresectable non-small cell lung cancer. Radiation Therapy Oncology Group, Eastern Cooperative Oncology Group, and Southwest Oncology Group. Chest. 2000;117:358-364.
[/level-membership-for-hematology-oncology-and-palliative-medicine-category][not-level-membership-for-hematology-oncology-and-palliative-medicine-category]
Chapter 4 Interaction of Chemotherapy and Radiation
Historical Perspective
Radiosensitization and chemosensitization are each complex concepts that have many different interpretations and have been used to describe a variety of interactions.1,2 The combination of irradiation and chemotherapy for mutual or even simultaneous sensitization increases the intricacies of these interactions. For example, over 100 years ago radiation treatment and benzene systemic therapy were combined for leukemia treatment.3 However, probably the best historical model of chemotherapy and radiation therapy interaction is the use of 5-fluorouracil.
5-Fluorouracil
In the 1950s, the halogenated pyrimidine 5-fluorouracil (5-FU) was combined with external beam irradiation therapy (EBRT) after this class of drug was determined to have anticancer properties.4 In the past 50 years, 5-FU has been successfully combined with radiation to treat a variety of gastrointestinal cancers, as well as cervical cancer and head and neck cancer.5 The route of administration and scheduling of 5-FU doses have been reconfigured many times to reduce toxicity and maximize tumor control. What began as bolus delivery at the beginning and end of a fractionated radiation treatment course (Moertel regimen) has progressed to protracted venous infusion (PVI), and now to twice-daily doses of oral 5-FU analog formulations. These approaches have allowed for an increase in cumulative dose of the drug, decreased chemotherapy toxicity, and improved radiosensitization. 5-FU has proven to be a staple drug in the armamentarium of medical oncologists as well as a key radiosensitizer for the radiation oncologist.
Rationale
Limitations in Current Therapeutic Approach
Tumor Detection
If ionizing radiation were not toxic to normal tissues, tumor detection would be immaterial and radiotherapy could be delivered to the entire body much as chemotherapy is given. Obviously, this is not the case. Just as surgeons must identify tumor tissue and remove it with a scalpel, radiation oncologists must be able to identify tumor tissue so that they can precisely and accurately target it with radiation. Fortunately, advances in radiology have dramatically improved the ability to detect tumor location and extent. CT and MRI scanning provide excellent anatomic information, but when they are combined with biologic or functional imaging techniques such as positron emission tomography (PET) or single-photon emission computed tomography (SPECT), they are even more precise at differentiating tumor tissue from nontumor tissue. Emerging MRI sequences, including dynamic contrast-enhanced MRI or CT scanning, fast imaging employing steady-state acquisition (FIESTA), and ultrafast pulse sequence approaches, provide improved anatomic imaging for surgeons and radiation oncologists. Nevertheless, the resolution of current techniques (on the order of 5 mm for PET resolution6) and the high rate of false-negatives with small tumors still limit the ability to identify microscopic tumor extent and micrometastatic disease. Technologies currently being explored, such as PET/MRI, as well as novel radiopharmaceuticals may provide improvements in the near future.
Inherent and Acquired Resistance
Certain tumors have inherent radiation resistance pathways that manifest with high rates of local failure following irradiation. In some cases, such as pancreatic cancer, it is difficult to deliver adequate doses of radiation to the target because of the limitations in dose tolerance of surrounding bowel, kidney, and liver tissues. Other tumors have extremely high local failure rates despite dose escalation; for example, glioblastoma multiforme has local recurrence rates approaching 100%. Biologic factors within the tumor or tumor microenvironment also generate resistance. Figure 4-1 summarizes some of the major resistance pathways within tumors. Later in this chapter we will describe how chemotherapeutic agents can potentially mitigate these resistance pathways.
Increased Toxicity
In the original treatise by Steel and Peckham7 on combining chemotherapy and radiation therapy, it was assumed that each modality functioned independently in both beneficence and toxicity. However, concurrent chemoradiation therapy has shown increased toxicity, indicating some level of overlapping toxicity, chemosensitization by radiation, or radiosensitization by chemotherapeutic agents. Because chemoradiation is often used when tumors have wide anatomic extension (and thus surgery is precluded), the volume of normal tissue irradiated—and at risk for toxicity—is larger. In some cases, a patient has co-morbid conditions that prevent aggressive therapy.
Therapeutic Index
A metric is necessary to determine the efficacy of a therapy relative to its toxicity, so that newer approaches can be compared. This metric, known as the therapeutic index (or therapeutic ratio), is the ratio of the probability of tumor control to the probability of normal tissue toxicity. Typically, the ratio is calculated based on the 50% control rate of tumor tissue versus the 50% rate of normal tissue toxicity. These sigmoid-shaped curves determine estimated efficacy versus toxicity of treatment (Fig. 4-2). The therapeutic index is the “holy grail” of cancer therapy, and it takes careful treatment planning to achieve maximal tumor cell destruction while also sparing normal tissue in hopes of preserving function. There are a host of technologic factors that affect the therapeutic ratio, one in particular is the ability to correctly identify tumor tissue and normal tissue. Use of PET, MRI, and SPECT imaging, as described earlier, allows radiation oncologists to better differentiate target tissue from other tissues. The ability to precisely deliver radiation through techniques such as intensity-modulated radiation therapy (IMRT), stereotactic procedures, and proton therapy permits radiation oncologists to avoid normal tissue while targeting tumor tissue. Increasingly accurate delivery of radiation via image guidance (IGRT) enables smaller margin expansions, thus limiting the size of the dose that reaches normal tissue. However, because of the anatomic location of some tumors, there are still technological limits as to what can be accomplished with radiation alone. Additional improvements are likely to rely on the interaction of systemic agents with technologically advanced radiation delivery methods.
General Strategies to Improve the Therapeutic Index
In 1979, Steel and Peckham7 defined four potential ways that combined modality therapy might be used to improve the therapeutic index: (1) independent toxicity, (2) normal tissue protection, (3) spatial cooperation, and (4) enhanced tumor response. As discussed later, the first theoretical concept may not function as originally intended. However, the latter three concepts are relevant for modern strategies of combining drugs with radiation. Recent innovative concepts of biologic cooperation and temporal modulation that expand on Steel and Peckham’s “exploitable mechanisms in combined radiotherapy-chemotherapy”7 are having an impact on current investigative strategies for improving the therapeutic index.
Normal Tissue Protection
Only a few clinically relevant, therapeutic agents have been identified as promoting normal tissue protection without protecting tumors. There has been limited success with the free-radical scavenging agent amifostine (WR-2721). The drug appears to be selectively taken up by normal tissue relative to tumor tissue, where it is converted into the active thiol metabolite WR-1065.8 Although amifostine has been shown to protect against xerostomia in head and neck cancer treatment (Table 4-1) and to limit renal toxicity from cisplatin, several clinical trials have failed to show an advantage of amifostine use. Undoubtedly, clinical trials will continue to investigate novel radioprotectors that have the potential to affect the therapeutic ratio.
| Mechanism | Example | Notes |
|---|---|---|
| Normal tissue protection | Amifostine in head and neck cancer | Reduces xerostomia rates from RT alone |
| Spatial cooperation | Early-stage breast cancer with adjuvant CT PCI in SCLC |
RT provides locoregional control for breast cancer but no impact on DM SCLC CT does not effectively cross BBB → RT can effectively treat the brain |
| Biologic cooperation | Targeted therapies inhibit prosurvival/proliferation pathways within tumors | Kinase-targeted agents, including tyrosine kinase inhibitors such as dasatinib and sunitinib, as well as monoclonal antibodies such as cetuximab and bevacizumab; mTOR inhibitors |
| Temporal modulation | Drugs that affect tumor response between fractions, namely, targeting repair, repopulation, reoxygenation, and redistribution | This is essentially a composite of several of the other mechanisms but requires concomitant, rather than sequential, delivery of the drug |
| Increased DNA damage | Drugs that incorporate into DNA | 5-FU and platinum are classic examples |
| Inhibition of DNA repair | DNA intercalators and nucleoside analogs can disrupt repair and enhance radiation cytotoxicity | Alkylators, antimetabolites, platinum, and topoisomerase inhibitors are a few examples |
| Cell cycle effects | Most chemotherapeutics are cell cycle specific (except alkylators) Cell cycle arrest in radiosensitive phases (microtubule-targeting agents at M phase) Elimination of radioresistant cells (S phase) |
Taxanes, epothilones, 5-FU, gemcitabine, topoisomerase inhibitors are good examples |
| Targeting repopulation | Conceivably, any systemic agent that has at least cytostatic properties can prevent repopulation | Molecularly targeted agents as well as chemotherapeutics (particularly antimetabolites) can function this way |
| Hypoxia targeting | Mitomycin C and tirapazamine selectively targeting hypoxic cells Tumor shrinkage by CT decreases interstitial pressure and improves oxygenation |
Taxanes and other chemotherapeutics that can produce tumor shrinkage are indirect means (given as induction therapy), whereas mitomycin C and tirapazamine are directly affecting hypoxic cells |
| Tumor microenvironment targeting | Anti-angiogenesis promotes vascular renormalization | Bevacizumab in glioma |
BBB, blood-brain barrier; CT, chemotherapy; DM, distant metastases; 5-FU, 5-fluorouracil; PCI, prophylactic cranial irradiation; RT, radiation therapy; SCLC, small cell lung carcinoma.
Spatial Cooperation
The concept of spatial cooperation implies that chemotherapy and radiation therapy are independent “players,” with chemotherapy acting systemically (i.e., targeting micrometastatic disease) and radiation therapy acting locoregionally. Because these therapies function independently, it could be assumed that a full dose of each would be required to achieve the desired outcome. If the chemotherapy drug and irradiation did function completely independently, then concurrent administration should be possible with nonoverlapping toxicities. It is unclear whether a completely independent action can actually be achieved with the chemotherapeutics currently used with radiation treatment. Some in-field toxicities do occur, suggesting some level of localized radiation sensitization. Therefore, sequential therapy is probably the best means to exploit spatial cooperation. There are many clinical examples supporting this approach, such as adjuvant chemotherapy followed by irradiation for breast cancer, consolidative irradiation for bulky disease in lymphoma, and prophylactic cranial irradiation in small cell lung cancer (see Table 4-1).
Biologic Cooperation
The term biologic cooperation is a more recent concept9 that involves independent targeting of subpopulations of cells within the tumor itself (see Table 4-1). Although similar to the concept of spatial cooperation, biologic cooperation implies that some portion of the actual radiation target (i.e., in-field) is resistant to radiation and that this portion becomes the target of the drug given concomitantly. The most prominent example of an agent used in biologic cooperation is the hypoxic cell cytotoxin, tirapazamine. Hypoxia is a known condition of radiation resistance; tirapazamine targets the hypoxic subpopulations of cells because it is most potent in anoxic conditions. Tirapazamine is discussed in more detail later in this chapter.
Temporal Modulation
The four Rs of classical radiobiology, reoxygenation, repair, redistribution, and repopulation,10 refer to factors that are particularly important for fractionated radiation therapy. For example, antiproliferative therapies could prevent accelerated repopulation between fractions that might not be detectable using single-fraction assays in vitro. Conversely, although the DNA damage repair blockade may enhance radiation sensitivity in a tumor, if DNA repair is also inhibited in normal tissue, outcomes may be worse in fractionated therapy.9 Depending on which factors are most prominent in normal and tumor cells, the therapeutic index can be shifted in either a beneficial or a detrimental direction. Therefore temporal modulation implies therapeutics that optimize the four Rs between fractionated radiation treatments9 (see Table 4-1).
Potential Biologic Mechanisms of Drug-Radiation Interactions
The many potential mechanisms by which a drug may affect radiation efficacy are summarized in Table 4-1. The classic definition of a radiosensitizer had an enhancement of DNA damage as the critical factor. However, with increased understanding of cancer cell biology, it is apparent that targets other than DNA damage can enhance radiation efficacy. Therefore a more broadly defined “radiation enhancer” can affect several potential mechanisms to increase the effect of radiation.
Cell Cycle Effects
The G2/M phase has been identified as the most radiation-sensitive phase of the cell cycle and the S phase as the most radiation-resistant phase.11,12 In addition, many cytotoxic chemotherapeutic agents are cell cycle specific. Therefore agents that can maintain cells in radiation-sensitive phases or eliminate those cells in radiation-resistant phases will cooperate with radiation for enhanced efficacy. Although this is clearly seen in preclinical settings, there is much less direct evidence for this phenomenon in clinical data. Nevertheless, taxanes, nucleoside analogs, and modified pyrimidines appear to work in this manner.13–16
Hypoxia and Tumor Microenvironment
Hypoxia is one of the most potent factors of radiation protection known. Radiation relies on the production of oxygen free radicals, and hypoxic tissue is two to three times less sensitive to radiation than nonhypoxic tissue.17 There are four general chemotherapeutic approaches to mitigate hypoxia and enhance radiation efficacy:
Cell Death Pathway Effects
All of the above potential mechanisms of drug-radiation interaction display their efficacy through the consequences of cytotoxicity. However, recently it has become clear that there are several ways in which cytotoxicity is manifest. The Nomenclature Committee on Cell Death (NCCD)’s 2005 classification system,25 based purely on morphologic criteria, defined four modes of cell death: (type 1) apoptosis; (type 2) autophagy; (type 3) necrosis, or oncosis; and (type 4) mitotic catastrophe. Although these are distinct forms of cell death, the stimuli and processes involved are interrelated. There is also evidence that ionizing radiation can manifest its cytotoxicity by each type of cell death. As the understanding of the cell death pathways improves, novel therapeutics targeting each type could enhance radiation efficacy. The cell death mechanisms are briefly described below.
Apoptosis
Apoptosis is the most clearly defined and studied mechanism of cell death. This “programmed cell death” involves characteristic morphologic changes, including chromatin condensation (nuclear pyknosis) and nuclear fragmentation (karyorrhexis). Apoptotic bodies ultimately form, and the cell is removed through phagocytosis without generation of an inflammatory response. Apoptosis can occur with or without caspase activation26,27 and does not require DNA fragmentation,25 though this is a classic hallmark. Apoptosis is considered the major mechanism for chemotherapy-induced cell death. As a mechanism for radiation-induced cytotoxicity, apoptosis occurs readily in “liquid tumors” as opposed to most solid tumors, where apoptosis is a minor component of cell death. As such, drugs targeting the apoptosis pathway may enhance radiation cytotoxicity in solid tumors.
Autophagy
Whereas apoptosis is a clear self-destructive mechanism for a cell, the role of autophagy in cell death is more controversial. Autophagy, literally meaning “self-eating,” can provide a protective mechanism for a cell during times of stress (such as nutrient deprivation) because it allows recycling of cellular building blocks through controlled breakdown of cytoplasmic components. However, autophagic cell death does occur; it differs from apoptosis mainly because of the lack of chromatin condensation.25
Necrosis
Type 3 cell death, or necrosis, is a mechanism in which a cell swells (oncosis) until the plasma membrane ruptures and the cell contents are released, resulting in a local inflammatory response.25 The best example of this type of cell death is ischemic injury. Large, single-fraction radiation or radio-ablative doses can produce this type of cell death (e.g., stereotactic radiosurgery of brain lesions).
Analyzing Drug-Radiation Interactions
Several methodologies for determining the interaction between a drug and radiation have been detailed in the literature. Several definitions for possible interactions have also been described. The concept of radiosensitization originated many years ago, and classic radiosensitization has been defined as an increased amount of radiation-induced cell death that results from exposure to a second agent, after correction for the cytotoxicity of the agent. Clonogenic survival assay, which measures all forms of cell death as well as prolonged or irreversible cell cycle arrest, is the most encompassing method of measuring radiation cytotoxicity in vitro (Figure 4-3). Survival curves are generated by plating known quantities of cells, treating them with various doses of radiation and/or drug, and plotting the surviving fraction of colonies formed in a semilogarithmic fashion. Normalization is performed by dividing the surviving fraction for treated groups by the plating efficiency, which is defined as the surviving fraction of the untreated cells. Modification in radiosensitization, therefore, is demonstrated in clonogenic survival curve data in which a downward or leftward shift of the normalized surviving fraction implies a radiosensitizing interaction and an upward or rightward shift implies a radioprotective interaction. Although survival curves can show interaction between chemotherapy and irradiation, a better description of radiation modulation is necessary because neither chemotherapy nor radiation cytotoxicity typically follows a linear relationship.
One of the early attempts at providing a more descriptive system was by Tyrell.28 His system may be a better starting point for describing various interactions among therapies:
These terms seem to have been supplanted by the “additivity” descriptors, including supra-additive, additive, and infra-additive. Once again, the classic paper by Steel and Peckham7 describes the construction of an “envelope of additivity” for evaluating the interaction of two treatments using isobologram analysis. This envelope of additivity is constructed from cytotoxicity data by calculating a mode 1 curve that assumes that both agents have completely independent mechanisms of action as well as a mode 2 curve that assumes that the two agents have exactly the same mechanism of action (see Expert Consult website for isobologram construction detail). When combination therapy data points are plotted on the isobologram, they may fall between mode 1 and mode 2 (additive interaction; within the envelope), above mode 1 (infra-additive interaction), or below mode 2 (supra-additive, or synergistic, interaction). An idealized isobologram is shown in Figure 4-4, and a step-by-step method for constructing an isobologram is included on the Expert Consult website.
The following is a step-by-step procedure for calculating isobolograms using Steel and Peckham’s method7,29 (see Fig. 4-WO1).
Step 1. The investigator must choose to make the assessments at one level of cytotoxicity (e.g., construct an isobologram that represents the interaction of the agents for a cumulative cytotoxicity of 50%, 10%, or 1%). The example in Figure 4-3 depicts the chosen level of cytotoxicity as horizontal line Z: 1% cytotoxicity (0.01 surviving fraction) in this case.
Step 2. Plots are made of dose-response data for both agents. In Figure 4-WO1, the dose-response data for the two agents are represented by curves A and B.
Step 3. The extreme points of the envelope of additivity are determined. Initially, a separate cartesian graph is created. The y-axis represents the dose of agent B and the x-axis the dose of agent A. The first extreme point of the envelope is placed on the y-axis at the dose of agent B alone that causes a specific level of cytotoxicity, as determined by the dose-response curve of agent B, at the intersection of line Z (Fig. 4-WO1). The second extreme point of the envelope is placed on the x-axis, at the dose of agent A alone that results in the level of cytotoxicity at the intersection of the dose-response curve with line Z (Fig. 4-WO1).
Median Dose-Effect Principle
A mathematical modeling system that has gained fairly widespread use for interactions of cytotoxic agents is the median effect principle of Chou and Talalay.29,30,31 This system was derived from Michaelis-Menten equations and basic mass-action law considerations and has been useful for describing competitive enzyme interactions and interactions of cytotoxic agents. The primary relationship of the median effect principle is described by the following equation: fa/fu = (D/Dm)m, in which D is dose, fa is the fraction affected, fu is the fraction unaffected, Dm is the dose required to produce the median effect (50%), and m is a Hill-type coefficient used to describe the sigmoid nature of the curve. For first-order Michaelis-Menten kinetics, m = 1.
The general equation is y = mx + b.
A plot of log[(1/SF) – 1] on the y-axis and log(D) on the x-axis results in a line with a slope of m and a y-intercept of mlog(Dm). The survival curves for the individual agents and for the combination treatment (the individual agents given together in some fashion) can be fitted to the equation for a line by linear regression. If the interaction of two agents is assessed, three lines (i.e., median effect plots) are produced: one for each agent and one for the combination treatment. A graph of the median effect plots for mock individual agents A and B and for the combination of A and B is shown in Figure 4-5. For the combination treatment, D is the sum of the doses of the two agents given concomitantly; it is helpful to perform the experiments with the two agents given together in a fixed ratio of doses (e.g., 1 : 2). By using various total doses (i.e., the sum), with the agents given in the same ratio, it is possible to determine the contribution of the individual agents to the combination treatment in a later calculation.
This concept can be visualized in Figure 4-5. For instance, in the case of log[(1/SF) – 1] = 0, where SF is surviving fraction, the corresponding log(D), D indicating the sum of the doses of the two agents, can be calculated from the median effect plot for the combination treatment. An example of an actual combination treatment that has been assessed in this manner is radiation followed by a 24-hour exposure to etoposide.29 In this example, a set of experiments was performed with the dose ratio fixed as 32 Gy to 1 µg/mL of etoposide. In this example, the dose D that resulted in log[(1/SF) – 1] equaling a given value was a combination of radiation and etoposide given in the ratio of 32 : 1. The radiation and etoposide components could be discerned, from the median effect plot of the combination treatment, by dividing the resulting dose into the appropriate components based on the ratio of delivery of the two agents.
Definitions used in the median effect principle include the following:
For a mutually nonexclusive interaction,
in which
CI represents the doses of the agents required for a given effect when they are given together, divided by the doses required when the agents are given alone; in this way, CI less than 1 represents a synergistic interaction. A diagram of a CI plot for various levels of surviving fraction is shown in Figure 4-5.
Chemotherapy and Radiation Therapy and Combinations of Cytotoxic Agents
General Concepts
From the Bench to the Clinic
Occasionally, the process of quantifying interactions of chemotherapy and irradiation has frustrated clinicians attempting to interpret in vitro and in vivo laboratory information, as exemplified by Charles Moertel (quoted by Tannock32) in his keynote speech at the first International Conference on Combined-Modality Therapy in 1978:
This was not meant as disrespect for the radiobiology community but to point out that, at that time, the laboratory models were potentially quite different from the clinical setting. Because it has been difficult to extrapolate from laboratory results to clinical results, many clinicians have used combination treatments on a trial-and-error basis. However, the reverse order of study has occasionally been fruitful, and efficacious combinations of treatments demonstrated in clinical studies have inspired laboratory investigations that revealed interesting molecular bases of interaction.29,30 Translational research ideally occurs with a concept that arises from laboratory findings and subsequently is shown to have clinical efficacy. However, preclinical model systems have not always allowed investigators to take findings from the laboratory to the clinic, as indicated by the quotation of Moertel and by many of the early hypoxic cell sensitizer studies.
Therapeutic Benefits
Tannock32 mentioned another problem with translating findings from the laboratory to the clinical setting, emphasizing that investigators must not merely explore combinations of therapeutic agents to find synergistic interactions but must also find interactions that will produce a therapeutic benefit (e.g., provide greater cytotoxicity in tumor cells than in normal cells). To categorize potentially exploitable differences, Tannock32 described three main categories of biologic diversity between tumor cells and normal cells: tumor cells may display genetic instability compared with normal tissues; tumor cells and normal cells may be different with respect to cellular proliferation or proliferation that occurs after treatment; and environmental factors such as oxygenation and pH may affect tumor cells and normal cells differently. As findings are translated from the laboratory to the clinical setting, it is important to consider the effects of the host mechanisms on these three areas.
Chemotherapeutic Classes
In this section, several classes of systemic agents will be presented, followed by a brief review of clinical data describing combination treatment of these agents with radiation. There are a host of chemotherapeutic classes that are used in patients that will undergo radiation treatment. Although not all of these agents are used concurrently with radiation, it is helpful to understand their predominant mechanisms of action. Below is a brief description of several of the major classes of chemotherapeutics with some information regarding possible means of interaction with radiation. In addition, Figure 4-6 summarizes the cell cycle phase specificity of these agents.
Figure 4-6 Diagram of the cell cycle with the cell cycle phase dependence of various chemotherapeutics.
Antimetabolites
The origin of antimetabolite chemotherapy dates back to the 1940s, when aminopterin was used to treat pediatric leukemia.33 Since then, a large number of antimetabolite chemotherapeutics have been developed with tremendous success. The targets for these drugs include folate metabolism and nucleoside analogs. The major antimetabolites are presented below.
Fluoropyrimidines: Fluorouracil, Fluorodeoxyuridine, Capecitabine
The fluoropyrimidines, as the name implies, are halogenated pyrimidines that function as antifolates by inhibiting thymidylate synthesis. As mentioned previously in historical perspectives, 5-FU is one of the most established drugs used in combination with radiation. It has been used in both a bolus infusion as well as a continuous venous infusion when combined with radiation and appears to target the radioresistant cells in S phase.16 The two delivery methods have some differences in terms of side effect profile, but both seem to have good efficacy. In a phase III rectal cancer postoperative adjuvant chemoradiation trial, concurrent continuous infusion of 5-FU during external beam radiation therapy (EBRT) was more effective than the bolus delivery.34 Moreover, data show that 5-FU plasma levels and intracellular metabolite levels are rather short-lived,35 also suggesting a need for continuous administration of the drug for it to be effective with radiation. Because of this, oral formulations have been developed, most notably capecitabine, a fluoropyrimidine carbamate prodrug of 5-FU, which must be converted through the action of thymidine phosphorylase. In addition to the improved patient comfort of taking an oral medication rather than having an infusion pump, another potential advantage of capecitabine in combination with radiation is that it appears that radiation increases thymidine phosphorylase levels in tumors, allowing potential bioaccumulation of active metabolite within irradiated tumor.36,37
Gemcitabine
Gemcitabine is an analog of deoxycytidine that specifically functions during the S phase by preventing dNTP production. There is both preclinical and clinical evidence demonstrating dramatic radiation-sensitizing properties to combined gemcitabine and radiation.38,39–41
[/not-level-membership-for-hematology-oncology-and-palliative-medicine-category]
