TOPIC 9 Intensive care
Cardiac output monitoring
Indications
1. To aid management of patients with haemodynamic instability. This may be in the setting of isolated cardiac dysfunction, e.g. myocardial infarction or acute left ventricular failure; more often in critically ill patients there is combined pathology – hypovolaemia and distributive shock as well as associated cardiac dysfunction. Rationalizing appropriate vasoconstrictor, inodilator and fluid therapy is enhanced with knowledge of cardiovascular parameters.
Test: Pulmonary artery catheter
• Position less assured with advent of newer techniques and uncertainty of outcome benefit in addition to suggestion of possible harm.
• Balloon-tipped catheter is floated through right heart and ‘wedged’ in medium-sized pulmonary artery.
• Two methods:
– Cold injectate – 10 mL normal saline or 5% dextrose solution (cold or room temperature) injected quickly through proximal port produces a temperature change in blood detected by thermistor. Area under curve of resultant temperature/time curve (Fig. 9.1) is inversely proportional to CO. Usually averaged over three measurements at end-expiration.
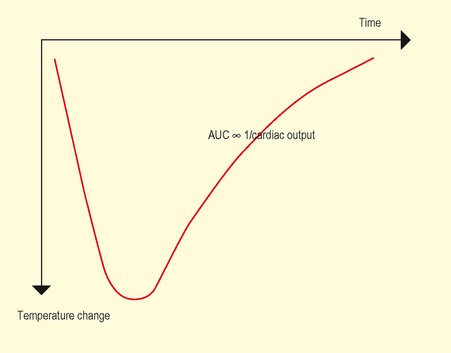
Fig. 9.1 Cold injectate temperature change. Area under curve inversely proportional to Cardiac Output.
Provides information regarding pulmonary as well as systemic vasculature.
Test: Oesophageal Doppler monitor (ODM)
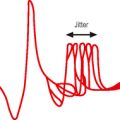
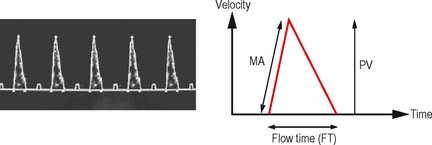
• Flexible ultrasound probe placed in distal oesophagus under anaesthesia/sedation via mouth or nose and focused to produce a Doppler waveform trace corresponding to flow of blood in descending aorta (Fig. 9.2).
• Flow time (FT) represents systolic time and is corrected (FTc) to a heart rate of 60 bpm with a further correction factor for the unmeasured upper extremity blood flow (i.e. carotid/subclavian flow).
• Calculated variables: Stroke volume, peak velocity (PV), cardiac output, flow time, systemic vascular resistance.
Interpretation
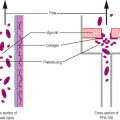
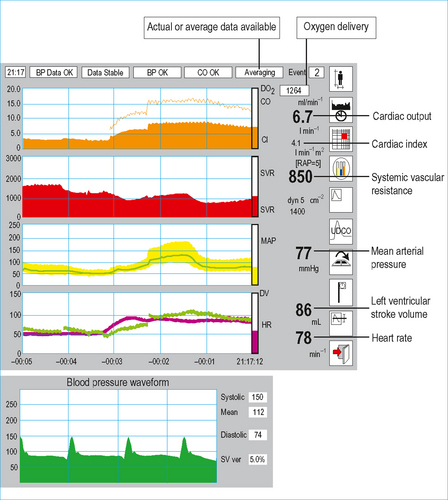
Test: Lithium dilution cardiac output (LiDCO plus)
• Blood is drawn from an arterial line, past a lithium sensor producing a lithium concentration/time curve.
• Pulse power cardiac output software (Pulse CO) uses this information to calibrate the arterial waveform such that each pulse is a quantified estimate of the patient’s stroke volume (Fig. 9.3).
Test: Pulse-induced contour cardiac output (PiCCO)
• Some similarities to cold injectate thermodilution pulmonary artery catheter (PAC) and LIDCO method.
• Transpulmonary thermodilution curve produced and modified Stewart-Hamilton method applied to calculate cardiac output.
• Pulse contour analysis (Table 9.2) applies a calibrated algorithm to calculate the stroke volume from each pulse wave.
| Thermodilution variables | Pulse contour variables |
|---|---|
| Cardiac output | Continuous cardiac output |
| Global end-diastolic volume index (GEDI) | Sytemic vascular resistance |
| Extravascular lung water index (ELWI) | Stroke volume |
| Intrathoracic blood volume index (ITBI) | dP/dtmax |
| Global ejection fraction (GEF) | Stroke volume/pulse pressure variation |
| Cardiac function index (CFI) | |
| Pulmonary vascular permeabilty index (PVPI) |
Interpretation (normal values in brackets)
• Global end-diastolic volume index (GEDI) (680–800 mL/m2). Represents volume of blood in the heart.
• Extravascular lung water. (ELWI (3–7 mL/kg). Water content of lungs, i.e. degree of pulmonary oedema (cardio- or noncardiogenic). If raised then further volume loading may lead to deterioration in oxygenation.
Test: Noninvasive cardiac output (NICO) monitor
• Consists of a microprocessor system (connected to patient via ET tube) measuring end-tidal CO2 partial pressure, (PETCO2) and calculating the total CO2 elimination over a respiratory cycle (VCO2).
• System set up to allow intermittent partial rebreathing of CO2 for periods of 35 seconds by increasing dead space every 3 minutes.
• Extrapolation of Fick principle suggests ratio of ΔVCO2 and ΔPETCO2 is proportional to cardiac output.
Test: Impedance cardiography
• Mathematical modelling allows estimation of cardiac output from subsequent impedance change curves.
Test: Echocardiography
• Two-dimensional ultrasound visualization of ventricular chamber estimates volume at end diastole and systole.
• Difference between systolic and diastolic volume equates to stroke volume (see Chapter 3 for more information).
Perioperative optimization
• Patients able to mount a cardiovascular response to major surgery and achieve particular goals, i.e. cardiac index >4.5 L/minute/m2 and tissue oxygen delivery >600 mL/minute/m2 have a better outcome in the perioperative period.
• Manipulation of a patient’s physiology to match these parameters is the cornerstone of optimization.
• Advent of noninvasive cardiac output monitors described above has made assessing the goals much easier.
• Evidence suggests that if goal-directed therapy is to be initiated postoperatively, targets should be met within the first hour and continued for 8 hours post op.
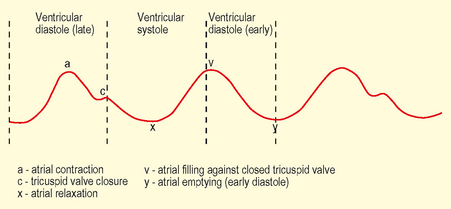
Test: Central venous pressure (CVP)
Method
• Catheter can be placed via internal jugular (commonest), subclavian, femoral or antecubital vein approach.
• Multi lumen lines are inserted using Seldinger technique. Single lumen lines may be sited using Seldinger or catheter over needle method.
• NICE guidelines (2002) recommend use of 2D ultrasound to guide catheter placement particularly via internal jugular route (see Chapter 3 for more information on this technique). Otherwise landmark method used.
• Correct thoracic placement should be confirmed with a chest x-ray, showing the catheter within the SVC and the tip at the level of the tracheal carina. Waveform and blood gas analysis (although acceptable for femoral cannulation) will only confirm venous intrathoracic placement and not position.
• Measurements represent right atrial pressure and hence right ventricular end diastolic pressure (RVEDP).
Interpretation
• CVP: (normal range 6–12 mmHg). Static measurement less helpful in guiding fluid resuscitation since compliance of right heart will affect reading for any given RVEDV. Dynamic measurements with response to fluid challenges are more informative – see below. In the context of left ventricular failure higher values are more reliable since they reflect poorly compliant ventricle and ‘off loading’ (diuresis/venodilatation) may be appropriate.
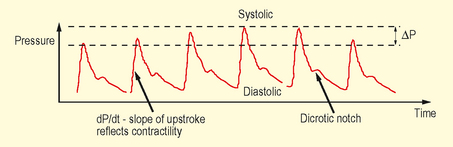
Test: Invasive arterial pressure monitoring
Method
• Most commonly sited in radial artery due to lower complication rates – brachial and femoral arteries are other common sites.
• ‘Allen test’ should ideally be performed prior to insertion to identify competent ulnar artery blood flow.
• Each pulse is transmitted through a column of fluid (usually heparinized saline) under pressure, within optimally compliant tubing, to a transducer which converts this to give a waveform and numerical data.
Interpretation
• dp/dt – steep upstroke represents increased cardiac contractility against low systemic vascular resistance.
• Dicrotic notch – occurs low in vasodilatation and high in vasoconstriction (NB position also shifts higher the more central the artery is catheterized).
Monitors of organ perfusion
Indication
• Although monitors of cardiac output can tell us whether oxygen is being delivered to the tissues, they cannot tell us whether that oxygen is being utilized. Failure to utilize oxygen may be due to inadequate delivery at a global or microcirculatory level, or may be due to mitochondrial failure at a cellular level, such as that seen with severe sepsis.
• Monitors of perfusion can help indicate whether a problem of oxygen delivery or utilization exists, and help monitor it.
Test: Serum lactate
• Under normal conditions, glucose is broken down to pyruvate, yielding two molecules of ATP via anaerobic glycolysis. Pyruvate then enters the Krebs cycle within the mitochondrion, undergoing aerobic glycolysis to yield a further 32 molecules of ATP. This process requires oxygen.
• Lactate is formed from pyruvate under conditions where there is insufficient oxygen for pyruvate to enter the Krebs cycle, and thus may act as a monitor of oxygenation at a cellular level.
• Normal serum level is <2 mmol/L, being produced at a rate of approximately 0.8 mmol/kg/hour, a testament to the enormous capacity to metabolize lactate by the liver, skeletal muscle, kidneys and brain.
| Global tissue ischaemia – | Shock, sepsis |
| Regional tissue ischaemia – | Gut ischaemia, compartment syndrome |
| Mitochondrial inability to utilize oxygen – | Severe sepsis, CO/CN poisoning |
| Reduced elimination – | Primary liver disease/reduced hepatic blood flow |
| Compounds that affect lactate metabolism – | Ketones, Metformin |
| Increased metabolic rate – | Adrenaline, Salbutamol |
| Other compounds metabolized to lactate – | Ethanol, methanol |
| Increased production by skeletal muscles – | Exercise, fitting |
Test: Base deficit
• If the serum lactate cannot be measured, an assessment of the metabolic component of any acidosis seen on arterial blood gas analysis can give an important estimate of the degree of perfusion inadequacy. The base excess provides such an assessment.
• It is equivalent to the amount of base required to normalize the pH of a sample of patient’s blood, under standard conditions (a temperature of 37°C and, most importantly, a normal pCO2 of 5.3 kPa (40 mmHg), to exclude any respiratory component of the acidosis).
• A high base deficit implies that the main physiological buffer, HCO3−, has been lost, either to neutralize excess acid production (e.g. lactate, ketones, or sulphate in renal failure), or it has been lost directly via the kidneys (renal tubular acidosis) or GI tract (diarrhoea, ureteric diversion).
• To differentiate between these two classes of metabolic acidosis, calculation of the anion gap is required.
Test: Anion gap
• Their presence in increased amounts can be deduced via calculation of the anion gap, which represents the difference between measured strong cations (Na+, K+) and strong anions (Cl–, HCO3–).
• Because electroneutrality must be maintained, this difference is made up of unmeasured weak anions such as albumin, phosphate and metabolic acids, and is usually in the range of 8–16 mmol/L, depending on the albumin concentration.
Test: Mixed venous oxygen saturation (SvO2)
How it is done
• The mixed venous oxygen saturation (SvO2) represents the saturation of blood in the pulmonary artery, sampled from the distal tip of a pulmonary artery catheter.
Interpretation
• Values represent the balance between oxygen content and cardiac output (supply/delivery) and extraction (demand/consumption).
• Under constant oxygen content, changes in SvO2 reflect the relation between whole body oxygen consumption and cardiac output.
• The saturation is normally between 70% and 75%. A normal SvO2 can help to confirm that oxygen delivery (and its primary determinant, cardiac output) is adequate for the body’s total oxygen requirements and hence that perfusion is adequate. A reduced SvO2 represents:
Physiological principles
• SvO2 is a far more sensitive indicator of likely perfusion inadequacy than routine haemodynamic measurements such as heart rate and blood pressure. However, it requires accurate placement of a PA catheter, which may be quite difficult.
• A surrogate measure that is frequently used instead is the mixed central venous oxygen saturation (ScvO2), which represents the saturation of venous blood sampled from the superior vena cava (SVC), via the distal lumen of a central venous catheter.
• Although changes in ScvO2 broadly track changes in SvO2 in both health and illness, the exact relationship between the two values is complex. In health, the SvO2 is slightly higher than the ScvO2 because of the high oxygen consumption of the brain, compared to the rest of the body (ScvO2 represents venous drainage from the head and upper body). During shock states, however, there is physiological diversion of blood from the gut in an attempt to optimize oxygen delivery to more vital organs, making venous blood from the GI tract more desaturated.
Limitations
• Being a global measure, however, a normal value cannot exclude the presence of regional hypoperfusion, e.g. gut ischaemia.
Test: Gastric tonometry and the CO2 gap
• In the early stages of shock, one of the compensatory mechanisms to maintain oxygen delivery to vital organs is the diversion of blood away from less essential organs such as the gut.
• This may cause anaerobic respiration in the gastrointestinal (GI) tract wall, and a commensurate acidosis. The additional H+ ions are buffered by HCO3 to form CO2.
• This increase in CO2 within the GI tract wall equilibrates with the GI tract lumen, and can be detected using a gastric tonometer. This is essentially a saline-filled balloon, which sits within the stomach.
• The CO2 tension within the stomach lumen equilibrates with the saline, which is then repeatedly aspirated and analyzed using a CO2 sensor connected to the tonometry tube. The difference between the gastric CO2 tension and arterial CO2 tension (termed ‘the CO2 gap’) will be proportional to the degree of gut ischaemia present.
• Although this technique has shown efficacy in many small trials, it has yet to be demonstrated in a large, randomized controlled trial that measurement and correction of the CO2 gap improves mortality. However, prevention of the development of a large CO2 gap intraoperatively, by optimizing haemodynamics in an attempt to maintain GI tract perfusion, has been shown to improve perioperative morbidity in certain surgical subgroups.
Other investigations performed in intensive care
Test: Intra-abdominal pressure (IAP)
• Abdominal compartment syndrome is defined as sustained IAP >20 mmHg associated with new organ dysfunction.
| Grade | Intra-abdominal pressure (mmHg) |
|---|---|
| I | 12–15 |
| II | 16–20 |
| III | 21–25 |
| IV | >25 |
Method
• A pressure transducer is inserted via the sampling port of the catheter and zeroed level with the symphysis pubis.