Chapter 2 Integration of Three-Dimensional Echocardiography in Routine Clinical Practice
Introduction
Many advantages to using RT3DE have been shown by a large body of literature within the past 20 years. RT3DE accurately renders volumes that are more comparable with those of magnetic resonance imaging1 because of its ability to obtain nonforeshortened images and semiautomated border detection unconstrained by geometry.2 RT3DE is more accurate than 2DE for analysis of mitral stenosis, particularly the valve area determined by planimetry.3
Three-Dimensional Methodology
Transducer Technology
Several ultrasound vendors offer products with 3D imaging capabilities incorporated into a 2D imaging probe or an independent 3D imaging probe. With advanced electronics, significant miniaturization has resulted in a fully sampled 3D transesophageal echocardiography probe. Obviously, having one integrated 2D-3D transducer is key, particularly when trying to promote an imaging protocol with 3D imaging. However, in systems with separate 2D and 3D transducers, 3D imaging could be performed after the 2D standard protocol is obtained or even prior to the 2D exam (see Chapter 3). Essentially, the balance of spatial resolution and frame rate is more evident in 3DE compared with 2DE.
Three-Dimensional Imaging
Mitral and Aortic Valves
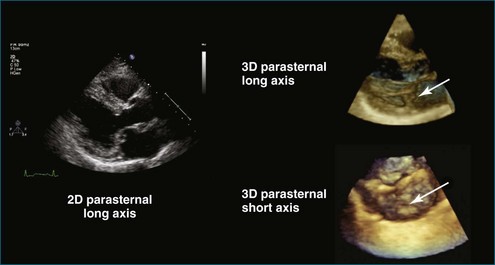
The parasternal long-axis or sagittal view usually is the starting point in most 2DE studies. After obtaining the 2D image, an RT3DE image can be obtained in the same view (Figure 2-1). Typically, adjustments of gain, time-gain compensation, and compression are used to optimize this image. This image can be acquired or used to prepare for zoom imaging of the mitral or aortic valve.
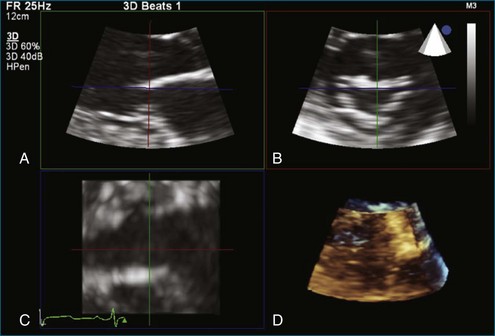
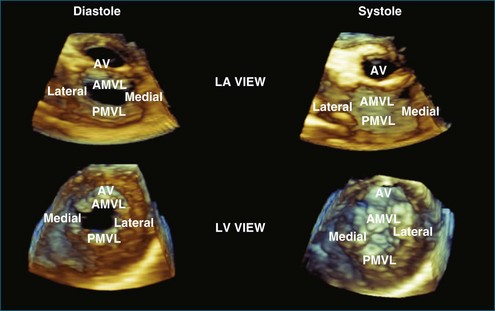
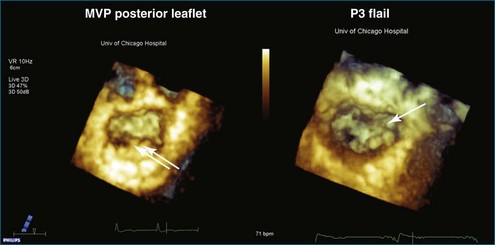
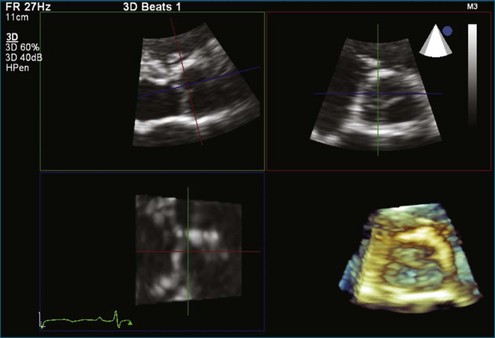
Zoom imaging of the mitral valve is shown in a multiplanar view in Figure 2-2. The RT3DE zoomed view of the mitral valve is displayed from the left atrial and left ventricular views. These views are acquired from one dataset and can be stored for later processing (Figure 2-3). In general, valve structures are shown as if visualized from a surgical perspective and also from a ventricular perspective. In the case of mitral stenosis and mitral valve prolapse, RT3DE imaging provides unique views of this pathology and enables the estimation of the mitral valve area (Figures 2-4 to 2-6).

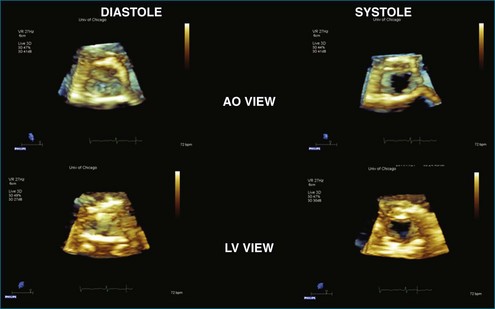
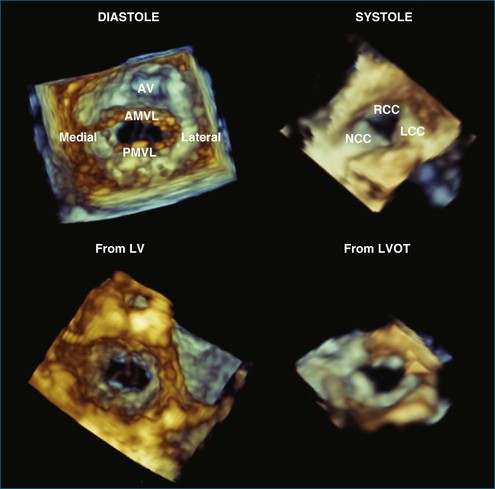
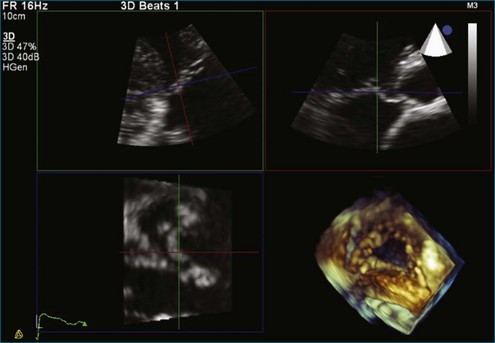
The same imaging mode can be performed on the aortic valve. Figure 2-7 zooms in on the aortic valve from the parasternal window. A multiplanar display of the aortic zoomed dataset demonstrates the parasternal long-axis view (Figure 2-7, upper left), short-axis view (Figure 2-7, upper right), transverse cut (Figure 2-7, lower left), and the RT3DE volume-rendered image (Figure 2-7, lower right), which is cut to display the aortic valve from the aortic side. The aortic valve is displayed from the aortic and left ventricular perspectives (Figure 2-8). Similar views of the aortic and mitral valves may be obtained from an apical window (Figure 2-9).
Tricuspid Valve
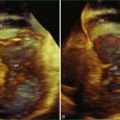
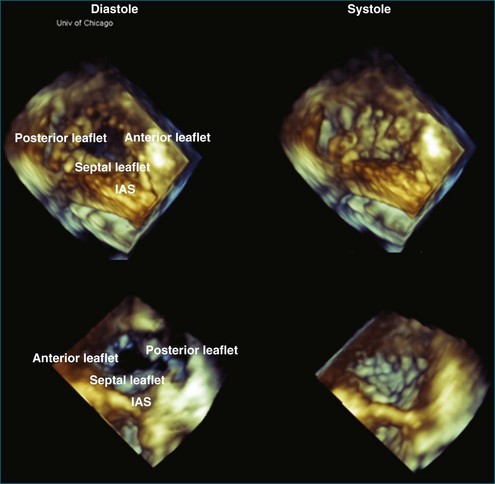
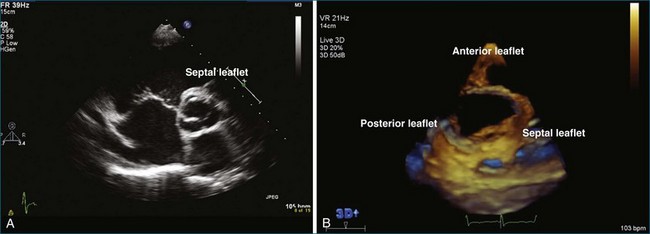
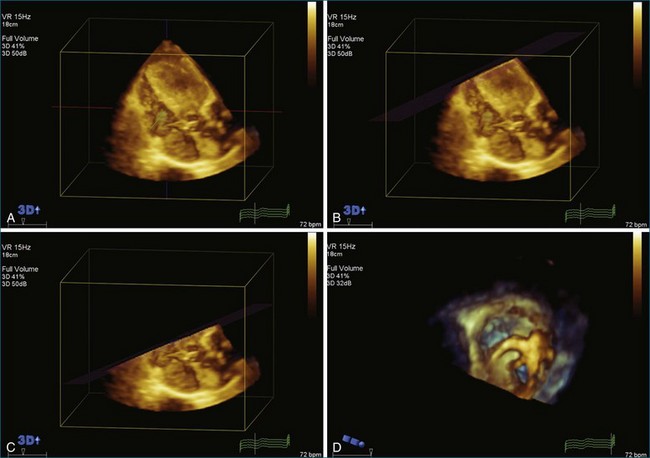
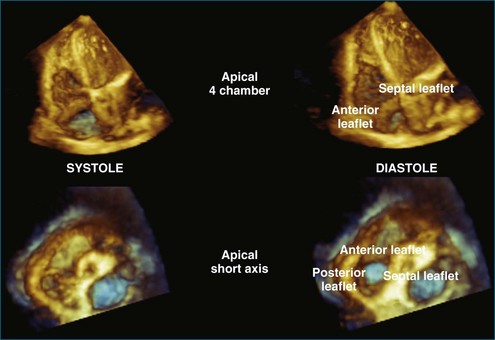
The tricuspid valve can be viewed either from the parasternal long-axis and short-axis views or from the apical view. Capturing the valve from the apical view makes it easier to ensure complete inclusion of the valve. In Figure 2-10, a zoomed image of the tricuspid valve from a parasternal window is shown in a multiplanar display. The tricuspid valve is then displayed from the right atrial and right ventricular views (Figures 2-11 and 2-12; see Videos 2-1 and 2-2).
Left Ventricle
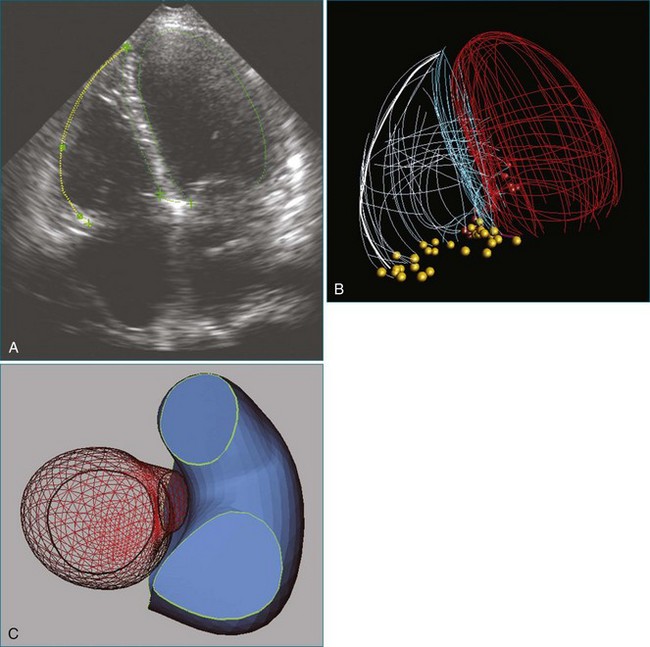
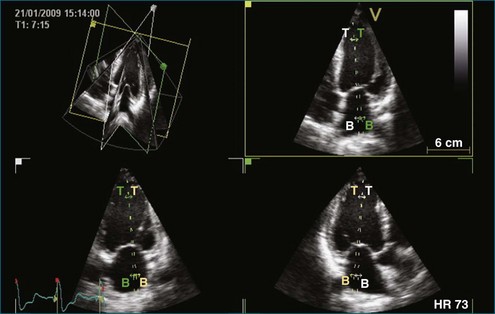
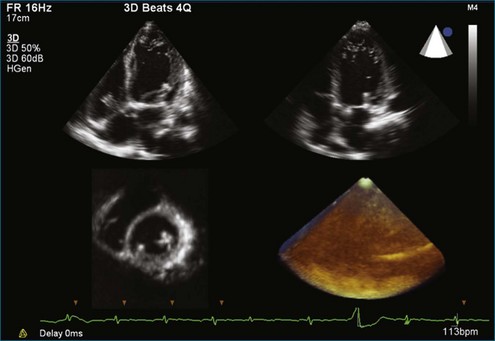
Acquisition of the left ventricle (LV) could be used to display the volume-rendered images of valves and the anatomy of the LV, and to quantitate left ventricular function. Estimation of left ventricular volumes and function may be performed from multiple ventricular views deriving slice planes from the volume dataset (Figure 2-13). Currently, a wide-angled acquisition can be one beat to six beats. A pyramidal volume dataset, two orthogonal views (four-chamber and two-chamber views), and a short-axis view are shown in Figure 2-14.
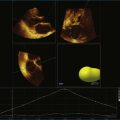
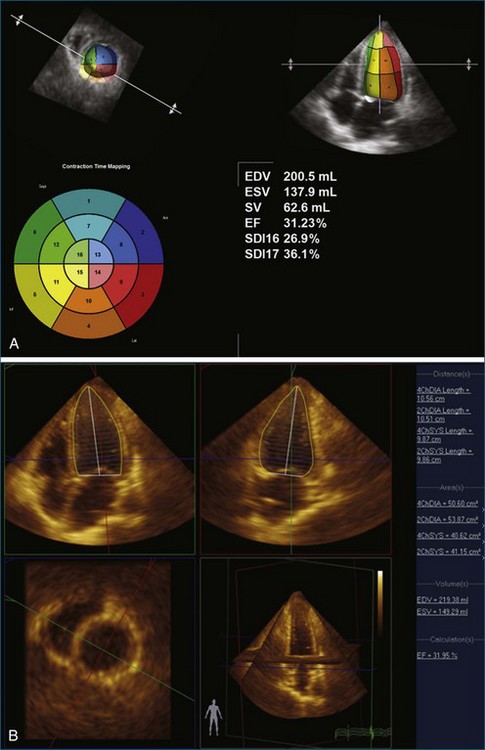
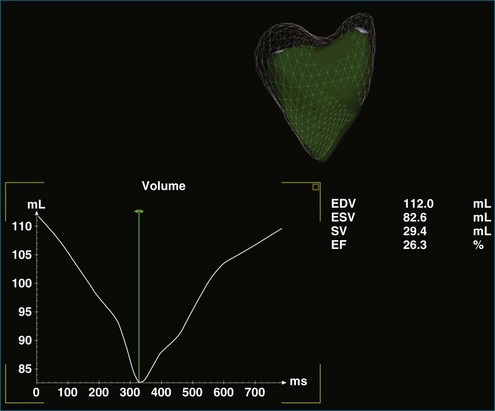
After acquiring the 3D full volume of the LV, this dataset is processed by software to calculate the left ventricular ejection fraction (Figure 2-15). This analysis is demonstrated by two different systems. Note that with both Philips (Andover, MA) (Figure 2-15, A) and TomTec (Munich, Germany) (Figure 2-15, B) analyses of the same dataset, similar ejection fractions of approximately 31.23% (Philips) and 31.95% (TomTec, Inc.) are computed.
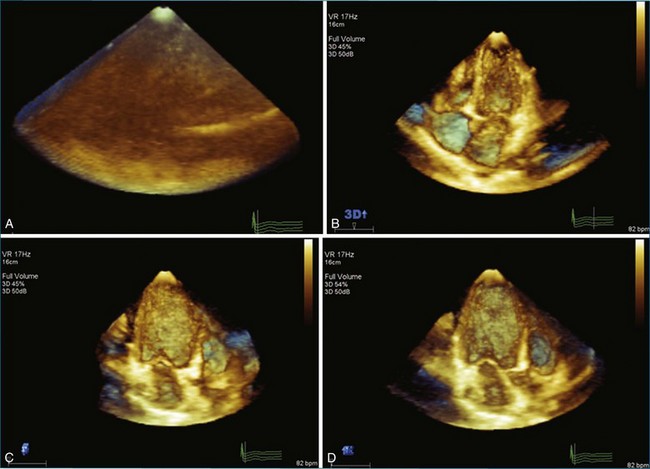
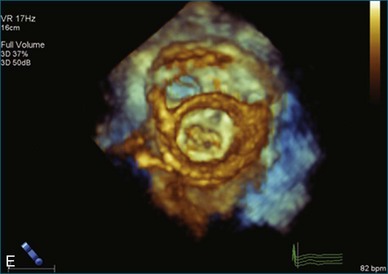
From this apical 3D dataset of the LV (Figure 2-16, A), multiple views can be derived from one full-volume dataset, including a four-chamber view (Figure 2-16, B), two-chamber view (Figure 2-16, C), three-chamber view (Figure 2-16, D), and short-axis view at the level of the mitral valve (lower right, displayed from the left ventricular perspective).
Right Ventricle
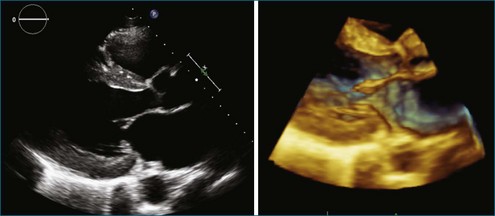
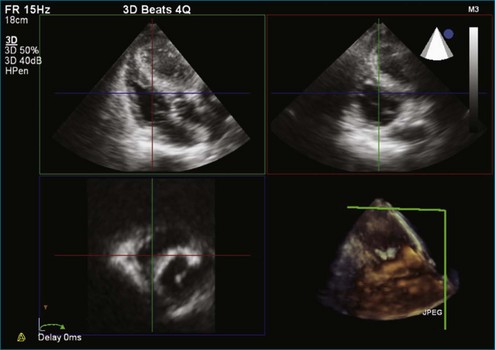
The right ventricle (RV) is acquired slightly differently compared with the LV. It is important to ensure that the right ventricular outflow tract (RVOT) is acquired, as seen in Figure 2-17. The right ventricular volume can be displayed from a four-chamber view. Using a cropping plane angled parallel to the tricuspid valve annulus from the apex, the tricuspid valve leaflets and the RVOT could be better visualized from the ventricular perspective (Figures 2-18 and 2-19).
Color Flow Imaging
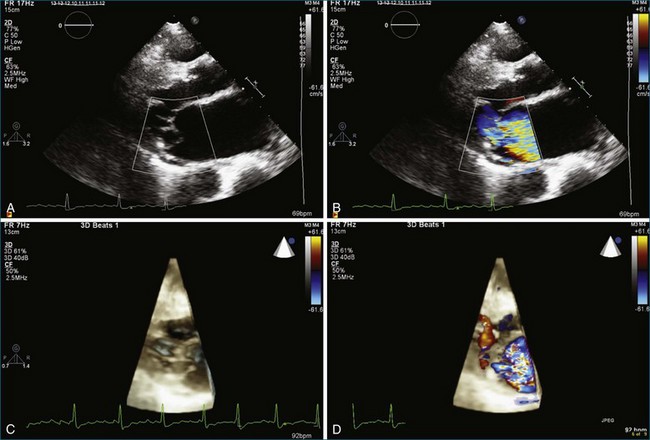
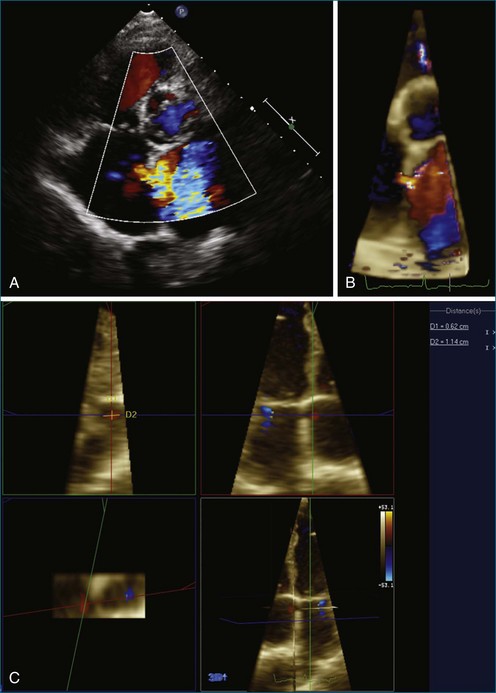
RT3DE color flow imaging has been one of the more challenging aspects of 3DE. There have been efforts to quantitate the severity of mitral and tricuspid regurgitation; however, it has been more research focused and not used in clinical routine. In a patient with mitral regurgitation caused by perforation, RT3DE color flow demonstrates severe mitral regurgitation from the parasternal view in Figure 2-20. Using RT3DE color flow imaging in a patient with an ASD, the size and location of the ASD can be visualized by using a multiplanar display (Figures 2-21 and 2-22).
Integration of Three-Dimensional Technology in A Clinical Routine
Acceptance by and Training of Sonographers and Physicians
There may be two approaches to successfully integrate 3DE into the clinical routine:
1. “Champion” method: Selection of sonographers and physicians who are seen as being the most knowledgeable and dedicated in performing 3DE. Once the selected members are well trained, their knowledge and skill are disseminated to the rest of the group.
2. Group method: Training, education, and implementation of 3DE technology are provided for the entire group.
1 Mor-Avi V, Jenkins C, Kuhl HP, et al. Real-time 3-dimensional echocardiographic quantification of left ventricular volumes: Multicenter study for validation with magnetic resonance imaging and investigation of sources of error. JACC Cardiovasc Imag. 2008;1:413–423.
2 Jenkins C, Moir S, Chan J, et al. Left ventricular volume measurement with echocardiography: A comparison of left ventricular opacification, three-dimensional echocardiography, or both with magnetic resonance imaging. Eur Heart J. 2009;30:98–106.
3 Zamorano J, Cordeiro P, Sugeng L, et al. Real-time three dimensional echocardiography for rheumatic mitral valve stenosis evaluation. J Am Coll Cardiol. 2004;43:2091–2096.