CHAPTER 3 INJURY SEVERITY SCORING: ITS DEFINITION AND PRACTICAL APPLICATION
The urge to prognosticate following trauma is as old as the practice of medicine. This is not surprising, because injured patients and their families wish to know if death is likely, and physicians have long had a natural concern not only for their patients’ welfare but for their own reputations. Today there is a growing interest in tailoring patient referral and physician compensation based on outcomes, outcomes that are often measured against patients’ likelihood of survival. Despite this enduring interest the actual measurement of human trauma began only 50 years ago when DeHaven’s investigations1 into light plane crashes led him to attempt the objective measurement of human injury. Although we have progressed far beyond DeHaven’s original efforts, injury measurement and outcome prediction are still in their infancy, and we are only beginning to explore how such prognostication might actually be employed.
In this chapter, we examine the problems inherent in injury measurement and outcome prediction, and then recount briefly the history of injury scoring, culminating in a description of the current de facto standards: the Injury Severity Score (ISS),2 the Revised Trauma Score (RTS),3 and their synergistic combination with age and injury mechanism into the Trauma and Injury Severity Score (TRISS).4 We will then go on to examine the shortcomings of these methodologies and discuss two newer scoring approaches, the Anatomic Profile (AP) and the ICD-9 Injury Scoring System (ICISS), that have been proposed as remedies. Finally, we will speculate on how good prediction can be and to what uses injury severity scoring should be put given these constraints. We will find that the techniques of injury scoring and outcome prediction have little place in the clinical arena and have been oversold as means to measure quality. They remain valuable as research tools, however.
INJURY DESCRIPTION AND SCORING: CONCEPTUAL BACKGROUND
Injury scoring is a process that reduces the myriad complexities of a clinical situation to a single number. In this process information is necessarily lost. What is gained is a simplification that facilitates data manipulation and makes objective prediction possible. The expectation that prediction will be improved by scoring systems is unfounded, however, since when ICU scoring systems have been compared to clinical acumen, the clinicians usually perform better.4,5
Clinical trauma research is made difficult by the seemingly infinite number of possible anatomic injures, and this is the first problem we must confront. Injury description can be thought of as the process of subdividing the continuous landscape of human injury into individual, well-defined injuries. Fortunately for this process, the human body tends to fail structurally in consistent ways. Le Fort6 discovered that the human face usually fractures in only three patterns despite a wide variety of traumas, and this phenomenon is true for many other parts of the body. The common use of eponyms to describe apparently complex orthopedic injuries underscores the frequency with which bones fracture in predictable ways. Nevertheless, the total number of possible injuries is large. The Abbreviated Injury Scale is now in its fifth edition (AIS 2005) and includes descriptions of more than 2000 injuries (increased from 1395 in AIS 1998). The International Classification of Diseases, Ninth Revision (ICD-9) also devotes almost 2000 codes to traumatic injuries. Moreover, most specialists could expand by several-fold the number of possible injuries. However, a scoring system detailed enough to satisfy all specialists would be so demanding in practice that it would be impractical for nonspecialists. Injury dictionaries thus represent an unavoidable compromise between clinical detail and pragmatic application.

TESTING A TEST: STATISTICAL MEASURES OF PREDICTIVE ACCURACY AND POWER
A final property of a good scoring system is that it is well calibrated, that is, reliable. In other words, a predictive scoring system that is well calibrated should perform consistently throughout its entire range, with 50% of patients with a 0.5 predicted mortality actually dying, and 10% or patients with a 0.1 predicted mortality actually dying. Although this is a convenient property for a scoring system to have, it is not a measure of the actual predictive power of the underlying model and predictor variables. In particular, a well-calibrated model does not have to produce more accurate predictions of outcome than a poorly calibrated model. Calibration is best thought of as a measure of how well a model fits the data, rather than how well a model actually predicts outcome. As an example of the malleability of calibration, Figure 2A and B displays the calibration of a single ICD-9 Injury Severity Score (ICISS) (discussed later), first as the raw score and then as a simple mathematical transformation of the raw score. Although the addition of a constant and a fraction of the score squared add no information and does not change the discriminatory power based on ROC, the transformed score presented in Figure 2B is dramatically better calibrated. Calibration is commonly evaluated using the Hosmer Lemeshow (HL) statistic. This statistic is calculated by first dividing the data set into 10 equal deciles (by count or value) and then comparing the predicted number of survivors in each decile to the actual number of survivors. The result is evaluated as a chi-square test. A high (p>0.05) value implies that the model is well calibrated, that is, it is accurate. Unfortunately, the HL statistic is sensitive to the size of the data set, with very large data sets uniformly being declared “poorly calibrated.” Additionally, the creators of the HL statistic have noted that its actual value may depend on the arbitrary groupings used in its calculation,7 and this further diminishes the HL statistic’s appeal as a general measure of reliability.
The success of a model in predicting mortality is thus measured in terms of its ability to discriminate survivors from nonsurvivors (ROC statistic) and its calibration (HL statistic). In practice, however, we often wish to compare two or more models rather than simply examine the performance of a single model. The procedure for model selection is a sophisticated statistical enterprise that has not yet been widely applied to trauma outcome models. One promising avenue is an information theoretic approach in which competing models are evaluated based on their estimated distance from the true (but unknown) model in terms of information loss. While it might seem impossible to compare distances to an unknown correct model, such comparisons can be accomplished by using the Akaike information criterion (AIC)8 and related refinements.
MEASURING ANATOMIC INJURY

Both the AIS dictionary and the ISS score have enjoyed considerable popularity over the past 30 years. The fifth revision of the AIS9 has recently been published, and now includes over 2000 individual injury descriptors. Each injury in this dictionary is assigned a severity from 1 (slight) to 6 (unsurvivable), as well as a mapping to the Functional Capacity Index (a quality-of-life measure).10 The ISS has enjoyed even greater success—it is virtually the only summary measure of trauma in clinical or research use, and has not been modified in the 30 years since its invention.
Despite their past success, both the AIS dictionary and the ISS score have substantial shortcomings. The problems with AIS are twofold. First, the severities for each of the 2000 injuries are consensus derived from committees of experts and not simple measurements. Although this approach was necessary before large databases of injuries and outcomes were available, it is now possible to accurately measure the severity of injuries on the basis of actual outcomes. Such calculations are not trivial, however, because patients typically have more than a single injury, and untangling the effects of individual injuries is a difficult mathematical exercise. Using measured severities for injuries would correct the inconsistent perceptions of severity of injury in various body regions first observed by Beverland and Rutherford11 and later confirmed by Copes et al.12 A second difficulty is that AIS scoring is expensive, and therefore is done only in hospitals with a zealous commitment to trauma. As a result, the experiences of most non-trauma center hospitals are excluded from academic discourse, thus making accurate demographic trauma data difficult to obtain.
The ISS has several undesirable features that result from its weak conceptual underpinnings. First, because it depends on the AIS dictionary and severity scores, the ISS is heir to all the difficulties outlined previously. But the ISS is also intrinsically flawed in several ways. By design, the ISS allows a maximum of three injuries to contribute to the final score, but the actual number is often fewer. Moreover, because the ISS allows only one injury per body region to be scored, the scored injuries are often not even the three most severe injuries. By considering less severe injuries, ignoring more severe injuries, and ignoring many injuries altogether, the ISS loses considerable information. Baker herself proposed a modification of the ISS, the new ISS (NISS13), which was computed from the three worst injuries, regardless of the body region in which they occurred. Unfortunately, the NISS did not improve substantially upon the discrimination of ISS.
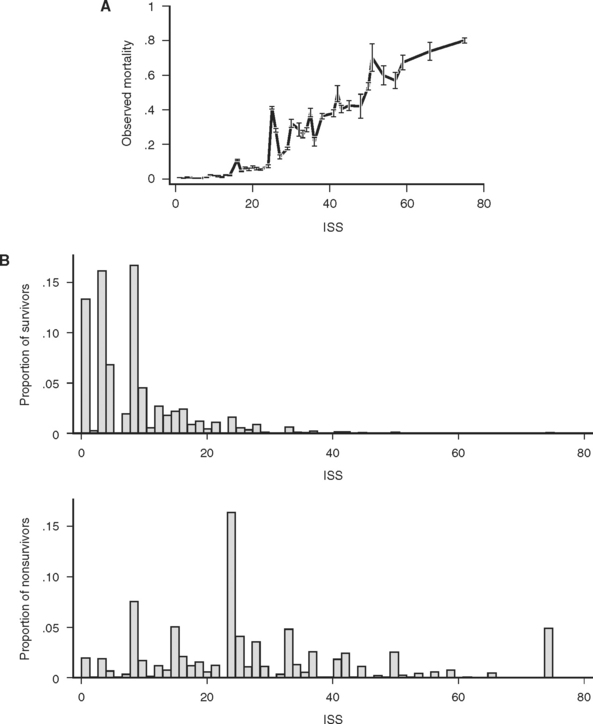
The consequences of these idiosyncrasies for the ISS are severe, as an examination of the actual mortality for each of 44 ISS scores in a large data set (691,973 trauma patients contributed to the National Trauma Data Bank [NTDB]14) demonstrates. Mortality does not increase smoothly with increasing ISS, and, more troublingly, for many pairs of ISS scores, the higher score is actually associated with a lower mortality (Figure 1A). Some of these disparities are striking: patients with ISS scores of 27 are four times less likely to die than patients with ISS scores of 25. This anomaly occurs because the injury subscore combinations that result in an ISS of 25 (5,0,0 and 4,3,0) are, on average, more likely to be fatal than the injury subscore combinations that result in and ISS of 27 (5,1,1 and 3,3,3). (Kilogo et al.15 note that 25% of ISS scores can actually be the result of two different subscore combinations, and that these subscore combinations usually have mortalities that differ by over 20%.)
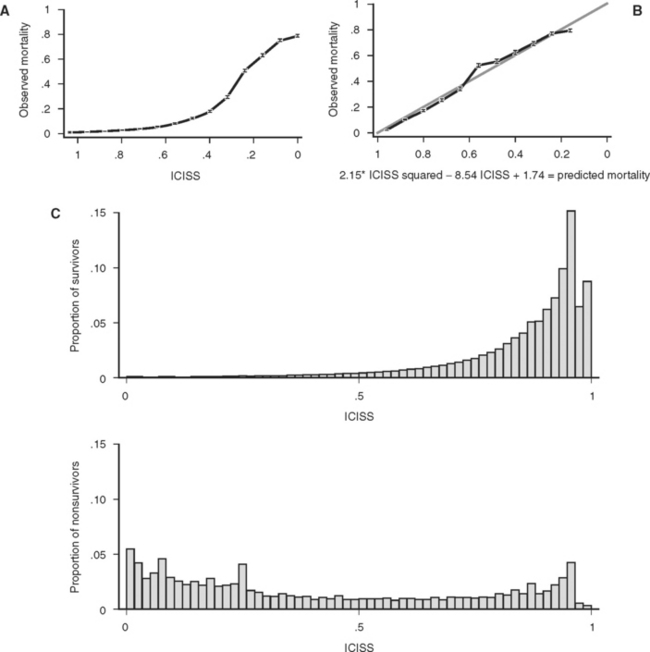
Figure 1 (A) Survival as a function of ICD-9 Injury Scoring System (ICISS) score (691,973 patients from the National Trauma Data Bank [NTDB]). (B) Survival as a function of ICISS score mathematically transformed by the addition of an ICISS2 term (a “calibration curve”). Note that although this transformation does not add information (or change the discrimination [receiver operation characteristic value]) of the model, it does substantially improve the calibration of the model (691,973 patients from the NTDB). (C) ICISS scores presented as paired histograms of survivors (above) and nonsurvivors (691,973 patients from the NTDB).
Despite these dramatic problems, the ISS has remained the preeminent scoring system for trauma. In part this is because it is widely recognized, easily calculated, and provides a rough ordering of severity that has proven useful to researchers. Moreover, the ISS does powerfully separate survivors from nonsurvivors, as matched histograms of ISS for survivors and fatalities in the NTDB demonstrate (Figure 1B), with an ROC of 0.86.
The idiosyncrasies of ISS have prompted investigators to seek better and more convenient summary measures of injury. Champion and coworkers16 attempted to address some of the shortcomings of ISS in 1990 with the AP, later modified to become the modified AP (mAP).17 The AP used the AIS dictionary of injuries, and assigned all AIS values greater than 2 to one of three newly defined body regions (head/brain/spinal, thorax/neck, other). Injuries were combined within body region using a Pythagorean distance model, and these values were then combined as a weighted sum. Although the discrimination of the AP and mAP improved upon the ISS, this success was purchased at the cost of substantially more complicated calculations, and the AP and mAP have not seen wide use.

These empiric “survival risk ratios” were in turn calculated from a large trauma database. ICISS was thus by definition a continuous predictor bounded between 0 and 1. ICISS provided better discrimination between survivors and nonsurvivors than did ISS, and also proved better behaved mathematically: The probability of death uniformly decreases as ICISS increases (Figure 1A), and ICISS powerfully separates survivors from nonsurvivors (Figure 1C). A further advantage of the ICISS score is that it can be calculated from hospital discharge data, and thus the time and expense of AIS coding are avoided. This coding convenience has the salutary effect of allowing the calculation of ICISS from administrative data sets, and thus allows injury severity scoring for all hospitals. A score similar to ICISS but based on the AIS lexicon, Trauma Registry Abbreviated Injury Scale (TRAIS),18 has been described and has performance similar to that of ICISS. Because ICISS and TRAIS share a common structure, it is likely that they will allow comparisons to be made between data sets described in the two available injury lexicons, AIS and ICD-9.
Other ICD-9-based scoring schemes have been developed which first map ICD-9 descriptors into the AIS lexicon,19 and then calculate AIS-based scores (such as ISS or AP). In general, power is lost with such mappings because they are necessarily imprecise, and thus this approach is only warranted when AIS-based scores are needed but only ICD-9 descriptors are available.
Many other scores have been created. Perhaps the simplest was suggested by Kilgo and coworkers,18 who noted that the survival risk ratio for the single worst injury was a better predictor of mortality than several other models they considered that used all the available injuries. This is a very interesting observation, because it seems unlikely that ignoring injuries should improve a model’s performance. Rather, Kilgo’s observation seems to imply that most trauma scores are miss-specified, that is, they use the information present in the data suboptimally. Much more complex models, some based on exotic mathematical approaches such as neural networks20 and classification and regression trees have also been advocated, but have failed to improve the accuracy of predictions.
To evaluate the performance of various anatomic injury models, their discrimination and calibration must be compared using a common data set. The largest such study was performed by Meredith et al.,21 who evaluated nine scoring algorithms using the 76,871 patients then available in the NTDB. Performance of the ICISS and AP were found to be similar, although ICISS better discriminated survivors from nonsurvivors while the AP was better calibrated. Both of these more modern scores dominated the older ISS, however. Meredith and colleagues21 concluded that “ICISS and APS provide improvement in discrimination relative to … ISS. Trauma registries should move to include ICISS and the APS. The ISS … performed moderately well and (has) bedside benefits.”
MEASURING PHYSIOLOGIC INJURY
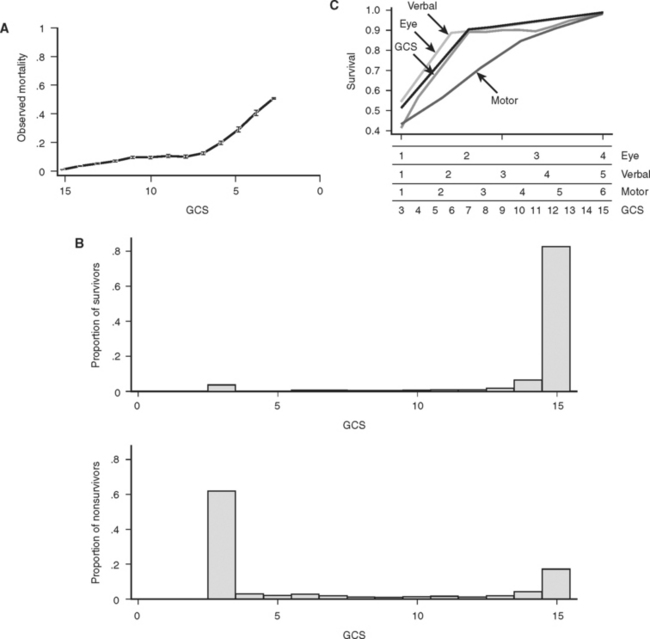
Basic physiologic measures such as blood pressure and pulse have long been important in the evaluation of trauma victims. More recently, the Glasgow Coma Score (GCS) has been added to the routine trauma physical exam. Originally conceived over 30 years ago as measure of the “depth and duration of impaired consciousness and coma,”22 the GCS is defined as the sum of coded values that describe a patient’s motor (1–6), verbal (1–5), and eye (1–4) levels of response to speech or pain. As defined, the GCS can take on values from 3 (unresponsive) to 15 (unimpaired). Unfortunately, simply summing these components obscures the fact that the GCS is actually the result of mapping the 120 different possible combinations of motor, eye, and verbal responses into 12 different scores. The result is a curious tri-phasic score in which scores of 7, 8, 9, 10, and 11 have identical mortalities. Fortunately, almost all of the predictive power of the GCS is present in its motor component, which has a very nearly linear relationship to survival23,24 (Figure 3C). It is likely that the motor component alone could replace the GCS with little or no loss of performance, and it has the clear advantage that such a score could be calculated for intubated patients, something not possible with the three-component GCS because of its reliance on verbal response. Despite these imperfections, the GCS remains part of the trauma physical exam, perhaps because as a measure of brain function, the GCS assesses much more than simply the anatomic integrity of the brain. Figure 3B shows that GCS powerfully separates survivors from nonsurvivors.
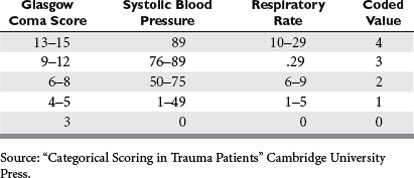
Currently the most popular measure of overall physiologic derangement is the Revised Trauma Score. It has evolved over the past 30 years from the Trauma Index, through the Trauma Score to the RTS in common use today. The RTS is defined as a weighted sum of coded values for each of three physiologic measures: Glasgow Coma Scale (GCS), systolic blood pressure (SBP), and respiratory rate (RR). Coding categories for the raw values were selected on the basis of clinical convention and intuition (Table 1). Weights for the coded values were calculated using a logistic regression model and the Multiple Trauma Outcome Study (MTOS) data set. The RTS can take on 125 possible values between 0 and 7.84:

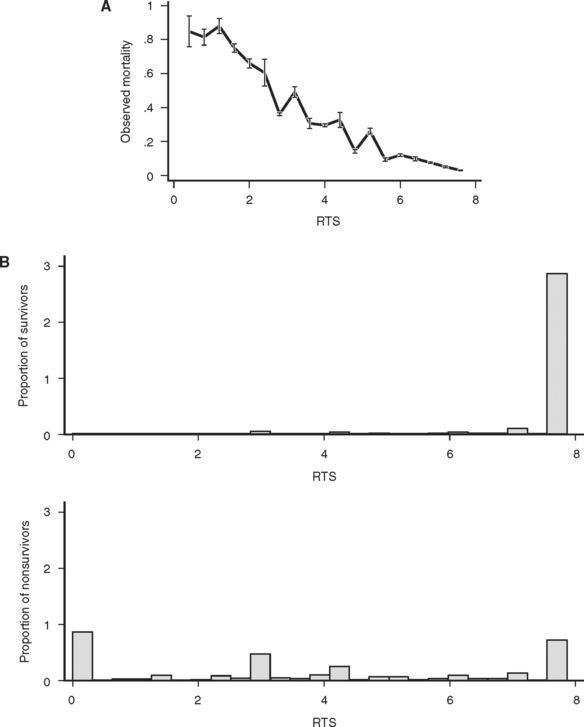
While the RTS is in common use, it has many shortcomings. As a triage tool, the RTS adds nothing to the vital signs and brief neurological examination because most clinicians can evaluate vital signs without mathematical “preprocessing.” As a statistical tool, the RTS is problematic because its additive structure simply maps the 125 possible combinations of subscores into a curious, nonmonotonic survival function (Figure 4A). Finally, the reliance of RTS on the GCS makes its calculation for intubated patients problematic. Despite these difficulties, the RTS discriminates survivors from nonsurvivors surprisingly well (Figure 4B). Nevertheless, it is likely that a more rigorous mathematical approach to an overall measure of physiologic derangement would lead to a better score.
MEASURING PHYSIOLOGIC RESERVE AND COMORBIDITY RISK
Although physiologic reserve depends on more than age, it is difficult to define, measure, and model the other factors that might be pertinent. Certainly compromised organ function may contribute to death following injury. Morris et al.25 determined that liver cirrhosis, COPD, diabetes, congenital coagulopathy, and congenital heart disease were particularly detrimental following injury. Although many other such conditions are likely to contribute to outcome, the exact contribution of each condition will likely depend on the severity of the particular comorbidity in question. Because many of these illnesses will not be common in trauma populations, constructing the needed models may be difficult. Although the Deyo-Charlson scale26 has been used in other contexts, it is at best an interim solution, with some researchers reporting no advantage to including it in trauma survival models.27 As yet no general model for physiologic reserve following trauma is available.
MORE POWERFUL PREDICTIONS: COMBINING SEVERAL TYPES OF INFORMATION
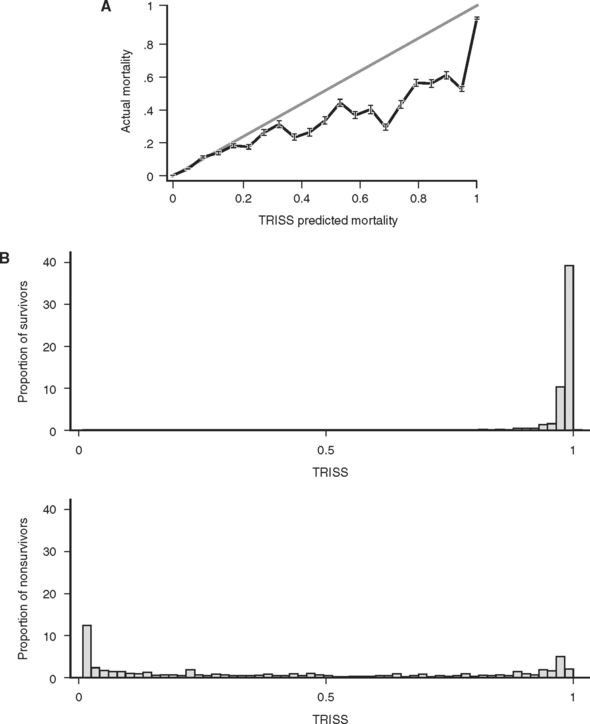
The predictive power of models is usually improved by adding more relevant information and more relevant types of information into the model. This was recognized by Champion et al.28 in 1981, as they combined the available measures of injury (ISS), physiologic derangement (RTS), patient reserve (age as a binary variable: age >55 or ≤55), and injury mechanism (blunt/penetrating) into a single logistic regression model. Coefficients for this model were derived from the MTOS data set.29 Called TRISS (TRauma score, Injury Severity Score age comorbidity index), this score was rapidly adopted and became the de facto standard for outcome prediction. Unfortunately, as was subsequently pointed out by its developers and others,30 TRISS had only mediocre predictive power and was poorly calibrated. This is not surprising, because TRISS is simply the logit transformation of the weighted sum of three subscores (ISS, RTS, GCS), which are themselves poorly calibrated and in fact not even monotonically related to survival. Because of this “sum of subscores” construction, TRISS is heir to the mathematically troubled behavior of its constituent subscores, and as a result TRISS is itself not monotonically related to survival (Figure 5A). Although TRISS was conceived in hopes of comparing the performance of different trauma centers, the performance of TRISS has varied greatly when it was used to evaluate trauma care in other centers and other countries,31,32 suggesting that either the standard of trauma care varied greatly, or, more likely, that the predictive power of TRISS was greatly affected by variation in patient characteristics (“patient mix”). Still another shortcoming is that because TRISS is based on a single data set (MTOS), its coefficients were “frozen in time” (in the context of the likelihood that success of trauma care improves over time). When new coefficients are calculated for the TRISS model, predictions improve, but it is unclear how often such coefficients should be recalculated, or what data set they should be based on. Thus, as a tool for comparing trauma care at different centers, TRISS seems fatally deficient.
In an attempt to address the shortcomings of TRISS, Champion et al. proposed a new score, ASCOT.16 ASCOT introduced a new measure of anatomic injury, the AP (see previous discussion), which was based on AIS severities of individual injuries, but summarized as the square root of the sum of squared injuries within three body regions, which were then weighed and summed. ASCOT also unbundled the RTS and included its newly coded components (GCS, RR, and SBP) as independent predictors in the model. Finally, age was modeled by decile over the age of 55. Despite these extensive and logical alterations, the discrimination of ASCOT only marginally improved over TRISS, and calibration was only slightly improved. Because ASCOT mixed anatomical and physiological measures of injury, the authors were unsure of the source of ASCOT’s modest improvement. The substantial increase in computational complexity further discouraged general adoption of ASCOT.33 While some have advocated abandoning TRISS in favor of ASCOT, the data on which this view is based show no statistical difference in the discrimination of the two scores.34 A difference in calibration was detected, but as we have argued, this is of less importance than discrimination.
STATISTICAL CONSIDERATIONS
Many statistical techniques are available to combine several predictor variables into a single outcome variable. Probably the best known is linear regression, which allows several linear predictor variables to be combined into a single continuous outcome measure. This technique might be appropriate for the prediction of such continuous outcome variables as hospital length of stay or total cost.
The outcome of overriding interest in injury severity scoring is the binary outcome survival/nonsurvival, however, and here logistic regression is the most commonly employed (although not necessarily optimal [Pepe et al.35]) approach. Logistic regression provides a formula that predicts the likelihood of survival for any patient given the values for his or her predictor variables, typically summary measures of anatomic injury, physiologic derangement, and physiologic reserve. This formula is of the form:


and Anat_Inj, Phys_Inj, and Phys_Res are summary measures of anatomic injury, physiologic injury, and physiologic reserve, respectively.
Despite the popularity and advantages of logistic regression, it is by no means the only approach to making a binary prediction from several predictor variables. Techniques such as neural networks and classification and regression trees have also been applied to medical prediction,35,36 but in general prediction of mortality using these approaches is no better than standard logistic regression models.37,38 These newer computer-intensive techniques have the further disadvantage that they are in general more difficult to implement and to explain. Occasional claims of remarkable success for such techniques20 seem to be due to overfitting of the model under consideration rather than dramatically improved predictions. (Overfitting can be thought of as a technique’s “cheating” by memorizing the peculiarities of a data set rather than generalizing the relationship present between predictors and the outcome of interest. An overfit model may perform extremely well with the reference data set, but perform poorly when confronted with new data.)
IMPROVED PREDICTION IN TRAUMA SCORING
How Good Are Current Scoring Systems?
The TRISS model for prediction following trauma is currently the most widely used, and has the theoretic advantage of using information about a patient’s injuries (ISS, blunt/penetrating), physiologic derangement (RTS) and physiologic reserve (age) to reach a prediction. Although all of these inputs to the model are by today’s statistical standards rather unsophisticated descriptions of the factors they are designed to quantify, the final prediction of TRISS on balance powerfully separates survivors from nonsurvivors (ROC = 0.95) (see Figure 5B). Unfortunately, TRISS is not only not linearly related to mortality, it is not even monotonically related to mortality (see Figure 5A), a defect that strongly suggests that TRISS can be improved upon.
The Uses of Injury Scoring
Trauma scoring has also been proposed as a way to evaluate the success of trauma care and thus compare trauma providers (physicians, centers, treatments, or systems). Although the trauma community has long been interested in assessing trauma care,39 the recent claims of the Institute of Medicine40 that as many as 90,000 Americans die yearly as a result of medical errors has accelerated the call for medical “report cards,” and interest in “pay for performance” is building.41 Initially it was hoped that simply comparing the actual mortality with the expected mortality (the sum of the expected mortalities for all patients based upon some outcome prediction model, such as TRISS) for groups of patients would provide a point estimate of the overall success of care provided. Unfortunately, summarizing the success of care has proved more complex than simply calculating the ratio of observed to expected deaths (“O to E ratio”) because there is often substantial statistical uncertainty surrounding these point estimates. More problematic still, when confronted with data for several trauma providers (surgeons, centers, systems), it can be difficult or impossible to determine which, if any, providers actually have better outcomes.42 Advanced statistical methods (e.g., hierarchal models43) are required to address these problems rigorously, but such procedures are not yet easily implemented or widely employed by medical researchers. Some of these difficulties are likely to be resolved by further research into the statistical properties of this kind of data, but currently some statistical researchers in this area recommend that tables of such data simply not be published because they are so likely to be misinterpreted by the public42 or misused by government and other regulatory agencies.44 The unintended consequences of such overzealous use of statistical methods, such as hospitals refusing to care for sicker patients,45 may actually worsen patient care.
It can be argued that even statistically imprecise comparisons between providers can be usefully employed by committed groups of providers to foster discussion and help identify “best practices,” and thus improve care.46 This heuristic approach has occasionally been cited as the source of dramatic reductions in mortality.47,48 However, the exact source of these improvements is uncertain, and it is difficult to guarantee how a ranking, once generated, will be subsequently employed. Tracking the performance of a single provider (surgeon, trauma center, etc.) over time may be a statistically more tractable problem.49 This approach has recently been applied in cardiac surgery,50 but has not yet been applied to trauma care.
Given the uncertainty inherent in comparing the success of trauma care among providers, the American College of Surgeons in its trauma center verification process has wisely eschewed assessment based on outcomes in favor of structure and process measures. This approach, first outlined by Donabedian51 over 25 years ago, advocates the evaluation of structures that are believed necessary for excellent care (physical facilities, qualified practitioners, training programs, etc.) and of processes that are believed conductive to excellent care (prompt availability of practitioners, expeditious operating room access, and postsplenectomy patients’ receipt of OPSI vaccines, among others). Although outcome measures were also included in Donabedian’s51 schema, he recognized that these would be the most difficult to develop and employ.
Recommendations
1 DeHaven H. The Site, Frequency and Dangerousness of Injury Sustained by 800 Survivors of Light Plane Accidents. New York: Cornell University Medical College, 1952.
2 Baker SP, O’Neill B, Haddon W, et al. The injury severity score: a method for describing patients with multiple injuries and evaluating emergency care. J Trauma. 1974;14:187-196.
3 Champion HR, Sacco WJ, Copes WS, et al. A revision of the trauma score. J Trauma. 1989;29:623-629.
4 Kruse JA, Thill-Baharozian MC, Carlson RW. Comparison of clinical assessment with APACHE II for predicting mortality risk in patients admitted to a medical intensive care unit. JAMA. 1988;260:1739-1748.
5 Meryer AA, Messick WJ, Young P, et al. Prospective comparison of clinical judgment and APACHE II score in predicting the outcome in critically ill surgical patients. J Trauma. 1992;32:747-754.
6 Le Fort R. Etude experimental sur les fractures de la machoir supérieure. Parts I, II, III. Revue de chirurgie, Paris. 1901;23:201. 360, 479
7 Hosmer DW, Lemeshow T, LeCessie S, et al. A comparison of goodness-of-fi t tests for the logistic regression model. Stat Med. 1997;16:980-995.
8 Burnham KP, Anderson DR. Model Selection and Multimodel Inference: A Practical Information-Theoretic Approach, 2nd ed. New York: Springer, 2002.
9 Committee on Injury Scaling. The Abbreviated Injury Scale 2005. Des Plains, IL: Association for the Advancement of Automotive Medicine, 2005.
10 Mackenzie EJ, Damiano A, Miller T. The development of the Functional Capacity Index. J Trauma. 1996;41:799-807.
11 Beverland DE, Rutherford WH. An assessment of the validity of injury severity score when applied to gunshot wounds. Injury. 1973;16:19-22.
12 Copes WS, Champion HR, Sacco WJ, et al. The injury severity score revisited. J Trauma. 1988;28:69-77.
13 Osler TM, Baker SP, Long WB. A modifi cation of the injury severity score that both improves accuracy and simplifies scoring. J Trauma. 1997;43:922-926.
14 Committee on Trauma, American College of Surgeons. National Trauma Data Bank, version 4.0. Chicago: American College of Surgeons, 2004.
15 Kilgo PD, Meredith JW, Hensberry R, Osler TM. A note on the disjointed nature of the injury severity score. J Trauma Inj Infect Crit Care. 2004;57:479-487.
16 Champion HR, Copes WS, Sacco WJ, et al. A new characterization of injury severity. J Trauma. 1990;30:539-546.
17 Sacco WJ, MacKenzie EJ, Champion HR, et al. Comparison of alternative methods for assessing injury severity based on anatomic descriptors. J Trauma Inj Infect Crit Care. 1999;47:441-448.
18 Kilgo PD, Osler TM, Meredith JW. The worst injury predicts mortality outcome the best: rethinking the role of multiple injuries in trauma outcome scoring. J Trauma. 2003;55:599-606.
19 MacKenzie EJ, Sacco WJ, et al. ICDMAP-90: A Users Guide. Baltimore: Johns Hopkins University School of Public Health and Tri-Analytics, Inc., 1997.
20 DiRusso SM, Sullivans T, Holly C, et al. An artificial neural network as a model for prediction of survival in trauma patients: validation for a regional trauma area. J Trauma Inj Infect Crit Care. 2000;49:212-223.
21 Meredith WJ, Evans G, Kilgo PD. A comparison of the abilities of nine scoring algorithms in predicting mortality. J Trauma. 2002;53:621-629.
22 Teasdale G, Jennett B. Assessment of coma and impaired consciousness: a practical scale. Lancet. 1974;11:81-83.
23 Jagger J, Jane JA, Rimel R. The Glasgow Coma Scale: to sum or not to sum? Lancet. 1983;ii:97.
24 Healey C, Osler TM, Rogers FB, et al. Improving the Glasgow Coma Scale score: motor score alone is a better predictor. J Trauma Inj Infect Crit Care. 2003;54:671-680.
25 Morris J, MacKenzie E, Edelstein S. The effect of preexisting conditions on mortality in trauma patients. JAMA. 1990;263:1942-1946.
26 Needham DM, Scales DC, Laupacis A. A systematic review of the Charlson comorbidity index using Canadian administrative databases: a perspective on risk adjustment in critical care research. J Crit Care. 2005;20:12-19.
27 Gabbe BJ, Magtengaard K, Hannaford AP, Camron PA. Is the Charlson Comorbidity Index useful for predicting trauma outcomes? Acad Emerg Med. 2005;12:318-321.
28 Champion HR, Sacco WJ, Carazzo AJ, et al. Trauma score. Crit Care Med. 1981;9:672-676.
29 Champion HR, Copes WS, Sacco WJ, et al. The Major Trauma Outcome Study: establishing national norms for trauma care. J Trauma. 1990;30:1356-1365.
30 Gabbe BJ, Cameron PA, Wolfe R. TRISS: does it get better than this? Acad Emerg Med. 2004;11:181-186.
31 Lane PL, Doid G, Stewart TC, et al. Trauma outcome analysis and the development of regional norms. Accid Anal Prev. 1997;29:53-56.
32 Bouillion B, Lefering R, Vorweg M. Trauma score systems: cologne validation study. J Trauma. 1997;42:652-658.
33 Markel J, Cayten CGT, Byrne DW, et al. Comparison between TRISS and ASCOT methods for controlling for injury severity. J Trauma. 1993;33:326-332.
34 Champion HR, Copes WS, Sacco WJ, et al. Improved predictions from A Severity of Characterization of Trauma (ASCOT) over Trauma and Injury Severity Score (TRISS): results of an independent evaluation. J Trauma. 1996;40:42-49.
35 Pepe MS. Evaluating technologies for classification and prediction in medicine. Stat Med. 2005;24:3687-3696.
36 Selker HP, Griffith JL, Patil S, et al. A comparison of performance of mathematical predictive methods for medical diagnosis: identifying acute cardiac ischemia among emergency department patients. J Invest Med. 1995;43:468-476.
37 Terrin N, Schmid CH, Griffith JL, et al. External validity of predictive models: a comparison of logistic regression classification trees and neural networks. J Clin Epidemiol. 2003;56:721-729.
38 DiRusso SM, Sullivan T, Golly C, et al. An artificial neural network as a model for prediction of survival in trauma patients: validation for a regional trauma area. J Trauma Inj Infect Crit Care. 2000;49:212-221.
39 Flora JD. A method for comparing survival of burn patients to a standard survival curve. J Trauma. 1978;18:701-705.
40 Institute of Medicine. To Err is Human: Building a Safer Health System. Washington, DC: National Academy Press, 2000.
41 Roland M. Linking physicians’ pay to the quality of care—a major experiment in the United Kingdom. N Engl J Med. 2004;351:1448-1454.
42 Goldstein H, Spiegelhalter DJ. League tables and their limitations: statistical issues in comparisons of institutional performance. J R Stat Soc A. 1996;159:385-443.
43 Normand ST, Glickman ME, Gatsonis CA. Statistical methods for profiling providers of medical care: issues and applications. J Am Stat Assoc. 1997;92:803-814.
44 Lilford R, Mohammed MA, Spiegelhalter D, Thomson R. Use and misuse of process and outcome data in managing performance of acute medical care: avoiding institutional stigma. Lancet. 2004;363:1147-1154.
45 Burack JH, Impellizzeri P, Homel P, et al. Public reporting of surgical mortality: a survey of New York State cardiothoracic surgeons. Ann Thorac Surg. 1999;68:1195-1200.
46 Glance LG, Osler TM. Coupling quality improvement with quality measurement in the intensive care unit. Crit Care Med. 2005;33:1144-1146. (editorial)
47 O’Connor GT, Plume SK, Olmstead EM, et al. A regional intervention to improve the hospital mortality associated with coronary artery bypass graft surgery. The Northern New England cardiovascular Disease Study Group. JAMA. 1996;275:841-846.
48 Khuri SF, Daley J, Henderson WG. The comparative assessment and improvement of quality of surgical care in the Department of Veterans Affairs. Arch Surg. 2002;137:20-27.
49 Steiner SH, Cook RJ, et al. Monitoring surgical performance using risk-adjusted cumulative sum charts. Biostatistics. 2000;1(4):441-452.
50 Rogers CA, Reeves BC, Caputo M, et al. Control chart methods for monitoring cardiac surgical performance and their interpretation. J Thorac Cardiovasc Surg. 2004;128:811-819.
51 Donabedian A. The Definition of Quality and Approaches to Its Assessment. Ann Arbor, MI: Health Administration Press, 1980.