Initiation, Maintenance, and Weaning from Mechanical Ventilation
I Physiologic Effects of Positive Pressure Ventilation
A Increased mean airway pressure
1. Normally mean airway pressure is slightly negative (below atmospheric) during inspiration (Figure 41-1, A).
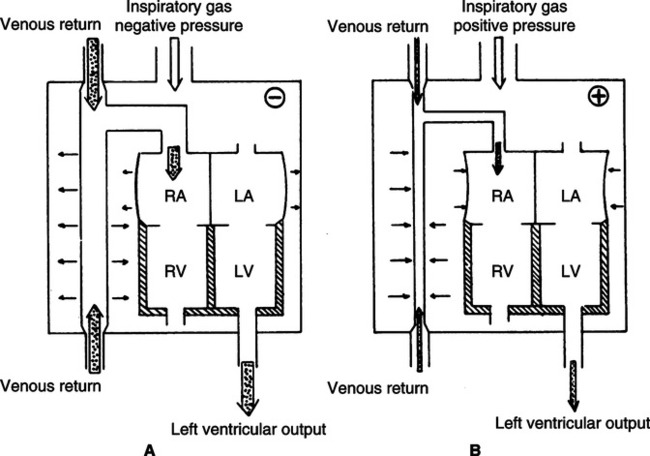
2. Because positive pressure ablates the normal mechanisms for gas movement, intrapulmonary pressures are usually supraatmospheric (see Figure 41-1, B).
3. The extent that intrapulmonary pressure is increased depends on
B Increased mean intrathoracic pressure (see Figure 41-1, B)
1. Transmission of intrapulmonary pressure to the intrathoracic space depends on pulmonary and thoracic compliance. The stiffer the lung, generally the lower the amount of pressure transmitted from the intrapulmonary to the intrathoracic space. In contrast, the stiffer the thorax, the greater the amount of pressure transmitted to the intrathoracic space.
2. In most patients requiring mechanical ventilation, the mean intrathoracic pressure changes from negative to positive.
C Decreased venous return (see Figure 41-1, B)
1. Because intrathoracic pressures become positive with the application of mechanical ventilation, the thoracic pump mechanism assisting venous return is eliminated.
2. As a result the pressure gradient favoring venous flow to the right side of the heart is decreased and right ventricular filling is impaired.
3. Positive pressure, especially positive end-expiratory pressure (PEEP), also increases pulmonary vascular resistance, which decreases right ventricular filling and cardiac output.
4. Positive pressure also increases right ventricular afterload and can result in right ventricular hypertrophy with a shift in the ventricular septum and compromised left ventricular function.
5. However, in patients with left ventricular dysfunction positive pressure may decrease left ventricular afterload, increasing cardiac output and left ventricular function.
6. Frequently the decreased transmural pressure across the vena cava is large enough to require fluid therapy to maintain appropriate right ventricular filling as mechanical ventilation is initially applied.
7. Most patients are hypoxemic, acidotic, and hypercapnic before the institution of mechanical ventilation, which causes an increased sympathetic tone. The normalization of acid-base balance, the relief of hypoxemia, and the decrease in work of breathing (WOB) with mechanical ventilation result in a marked decrease in sympathetic tone. This may result in
1. Because venous return and sympathetic tone are decreased, there is some decrease in cardiac output.
2. With appropriate fluid therapy and pharmacologic support, adequate cardiac output can be maintained.
E Increased intracranial pressure (ICP)
1. Because venous return is decreased, blood pools in the periphery and in the cranium.
2. The increased volume of blood in the cranium increases ICP.
1. Decreased cardiac output results in decreased renal blood flow, which alters renal filtration pressures and decreases urine formation.
2. Decreased venous return and decreased right atrial pressures are interpreted as a decrease in overall blood volume. As a result, antidiuretic hormone levels and natriuretic peptide levels are increased and urine formation is decreased (see Chapters 13 and 14).
1. Because the ventilator provides at least part of the force necessary to ventilate, the patient’s WOB decreases.
2. The amount of work performed by the ventilator and the amount performed by the patient vary, depending on the approach used to ventilate and the actual setting of ventilating parameters.
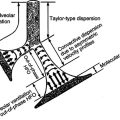
1. Positive pressure causes a mechanical dilation of the conducting airways.
2. The transmural pressure gradients affecting the airways are always greater than during normal spontaneous ventilation.
3. However, intubation usually results in an increase in resistance to flow in the upper airway and puts the patient at risk for contamination of the lower respiratory tract.
I Increased deadspace ventilation
1. Because positive pressure distends conducting airways and inhibits venous return, the portion of the Vt that is deadspace increases.
2. There also is an alteration in the normal distribution of ventilation. A greater percentage of ventilation goes to the apices and less to the bases than in spontaneous ventilation.
3. Normal deadspace/Vt ratios are 0.20 to 0.40; however, mechanical ventilation will cause these ratios to increase to 0.40 to 0.60 in the normal individual.
4. The level of ventilation required by a patient depends on the Paco2, alveolar ventilation, and tissue CO2 production.
< ?xml:namespace prefix = "mml" />
 (1)
(1) (2)
(2) co2 CO2 is CO2 production,
  A is alveolar ventilation,
  E is minute ventilation, Vd is deadspace volume, and Vt is tidal volume.
J Increased intrapulmonary shunt
1. With positive pressure ventilation, gas distribution and pulmonary perfusion are altered.
2. Ventilation to the most gravity-dependent aspects of the lung is decreased, whereas blood flow to these areas is increased.
3. Normal intrapulmonary shunts are approximately 2.0% to 5.0%; however, mechanical ventilation may increase the shunt fraction to approximately 10% in the normal individual.
4. Allowing some level of spontaneous ventilation (triggering the breath) minimizes the ventilation/perfusion mismatch.
K The setting of ventilator parameters may induce hyperventilation or hypoventilation.
L RR, Vt, Ti, and flow rate may all be manipulated.
M Effect on gastrointestinal (GI) tract
1. The stress produced by positive pressure ventilation may lead to increased gastric secretion and gastric bleeding, resulting in the development of stress ulcers.
2. Agents that maintain gastric acidity may be useful to prevent ventilator-associated pneumonia (VAP).
3. Gastric distention does develop in some patients as a result of aerophagia (swallowing of air), requiring the use of a nasogastric tube.
1. Many patients mechanically ventilated develop ventilator-associated pneumonia (VAP).
2. VAP is not a result of the ventilator circuit if appropriate precautions are taken (see Chapter 3).
3. VAP is a result of aspiration of contaminated oral and gastric secretions.
1. Appropriate nutritional support is difficult during mechanical ventilation.
2. Respiratory muscle wasting and an increased risk of pneumonia and pulmonary edema develop if patients are underfed.
3. Ventilatory requirements are increased because of increased CO2 production if patients are overfed.
1. Mechanical ventilation disturbs normal sleep patterns.
2. Sleep deprivation may produce delirium, patient-ventilatory dys-synchrony, and sedation-induced ventilator dependency.
Q Effect on psychologic status: The continued stress associated with mechanical ventilation may result in
II Ventilator-induced Lung Injury
A The application of mechanical ventilation can cause lung injury, referred to as
1. High inhaled oxygen concentrations result in the formation of oxygen free radicals (e.g., superoxide, hydrogen peroxide, and hydroxyl ion).
2. These free radicals cause ultrastructional changes in the lung similar to acute lung injury (ALI).
3. In animal models inhalation of 100% oxygen causes death in 48 to 72 hours.
4. Healthy volunteers breathing 100% oxygen develop inflammatory airway changes in 24 hours.
5. However, concern regarding oxygen toxicity should never prevent the use of a high FIO2 in a patient who is hypoxemic.
6. An FIO2 of 1.0 should always be used
7. But FIO2 should always be lowered as soon as possible to the lowest level maintaining the Pao2 >60 mm Hg.
8. Concerns about oxygen toxicity should not override concerns about tissue hypoxia.
9. Ideally the FIO2 should be maintained ≤0.6 to minimize concerns regarding toxicity.
10. There is some evidence that the presence of severe lung injury provides protection from oxygen toxicity.
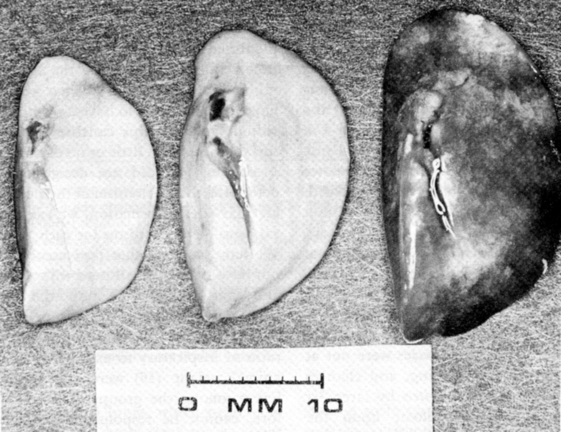
1. Barotrauma is the most acute and immediately severe form of ventilator-induced lung injury.
2. Barotrauma is literally air within a body space or compartment.
3. It is a result of disruption of the alveolar capillary membrane that allows air to dissect along fascial planes and accumulate within the pleural space or some other compartment (Figure 41-2).
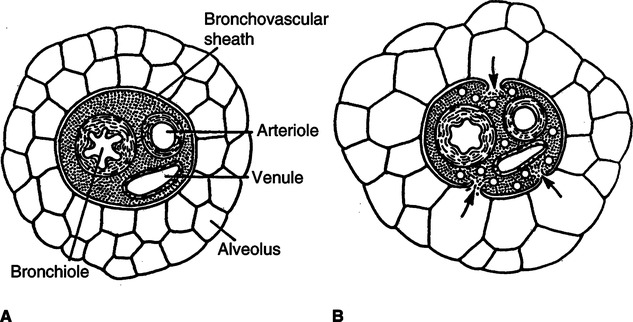
4. The higher the peak alveolar (plateau) pressure and the greater the lung disease, the greater the likelihood of barotrauma.
5. Subcutaneous emphysema is air within the tissue.
6. The development of barotrauma can be minimized by limiting the peak alveolar pressure.
1. Volutrauma is lung parenchymal damage similar in presentation to acute respiratory distress syndrome (ARDS).
2. Volutrauma is a result of localized overdistention of the lung.
3. It is manifested by an increase in the permeability of the alveolar capillary membrane, the development of pulmonary edema, the accumulation of neutrophils and protein, the disruption of surfactant production, the development of hyaline membranes, and a decrease in compliance of the lung.
4. Overdistending volume is best determined by assessing transpulmonary pressure (alveolar-pleural pressure).
a. However, pleural pressure is generally not available in patients requiring mechanical ventilation.
b. The end-inspiratory plateau pressure (Pplat) is clinically the best indicator of overdistention.
c. Pplat in all patients should be maintained <30 cm H2O unless the chest wall is stiff.
d. A stiff chest wall results in a decreased transpulmonary pressure for any given Pplat.
5. Ideally to prevent volutrauma Pplat should be maintained <25 cm H2O in all patients.
6. If the Pplat is <25 cm H2O, Vts of 6 to 10 ml/kg ideal body weight (IBW) can be used.
7. IBW is determined by the following formulas.
 (3)
(3) (4)
(4)8. If the Pplat is 25 to 30 cm H2O Vts should be maintained between 5 and 8 ml/kg IBW.
1. Ventilator-induced lung injury is caused by the recruitment and derecruitment of unstable lung units during each ventilator cycle.
2. Disruption of the alveolar capillary membrane is caused by the stress and strain exerted on the alveolar wall by lung recruitment.
3. The application of 30 cm H2O to an open lung unit can result in the development of approximately 140 cm H2O stress on the wall of the collapsed alveoli adjacent to it.
4. This repeated stress with each breath causes injury.
5. To avoid this form of lung injury adequate PEEP must be applied to avoid the end-expiratory collapse of unstable lung (see Chapter 40) (Figure 41-4).
6. As a general rule the following levels of PEEP should be applied to mechanically ventilated patients.
1. The activation of inflammatory mediators in the lung by the use of an overdistending Vt and repetitive opening and closing of unstable lung units.
2. This can cause inflammatory injury to the lung.
3. There also are good animal data to indicate that cells and other substances can be translocated from the lung to systemic circulation by inappropriate ventilatory patterns, resulting in lung injury.
4. The translocated inflammatory mediators can cause injury to other organs.
5. Clinical studies clearly show that systemic inflammatory mediator levels are decreased by a ventilatory pattern that is lung protective.
6. Many believe that multisystem organ failure can be caused by the use of inappropriate ventilatory patterns.
III Indications for Mechanical Ventilation
A Apnea: The cessation of breathing
B Acute ventilatory failure: A Pco2 of >50 mm Hg and a pH <7.30.
C Impending acute ventilatory failure
1. This is a clinical impression based on serial laboratory data and clinical findings indicating that the patient is progressing toward ventilatory failure.
2. Clinical problems frequently resulting in impending acute ventilatory failure may be categorized as
a. Primary pulmonary abnormalities, such as
b. Secondary (nonpulmonary) abnormalities associated with the inability to effectively ventilate
3. Clinical evaluation of the patient in impending acute ventilatory failure
a. Vital signs: With increased cardiopulmonary stress, pulse and blood pressure typically increase. If bacterial infection is present, temperature also increases.
b. Ventilatory parameters: As WOB increases
c. Paradoxical breathing may occur.
e. Ventilatory reserve is decreased: Vt becomes a greater percentage of vital capacity.
f. Development of impending acute ventilatory failure may demonstrate, for example
(1) Progressive muscle weakness in patients with neuromuscular or neurologic diseases
(2) Continued progress of pulmonary or pleural infections
(3) Increasing fatigue associated with any cardiorespiratory disease. Fatigue can be the primary factor precipitating impending acute ventilatory failure in any disease state.
(4) Serial blood gases demonstrating a trend toward acute ventilatory failure. For example
| 9:00 AM | 10:00 AM | 11:00 AM | 12:00 PM | |
| pH | 7.53 | 7.46 | 7.38 | 7.32 |
| PCO2 (mm Hg) | 28 | 35 | 42 | 48 |
| HCO3− (mEq/L) | 22 | 23 | 24 | 25 |
| PO2 (mm Hg) | 60 | 55 | 50 | 43 |
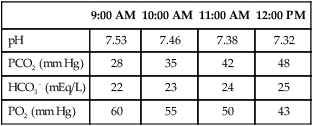
(5) Without intervention to break this trend, a blood gas value measured at 1:00 pm may show a pH of 7.28 and a Pco2 of 54 mm Hg, and at 2:00 pm the pH may be 7.24 and the Pco2 62 mm Hg.
(6) As a result the decision may be made at 12:00 to institute mechanical ventilation because the patient is in impending acute ventilatory failure.
1. An inability to oxygenate without failure to ventilate is an unlikely indication for mechanical ventilation.
2. In most settings oxygenation problems can be managed with oxygen therapy, continuous positive pressure ventilation via mask, and cardiovascular stabilization.
3. However, there are some patients in whom the increased WOB caused by a failure to oxygenate leads to ventilatory failure and the need for intubation and mechanical ventilation.
IV Patient-Ventilatory Synchrony
A A critically important aspect of provision of ventilatory support is ensuring that the patient and ventilator are working in unison, not in opposition.
B The basic interaction between the patient and the ventilator can be described by the equation of motion.
 (5)
(5)C Pe can be written as Vt divided by compliance (C) or
 (6)
(6)D Pr can be written as flow ( ) multiplied by airway resistance (R).
 (7)
(7)E As a result the equation of motion describes the pressure required to deliver a breath as the relationship between Vt, compliance, flow, and resistance.
 (8)
(8)F Pt is generated by the ventilator (P airway), by the patient’s muscular efforts (P muscle), or a combination of both.
 (9)
(9)G During spontaneous unassisted ventilation all of the effort (pressure) needed to deliver a Vt is provided by the patients’ muscular effort, whereas during controlled ventilation (no patient effort), the ventilator provides all of the pressure needed to deliver a Vt.
H During assisted ventilation the patient and the ventilator share the effort needed to deliver a breath.
1. In this setting care must be taken to ensure that the ventilator provides a sufficient Vt and adequate peak flow rate is delivered in an appropriate time to meet the patient’s ventilatory demand.
2. During volume ventilation when patients are sedated and ventilation changes from assisted to controlled, peak airway pressure generally increases because the patient no longer is providing muscular effort assisting in gas delivery.
3. During pressure ventilation Vt decreases when the transition is made from assisted to controlled ventilation for the same reason.
I Patient-ventilator dys-synchrony occurs primarily when the following ventilator parameters do not meet the patient’s ventilatory demand or are not set properly.
J As discussed in detail in Chapter 40, auto-PEEP also contributes to dys-synchrony.
K Trigger sensitivity (see Chapter 39) should always be set as sensitive as possible without causing auto-triggering. Flow triggering is usually more effective than pressure triggering.
1. Figure 41-5 illustrates the effect of an inadequate peak inspiratory flow rate on patient effort.
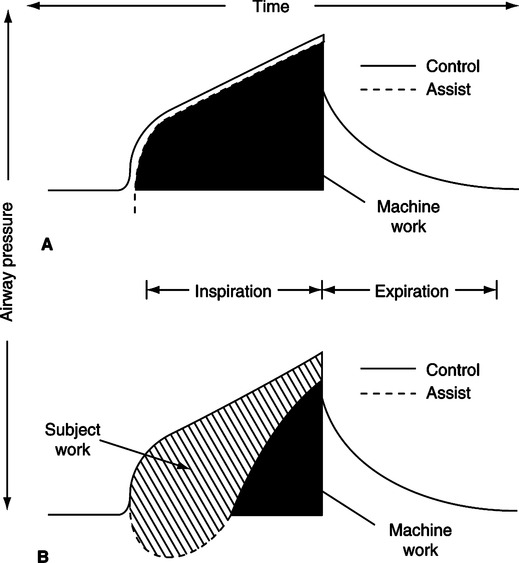
2. The ideal relationship between patient effort and ventilator response to a volume-targeted breath is depicted in Figure 41-5, A. The airway pressure versus time curve during assisted ventilation should be the same as that during controlled ventilation except for the pressure decrease to trigger the ventilator.
3. The greater the difference between these two curves, the greater the WOB performed by the patient.
4. In Figure 41-5, B, the dotted line is the airway pressure curve during assisted ventilation, and the hatched area between the solid and dotted lines represents the work done by the patient. The greater the area, the greater the patient work.
5. Any time the airway pressure curve is concave or not matching the idealized curve, the patient is performing much of the WOB.
6. By increasing the peak inspiratory flow, patient work can be minimized.
a. Figure 41-6 illustrates the impact of increasing peak flow and decreasing Ti on the airway pressure curve and patient WOB.
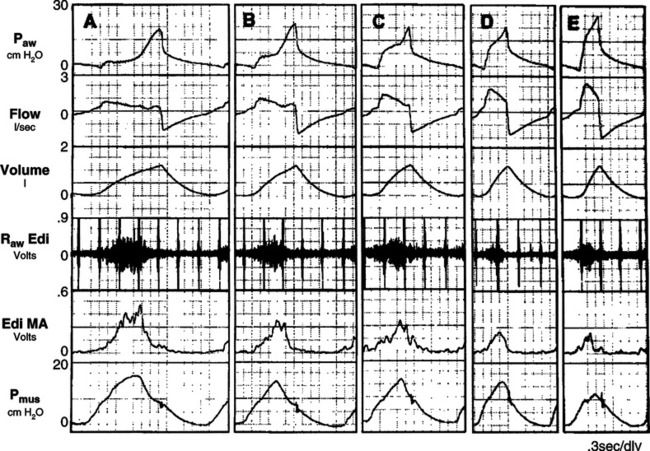
b. As you go from left to right in Figure 41-6, patient effort decreases because peak flow increases.
c. In most adults receiving assisted volume-targeted ventilation, peak flows ≥80 L/min are needed to meet patient demand.
1. Essentially two waveforms are available during volume-targeted ventilation.
2. With square wave flow, gas flow is constant throughout inspiration.
3. With decelerating flow, gas flow peaks at the onset of inspiration and decreases as inspiration continues.
4. During assisted ventilation a decelerating flow pattern generally is most useful because it allows a high initial peak flow to meet patient demand but decelerates over time, ensuring that Ti will be long enough to match patient demand.
5. With a decelerating flow pattern compared with a square wave flow pattern
6. During controlled ventilation either a square or decelerating flow pattern can be used.
N Ti should always match the patient’s desired Ti.
1. In most patients a Ti of ≤1.0 second is most appropriate.
2. Some markedly stressed patients desire a Ti as short as 0.6 second.
3. Patients with chronic restrictive lung disease may desire a Ti of 0.5 second.
4. Regardless of the use of pressure or volume ventilation, Ti during patient-triggered ventilation should always match the patient’s desired Ti.
1. The average resting Vt of all mammals is approximately 6.0 ml/kg IBW.
2. As a result patients requiring ventilatory support if not stressed should also require an actual delivered Vt of approximately 6.0 ml/kg IBW.
3. However, the Vt desired by many patients is greater because of an increased ventilatory demand.
4. As discussed in Section II, Ventilator-Induced Lung Injury, the greater the Vt, the greater the potential for end-inspiratory overdistention. As a result Vt should be related to Pplat.
1. As discussed in Chapter 39, pressure ventilation is better able to meet the ventilatory demands of the stressed patient than volume ventilation.
2. Because flow delivery in pressure ventilation increases as demand increases, adequate flow is provided unless the pressure level is too low.
3. With pressure ventilation adjustments of the following may be needed to ensure synchrony.
4. Pressure level may be either too high or too low.
a. In patients with a small Vt and rapid rate, pressure may need to be increased; however, rise time and inspiratory termination criteria should also be evaluated.
b. In some patients the pressure level may force too large a Vt. Decreasing the Vt may improve synchrony.
5. Rise time should be adjusted to allow a rapid increase in inspiratory pressure to the set level but no increase in pressure beyond the level set (see Chapter 39).
6. Inspiratory termination criteria (pressure support only) should be set to ensure the patient and ventilator end the breath at the same time (see Chapter 39).
Q Auto-PEEP can cause marked dys-synchrony.
1. As noted in Figure 41-7 the greater the auto-PEEP level, the greater the likelihood that the patient will not trigger the ventilator with each of his or her inspiratory efforts.
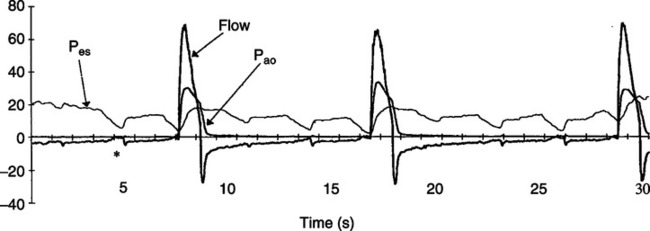
2. In those with chronic obstructive pulmonary disease (COPD; dynamic airway obstruction) the application of PEEP can minimize triggering effort and improve patient-ventilator synchrony.
3. Refer to Chapter 40 for details.
A Ideally the blood gases of all patients mechanically ventilated should be equal to textbook normal values.
B However, the cost in relationship to ventilator-induced lung injury may be excessive.
C As a result, in many patients target blood gas values are different from textbook normal values.
D As an overall guideline Pao2 levels in critically ill patients should be maintained ≥60 to 70 mm Hg, and in some patients with severe ARDS a Pao2 of >50 mm Hg may be acceptable.
E In COPD patients Paco2 should always be maintained at the patient’s “baseline” level.
1. This is the level defined by the patient’s ability to spontaneously ventilate.
2. If COPD patients are ventilated to normal Paco2 levels (35 to 45 cm H2O) they will not be able to wean from ventilatory support because they cannot generate the muscular effort without ventilator assistance needed to maintain arterial Paco2 at normal levels.
3. In many COPD patients Paco2 is maintained between 50 and 80 mm Hg.
F In patients with ARDS and especially in patients with asthma, permissive hypercapnia may be unavoidable.
1. Permissive hypercapnia is the setting of the ventilator in a manner that allows the Paco2 to increase above normal (50 to 100 mm Hg).
2. Permissive hypercapnia is allowed because the cost from a ventilator-induced lung injury perspective is too high to maintain the normal Paco2 (i.e., the Pplat has exceeded 30 cm H2O, the Vt is >6 ml/kg IBW, and the rate is increased to the level that auto-PEEP begins to develop).
3. A number of physiologic effects are attributed to permissive hypercapnia.
a. Shift in the oxyhemoglobin dissociation curve to the right
c. Stimulation and depression of the cardiovascular system
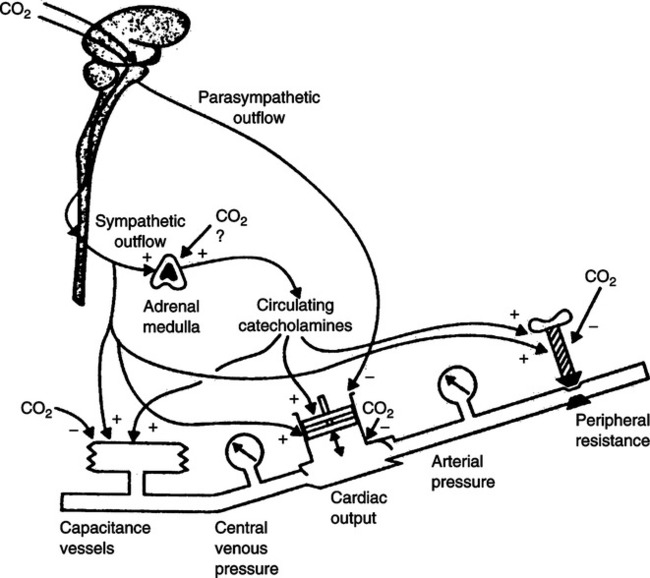
d. Central nervous system depression
h. Anesthesia (Paco2 >200 mm Hg)
i. Decreased renal blood flow (Paco2 >150 mm Hg)
j. Leakage of intracellular potassium (Paco2 >150 mm Hg)
k. Alteration in the action of pharmacologic agents (a result of intracellular acidosis)
4. Permissive hypercapnia is best tolerated in patients with
5. The major limiting factor to permissive hypercapnia is acidosis.
6. Patients can tolerate marked increases in Paco2 if not associated with marked acidosis.
7. Most young patients and those without cardiovascular disease can tolerate a pH of approximately 7.20 without cardiovascular problems.
8. However, the more compromised the cardiovascular system, the less likely a patient will tolerate acidosis.
9. Permissive hypercapnia is contraindicated in the patient with increased ICP.
10. In some patients the systemic administration of buffers may be indicated to control the acidosis.
A Ventilate with bag and mask, and then establish an artificial airway.
B Attach patient to the ventilator and adjust settings (see Section VII, Determination of Setting on the Ventilator).
C Stabilize the cardiovascular system.
1. Before manual ventilation the patient’s sympathetic tone is pronounced because of
2. Because manual ventilation and mechanical ventilation inhibit venous return and typically reverse hypercarbia, acidosis, and hypoxemia, a decreased sympathetic tone results. This may result in hypotension when manual or mechanical ventilation is instituted.
3. The use of narcotics may also add to the hypotensive state.
4. Fluid therapy may be essential during ventilator commitment (see Chapter 14).
5. Some patients also may require the use of sympathomimetics for β1 effects (see Chapter 17).
E Institute appropriate cardiovascular and pulmonary monitors.
VII Determination of Settings on the Mechanical Ventilator
A In all patients mechanically ventilated the following issues are always of concern regardless of the reason for ventilatory support.
1. Ventilator-induced lung injury (see Section II, Ventilator-Induced Lung Injury)
2. Patient-ventilatory synchrony (see Section IV, Patient-Ventilator Synchrony)
3. Target blood gases (see Section V, Target Blood Gases)
4. Cardiovascular stability especially at the onset of invasive mechanical ventilation
B Ventilator management of COPD (see Chapter 21)
a. The primary concern is auto-PEEP (see Chapter 40).
b. Secondary issues are gas delivery and insurance of patient-ventilator synchrony.
c. Target blood gases should be equal to the patient’s normal values.
d. Weaning: COPD patients are some of the most difficult patients to wean. Some require a long course of weaning/rehabilitation, whereas others become ventilator dependent.
2. Initial ventilator settings (Box 41-1)
a. Always consider noninvasive ventilation as the initial approach to ventilatory support (see Chapter 43).
b. Select settings that minimize dys-synchrony.
c. Pressure-targeted modes are preferred over volume-targeted modes.
d. Use PEEP to offset auto-PEEP and ensure triggering with each spontaneous breath.
e. Minimize auto-PEEP by maintaining the lowest minute ventilation required.
a. Pco2 greater than patient “baseline”: Increase Vt if plateau <25 cm H2O, and if Pplat ≥25 cm H2O increase rate unless auto-PEEP develops. If auto-PEEP increases, focus attention on improving bronchial hygiene.
b. Pco2 below patient’s baseline, decrease rate and then Vt unless Pplat is >25 cm H2O, then decrease Vt first.
c. Manage Pao2 by altering FIO2 unless the acute exacerbation is compounded by ALI or ARDS.
a. Key issue is rest for the first 24 to 72 hours.
b. Patient should be able to trigger the ventilator, but ventilator settings should ensure work is performed by the ventilator.
d. Assess ability to spontaneously ventilate (see Section IX, Weaning and Ventilator Discontinuation).
e. Some require rehabilitation and long-term ventilatory support.
f. Patients physiologically appearing ready for ventilator discontinuation but repeatedly failing spontaneous breathing trials should be considered for extubation to noninvasive positive pressure ventilation (NPPV).
C Ventilator management of ARDS (see Chapter 23)
a. The primary concern is inducing greater lung injury by the process of mechanical ventilation. Ventilation should always be provided in a lung-protective manner.
2. Initial ventilator setting (Box 41-2)
a. Use lung protective ventilator settings.
b. After initial stabilization hemodynamically, recruit the lung.
c. Set PEEP after recruitment at the level maintaining the benefit of lung recruitment (see Chapter 40).
d. Appropriately sedate to ensure conformance with small Vt.
a. These maneuvers are the short-term application of an increased airway pressure to open those parts of the lung that are collapsed.
b. Clearly there is a potential for injury, and careful monitoring is required; however, the short-term application of pressure up to approximately 45 cm H2O does not seem to cause lung injury.
c. Recruitment maneuvers are applied because the collapsed lung
(1) Requires increased Pplat to ventilate
(2) Requires increased FIO2 to oxygenate
(3) Decreases surfactant function
(4) Increases the likelihood of the development of pneumonia
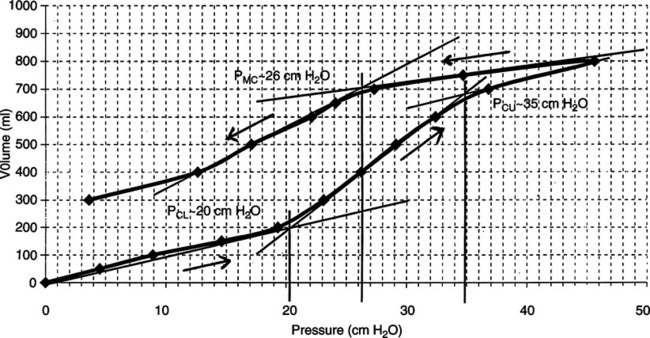
d. The desired outcome of a recruitment maneuver is the movement of the lung from the inflation to the deflation limb of the pressure-volume curve of the lung. This results in a larger lung volume at any PEEP level (Figure 41-9).
e. For recruitment maneuvers to be most effective they should be performed
(1) On the first or second day of ventilatory support
(2) Only after hemodynamic stability is established
(3) They appear to be more successful in patients with secondary versus primary ARDS.
f. The safest and most successful recruitment maneuvers use high continuous positive airway pressure (CPAP) levels for short periods.
g. Before a recruitment maneuver is applied the patient should be
h. During the maneuver a respiratory therapist, nurse, and physician should carefully monitor the patient. Guidelines should be set defining when the maneuver should be terminated because of lack of tolerance. Typical guidelines could be
i. Change the ventilator mode to CPAP; no ventilation is provided during this recruitment maneuver.
(1) A CPAP level of 30 cm H2O for 30 to 40 seconds can be used first to determine patient tolerance.
(2) If tolerated hemodynamically the CPAP level can be increased to 35 or 40 cm H2O.
(3) Maximum CPAP level recommended is 45 cm H2O.
(4) Some patients may require two or three recruitment maneuvers. However, between maneuvers patients should be ventilated and allowed to stabilize for 15 to 20 minutes before a second maneuver is performed.
j. Lung recruitment maneuvers are generally contradicted if the patient is/has
k. After the lung recruitment maneuver, set PEEP at the lowest level maintaining the benefits of the maneuver.
l. The best approach to achieve this is the use of a decremental PEEP trial (see Chapter 40).
m. Regardless of approach used if the patient loses the benefit of the maneuver after a short time, the PEEP level was too low and needs to be increased.
a. Paco2 should be managed by alteration in rate unless the Pplat is <25 cm H2O, then Vt may be increased.
a. Target Paco2 levels are generally 35 to 50 mm Hg, but many patients require permissive hypercapnia because of high Pplat.
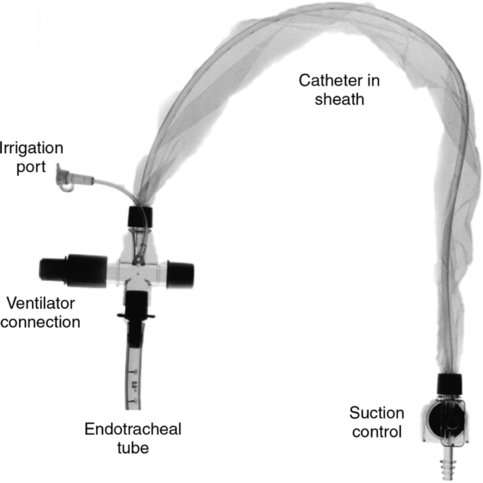
b. In-line suction catheters should be used, and the ventilator should not be disconnected because collapse of lung units occurs in seconds in ARDS patients.
c. If the ventilator is disconnected, the lung may need to be rerecruited.
d. As the patient’s status improves his or her mode can be changed to pressure support.
e. Spontaneous breathing trials should be used to determine when mechanical ventilation should be discontinued.
f. Patients with ALI generally require 8 to 12 cm H2O PEEP, and those with ARDS require 12 to 16 cm H2O PEEP.
D Ventilator management of asthma (Box 41-3)
a. As with COPD auto-PEEP is the primary concern.
b. However, contrary to COPD, in patients with asthma airway obstruction is observed during inspiration and expiration.
c. The increased airway resistance in patients with asthma is fixed compared with the dynamic obstruction observed only during exhalation in those with COPD.
d. As a result it is as difficult to deliver a Vt as it is for patients with asthma to exhale.
e. PEEP is not normally recommended to offset auto-PEEP in those with asthma. Applied PEEP in asthma patients is generally additive to auto-PEEP, increasing the total PEEP level.
f. Measurement of auto-PEEP is also a problem in those with asthma. As illustrated in Figure 41-10 some areas of the lung may be totally obstructed at end exhalation, preventing the pressures from being averaged when auto-PEEP is determined by an end-expiratory pause.
g. It is better to use Pplat to monitor auto-PEEP level in patients with asthma. If Pplat increases (provided Vt is constant), auto-PEEP has increased, and if Pplat decreases, auto-PEEP level has decreased.
h. As with ARDS patients ventilator-induced lung injury is a major concern in those with asthma.
i. Pplat should always be kept as low as possible and always <30 cm H2O.
j. However, peak pressures (volume ventilation) will need to be high (sometimes 70 to 80 cm H2O) to provide the driving pressure to deliver a Vt.
k. A high driving pressure is not desirable, but most of the pressure is dissipated in the endotracheal tube (ETT) and large airways and does not affect the lung parenchyma.
l. Without a high driving pressure, asthma patients cannot be ventilated.
m. Because of the difficulty in ventilating patients with severe asthma, permissive hypercapnia is unavoidable.
n. In many patients Paco2 is 60 to 90 mm Hg or higher for the first 24 hours or longer.
o. For patients with asthma the cost to maintain a normal Paco2 far exceeds the benefits.
p. Most asthma patients can tolerate a high Paco2, provided the pH is ≥7.20 and they have a normally functioning cardiovascular system.
2. Initial ventilator settings (see Box 41-3)
a. In patients with asthma, volume assist/control is frequently the only mode that can effectively ventilate patients and still maintain a low Pplat.
b. Because of the high inspiratory resistance Ti may need to be approximately 1.0 to 1.5 seconds to ensure gas is able to distribute in the lung.
c. RR should be set based on the development of auto-PEEP. A balance between minimum auto-PEEP and Paco2 must be established.
d. Ideally a low rate with long expiratory time minimizes auto-PEEP.
e. The factor most affecting auto-PEEP is minute ventilation. The lower the minute ventilation, the lower the auto-PEEP.
a. Little change in the level of mechanical ventilation is necessary because as pharmacology decreases the severity of the asthmatic attack and auto-PEEP decreases, Paco2 also decreases.
b. As patients improve, the rate can be increased and the Ti decreased to assist in normalizing the Paco2.
c. FIO2 should be adjusted to maintain the Pao2 >60 mm Hg and decreased as the patient’s status improves.
a. The key issue is the use of bronchodilators and steroids to manage the severe asthma.
b. As the patient improves he or she can be changed to pressure support.
c. However, as patients improve and sedation is decreased, many poorly tolerate the ETT.
d. Most asthma patients are simply extubated after their lung function has improved and sedation is decreased.
E Ventilator management of cutaneous burns/inhalation injury
a. Patients with burn/inhalation injury require ventilation because of:
b. Inhalation injury patients may develop high levels of auto-PEEP because of inflammation, bronchospasm, and the inhibition of mucociliary transport.
2. Initial ventilatory settings (Box 41-4)
a. If there are no inhalation injuries ventilation is fairly straightforward unless the patient has severe thoracic burns that decrease chest wall compliance as they heal. If this is the case
b. Patients with inhalation injury frequently develop ARDS.
c. However, management is complicated by the fact that air trapping and auto-PEEP also are common.
d. Ventilator settings should be similar to ARDS, but care should be taken to ensure that air trapping is not increased by the application of PEEP.
a. Permissive hypercapnia is a necessity for some patients because of the competing effects of auto-PEEP and ARDS.
b. For those patients with stiff chest walls it is possible to allow Pplat to exceed 30 cm H2O because of decreased chest wall compliance.
c. Oxygenation is managed by a combination of PEEP and FIO2.
d. PEEP level should be maximized if ARDS is present.
e. If carboxyhemoglobin >10%, maintain 100% oxygen.
f. If no ARDS is present, manage a decreased Po2 with increasing FIO2.
F Ventilator management of chest trauma
a. Blunt chest trauma can result in
(1) Rib and sternum fractures resulting in a flail chest
(2) Pulmonary contusion developing into ARDS
(3) Tracheobronchial injury resulting in disruption of the airway (fistula formation)
b. Penetrating chest injuries frequently result in pneumothorax and extensive tissue damage.
2. Initial ventilator settings (Box 41-5)
a. Most patients will not be capable of breathing spontaneously because of sedation and pain control; as a result the assist/control mode (pressure preferred) is indicated.
b. As with all patients Pplat should be <30 cm H2O to avoid the development of additional lung injury.
c. PEEP level used varies considerably depending on level of lung injury.
d. In patients with ALI/ARDS apply PEEP as in ARDS patients.
e. In patients with large air leaks 0 to 5 cm H2O PEEP should only be applied to avoid excessive air leak. However, if these patients develop ARDS higher PEEP levels are necessary.
a. In most patients Paco2 is easily managed by changes in RR.
b. However, in patients with ARDS and especially in those with large air leaks permissive hypercapnia may be necessary.
c. Oxygenation is managed usually by adjustment of FIO2.
d. However, if ARDS develops PEEP should be adjusted as discussed in the management of ARDS.
G Ventilatory management of head trauma
a. Head trauma results in an increase in ICP because of the fixed size of the skull.
b. Increased ICP results in a decreased cerebral perfusion pressure (CPP).
c. CPP is defined as the difference between MAP and ICP.
 (10)
(10)e. CPP <60 mm Hg is associated with poor outcome in patients with acute head trauma.
f. A normal response to an acute increase in ICP is hypertension and bradycardia; this is referred to as the Cushing response.
2. Initial ventilator settings (Box 41-6)
a. Most patients are treated with controlled ventilation because of the need for sedation to control ICP.
b. If no lung injury is present it is easy to maintain ventilatory support with Vt 6 to 10 ml/kg IBW and rates 15 to 20 breaths/min.
c. Patients with lung injury should be treated as ARDS patients.
d. PEEP is 0 to 5 cm H2O if no lung injury.
e. However, if head of the bed is elevated 30 degrees, patients tolerate up to 10 cm H2O PEEP or higher without increasing ICP.
f. In patients with ARDS risks versus benefits of an elevated PEEP level on ICP must be balanced.
a. Patients should not be hyperventilated except for acute management of an increase in ICP. Paco2 of 25 to 35 mm Hg constricts cerebral vasculature and decreases ICP.
b. Sustaining hyperventilation results in renal compensation and a return of pH to normal, negating the effect of the decreased Paco2.
c. Paco2 should be maintained at approximately 35 mm Hg.
d. Oxygenation is primarily managed by FIO2; ideally Pao2 should be 80 to 100 mm Hg to ensure adequate cerebral oxygenation.
e. In patients with ARDS, PEEP and FIO2 are titrated to manage Pao2.
a. Manage as discussed until ICP returns to normal.
b. If patients have an intact ventilatory drive they may be changed to pressure support.
c. Many patients require low-level ventilatory support for lengthy periods because of poor ventilatory drive even after ICP normalizes.
d. However, once ventilatory drive has normalized and stabilized, patients wean rapidly.
H Ventilatory management of postoperative respiratory failure
a. Surgeries that involve the thoracic or abdominal cavities result in impairment of ventilatory function
b. As a result lung volume can decrease 20% to 30% after thoracic or cardiac surgery and up to 60% with upper abdominal surgery.
2. Initial ventilator setting (Box 41-7)
a. If previous COPD ventilate as COPD.
b. If the patient develops ARDS ventilate as ARDS.
c. If no previous pulmonary disease or complications ventilation is fairly straightforward.
I Ventilatory management of neuromuscular disease
a. Respiratory failure is a result of muscular weakness.
b. Recovery is frequently slow, requiring a lengthy ventilatory course.
c. However, ventilation is straightforward because of the absence of lung disease.
J Ventilatory management of chronic restrictive pulmonary disease
a. Primary concern is the decrease in respiratory system compliance.
b. This requires a small Vt and a rapid rate.
c. Patients generally also have a marked increase in ventilatory demand.
2. Initial ventilatory settings (Box 41-9)
a. In some patients noninvasive ventilation should be initially used.
b. Ti is short: 0.5 to 0.8 second.
c. RRs are rapid: 20 to 35 breaths/min.
d. As with all patients with restrictive pulmonary disease concerns regarding Pplat exist.
a. As with COPD ventilatory muscle rest is essential before weaning is successful.
b. Many patients with pulmonary fibrosis are end stage and may become ventilator dependent.
c. Patients with chest wall deformities frequently require nocturnal NPPV after extubation.
d. Care should always be exercised to avoid excessive work during assisted ventilation.
K Ventilator management of cardiac disease
a. During unassisted breathing the negative intrathoracic pressure facilitates venous return.
b. However, if the myocardium is compromised as in a recent myocardial infarction or congestive heart failure, the markedly negative intrathoracic pressure associated with vigorous breathing results in
c. Stressed ventilatory muscles consume up to approximately 40% of the cardiac output, limiting blood flow to other organs.
d. As a result positive pressure, because it increases mean intrathoracic pressure, may have a beneficial effect on cardiac output since it
e. However, if the patient is hypovolemic positive pressure will further compromise hemodynamics unless hypovolemia is managed properly.
f. Positive pressure has the greatest negative impact on the cardiovascular system when pulmonary compliance is normal but chest wall compliance is decreased because venous return is markedly decreased.
g. The effects an increase in intrathoracic pressure has on hemodynamics are a result of the combined effects of
2. Initial ventilator settings (Box 41-10)
a. In patients with congestive heart failure with pulmonary edema noninvasive CPAP is first-line therapy.
b. If congestive heart failure with pulmonary edema is associated with hypercapnia, NPPV is the initial treatment of choice.
c. However, if the presentation of congestive heart failure is complicated by myocardial infarction, intubate and invasively ventilate.
d. Sedation of intubated patients is necessary to establish hemodynamic stability. Marked ventilatory efforts add to hemodynamic instability.
a. Oxygenation should be managed by a combination of PEEP and FIO2 adjustment.
b. If pulmonary edema persists with good vascular volume, increasing PEEP may improve oxygenation and myocardial function.
c. Pao2 should be maintained at approximately 80 to 100 mm Hg if possible.
d. Ventilation can usually be managed by adjustment of rate.
L Ventilatory management of drug overdose
a. The length of ventilatory support depends on the specific drug ingested.
2. Initial ventilatory settings (Box 41-11)
a. Ventilator settings are relatively straightforward.
b. If aspiration has occurred, management may need to be similar to that of ARDS.
VIII Monitoring the Patient/Ventilator System
A Monitoring the patient and the functions of the ventilator should be performed as frequently as the clinical situation dictates. Most patient/ventilator systems should be evaluated every 4 hours. However, the highly unstable patient may require hourly or continuous evaluation.
B The patient’s response to mechanical ventilation should be the primary focus of the evaluation.
1. Determine spontaneous RR and heart rate.
3. If hemodynamic monitoring is used, evaluate all available parameters.
4. Record peak pressure and Pplat.
5. Assess patient/ventilator synchrony.
a. Ensure all patient inspiratory efforts trigger a breath.
b. Ensure patient Ti and ventilator Ti are equal.
c. Ensure the patient and the ventilator end the breath at the same time.
d. Ensure gas delivery meets patient inspiratory demand.
e. Ensure Spo2 (pulse oximetry saturation) is ≥90% to 92%.
f. Evaluate patient compliance and resistance when indicated, usually in long-term ventilator-dependent patients (see Chapter 5).
g. Arterial blood gases need to be evaluated once a day unless the patient is unstable.
(1) Changes in PEEP and FIO2 can be evaluated by Spo2.
(2) Changes in level of ventilation may not require immediate blood gas evaluation, and changes in hemodynamics may be sufficient to evaluate response.
h. Patients with airflow obstruction or rapid rates should have auto-PEEP levels evaluated with each assessment.
IX Ventilator Discontinuation/Weaning
A The disease process necessitating ventilatory support should be reversed.
B No active acute pulmonary disease process should be present.
C Vital signs should be stable.
1. Fever even if not of pulmonary origin
2. Tachycardia and hypertension are indicative of increased level of stress.
3. Bradycardia and hypotension, possibly indicating a lack of myocardial reserves and poor peripheral perfusion
D Nutritional status should be optimized (see Chapter 24)
1. This is of particular concern if patients have been ventilated for a lengthy period and have a chronic underlying disease process.
2. If a patient is receiving hyperalimentation, it may be preferable to delay ventilator discontinuance until hyperalimentation is complete.
a. This is particularly true if all nonprotein calories are administered as carbohydrates.
b. When lipids are not administered, the respiratory quotient for the conversion of carbohydrates to lipids is >8.0.
c. As a result, the patient’s CO2 production is markedly increased.
d. Patients with marginal cardiopulmonary reserves may not be able to meet the demands of ventilator discontinuance when coupled with an increased CO2 load.
E Adequate cardiovascular reserves
G Intact central nervous system
H Normally functioning GI tract
I Proper electrolyte and fluid balance (see Chapter 14)
1. Electrolyte abnormalities may result in muscular weakness. Specifically the following electrolytes should be normal.
J Adequate gas exchange capabilities
K Adequate ventilatory capabilities
1. Numerous indexes have been proposed to identify ventilatory capabilities.
2. However, none of these indexes is capable of accurately identifying all patients who will wean from ventilatory support.
3. The following have been shown to indicate in some patients the ability to breathe spontaneously.
a. Vital capacity: >10 ml/kg body weight
b. Maximum inspiratory pressure (MIP)
c. Spontaneous RR: <35 breaths/min
d. Rapid shallow breathing index (RSBI): <105 (RR divided by Vt in liters) is the best of these indexes but is still problematic.
g. Deadspace to Vt ratio (Vd/Vt): <0.5
h. Percent intrapulmonary shunt: <15%
j. Maximum voluntary ventilation (MVV): >2 times minute ventilation
1. The transition from mechanical ventilation to spontaneous ventilation produces a great deal of anxiety in some patients. This is particularly evident in patients ventilated for more than several days.
2. To relieve some of the anxiety
a. Carefully explain the procedure in detail.
b. Attempt to develop the patient’s confidence by reinforcing the improvement noted in their disease process.
c. Assure patients that they will be continually monitored throughout the time they are ventilating spontaneously and that you will respond to their needs.
d. Do not tell patients they will never need the ventilator again.
(1) If this is done and ventilatory support must be reestablished, it is not uncommon for patients to lose confidence in themselves and the medical team caring for them.
(2) It is more appropriate to inform patients that their capability of ventilating spontaneously is going to be evaluated. If they are ventilating adequately, they will be allowed to continue; however, if they deteriorate clinically, mechanical ventilation will be reinstituted.
1. Spontaneous breathing trials
a. The patient is removed from ventilatory support placed on a T piece or left attached to the ventilator with no ventilatory support and CPAP set at zero.
b. The patient’s cardiorespiratory response is monitored for 30 to 120 minutes on unassisted breathing. If none of the following are observed for a sustained period, the patient is considered ready for ventilator discontinuation.
(3) Pulse: >140 beats/min or 20% increase
(4) Arterial blood pressure: ≥20% change; systolic, >180; and diastolic, >90
c. Note that Paco2 is not part of the above assessment.
(1) Paco2 is a late indicator of failure.
(2) Changes in ventilatory status and vital signs are more indicative of ability to withstand the stress of ventilation than Paco2.
(3) In many patients Paco2 may be normal, but physiologic stress is marked.
d. In patients who fail an initial spontaneous breathing trial and who have auto-PEEP because of airway obstruction, 5 cm H2O CPAP may be applied during the trial.
e. In patients with nasal intubation or small for their size ETTs, 5 to 7 cm H2O pressure support may be applied during the spontaneous breathing trial.
f. If a patient fails a spontaneous breathing trial, the patient should be placed on appropriate ventilatory support to rest.
g. Spontaneous breathing trials generally need only be applied daily.
2. Decreasing levels of pressure support
a. With this approach pressure support is slowly decreased over time.
b. When 2 to 4 hours of ventilatory support can be tolerated with a pressure support level of 5 to 7 cm H2O, the patient is considered weaned.
c. The same variables indicating failure of a spontaneous breathing trial are used to indicate failure of a pressure support wean.
3. Decreasing synchronized intermittent mandatory ventilation (SIMV) rate
a. The SIMV rate is decreased 2/min as tolerated every 2 to 4 hours.
b. When the SIMV rate is equal to 4/min and can be tolerated for 2 to 4 hours the patient is considered ready for extubation.
c. The same variables indicating failure of a spontaneous breathing trial are used to indicate failure of an SIMV weaning trial.
N The most successful approach to weaning patients is the spontaneous breathing trial.
1. Other approaches to weaning prolong the ventilatory course.
2. Regardless of the indication for ventilatory support or the length of ventilatory support, a spontaneous breathing trial should be used to assess readiness for discontinuation of ventilatory support.
O Protocolized weaning from ventilatory support
1. This is a well-defined set of criteria that are followed in assessment of the patient’s status, in the performance of a spontaneous breathing trial, and in the discontinuation of ventilatory support.
2. All protocols should define a specific level of assessment daily.
3. Patient’s meeting the assessment criteria are placed on a daily spontaneous breathing trial.
4. Those passing the trial are extubated unless there was a reason to not extubate.
P More than 80% of all ventilated patients can be rapidly discontinued from ventilatory support with the first spontaneous breathing trial.
Q Approximately 18% to 19% of patients require a series of spontaneous breathing trials over a number of days before ventilator discontinuation.
R Approximately 1% of all ventilated patients require a lengthy period of weaning from ventilatory support.
1. Even these patients are weaned by spontaneous breathing trial.
2. However, they require multiple days of successful 12 to 16 hours of unassisted spontaneous breathing before they are allowed to go 24 hours without ventilatory support.
3. These patients also frequently require extensive rehabilitation to successfully wean.
4. However, some of these patients will remain ventilator dependent.
5. Patients remain ventilator dependent for a physiologic reason. One or more of the concerns outlined in Section IX. A to L are the reasons why patients fail to wean from ventilatory support.