[level-membership-for-obstetrics-gynecology-category]
Chapter 32 Infertility
FACTORS IN INFERTILITY
The factors that may be involved in the couple’s infertility vary depending on local conditions, the population investigated and the referral procedures. Analyses reported by several clinics of large numbers of patients in the past two decades are given in Table 32.1. In a quarter of cases, more than one of the factors is believed to be involved.
| Factor | Percentage of Cases |
|---|---|
| Male | |
| Defective sperm production, insemination difficulties | 30–40 |
| Female | |
| Ovulation factors | 5–25 |
| Tubal or uterine factors | 15–25 |
| Cervical/immunological factors | 5–10 |
| Unexplained after investigations | 10–25 |
INVESTIGATION OF INFERTILITY
Seminal analysis
Standards for a normal seminal specimen have been developed by the World Health Organization (WHO) and are shown in Box 32.1. If the first seminal appraisal is abnormal, two further specimens should be evaluated before a prognosis is made. The most important predictors of male fertility are the percentage of motile sperm, the quality of the motility of the sperm, the motile sperm concentration, the total motile count and the sperm morphology. The absolute count is not a good predictor.
Box 32.1 Normal seminal analysis
| Volume | >2 mL |
| Sperm concentration | >20 million per mL |
| Total sperm count | 40 million |
| Motility 60 min after ejaculation | >50% with normal progression |
| Morphology | >30% with normal morphology |
When the sperm count is less than 20 million per mL, abnormal morphology and motility is often found
Investigating the woman
Factors that may delay or prevent fertility in women are:
These factors require to be investigated in the work-up of infertility.
Ovulation
Anovulation is obvious if the woman is amenorrhoeic, and may occur in women who have normal menstrual periods. The investigation of anovulation is discussed in Chapter 28.
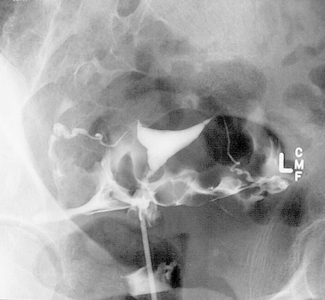
Tubal factors
The patency of the Fallopian tubes can be evaluated in three ways:
Cervical hostility
TREATMENT OF INFERTILITY
Infertility in women
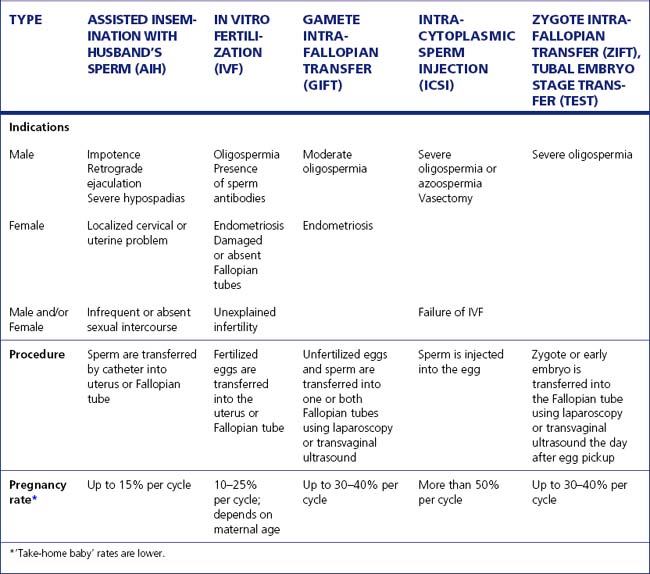
Assisted reproductive technologies
These technologies, that is, IVF and its variants (Table 32.2), have added a new dimension to the treatment of infertility. In the past decade considerable advances have been made in reducing the pain involved, the invasiveness of the procedure and the cost. The procedure is as follows:
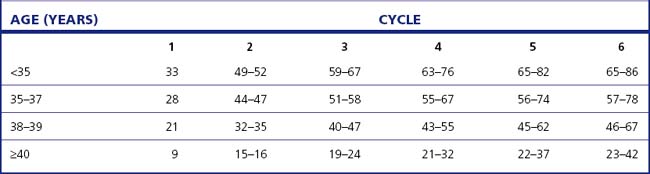
The calculation of the success rates of IVF procedures is complex because couples who have not been successful early in treatment cycles may not return for further treatment. The ‘take-home baby’ rates stratified by age are shown in Table 32.3.
Success rate of treatment
Four couples in every 10 treated for infertility will have a ‘take-home baby’, in most cases thanks to treatment, but about 20% of cases cannot be attributed to the treatment. The success rate for the treatment of various infertility factors is shown in Table 32.4.
| Proportion of All Cases of Infertility (%) | Pregnancy Rate† (%) | |
|---|---|---|
| Male: | ||
| Azoospermia | 7 | 65 (using DI) |
| Oligospermia | 25 | 30 |
| Female: | ||
| Amenorrhoea | 7 | 90 |
| Other ovulatory | 14 | 60 |
| Tubal damage | 16 | 20 |
| Endometriosis (severe) | 2 | 30 |
| Uterine abnormalities | 1 | 70 |
| Male–female (immunological) | 5 | 15 |
| Unexplained | 23 | 60 |
PSYCHOSOCIAL PROBLEMS ASSOCIATED WITH INFERTILITY
[/level-membership-for-obstetrics-gynecology-category][not-level-membership-for-obstetrics-gynecology-category]
Chapter 32 Infertility
FACTORS IN INFERTILITY
The factors that may be involved in the couple’s infertility vary depending on local conditions, the population investigated and the referral procedures. Analyses reported by several clinics of large numbers of patients in the past two decades are given in Table 32.1. In a quarter of cases, more than one of the factors is believed to be involved.
| Factor | Percentage of Cases |
|---|---|
| Male | |
| Defective sperm production, insemination difficulties | 30–40 |
| Female | |
| Ovulation factors | 5–25 |
| Tubal or uterine factors | 15–25 |
| Cervical/immunological factors | 5–10 |
| Unexplained after investigations | 10–25 |
INVESTIGATION OF INFERTILITY
Seminal analysis
Standards for a normal seminal specimen have been developed by the World Health Organization (WHO) and are shown in Box 32.1. If the first seminal appraisal is abnormal, two further specimens should be evaluated before a prognosis is made. The most important predictors of male fertility are the percentage of motile sperm, the quality of the motility of the sperm, the motile sperm concentration, the total motile count and the sperm morphology. The absolute count is not a good predictor.
Box 32.1 Normal seminal analysis
| Volume | >2 mL |
| Sperm concentration | >20 million per mL |
| Total sperm count | 40 million |
| Motility 60 min after ejaculation | >50% with normal progression |
| Morphology | >30% with normal morphology |
When the sperm count is less than 20 million per mL, abnormal morphology and motility is often found
The semen analysis is traditionally graded as:
[/not-level-membership-for-obstetrics-gynecology-category]
