[level-membership-for-cardiovascular-category]
5 Implantable Sensors for Rate Adaptation and Hemodynamic Monitoring
Sensors for Rate-Adaptive Pacing
 Basis of Sensor-Driven Pacing
Atrioventricular (AV) synchrony enhances cardiac output by augmenting the stroke volume by 20% to 30% during exercise. However, this increase is relatively small compared with the threefold to fourfold increase achieved by an increase in heart rate. The relative contribution of AV synchrony and rate increase in patients with complete AV block was studied in dual-chamber (DDD) and a rate-matched ventricular pacing (VVI) mode.1 At rest, the cardiac output during DDD pacing was 18% higher than during VVI pacing because of AV synchrony. During exercise, however, the net cardiac output was only 8% higher during DDD pacing compared with VVI pacing at an identical rate. An equivalent exercise capacity was reported in another study,2 and both DDD and rate-matched VVI pacing were superior to fixed-rate VVI pacing during exercise. Cardiac output was similar in the two modes at near-maximal exercise, but at lower workload levels, cardiac output was maintained by an increased arteriovenous oxygen saturation difference and arterial lactate level. In addition, systolic and mean blood pressures were lower when exercise was performed without AV synchrony. These findings suggest that rate response is the primary driver for exercise cardiac hemodynamics, with a much smaller contribution of AV synchrony.
Exercise Response in Heart Failure
In a patient with heart failure, because the left ventricular (LV) filling pressure is elevated and the heart is working at the flat portion of the Frank-Starling curve, an increase in heart rate is the most important means to increase the cardiac output. In a study of 22 patients with poor LV function and implanted rate-adaptive pacemakers, the benefit of rate adaptation to exercise capacity was greatest in those with the poorest LV function.3
In patients with implanted cardiac resynchronization therapy (CRT) devices,4 chronotropic incompetence (maximum heart rate <70% of age-predicted maximum) was found in 70% of heart failure patients. In this group, sensor-driven CRT pacing improved maximum oxygen consumption and work capacity compared with CRT pacing without rate adaption. This increment is independent of A-V interval shortening during exercise. These data suggest that rate modulation plays a critical role in some patients with impaired LV function who require pacing therapy, even in those with CRT.
 Ideal Sensor Characteristics
Classification of Sensors
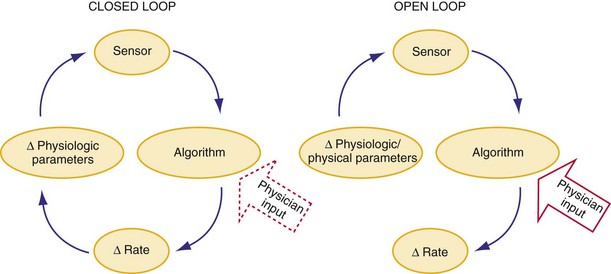
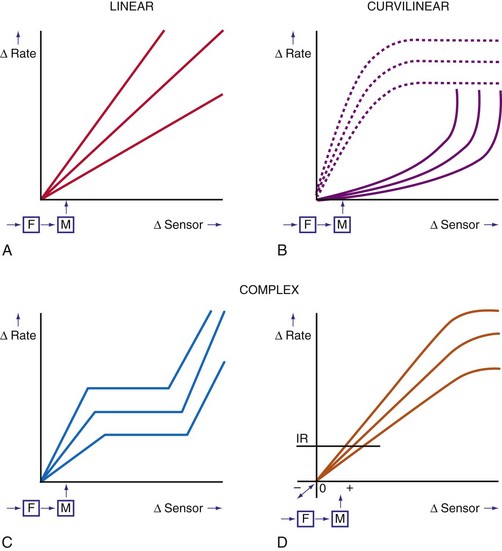
In a sensor-driven pacing system, a sensor (or combination of sensors) must first detect a physical or physiologic parameter that is related to metabolic demand5 (Fig. 5-1). Second, the rate-modulating circuit in the pulse generator must have an algorithm that relates changes in the sensed parameter to a change in pacing rate. Third, because the magnitude of the physical or physiologic changes monitored by a sensor may differ between patients, clinician input may be necessary to adjust the algorithm, generally by programming one or more rate-responsive variables, to achieve the clinically desired rate response. This requirement for adjustment has decreased with automatic optimization of the rate-responsive settings. Most sensors operate in an open-loop algorithm; that is, the induced rate changes do not induce a negative feedback on the sensed parameter. In a closed-loop sensor system, the induced hemodynamic changes will induce an opposite change in the level of the sensed parameter that is responsible for the initial rate adaptation (negative feedback loop). Theoretically, minimal programming is required in a closed-loop system (see Fig. 5-1). Furthermore, the actual rate response is calculated using rate-response curves after programming a threshold of sensor detection (Fig. 5-2).
Technical Classification
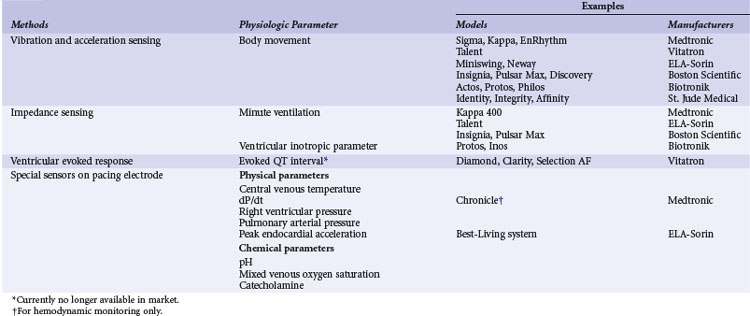
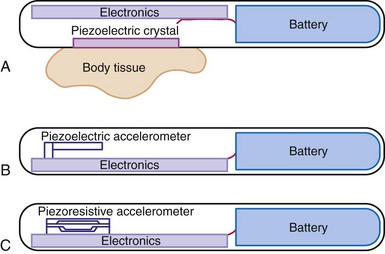
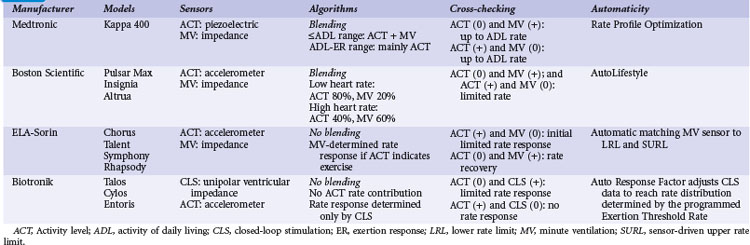
A practical classification is to categorize sensors according to the technical methods that are used to measure the sensed parameter (Table 5-1). Body movements during exercise result in changes in acceleration forces that are transmitted to the pacemaker. Sensors that are capable of measuring the acceleration or vibration forces in the pulse generator are broadly referred to as activity sensors. Technically, detection of body movement can be achieved using a piezoelectric crystal, an accelerometer, a tilt switch, or an inductive sensor. Each of these devices transduces motion of the sensor either directly into a voltage or indirectly into measurable changes in the electrical resistance of a piezoresistive crystal. Activity sensing is the most widely used control parameter in rate-adaptive pacing because of its ease of implementation and its compatibility with standard unipolar and bipolar pacing leads. Additionally, activity sensors can be used for either atrial or ventricular pacing modes.
TABLE 5-1 Major Classes of Sensors Used in Implanted Devices, Classified According to Method of Technical Realization
The intracardiac ventricular electrogram (EGM) resulting from a suprathreshold pacing stimulus has been used to provide several parameters to guide rate modulation. The total duration of depolarization and repolarization can be estimated by the interval from the pacing stimulus to the intracardiac T wave: the QT interval, or stimulus-T interval. This parameter is sensitive to changes in heart rate and circulating catecholamines and can be derived from the paced EGM with conventional pacing electrodes. This was developed as a QT-sensing pacemaker, based on the QT interval shortening during exercise and stress.5
The last group of sensors is incorporated into the pacing lead itself. These specialized leads include thermistors (used to measure blood temperature), piezoelectric crystals (right ventricular pressure), optical sensors (mixed-venous oxygen level), and accelerometers at the tip of pacing leads. Some of these sensors measure highly physiologic parameters. For example, oxygen saturation is closely related to oxygen consumption during exercise. Physical activities increase cardiac output and oxygen extraction from the blood, and the tissue arteriovenous oxygen difference widens during increased tissue oxygen consumption. The fall in oxygen saturation will trigger an increase in rate that will improve cardiac output and minimize the decrease in mixed-venous oxygen saturation.6 The mixed-venous oxygen sensor is a true closed-loop system, although its technical complexity limits its use for rate-adaptive pacing. Sensing of changes in blood pH during exercise has also been suggested as a possible sensor, although the requirement for a specialized lead has impeded its clinical implementation.7
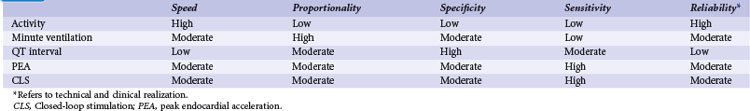
Over the years, many of these sensors have been implemented in implantable devices. Significant differences in rate response were found among sensors, notably between their sensitivity and specificity (Table 5-2). However, only activity, MV, and CLS sensors are currently used for rate response. The activity sensor has the advantage of reliability and ease of implementation; its lack of proportionality to exercise workload has not been a major clinical disadvantage for most patients. Sensors in special leads are no longer used for rate adaptation because of their uncertain long-term reliability and difficulty during pacemaker replacement. However, these sensors are now used for hemodynamic monitoring in heart failure.
 Current Sensor-Driven Pacemakers
Activity-Sensing and Accelerometer-Based Pacemakers
Activity sensing is the most widely used sensor, alone or in combination. Because activity-based pacemakers are operationally simple and do not require a special sensor outside the pulse generator casing, they work with any type of pacing lead, have excellent long-term stability, and are highly reliable. Activity-guided pacemaker implantation is the same as for conventional pacemakers. Although activity sensors may not be excellent proportional sensors, they react promptly to the start and termination of physical exercise. The first activity sensors, piezoelectric crystals, mainly respond to the frequency of vibrations transmitted to the pulse generator, with more variable response depending on the pulse generator and the pocket. The subsequent activity sensors, accelerometers, detect body accelerations and have less interpatient variability and better proportionality (Fig. 5-3).
Current Activity-Sensing Devices
Medtronic (Kappa 700/900/400, Adapta, Advisa, EnRhythm)
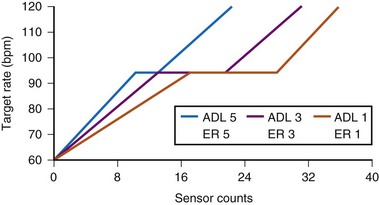
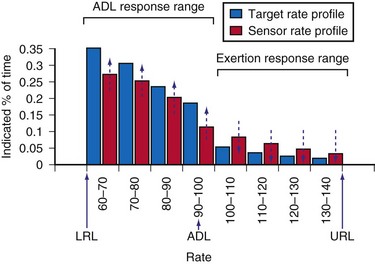
The sensor-driven rate is adjusted by the use of a triphasic rate curve that incorporates two rate ranges, activity of daily living (ADL) and exertion response (ER) programming (Fig. 5-4). The physician determines the lower rate limit (LRL), the ADL rate, and the sensor-driven upper rate limit (SURL). With the nominal ADL response of 3 (I-5), counts between 12 and 20 will give the ADL rate, during which the rate response will be stable. When counts are greater than 20, ER will occur to the maximum programmed SURL. The flat portion of the response curve corresponds to 25% of the total counts. Adjustment of the ADL and ER to a more sensitive setting will decrease the number of counts needed to reach between ADL rate and SURL, and shorten the ADL portion of the response curve. The actual number of counts to effect a change in pacing rate is not fixed and differs among patients. Rather, an ADL response of 3 implies that the patient will spend up to 30 minutes daily at a sensor rate at or above the ADL. This is achieved by adjusting the rate/count relationship to achieve this percentage of rate response, the ADL set point. Similarly, an ER response of 3 means that the patient will be spending about 20 minutes weekly at the higher rates, 105 to 120 bpm, the upper-rate set point.
With automatic rate response, rate profile optimization will adjust these rate curves automatically, using daily comparison of the rate histogram with the target-rate histogram. The device adjusts more quickly in the first 10 days after a programming change so that the new setting will be achieved more quickly (Fig. 5-5).
St. Jude Medical (Identity, Vitality, Zephyr, Accent)
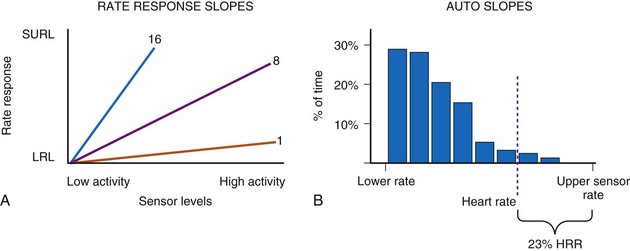
These activity devices use an Omnisense accelerometer bonded to the circuit board and are sensitive to accelerations that occur in the AP axis. Activity counts above a programmable threshold (1 = most sensitive; 7 = least sensitive) are integrated and translated to a rate response using a rate-response slope (1 = least sensitive; 16 = most sensitive) (Fig. 5-6).
Clinical Results of Activity Sensors
Clinical studies have demonstrated that activity-based pacing systems improve exercise capacity and reduce symptoms compared with VVI pacemakers. In an early study of a piezoelectric vibration-based sensor pacemaker, Benditt et al.8 compared exercise tolerance during VVI and VVIR pacing using treadmill tests. Sensor-driven pacing prolonged exercise duration by 35% and led to similar increments in peak oxygen consumption and oxygen consumption at anaerobic threshold. Activity sensor–driven pacing also reduced the patient’s perception of exertion at comparable exercise levels, and the benefit was sustained when exercise testing was repeated after an average 5 months of follow-up. Further, at follow-up exercise testing, reversion of the pacing system to a VVI mode resulted in prompt deterioration of both observed oxygen consumption and exercise duration. Crossover studies comparing VVIR mode to DDD pacing found no significant difference in symptom scores, maximal exercise performance (treadmill), or plasma concentrations of epinephrine, norepinephrine, and atrial natriuretic peptide, suggesting rate adaptation was the most important factor for exercise in the patient population studied.9,10
In a study of the efficacy of automatic “rate profile optimization” over time, 11 patients with Kappa 700 pacemakers performed treadmill testing at 1 month, 1 year, and 2 years after implantation.11 Based on the sinus profile at follow-up, a more aggressive slope was needed to match the sinus rate profile. This required a change in ADL response from 3 to 4 and in ER from 3 to 4 at 1 year, and a change in activity threshold from medium-low to low at 2 years. These adjustments enabled better approximation of pacing rate to sinus rate during treadmill exercise. Exercise capacity was maintained during the 2 years of follow-up. Variation in activity level (Activity Variance) as detected by an accelerometer is used to determine the rest rate in the St. Jude Medical devices,12 with an overall appropriate rate response.
Limitations of Activity-Sensing Devices
The effects of various means of locomotion on pacing rate were assessed for different activity-based pacemakers.13 Three different activity-based pacing systems (peak counting algorithm, integration type, and accelerometers) were strapped to the chests of volunteers. Bicycling on the street resulted in higher pacing rates than did stationary bicycling for each type of pacemaker, although none of the pacemakers reached the heart rate achieved by the normal sinus node. During driving, the pacemakers increased the pacing rate, although the intrinsic sinus rate continued to be higher. In passively riding passengers, the pacemakers tended to produce a higher pacing rate than that of the normal sinus node. Independent of the sensor, activity-initiated rate response depends on the manner in which activity is performed rather than the exercise workload, and proportionality is generally limited.14 Activity sensors typically produce a higher heart rate walking downhill than uphill because of the greater force of heel-strike in the descending direction. Nonexercise stresses such as emotional changes are not detected.
Minute Ventilation Sensing
Although a respiratory rate–sensing pacemaker was in use as early as 1983, it was limited by the need for an auxiliary subcutaneous electrode, as well as easy interference by arm movement because of unipolar impedance sensing.15 All subsequent generations of respiratory sensor detect impedance as a surrogate measure of minute ventilation for rate adaptation. Again, MV is the product of tidal volume and respiratory rate. Although MV is not actually measured, both the amplitude of changes in transthoracic and intravenous impedance (correlating with tidal volume) and the frequency of changes in these parameters (correlating with respiratory rate) can be measured by injecting a very-low-amplitude and short-duration electrical stimulus between an electrode on a pacemaker lead and the pulse generator casing. Thus, changes in MV can be estimated by changes in minute impedance. The advantage of this sensor is that it only requires a standard bipolar pacing lead in either the right atrium or right ventricle, without the need for additional hardware. The response of MV during exercise is proportional to oxygen consumption (below anaerobic threshold) and responds at a reasonable speed; battery drain is not excessive.
Current Minute Ventilation–Sensing Devices
Medtronic (Kappa 400)
Medtronic Kappa 400 has been evaluated using symptom-limited treadmill testing.16 All patients had cardiopulmonary gaseous analysis in conjunction with simultaneous recording of MV-induced impedance changes. Calibrations were made during resting, supine, sitting, and different types of exercise (bicycle or treadmill). The impedance-derived MV was smaller for sitting versus supine position, for shallow versus slow breathing, and for bicycle versus treadmill exercise, possibly because of change in chest cage geometry. Correlation coefficients of the best-fit line for measured and device-based MV were high (>0.9 in first-, second-, and third-order polynomial equations).17 Furthermore, the calibration between measured MV and impedance MV changes over time (1 week to 1 month). However, the changes were not correlative, with implications for the need of continual automatic adaptation. These findings also suggest the potential use of the sensor for MV monitoring.
Boston Scientific (Pulsar Max, Insignia, Altrua)
The telemetered MV impedance signal from a Boston Scientific device was compared with measured MV in 20 patients.18 Respiratory rate was accurately measured by the device during hyperventilation, with difference less than 0.2 breath/min. During 10-minute cycle ergometry at 50 W, the correlation between MV measured directly and by the device was 0.99. Large, individual variations exist between the measured MV and the impedance MV slope, requiring individualized rate-response curves.
ELA-Sorin (Chorus, Talent, Opus, Symphony, Rhapsody, Reply)
The automatic slope algorithm in the Chorus determines the resting and maximum MV values daily. If MV over 128 cycles remains below the 24-hour MV average, the lower rate will decrease to the LRL. The device calculates the exercise MV signal by looking for the maximal MV signal and recalculates this value every eighth cycle. The exercise MV value is increased or decreased in 6% intervals. The mean resting and exercise MV values are used to adjust the rate-response slope automatically over the range of values from 1 to 15 in steps of 0.1. The response of the Talent DR during exercise was compared in 81 patients. The correlation coefficient between the sensor rate and programmer-derived sensor rate was 0.983 ± 0.005, and a linear relationship was observed between the heart rate reserve and MV reserve.19
Clinical Experience of MV Sensor Pacemakers
Minute ventilation is an indirect but reliable marker of metabolic demand, and in the first generation of MV pacemakers (Meta MV, Telectronics), the rate response was proportional to the level of exertion and correlated with the normal sinus response.20,21 Compared with VVI pacing, MV-based VVIR pacing increased exercise capacity by 33%,21 and maximal oxygen consumption and cardiac output were significantly improved. In one study of 10 patients with the first version of MV-driven VVIR pacing, pacing rate was highly correlated with measured MV (r = 0.89), respiratory quotient (r = 0.89), Vco2 (r = 0.87), tidal volume (r = 0.87), Vo2 (r = 0.84), and respiratory rate (r = 0.84). Maximum oxygen consumption also increased from 13.4 ± 3.4 to 16.3 ± 4.1 mL/kg/min (P = .0004) using MV-driven over VVI pacing.
Improvement in symptoms were also documented in the VVIR mode.21 The MV sensor has good long-term stability; programming of the sensor is relatively simple; and the rate response is appropriate during daily activities. Compared with activity pacing, MV is significantly better in achieving a near-normal pacing rate–workload relationship, whereas activity sensing tends to overpace at low-level exercise and underpace at peak exercise and in the recovery period.
Limitations of Minute Ventilation Sensing
As with all impedance systems, the MV sensor will likely be affected by electromagnetic interference, arm swinging, coughing, and hyperventilation.16 Artificial ventilation will induce an unphysiologic rate, so MV sensing needs to be disabled in such patients (e.g., general anesthesia, mechanical ventilation). The use of MV devices in patients with lung disease and heart failure remain controversial. Early generations of MV-sensing devices limited the maximum detectable respiratory rates to less than 48 to 60 breaths/min to minimize the cardiac effects of changes in impedance. Because of this filtering of the cardiac component of changes in impedance, MV sensors may not accurately reflect rate adaptation at very high respiratory rates, as may occur in children. A bipolar ventricular lead is needed for MV sensing in several models. The battery current for MV sensing may consume approximately 2% of the total current of a dual-chamber pacemaker.
Unipolar Ventricular Impedance: Closed-Loop Stimulation Sensor
Sensor and Algorithm
The CLS sensor is based on unipolar impedance at the tip of a pacing lead.22 Subthreshold pulses of automatically selected outputs, ranging from 100 to 400 microamperes (µA), with biphasic duration of 46 msec are emitted 50 to 300 msec after a sensed or paced ventricular event. During late diastole immediately after a ventricular paced (Vp) or sensed (Vs) event, the blood volume of the right ventricle is highest and RV impedance is lowest. On the other hand, as contraction occurs, the walls surrounding the electrode tip draw closer, and impedance rises (Fig. 5-7, A). A baseline waveform will depend on the conduction state of the heart: AsVs, AsVp, ApVs, ApVp (As, atrial sensed; Ap, atrial paced event). Baseline CLS waveforms will be acquired only when the associated accelerometer indicates “no activity,” and a waveform will be discarded within 48 hours if not referenced. An average template of the baseline CLS waveform will take 2 to 3 days to optimize.
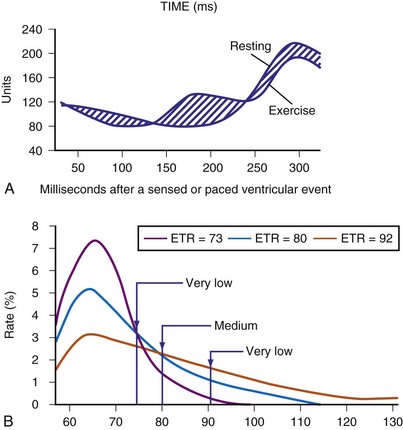
As contractility increases during exercise, unipolar impedance will change. The time-integrated difference between the exercise and baseline impedance waveforms is converted to a pacing rate using an auto response factor, which is continually adapted and patient specific. The magnitude of rate response is then determined by a programmable exertion threshold rate (ETR; very low, low, medium, high, and very high) (Fig. 5-7, B). The ETR, acting through the auto response factor, will determine that 80% of the heart rate will occur below the ETR and 20% above the ETR. An active young individual will probably require a higher ETR than an inactive elderly patient. Again, the type of rate profile attained will be determined by the patient’s cardiac condition, physical state, and specific automatic response factor.
Current Closed-Loop Stimulation Devices: Biotronik (Inos, Protos, Cyclos, Entovis, Evia)
Acute measurements of the CLS parameter (previously known as “ventricular inotropic index”) were taken in 82 patients with chronically implanted unipolar ventricular leads at pulse generator replacement.22 A wide fluctuation of baseline impedance was observed (500-1500 Ω), whereas CLS fluctuated by about 4 to 25 ohms (Ω), with a good correlation between CLS and the baseline impedance. A clinical study of 205 patients evaluating the CLS pacemaker included a significant number of young subjects with complete AV block caused by Chagas’ disease.23 Satisfactory rate modulation was reported in 93% of patients. In the remaining 7% of patients, rate adaptation could not be achieved because of poor exercise tolerance, severe myocardial dysfunction, and intermittent intrinsic AV conduction. In a multicenter study that included 178 VVIR (Biotronik Neos-PEP) and 84 DDDR (Biotronik Diplos-PEP, InosDR) devices, physiologic rate adaptation was possible in 93% and 96% of patients with these devices, respectively.24 Apart from exercise rate response, this study also involved mental stress testing using color-word matching and the infusion of inotropic agents. A moderate level of rate response was documented in some patients with CLS pacemakers during these nonexercise conditions that was greater than during accelerometer-guided pacing. The benefit of CLS sensor pacing during mental stress and cognitive function has also been studied.25
Considerable interest surrounds the use of the CLS sensor to detect changes in posture. Passive head-up tilt, which depletes intravascular volume, increases the inotropic state of the heart. In a multicenter study, Inotropy Controlled Pacing in Vasovagal Syncope (INVASY), 50 patients with severe vasovagal syncope and positive head-up tilt test were randomized between DDD-CLS and DDI mode at 40 bpm.26 Whereas 7 of 9 patients in the DDI arm experienced syncope within 1 year, only 4 of 41 patients in the DDD-CLS arm had presyncope. The authors suggested the efficacy of this approach, although a placebo effect of pacing was suspected in 22% of patients. In 131 patients with chronotropic incompetence, CLS pacing resulted in a higher pacing rate compared with accelerometer sensor, but no difference in 6-minute walking distance (6MWD) test.27 However, twice as many patients preferred the CLS mode. The use of CLS in the left ventricle, as in a CRT device for monitoring, may be a useful application of this technology (see later discussion).
Peak Endocardial Acceleration
Sensor and Algorithm
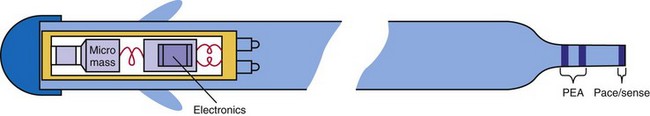
The contractile state of the heart can be identified by the maximal velocity of shortening of unloaded myocardial contractile elements, which can be measured with a catheter tip accelerometer attached to the ventricular wall. The “peak endocardial acceleration” represents the endocardial vibration measured by the accelerometer in the right ventricle during isovolumetric contraction phase of the ventricles. This signal is closely associated with the intensity of the first heart sound. The ELA-Sorin BEST (Biomechanical Endocardial Sorin Transducer) sensor is a microaccelerometer consisting of an acceleration sensor built into a nondeformable capsule on the tip of a standard unipolar ventricular pacing lead. The lead is placed against the RV wall so as to be sensitive to its acceleration and insensitive to the pressure of blood and myocardium (Fig. 5-8). This system has a frequency response up to 1 kHz and a sensitivity of 5 mV/G (1 G = 9.8 m/sec/sec).
In early animal experience using an external system and an implantable radiotelemetry system, the PEA was not affected by heart rate but significantly increased by emotional stress, exercise stress testing, and inotropic stimulation.28 The PEA signal changes in parallel to the maximal LV dP/dt and appears to measure the global LV contractile performance rather than the regional mechanical function. The PEA signal that occurs 150 msec after the R wave corresponds to the isovolumetric contraction phase of the left ventricle (PEA-I)29 (Fig. 5-9). A smaller signal also occurs in the 100-msec period after the T wave, the so-called PEA-II, which corresponds to the isovolumetric LV relaxation. PEA-II is related to peak negative dP/dt (r = 0.92) and aortic diastolic pressure (r = 0.91).30 To enable the PEA sensor to be used in patients requiring an ICD lead, the sensor has been incorporated into a right atrial (RA) lead (SonR sensor). Preliminary results suggest that the SonR sensor is similar to the RV PEA signal and that it might be useful in patients receiving cardiac resynchronization therapy with defibrillation (CRT-D).29 This offers the potential to measure cardiac hemodynamics in heart failure patients with an ICD.
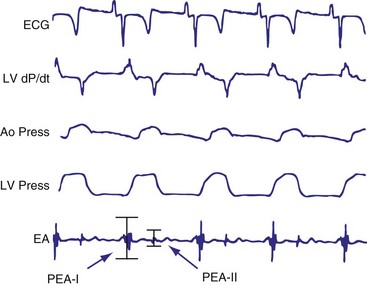
Figure 5-9 BEST tracings.
Electrocardiogram (ECG), left ventricular (LV) dP/dt, aortic pressure (Ao Press), LV pressure, and endocardial accelerometer tracing (EA) recordings in a sheep with the BEST sensor (see Fig. 5-8). The peak of the accelerometer tracing during the isovolumic diastole (PEA-II) occurs in a 100-msec period after the T wave on the ECG.
(From Plicchi G, Mercelli E, Parlapiano M, et al: PEA-I and PEA-II based implantable haemodynamic monitor: preclinical studies in sheep. Europace 4:49, 2002.)
Current PEA Devices: BEST Sensor Rate–Adaptive Pacemakers (Sorin Best-Living Systems: Miniliving D and S)
Clinical Results
Clinical studies show good correlation between the sinus rate and PEA sensor–indicated rate during daily life activities and submaximal stress testing.31,32 Similar results were obtained in patients tested during electrophysiologic studies using an external system; changes in PEA were linearly related to the RV dp/dt during dobutamine infusion. PEA signals have been used to monitor hemodynamic function and program the A-V interval. In 13 patients with end-stage heart failure implanted with a DDD-PEA device with a custom lead arrangement, PEA level during RV, LV, and biventricular (BiV) pacing were compared.32 Both LV and BiV pacing increased stroke volume (21% and 37%, respectively) compared with RV pacing, and mean PEA changes over 15 minutes were also higher (43% and 38%). In addition, an apparent minimum PEA level at the optimal A-V interval has shown promise in automatically detecting the optimal A-V interval in a dual-chamber device.33 The algorithm is now automatic. An increase in PEA during head-up tilt-table testing has been observed, and the use of PEA-driven overdrive pacing in patients with vasovagal syncope has been reported.34 Patients randomized to DDDR have a reduced frequency of syncope compared with DDI pacing. In 15 patients with a CRT pacemaker, the PEA correctly indentified the optimal AV interval in 75% of patients.35 These data suggest the potential use of PEA sensor for hemodynamic monitoring (see later).
 Current Combined Sensor Devices
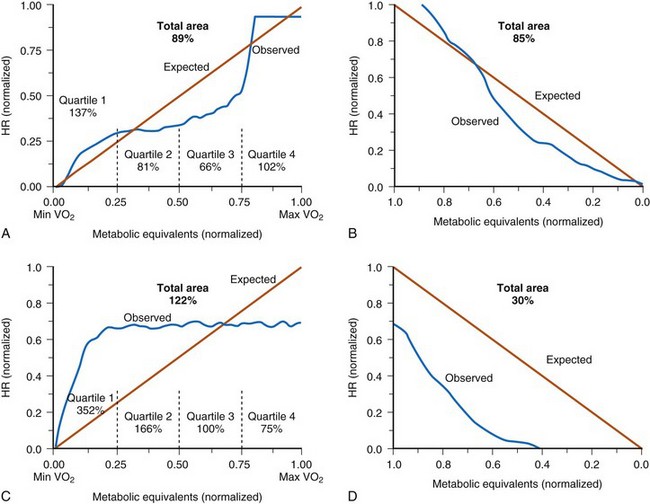
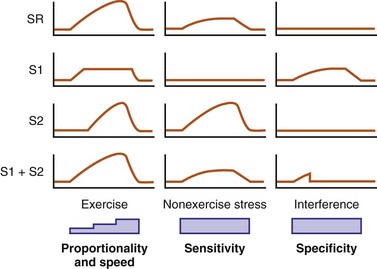
Experience with sensors has suggested that rapidly responding sensors (e.g., activity) are not proportional at higher levels of cardiac workload, whereas proportional sensors are usually slow in response. As a result, an activity sensor overpaces at low activity levels but underpaces at higher exertional levels (Fig. 5-10). Furthermore, single sensors may be limited by insensitivity to nonexercise stress and are prone to interference by nonphysiologic causes. Thus, it is logical to enhance their rate-response profile by combining two or more sensors.
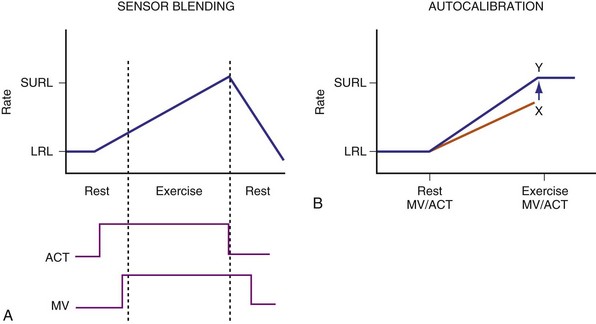
Two principles guide the combining of sensors: sensor blending and sensor cross-checking. Sensor blending involves combining sensor-driven rates from individual sensors in a certain ratio. This can be the “faster win” method, in which the higher rate indicated by either sensor is chosen as the pacing rate, or ratios of the individual rates are added together to compute the actual rate response. Sensor cross-checking enhances the specificity of each sensor. If a more specific sensor registers “no exercise” or physiologic stress, changes in the other, less specific sensor can be ignored or its response attenuated (Fig. 5-11). Table 5-3 summarizes instrumentation of current dual-sensor devices. Details of the combined CLS/activity and PEA/activity devices are discussed earlier.
Current Dual-Sensor Devices
Medtronic Pacemakers
Medtronic marketed two dual-sensor pacemakers: the combined activity and QT sensors (Vitatron) and the combined activity and MV sensors (Kappa 400). Both are no longer manufactured. In the activity/QT device, a “faster win” algorithm was used, with highest rate of two sensors used to determine actual pacing rate. Since the QT sensor is more specific for physiologic changes, an increase in activity sensor level in the absence of QT documenting exercise was used as a cross-check, resulting only in a brief and limited rate response. Using an adaptive sensor level to the SURL, the QT sensor level was continuously scaled down if, at the SURL, QT continued to shorten, suggesting the sensor level had reached the upper rate too soon. The converse was also operative. The combined sensor rate was found to be closer to the sinus rate during daily activities.36
The dual-sensor rate response has been reported to be reliable for both maximal and submaximal activities, as well as resistant to nonphysiologic interference.37 Compared with MV sensor alone, dual-sensor mode reduces oxygen deficit acquired during exercise by enhancing the initial rate response.38 “Quantitative rate adaptation” is also superior in the dual-sensor mode.39,40 “Rate profile optimization” was found to be a useful method for rate-adaptive programming, comparable to manual programming,41 and may be superior to accelerometer alone for rate optimization.11
Boston Scientific (Insignia, Pulsar Max, Altrua)
An accelerometer activity sensor is integrated with the MV sensor, using differential sensor blending. At low heart rates, the blended sensor rate is approximately 80% accelerometer and 20% MV sensor. This ratio changes to 40%/60% near the SURL. In addition, if the MV rate is higher than the accelerometer rate, the dual-sensor rate follows the MV level. In a study involving 120 patients with Insignia, the programmed sensor modes were randomized to the accelerometer sensor alone, the MV sensor alone, or the dual-sensor mode, each for a 3-month period.42 Using the implanted Activity Log to determine the mean percentage and intensity of activity, quality of life (QOL), and New York Heart Association (NYHA) classes were assessed at the end of each period. Overall, either single-sensor DDDR mode improved Activity Log, QOL, and NYHA scores compared with DDD pacing, but with no difference between the two sensors. The dual-sensor mode did not improve these measurements. This study may have been limited by the prolonged, triple-crossover design but does suggest that clinical differences are likely minimal between sensors and their combinations.
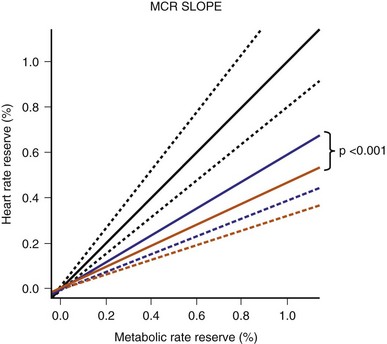
The Limiting Chronotropic Incompetence for Pacemaker Recipients (LIFE) study of 1256 patients with chronotropic incompetence found that the blended sensor improved metabolic-chronotropic slope compared with the activity sensor alone43 (Fig. 5-12). However, besides improved physical activity time/energy expenditure, there was no measurable difference in QOL between the blended sensor and the activity sensor alone. A prospective randomized parallel study on activity and MV with the primary outcome of Vo2 is planned (APPROPRIATE study).44 This study will randomize 1000 patients who will be screened for CI using a 6MWD and treadmill heart rate at 1 month. Patients with confirmed CI will have their sensors optimized with a brief walking test. Apart from Vo2 max, rate changes during daily activities will be assessed. This study will shed light in the role of different sensors on exercise oxygen uptake. (Unfortunately, the study was prematurely terminated because of suboptimal recruitment.)
ELA-Sorin (Chorus, Talent, Symphony, Rhapsody, Reply)
An accelerometer and a MV sensor are combined in these devices. Sensor blending and cross-checking are both operative to effect rate adaptation during exercise (Fig. 5-13). When the accelerometer is active but MV has not increased, as may occur at the beginning of exercise, rate response occurs according to a fixed activity response curve to a limited rate. When MV increases, rate response follows the MV sensor–driven rate. Persistent absence of accelerometer signal is considered the cessation of exercise, and this allows a decrease in the pacing rate using a recovery curve to the LRL, even though MV remains higher than baseline.
A multicenter study involved 81 patients with the ELA dual-sensor pacemakers.19 In patients who underwent exercise stress testing at 1-month follow up, sensor-driven rate had good correlation with the sinus rate (r = 0.92 ± 0.07; P < .001), with the slope of linearity at 1.0 ± 0.2. Using metabolic reserve to relate to heart rate reserve, a slope of 1.1 ± 0.2 was obtained, suggesting a close relation between the dual-sensor rate and metabolic workload.
Are dual sensors justified?
Dual-sensor implementation is technically and clinically feasible and provides a rate profile closer to the normal sinus rate. In practice, a more specific sensor is added to the activity sensor to enhance its specificity. However, apart from physiologic parameters such as oxygen uptake and transport kinetics, no clinical benefit over single sensor has been seen in large groups of patients, likely reflecting the limited exercise activities of most patients meeting standard indications for pacing. For select patients who are highly active, however, these dual-sensor pacemakers may provide important clinical benefits (Table 5-4).
| Clinical Situation | Examples |
|---|---|
| High exercise heart rate preferred | Young, athletic individuals may require a more physiologic sensor. |
| Avoidance of undue rate acceleration | Working in a vibrational environment |
| Need for nonexercise rate response | Vasovagal syncope |
| Stress response | |
| Hemodynamic or other monitoring |
 Clinical Benefits of Sensor-Driven Pacing
Controversy remains about the clinical benefits of sensor-driven pacing, especially the lack of symptomatic benefit observed in some comparative studies. Factors that may affect such comparisons include (1) definition of CI, (2) programming of sensor (extent of rate adaptation), (3) patient populations including their comorbidities, (4) pacing modes, and (5) site of ventricular pacing (Table 5-5).
TABLE 5-5 Factors Affecting Clinical Benefit of Sensor-Driven Pacing
| Issues | Factors |
|---|---|
| Patient related |
Chronotropic Incompetence
Although factors contributing to CI can be obvious—age, coronary artery disease, sinus node dysfunction, and cardioactive medications—what constitutes CI remains uncertain. CI can vary from 9% to 84%, depending on the definition used.43,45–57 Based on cardiac mortality, CI defined as “inability to reach 85% maximum age-predicted heart rate” will identify 2.2 times as many individuals with increased cardiac mortality.45
From the patient’s perspective, CI should be defined as a level at which its reversal by a sensor will improve exercise capacity and QOL. There are few long-term studies in pacemaker patients, although it is generally accepted that inability to reach a rate greater than 100 bpm represents severe CI.48 The metabolic-chronotropic relationship may be a scientific way to classify CI at peak and each level of exercise, with a slope value of the plot of heart rate reserve to metabolic reserve of less than 0.8 identifying CI.49 In 547 pacemaker patients, exercise testing was used to identify CI at 1 month after pacemaker implantation.43 Patients were recruited in this study if they could complete three or more stages of CAEP protocol and attained a perceived-exertion Borge scale of 16 or higher. CI is defined as a heart rate reserve less than 80% of metabolic reserve at each stage of the CAEP exercise test, and if more than 0% of these stages were incompetent, CI is identified. Based on this study, 50% of these patients had CI. The study further assessed the prevalence of CI using different definitions in the same cohort according to the previous definition, and found that the incidence is similar to using maximum predicted heart rate of less than 70% as CI. The other definitions tend to be more sensitive and identify 70% to 87% of recipients with CI (Fig. 5-14).
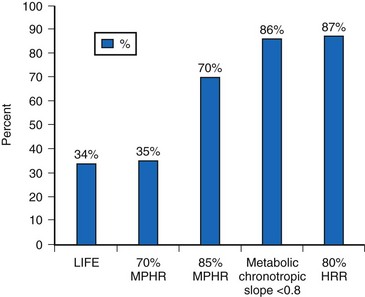
Figure 5-14 Prevalence of chronotropic incompetence (CI).
Results in 547 pacemaker recipients during maximum exercise according to published criteria. See text for LIFE study CI definition (Fig. 5-12). HRR, Heart rate reserve; MPHR, maximum [age] predicted heart rate.
(Data from Coman J, Freedman R, Koplan BA, et al: A blended sensor restores chronotropic response more favorably than an accelerometer alone in pacemaker patients: the LIFE study results. Pacing Clin Electrophysiol 31:1433-1442, 2008.)
This study did not address whether rate adaptation improves exercise or QOL. However, patients with CI had a lower QOL (physical and mental component) than those who were chronotropic competent. With correction of CI in the DDDR mode, there was an increase in physical activity time and kilocalories expanded per week compared to baseline DDD at 1 month, with a greater tendency toward higher levels for the dual sensors than the single, activity sensor (mean change for activity score from baseline to 6 months: activity sensor = 1.45 ± 17.12, dual sensor = 2.69 ± 15.3; and energy expenditure change: activity sensor = 359 ± 367, dual sensor = 716 ± 3810 Kcal).43 These data suggest that a more stringent criterion for CI may identify a group of pacemaker recipients who are more symptomatic and benefit from dual sensors, although the benefit of accurate rate adaptation remains controversial in large-scale studies.
Upper Rate Limit
The peak heart rate (HR) is inversely related to age. In large studies, mean peak HR has been traditionally estimated by the formula: HRmax = 220 − age. The variance is approximately 15 bpm. This is a useful guide to prescribe physical training, but its application to pacemaker recipients remains controversial. Kindermann et al.50 exercised 49 patients with conventional DDD pacemaker using cardiopulmonary exercise results and Doppler to define the optimal upper rate. In patients with normal heart function (left ventricular ejection fraction [LVEF] ≥55%), the URL was 86% of the maximum predicted HR. In those with impaired heart function (LVEF ≤45%), a 75% maximum predicted HR was optimal, beyond which cardiac output tended to decrease. This may be related to decreased ventricular compliance and other factors, such as ischemia that could occur at higher HR. Of interest, contractility augmentation as a function of increased HR appeared to be attenuated with RV pacing. In 22 patients with heart failure and a wide QRS complex, Vollmann et al.51 found that BiV pacing restored the rate-related contractility when pacing at 80 to 140 bpm, whereas the change in RV pacing was minimal, and the changes during LV-only pacing was intermediate. Thus, the site of ventricular pacing is an important determinant of the URL.
Rate-Adaptive Pacing Modes
VVIR vs. VVI
The first rate-adaptive pacing mode introduced was VVIR pacing. This mode was most extensively studied, and often applies to patients who had complete CI, as in those with complete AV block. Independent of the type of sensors, a 69% and 32% increase in heart rate and exercise capacity has been documented over VVI pacing.52 In addition, VVIR pacing has been shown to improve most aspects of QOL over fixed-rate pacing.53
AAIR vs. AAI/VVI
An infrequently used pacing mode, AAIR has the theoretical advantage of preserving native conduction and avoiding ventricular pacing altogether. The disadvantages include progression of AV conduction disease, even in patients with normal AV conduction at baseline, and potential induction of Wenckebach AV block by inappropriately high atrial pacing rates. How quickly AV conduction can adapt with exercise may be an issue, because lack of AV adaptation during an appropriate sensor-driven atrial rate may prolong the P-R interval, resulting in AV dyssynchrony. If the P-R interval is greatly prolonged, the pseudo–pacemaker syndrome may result.54
An early study on AAIR pacing compared AAIR, DDDR, and VVIR mode in patients with intact intrinsic AV conduction (1 : 1 A-V ≥100 bpm; atrial-R ≤220 msec).55 Patients with VVIR pacing had worse QOL than AAIR patients, as well as more palpitations and depression despite a lower frequency of ventricular pacing than DDDR patients (39% ± 7% vs. 64% ± 11%). All patients initially had normal LV function, which may have obscured minor differences between modes. In a further study, AAIR pacing that increased the maximum heart rate to 142 bpm did not increase oxygen uptake compared with VVI backup at 40 bpm in patients with impaired LV function.55 The study was limited by an intrinsic maximum rate of 130 bpm even without rate adaptation.
DDDR vs. DDD
Much controversy surrounds the potential benefit of DDDR versus DDD pacing. In a small cohort of 10 patients, DDDR improved exercise capacity over DDD pacing in patients with severe CI.46 However, in a more recent trial including 873 patients, despite an increase in HR from 101.1 ± 21.1 bpm to 113.3 ± 19.6 bpm at 6 months, there was no difference in exercise capacity between the two pacing modes.56 More than 90% of beats in the two modes were ventricularly paced, and a potential reason for lack of benefit may be related to the potentially negative effects of RV apical pacing. In a small study, van Hamel et al.57 compared DDDR versus DDD mode in 99 patients with either AV block or sinus node disease. They found no difference between DDDR and DDD mode in terms of QOL, despite significantly higher atrial pacing rate in the sensor-driven arm. Again, this study documented a high percentage of RV pacing in both sinus node patients (87.9%) and AV block patients (96.8%).
Ventricular Pacing Site
The role of sensor-driven pacing in CRT/CRT-D is discussed earlier for patients with heart failure. Recent observations indicate that RV apical pacing may be associated with impaired ventricular function in the long term, especially in patients with a depressed LVEF who do not require pacing. Thus, the benefit of rate increase might be mitigated by the harmful effect of RV apical pacing. Inducing a narrower QRS complex in RV septal pacing better preserves LV function.58 A recent study in 12 patients with high-level AV block (8 of 12 with permanent atrial fibrillation) in the VVIR mode received an upgrade from chronic RV apical to RV septal VVIR pacing.59 Over 18 months, these patients showed a significant increase in LVEF (55.2 ± 2.6 to 60.4 ± 2.9%) and improvement in 6 MWD. A control group with simple pacemaker replacement had no change in LV function. This study suggests that the potentially harmful effect on LV function by VVIR pacing can be ameliorated with septal VVIR pacing.
 Conclusion
Sensors for Heart Failure Monitoring
 Acute Decompensated Heart Failure
About 5 million Americans suffer from heart failure, with an estimated 550,000 new cases each year and resulting in significant mortality and morbidity. Furthermore, estimated annual treatment costs $33.2 billion, most incurred during hospitalization for acute decompensated heart failure (ADHF).60 ADHF refers to a clinical condition of worsening heart failure with dyspnea and often with evidence of fluid overload.61 ADHF is often triggered by one of four main factors: atrial fibrillation, anemia, hypertension, or medication/dietary indiscretion. In the 1991–1994 Connecticut Medicare beneficiaries review, ADHF resulting in hospitalization carried an 8% in-hospital mortality.62 Importantly, of the 17,448 survivors, 44% were readmitted once, 18% of these for recurrent heart failure. Overall, 24% died within 6 months of the first ADHF event, and 53% either died or were readmitted over the same period. The prognosis for heart failure admission has improved over time,60 partly because of adherence to optimal doses of evidenced-based therapy. Despite this, prevention of ADHF can have significant prognostic impact for the patient, in addition to reducing the cost of heart failure management.
Limitations of Symptoms, Signs, and Investigations
Although the most common presenting complaint for hospitalization in ADHF patients, dyspnea occurs relatively late in relation to changes in hemodynamics and intravascular volume. Until the era of implantable devices, it was not possible to evaluate the hemodynamic changes leading to ADHF except by repeated catheterization. Adamson et al.63 implanted an RV pressure sensor to measure RV systolic and diastolic pressure during heart failure exacerbation in 32 patients. They found that at a mean of 4 ± 2 days before admission, RV systolic pressure started to increase in 9 of 12 heart failure events (Fig. 5-15). As a group, RV systolic pressure increased by 25% ± 4% and heart rate by 11% ± 2% during ADHF, with substantial changes also during minor exacerbation. This study suggests that intracardiac pressure changes precede symptoms of heart failure exacerbation. Likewise, an implantable intrathoracic impedance sensor to assess pulmonary fluid showed that fluid overload occurred 18.3 ± 10.1 days before dyspnea.64 Thus, dyspnea is a late event and does not allow either the clinician or the patient enough time for intervention to avert hospitalization.
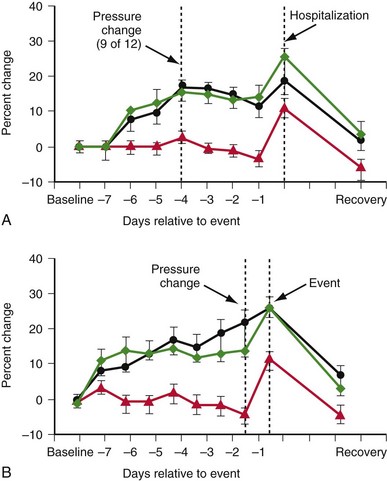
Figure 5-15 Right ventricular (RV) sensor to measure RV pressure during heart failure exacerbation in 32 patients.
(From Adamson PB, Magalski A, Braunschweig F, et al. Ongoing right ventricular hemodynamics in heart failure: clinical value of measurements derived from an implantable monitoring system. J Am Coll Cardiol 41:565-571, 2003.)
The cardinal physical signs of congestive heart failure are a third heart sound, pulmonary crackles, raised jugular venous pressure, and pedal edema. However, these signs have poor sensitivity to detect heart failure. In a study of 50 patients with increased pulmonary artery wedge pressure (PAWP ≥22 mm Hg), lung crackles were identified in 19% of patients, and higher jugular venous pressure and peripheral edema were present in only 50% and 20% of patients, respectively.65 A third heart sound was heard in most patients, but it was also detected in those with a low PAWP. This combination of signs carries a sensitivity of 58% and specificity of 100% for congestive heart failure. Physical examination of jugular pressure is difficult and often inaccurate.66
Body weight change is both a symptom and a sign that predicts ADHF. Some suggest this may be an unreliable sign because body weight not only reflects body fluid, but also may depend on amount of food/fluid intake and other causes of weight loss or weight gain. In a recent study, 134 patients with heart failure hospitalization were compared with a case-matched group without hospitalization.67 Body weight gain 1 week before hospitalization was associated with increasing risk of hospitalization (relative risk: Δ2-5 lb = 2.77; Δ5-10 lb = 4.46; and >10 lb = 7.65). Therefore, monitoring of body weight remains useful to identify a high-risk group for intervention and provides supportive evidence for ADHF. Radiologic evidence of ADHF tends to occur late.
Brain natriuretic peptide (BNP) has been proposed as a means to monitor and improve heart failure management. In a randomized study on the N-terminal BNP to guide heart failure therapy (TIME-CHF) study, 499 patients 60 years or older with systolic heart failure were randomized either to monitoring of BNP to maintain a level twice or less the upper limit or to conventional management without BNP guidance.68 There was no significant difference in the probability of remaining free from all-cause hospitalization between BNP-guided and conventional therapy (41% vs. 40%). Both groups had similar quality of life (QOL). However, the secondary endpoint of heart failure hospitalization was significantly reduced (72% vs. 62%), and outcomes were better in patients age 60 to 74 but not in those 75 or older.
Although vigilant monitoring of symptoms and signs (and BNP levels) is useful, this strategy is not a guarantee for accurately predicting ADHF. On the other hand, frequent monitoring of some signs and symptoms and the use of external physiologic (and implantable) data may be superior to conventional care. A meta-analysis of both cohort (2354 patients) and randomized trials (6258 patients), with 6 to 12 months of follow-up, found a significantly lower rate of mortality and hospitalization compared with conventional management.69 Relative reduction in heart failure hospitalization of 0.93 and 0.52 was seen in randomized and cohort studies, respectively, and mortality was reduced by 0.83 and 0.53. The Cochrane Database Systematic Review69a reviewed 25 studies and 5 abstracts and suggested that telephone support and telemonitoring are effective in reducing all-cause mortality and heart failure hospitalization, and thus improve QOL and reduce cost and evidence-based prescribing.
Several prospective randomized studies have been published since these meta-analyses. The Randomized Trial of Phone Intervention in Chronic Heart Failure (DIAL) trial69b randomized 1518 outpatients to either nurse-led telephone-based intervention or conventional treatment. The three main supervision areas were weight, diet, and medication compliance, and nurse specialists were allowed to change diuretic doses according to specified criteria. Patients were organized to call once every 14 days for three times, and thereafter at a frequency depending on the severity of heart failure. This protracted study followed patients up to 3 years after trial completion. The primary end point (death or heart failure hospitalization) was reduced in the intervention versus conventional arm, with the main benefit being a reduction in hospitalization (28.5% vs 35.1% at 3 years). An educational effect and adherence to the above three supervision areas are considered the main reasons for improvement.
The Telemedical Interventional Monitoring in Heart Failure (TIM-HF) trial69c also randomized stable Class II or III heart failure patients who had a history of heart failure hospitalization within 2 years to either remote data monitoring (ECG, blood pressure, body weight) and sent these data via a personal digital assistant to the monitoring center daily, with physician-led response. Over a median follow up of 26 months, there was no difference in heart failure hospitalization or death, nor in overall QOL score. However, physical functioning was improved. The study documented an 81% compliance in ≥70% daily transmission of data.
The Telemonitoring in Patients with Heart Failure (TELE-HF) trial69d randomized 1653 patients who had recently been admitted with ADHF. A daily telephone-based interactive voice response system on symptoms and weight was reviewed by the patients’ physicians. At the end of 180 days there was no significant difference in the primary end point of death and heart failure hospitalization between the telephone-based intervention versus the usual care group (52.3% vs 51.5%, respectively). Again, this study shows only a 55.1% adherence to interventional therapy at the end of 26 weeks in the 85.6% of patients who made at least one call.
Monitoring of Pathophysiologic Changes
The three pathophysiologic areas for heart failure monitoring are electrical remodeling, mechanical remodeling, and neurohormonal changes that occur with heart failure (Table 5-6).
| Pathophysiologic Area | Monitoring Examples |
|---|---|
| Electrical Remodeling | |
| Atrium | Rate, atrial ERP, atrial fibrillation |
| Ventricle | Rate, ventricular ERP, ventricular tachyarrhythmias |
| Conduction | Atrioventricular node conduction time and capacity |
| Intra-atrial and interatrial conduction | |
| Intraventricular and interventricular conduction | |
| Mechanical Remodeling | |
| Atrium | Size, function, structure |
| Ventricle | Size, function, structure |
| Pressure changes | End-diastolic pressure, pulmonary artery pressure (and wedge pressure), venous pressure |
| Neurohormonal Changes | |
| Sympathovagal imbalance | Heart rate variability |
ERP, Effective refractory period.
Electrical remodeling in either the atrium or the ventricle will result in changes in normal automaticity, conduction properties, and refractory period and will predispose to atrial fibrillation (AF) and ventricular tachyarrhythmias. Arrhythmias are routinely monitored and treated by CIED, either by pacing or defibrillation. The effective refractory period (ERP) can be monitored by physician-activated electrical stimulation through a programmer. Monophasic action potential duration could be assessed by telemetry in some early devices.70 Using fractal-coated iridium electrodes, the paced unipolar ventricular signal was found to correlate with acutely measured monophasic potential. However, the implications of ERP monitoring remain uncertain. Intrachamber and interchamber conduction times in heart failure are important because they are either the result or the cause of electrical remodeling in heart failure. A wide left bundle branch block (LBBB) QRS complex is associated with ventricular dyssynchrony and impaired LV function. In a postmortem series of 34 patients with premorbid serial ECGs, progressive PR and QRS prolongation occurred with worsening of heart failure. Cardiac mass index was also significantly correlated with V1-V6 R-wave amplitudes.71 Optimal left-sided atrioventricular (AV) and cross-chamber sequencing are important for the proper systolic function of the heart (see Chapter 30). Although relatively simple, these conduction parameters have not been examined as long-term predictors of cardiac decompensation. The major development of sensors in heart failure monitoring is to track mechanical remodeling, including chamber size, pressure changes, and pulmonary congestion consequent on heart failure. Such sensors use either impedance or specialized pressure-sensing leads or devices.
 Sensors for Heart Failure
Sensors for rate adaptation can be classified according to the technical instrumentation. Table 5-7 summarizes the sensors that have been used for or proposed to monitor the events of heart failure. The paced QRS complex enables the QT duration to be evaluated. In addition, the RV-evoked response, measured as the ventricular depolarization gradient, has been proposed as a marker that is sensitive to catecholamines.72 These sensors have long been used as surrogate markers of sympathetic level that increases with exercise, with a view toward rate-adaptive pacing. It is uncertain if they are also good markers of increase sympathetic tone that accompanies heart failure. Heart rate variability (HRV) can be measured in a non-pacing-dependent patient and is a well-established prognostic marker of heart failure because it reflects sympathovagal imbalance.73 Reduced HRV precedes heart failure events. Although percentage of biventricular pacing and HRV are rhythm diagnostics rather than implantable sensors, they provide important indications of the prevailing heart failure status.
| Sensors | Parameters |
|---|---|
| Electrogram | Percentage of pacing |
| ST segment | |
| AF | |
| Ventricular arrhythmias | |
| Paced QRS | |
| Paced QT interval | |
| Heart rate variability | |
| Intraventricular impedance | LV size and function |
| Specialized lead | PEA to monitor LV function |
| PA pressures | |
| PA wedge pressures | |
| LA pressures | |
| Transthoracic impedance | Pulmonary edema |
| Minute ventilation | |
| Accelerometers | Activity level |
AF, Atrial fibrillation; LA, left atrial; LV, left ventricular; PA, pulmonary artery; PEA, peak endocardial acceleration.
Activity Monitoring
Kadhiresan et al.74 reported the use of externally attached accelerometers at the chest wall to monitor walking distance in heart failure patients. Using an acceleration threshold of 50 mG, a walking speed of 2 mph (≅2.8 METS) could be detected in a group of 30 patients. The activity log index so defined was closely related to the walking distance and increased when patients were tested during CRT-on versus CRT-off phase. Similarly, time per day with physical activity greater than a threshold of 70 steps/min was detected in an implanted accelerometer sensor,75 and the activity level trend was similar to HRV trending during ADHF and correlated with NYHA functional class at baseline (Fig. 5-16).
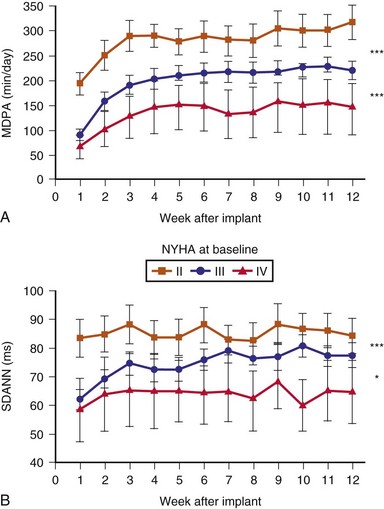
Figure 5-16 Activity and heart rate variability (HRV) after CRT implantation.
(From Braunschweig F, Mortensen PT, Gras D, et al: Monitoring of physical activity and heart rate variability in patients with chronic heart failure using cardiac resynchronization devices. InSync III Study Investigators. Am J Cardiol 95:1104-1107, 2005.)
Heart Rate Variability
In patients with heart failure, neurohormonal activity predicts cardiovascular outcome.74 HRV is an indirect measure of autonomic tone and predicts both sudden and nonsudden cardiac death.76,77 HRV has been proposed not only to predict heart failure severity, but also to guide treatment and perhaps predict ADHF.
In a randomized study of 50 patients with an implanted CRT device, HRV was measured in the atrial sensing mode (VDD at 30 bpm) with either CRT-on or CRT-off.63 HRV, measured as the standard deviation (SD) of atrial cycle length of all atrial sensed beats, was 25% higher in the CRT-on versus the CRT-off arm and 27% higher when the patients were receiving a beta-adrenergic blocker. Thus, time-domain HRV improves with CRT, likely reflecting changes in both sympathetic and parasympathetic activities with heart failure improvement.
In Boston Scientific devices, HRV is measured by the so-called SDANN, the SD of the intrinsic intervals in the 288 5-minute segments of a day, averaged over a week. If the percentage of intrinsic beats is less than 67% for 24 hours, the data for that day are discarded. Using the SDANN in 113 heart failure patients with CRT, CRT reduced the mean heart rates and increased SDANN (from 69 ± 23 msec to 93 ± 27 msec) after 3 months (see Fig. 5-16). Furthermore, lack of HRV improvement predicts nonresponders to CRT.78
The HRV can be plotted at each heart rate over a 24-hour period, resulting in a so-called footprint79 (Fig. 5-17). The normalized size of the footprint is the “footprint number,” and the graph and number give an easy understanding of the HRV level: “the larger, the better.” In another cohort study, HRV using either SDANN or footprint predicted mortality in 842 patients implanted with a CRT device during 11.8 months of follow-up.80
A clinical score was derived based on 2-week postimplant diagnostic data (SDANN <43 msec, mean heart rate >74 bpm, footprint number <29, activity percent <5%) from a 436-patient cohort in the CRT RENEWAL study.81 Using this scoring system, patients could be triaged to low, moderate, and high risk. When applied to a separate group of CRT recipients in the HF-HRV cohorts, this scoring system accurately predicted the level of mortality risk (low 2.8%, moderate 10.1%, and high 13.4%) depending on tertiles of their score.
In Medtronic devices, a long-term measure of HRV, the SDAAM (SD of 5-minute median atrial sensed intervals) is used. The algorithm averages the 24-hour SD of intrinsic atrial cycle length and will exclude the day’s data if the percentage of atrial pacing exceeds 80% or an atrial high rate episode (AHRE) is detected. The change in SDAAM is compared to a rolling average of the preceding 6 months. The SDAAM, nighttime heart rate, and activity level were used to predict outcome and to detect heart failure hospitalization in 397 patients.82 Figure 5-18 shows that SDAAM less than 50 msec predicts overall mortality. Furthermore, the absolute value of SDAAM remained low in patients who were hospitalized or who died. SDAAM declined from 76 ± 27 msec to 64 ± 26 msec at hospitalization, and the change was apparent up to 3 weeks before the event. An algorithm was developed to use SDAAM to predict hospitalization (Fig. 5-19). At a threshold of 200-msec days, a sensitivity rate of 70% was associated with 2.4 false-positive events per patient-year of follow-up, at a median of 16 days before the event. The sensitivity is not affected by the use of beta blockade. The SDAAM is significantly better than the nighttime heart rate and activity level change for predicting heart failure. These data suggest that autonomic surveillance such as the use of HRV is a good way to monitor both heart failure prognosis and to predict ADHF. However, HRV is limited when there is a high percentage of atrial pacing and during atrial tachyarrhythmias, and medications may affect HRV measurements.
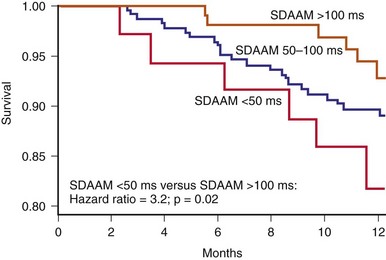
Figure 5-18 Kaplan-Meier survival curve for all-cause mortality in heart failure patients.
(From Adamson PB, Smith AL, Abraham WT, et al: Continuous autonomic assessment in patients with symptomatic heart failure: prognostic value of heart rate variability measured by an implanted cardiac resynchronization device. InSync III Model 8042 and Attain OTW Lead Model 4193 Clinical Trial Investigators. Circulation 110:2389-2394, 2004.)
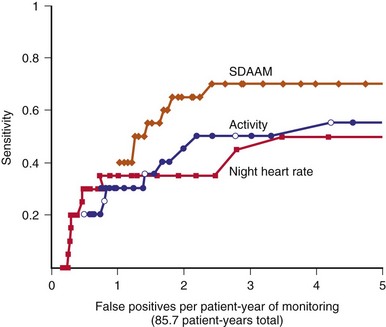
Figure 5-19 Comparison of detector performance for SDAAM, night heart rate, and patient activity.
(From Adamson PB, Smith AL, Abraham WT, et al: Continuous autonomic assessment in patients with symptomatic heart failure: prognostic value of heart rate variability measured by an implanted cardiac resynchronization device. InSync III Model 8042 and Attain OTW Lead Model 4193 Clinical Trial Investigators. Circulation 110:2389-2394, 2004.)
Percentage Biventricular Pacing
In a cohort retrospective analysis of two heart failure trials involving CRT-D (1812 patients), Koplan et al.82a analyzed the relationship between percentage of biventricular (BiV) pacing and the outcome of death and heart failure hospitalization. When subjects were divided into quartiles, there was a lower event rate with an increasing percentage of BiV pacing: 44% reduction in event rates in those paced 100% of the time versus those paced less than 92%. Even subjects paced 93% to 97% had a higher event rate than those paced between 98% and 99% (22% higher). The main reason for an inadequate percentage of pacing was atrial arrhythmias. Thus, a high percentage of BiV pacing (≥98%) is an important goal to achieve in patients with CRT.
A low percentage of BiV pacing is particularly the problem in those with AF, especially when AF is permanent. Because of frequent intrinsic conduction and fusion beats in AF, a high percentage of BiV pacing may still not reflect the percentage of true mechanically synchronized beats. In one study of 19 patients with permanent AF with diagnostic counters showing greater than 90% BiV pacing, 12-lead Holter was used to monitor “true” complete BiV capture using a template matching system.83 Only 9 to 19 (47%) had adequate complete BiV pacing, the remaining had either fusion or pseudofusion beats. Patients with 86.4% ± 17.1% full capture had one or more NYHA class improvement than those fully captured at only 66.8% ± 19.1% of the time. This study suggests careful evaluation of the percentage of BiV pacing using multiple surface ECG leads will be needed in patients with AF and conducted response, and sensors to detect full BiV capture will be an interesting development.
Right Ventricular Pressure
Pulmonary artery (PA) pressure and PAWP monitoring have been extensively studied in patients admitted with advanced heart failure.84–86 An implantable sensor that measures pressure has been incorporated into a pacing electrode with an initial application for rate adaptive pacing.87 This sensor is a hermetically sealed piezoelectric crystal with a diaphragm facing the bloodstream. Early experiences showed the ability of this sensor to record RV pressure continuously when connected to an implanted hemodynamic monitor.88,89
The Medtronic Chronicle IHM (Model 9520) is a nonpacing implantable pulse generator capable of external radiofrequency connection and integration in a Web-based data system, with 128 kilobytes of RAM for continuous storage of sensor data. Piezoelectric activity from a passive-fixation lead in the RV outflow tract is sampled up to once every 2 seconds, timed to the sensed unipolar RV electrogram (EGM). The sensor frequency is linear up to 100 Hz, and a 60-Hz high-pass filter is used. The frequency and timing of RV systolic pressure sampling are programmable, often at early morning when the subject is likely to be supine and rested. In addition, instantaneous high-resolution recordings can be made using an external triggering device. RV pressures (systolic, diastolic, dP/dt) are recorded, and RV systolic reflects PA systolic pressure. Prior studies have assessed the ability to estimate PA diastolic pressure from the RV pressure waveform.90 The minimum PA pressure occurs at pulmonic valve opening. This is estimated at the time of the maximum positive RV dp/dt, which is simultaneous with the RV preejection period (Fig. 5-20). Preimplant calibration pressure is required to allow absolute pressure measurement. An external barometric pressure measurement device provides external pressure reference against which sensor data can be calibrated.
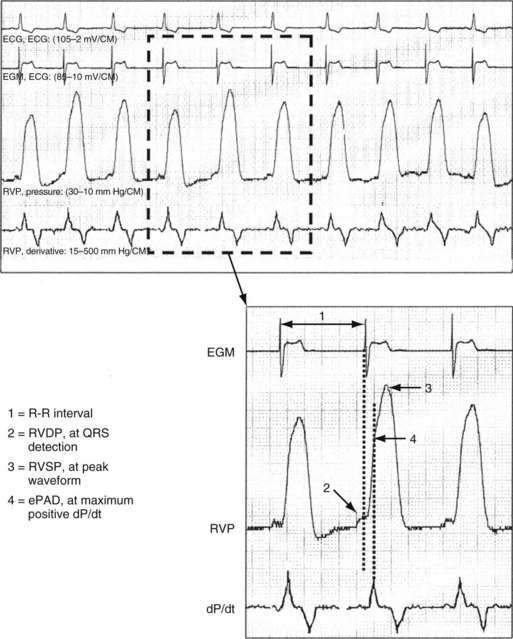
Figure 5-20 Real-time right ventricular (RV) pressure waveforms.
(From Adamson PB, Magalski A, Braunschweig F, et al: Ongoing right ventricular hemodynamics in heart failure: clinical value of measurements derived from an implantable monitoring system. J Am Coll Cardiol 41:565-571, 2003.)
Feasibility Study
The long-term stability of the pressure sensor has been previously reported.89,90 In one study, serial Swan-Ganz catheterizations at 3, 6, and 12 months after implant showed a small baseline error at 12 months of less than 1 mm Hg from the time of implantation.91 Furthermore, the accuracy of pressure measured is not affected by body posture.
As mentioned earlier, Adamson et al.63 studied 32 patients with heart failure who received a Chronicle IHM and found that long-term RV pressure was stable in most patients. In some, however, it showed significant variability despite measurements being taken at 4 am with no activity level registered. During a total of 36 volume-overloaded events, RV systolic pressure increased by 25% ± 4%, heart rate by 11% ± 2%, and estimated PA diastolic pressure by 26% ± 4%. In all events, pressures were increased 1 day before the required clinical intervention. In patients with heart failure hospitalization, increases in one of the pressures occurred in 9 of 12 events, whereas this occurred in 9 of 24 patients during a nonhospitalized episode (see Fig. 5-15). During a volume-depleted state in seven patients, RV pressure parameters were reduced. All patients returned to baseline levels after therapeutic intervention. The authors further reported that sustained increase in one of the pressures (>20% from baseline) occurred in patients subsequently admitted, at a mean of 4.2 days before admission. When the device data were available to the monitoring physician, a reduction in heart failure hospitalization was subsequently observed. This important study also documents the time sequence of RV pressure changes that occurred before heart failure exacerbation, suggesting that pressures increase for several days and reduce the patient’s “tolerable reserve” before the final increase in pressures leading to clinical heart failure exacerbation.
Zile et al.92 compared the ongoing RV hemodynamics between patients with systolic and diastolic heart failure during heart failure events. RV diastolic pressure was elevated in both conditions, although there was a trend for more rapid RV diastolic pressure elevation to occur in diastolic heart failure with less compliant ventricles than during systolic heart failure.
Clinical Outcome Studies
The COMPASS-HF (Chronicle Offers Management to Patients with Advanced Signs and Symptoms of Heart Failure) study prospectively randomized 274 NYHA Class III or IV heart failure patients into a conventional care group or a group with therapy also guided by Chronicle-derived RV pressure parameters.93 The two safety endpoints documented no pressure sensor failure and an 8% implanted system complication. During 6-month follow-up, there was a statistically insignificant trend for reduction of either heart failure hospitalization or the need of intravenous diuretics (primary endpoint) by 21%. Later analysis showed a 36% prolongation in time to the final heart failure-related hospitalization in the Chronicle-guided treatment group (Fig. 5-21). Bourge et al.93 suggest that the lack of significance in the primary endpoint may be caused by the lower-than-expected number of heart failure events (predicted 1.2, actual 0.85 per 6 patient-months), thus decreasing the power of the study. The lower event rate may result from enrollment in specialized centers with high compliance for heart failure treatment. Importantly, Chronicle-guided therapy resulted in 54% more adjustment in diuretic doses, without an increase risk in hypovolemic heart failure events. The study also included 70 of 274 patients with diastolic heart failure. A subgroup analysis found a 20% nonsignificant reduction in heart failure events when diastolic heart failure patients were managed with Chronicle-guided information.94 A large outcome study involving 850 patients with Class I to III patients with a single-lead ICD integrated with IHM using weekly transmission will examine the effect on heart failure events.94a The Chronicle ICD (Model 7286, Medtronic, Inc) uses a single RV apical shock coil and a pressure sensor electrode in the RV outflow track for pressure measurement from which PA diastolic pressure is estimated.
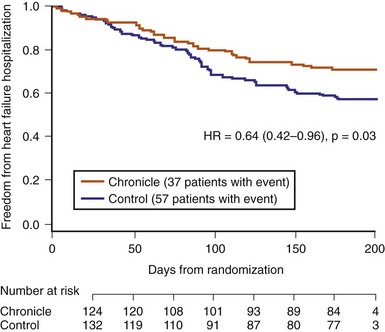
Figure 5-21 Time to first heart failure hospitalization in COMPASS-HF Study.
(From Bourge RC, Abraham WT, Adamson PB, et al: Randomized controlled trial of an implantable continuous hemodynamic monitor in patients with advanced heart failure: the COMPASS-HF study. J Am Coll Cardiol 51:1073-1079, 2008.)
Other Pressure Sensors
Left Atrial Sensor
The HeartPOD LA pressure monitoring device (St. Jude Medical) comprises an implantable sensor lead that is attached to a coil antenna for telemetry of sensor signals (Fig. 5-22). The sensor has a titanium pressure-sensing membrane of 3 × 7 mm and is capable of high-fidelity pressure, temperature, and EGM measurement. An external patient advisory module (PAM) sends a 125-kHz radiofrequency transmission to the antenna, which then captures 20 seconds of sensor data. The PAM has 13 megabytes of memory and can store about 3 months’ data of six recordings per day.
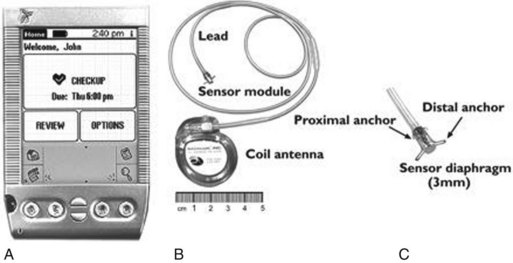
Figure 5-22 Left atrial (LA) pressure sensing device.
A, Patient advisory module. B, LA pressure sensing device. C, Close-up image of the sensor tip.
(From Ritzema J, Melton IC, Richards AM, et al: Direct left atrial pressure monitoring in ambulatory heart failure patients: initial experience with a new permanent implantable device. Circulation 116:2952-2959, 2007.)
In a single-center feasibility study, eight patients received the LA pressure device using a transseptal approach from the femoral vein.95 Venous entry at 1 cm above the inguinal ligament was achieved by conventional guidewire introduction in the femoral vein below the ligament as a landmark. After standard transseptal puncture, an 11-French sheath was placed in the LA, and the sensor was deployed until the distal set of anchors was on the left side of the interatrial septum. The sheath was then removed, and the sensor membrane was positioned 1 to 2 mm on the LA septum. All patients received dual-antiplatelet therapy for 6 months (aspirin, 160 mg, and clopidogrel, 75 mg, daily). The device was calibrated over time using Valsalva maneuver, with the PAM-measured expiratory pressure to equal LA pressure. Over 6 months, the net drift was 0.2 ±1.9 mm Hg per month, although much more in one patient. The authors emphasized the need to maintain the sensor orthogonal to the septum to avoid distortion of LA pressure waveform.
The Hemodynamically Guided Home Self-Therapy in Severe Heart Failure Patient (HOMEOSTASIS) trial enrolled 40 patients with NYHA Class III to IV heart failure.96 All patients had the LA pressure device implanted successfully, although sensor failure occurred in four, which was subsequently replaced in three patients. The study started after an initial 3-month period in which heart failure hospitalization, related events, and medications were documented. LA pressure data were then used to adjust the diuretic dosages. Survival without heart failure events occurred in 61% of patients at 3 years. Mean daily pressure therapy reduced LA pressure (from 17.6 to 14.8 mm Hg), frequency of high-pressure events (>25 mm Hg by 67%), and diuretic dosage, with better NYHA class, LVEF, and more frequent uptitration of angiotensin-converting enzyme (ACE) inhibitors.
Pulmonary Arterial Pressure Sensor
Diastolic PA pressure is often used as a surrogate measure of PAWP. An implantable wireless PA pressure transducer (W-IHM) has been developed (Cardio-MENS, Atlanta, GA, USA), which is capable of transmitting continuous PA pressure readings when powered by radiofrequency signal from outside (Fig. 5-23, A). In one study, the device has been shown to correlate with direct PA pressure measured invasively and with echocardiographic Doppler data.97 The cardioMENS Heart Sensor Allows Monitoring of Pressure to Improve Outcomes in NYHA Class III Heart Failure Patients (CHAMPION)97a,97b trial investigated the use of such a sensor in 550 patients in the U.S. Compared to 280 patients randomized to have the sensor information blinded and treated in the conventional manner, daily measurement of PA pressure with W-IHM in the 270-patient active group resulted in significant 39% reduction of heart failure hospitalizations (Fig. 5-23, B). There was no device failure, and system-related complications occurred in only eight patients, with a 1% implant related complication. All patients were either continued on warfarin or aspirin after 1 month of dual antiplatelet therapy. No episodes of pulmonary infarction or embolism were reported related to the sensor.
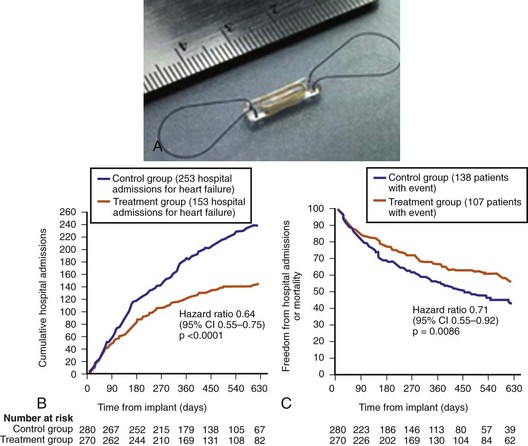
Figure 5-23 Wireless implantable pulmonary arter (PA) pressure sensor.
(From Abraham WT, Adamson PB, Bourge RC, et al: Wireless pulmonary artery haemodynamic monitoring in chronic heart failure: a randomized controlled trial. Lancet 377:658-666, 2011.)
The CHAMPION study is the first large study to confirm the role of implantable pressure sensor data to reduce heart failure morbidity. Unlike telemonitoring that involves only clinical and non-invasive heart failure parameters, the invasively derived PA pressure allows the physician to adjust neurohormonal, diuretic, or vasodilator drugs, with an aim to reduce PA pressure. In addition to the primary end point of hospitalization rate, there are also encouraging secondary outcomes, such as reduction in mortality (Fig. 5-23, C), improvement in QOL, and shorter duration of heart failure–related hospitalizations. There were more changes in medications, and the benefit occurred in both the systolic and non-systolic heart failure groups. Other implanted PA pressure devices are also under development. For example, an external ultrasound-activated PA pressure sensor in the right pulmonary artery that is fixed with a self-expanding wire mesh has been tested in 31 patients with chronic heart failure (PAPIRUS study) (InPressure, Remon Medical Technologies, Boston Scientific). Pressure values are reported to be similar to Millar catheter–measured data with no short term acute issues.97c
Intrathoracic Impedance for Pulmonary Fluid Status
Device Description
The concept of impedance to monitor pulmonary congestion is based on a canine experiment.98 The Medtronic OptiVol fluid management system uses transthoracic impedance to measure pulmonary fluid (Fig. 5-24). Low-voltage, nonstimulating currents are injected between RV ICD electrode (e.g., InSyn Sentry) or RV bipolar pacing electrode (e.g., Advisa) to the ICD or pacemaker casing between noon and 5 pm, at a time when the subject is presumably ambulant and upright. Sampling every 20 minutes is averaged to establish a baseline impedance level. The algorithm is inactive for the first 34 days after device implantation to allow time for postimplant pocket healing and electrode stabilization. When pulmonary fluid has accumulated beyond a programmable threshold, an alarm alerts the patient (or the physician via remote monitoring) (Fig. 5-25).
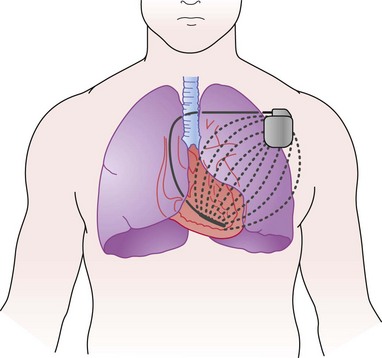
Figure 5-24 Intrathoracic impedance measurement by implantable system.
(From Yu CM, Wang L, Chau E, et al: Intrathoracic impedance monitoring in patients with heart failure: correlation with fluid status and feasibility of early warning preceding hospitalization. Circulation 112:841-848, 2005.)
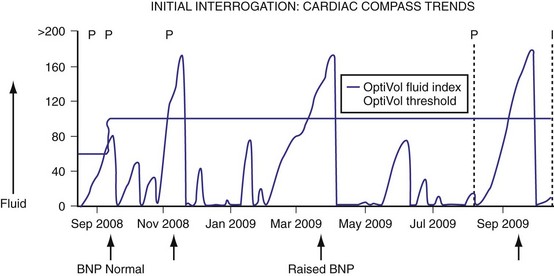
Feasibility Studies
The feasibility of using intrathoracic impedance to monitor fluid status has been tested in 34 patients with NYHA Class III or IV heart failure in the MID-Heft Study.64 A defibrillation lead in the RV apex was connected to a special pacemaker capable of injecting and sourcing impedance. Three impedance current vectors were tested: RV lead ring to device case and sampled from coil to device case; RV coil to device case and sampled from RV coil to device case; and RV ring electrode to device case and sampled from RV tip electrode to device case. The electrode pairs that use RV coil to device case are most suitable. An initial decrease in impedance, followed by an increase to steady state, is observed during pocket healing, which peaks by about 4 weeks.
During a follow-up period of 20 ± 8.4 months, 25 adjudicated heart failure hospitalizations occurred in 10 patients (Fig. 5-26). Intrathoracic impedance started to decrease before worsening symptoms at 15.3 ± 10.6 days, whereas dyspnea was reported, at the earliest, only 3 days before hospitalization. During 17 heart failure hospitalizations, PAWP was found to correlate significantly with impedance (r = −0.61, P < .001), and impedance increased as fluid removal occurred with diuresis (Fig. 5-27).
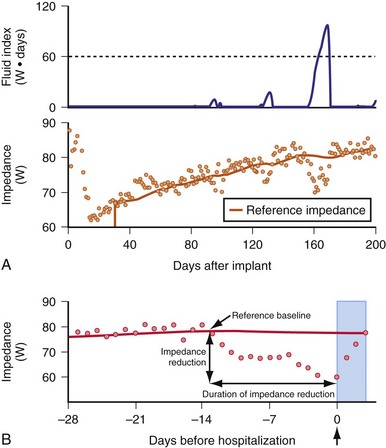
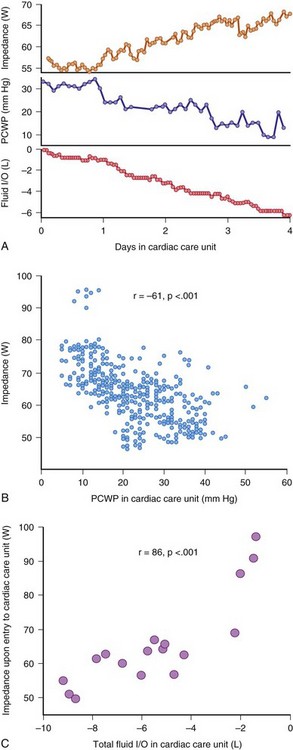
Figure 5-27 Data form heart failure patients (MID-Heft Study).
(From Yu CM, Wang L, Chau E, et al: Intrathoracic impedance monitoring in patients with heart failure: correlation with fluid status and feasibility of early warning preceding hospitalization. Circulation 112:841-848, 2005.)
An algorithm for detection of heart failure was derived from 6.2 patient-years of monitoring from 10 patients and tested in the remaining cohort (see Fig. 5-27). Depending on the set threshold for impedance crossing, a receiver-operator curve was constructed (Fig. 5-28). Lower detection thresholds lead to higher sensitivity to detect ADHF, but also to a higher false-positive rate of detection. Conversely, a higher threshold will be more specific but may underdetect some ADHF events. A level of 60 Ω/day was suggested, to give a sensitivity of 76.9% at the cost of 1.5 false-positives per patient-year of monitoring. Early warning occurred at 13.4 ± 6.2 days of heart failure hospitalization event. This landmark study shows that intrathoracic impedance is correlated with pulmonary congestion and changes days before ADHF.
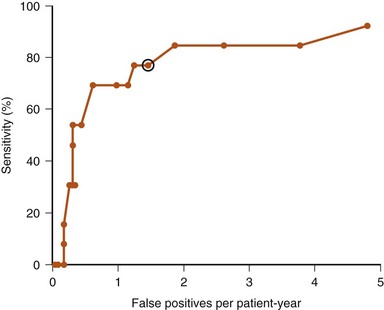
Clinical Outcome Studies
The impact of automatic OptiVol alert to guide therapy was observed in 532 patients with heart failure in the Italian OptiVol Study.99 With the OptiVol alert “on,” 67% of heart failure patients were detected who required hospitalization or therapy adjustment. Interestingly, in the patients with OptiVol alert “off,” heart failure hospitalization was significantly more frequent (20% vs. 7%). The study also showed a false-positive detection rate of 0.5 per patient-year of follow up.
Although impedance monitoring from RV coil to device case detects lung edema, measurement of RV and LV lead vectors may be able to assess LV volumes better. In 170 patients, 43 with replacement devices, Maines et al.100 showed that a 12-week maturation period was required for the pocket and the leads in first-time implants. However, a similar adaptation, but stabilizing earlier, was still required for the replacement group, suggesting the adaptation partly results from the leads or algorithm itself. Using the RV-LV impedance vectors, this study suggests that significant differences exist in impedance in the volume responder versus nonresponder groups, with a higher BiV-measured impedance in the responders, indicating a role for impedance in tracking responders to CRT.
The ability of OptiVol to reflect heart failure outcome has been examined in several cohort studies. In a multicenter studies of 558 heart failures with InSync Sentry from 34 Italian centers, device-recorded OptiVol fluid index above 60 Ω/day was associated with a 36% increased risk of heart failure hospitalization over 326 ± 216 days of follow-up.101 Multivariate analysis showed that in addition to OptiVol level, a higher percentage of days with low activity, low HRV, and increased nighttime heart rate were independent predictions of hospitalization. In 62 patients with OptiVol algorithm, prospective observational measurements of NT-pro-BNP and clinical heart failure status were collected over 27 ± 2 weeks.102 There was a significant but weak relationship in all pooled change in impedance and change in BNP level over all the visits (r = 0.30; P < .001). However, BNP level increased significantly when an OptiVol alert was associated with clinical signs of ADHF (89 ±25% increase) versus an insignificant increase in those without signs (25% increase). In patients with an alert, BNP increased by more than 10% in most events. By the time of patient medical visit, impedance continued to fall, suggesting worsening heart failure status (Fig. 5-29). In 42% of cases, a device alert was not related to clinical signs of heart failure, although BNP overall increased by 25% in these patients. Furthermore, the number of days and the duration of time that OptiVol fluid level exceeds threshold are reported to have positive prediction of the subsequent frequency of ADHF102a (Fig. 5-30).
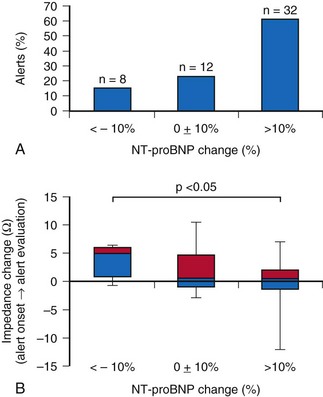
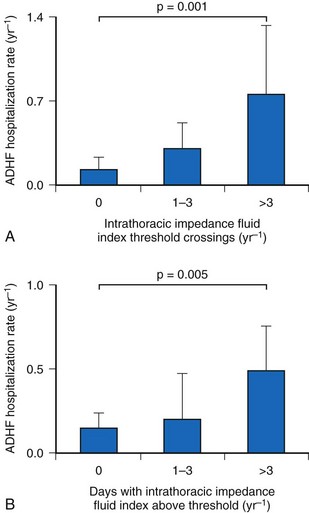
The usefulness of OptiVol to prevent heart failure admissions was reported in a single-center case-control study of 27 patients with InSync Sentry compared with a clinically similar group of 27 patients with CRT-D without OptiVol.103 In patients with OptiVol monitoring, 12 of 27 had alerts resulting in intervention. Hospitalization occurred in only 1 of 27 over 1-year follow-up. In contrast, in the control patients, 7 of 27 had heart failure hospitalizations. When coupled with remote patient monitoring (Medtronic Carelink), 20 of 28 OptiVol alerts (71%) in 67 patients could be remotely managed.104 In one study, crossing the OptiVol threshold (>60 Ω/day) was related to a higher risk of atrial fibrillation.105 Atrial tachycardia occurred in 43% of patients before and in 29% after OptiVol level crossing. This relationship was not observed in another study, which did show a higher prevalence of ventricular tachycardia and ventricular fibrillation (VT/VF) at a lower level of OptiVol (15-45 Ω/day), suggesting VT/VF occurred at a time of volume overload.106
The threshold for OptiVol alert was also tested in 115 patients implanted with the Medtronic InSync Sentry CRT-D.107 During follow-up of 9 ± 5 months, 45 OptiVol alerts occurred in 30 patients; 15 alerts (33%) were correlated with clinical signs and symptoms of heart failure, and the authors suggested an increase of threshold to 90 Ω/day may increase the specificity to 73%. They found no cause for false-positive alerts, but heart failure patients had significantly higher OptiVol level versus those without. On the other hand, in the European InSync Sentry Observational Study on 373 subjects,108 the level of 60 Ω/day was associated with a 60% sensitivity and 60% positive prediction of ADHF. Nine of 53 events (17%) were not associated with an OptiVol alert, and in an additional 11 events, an increase in OptiVol level occurred but did not exceed the programmed detection threshold. When compared to daily body weight measurement, OptiVol crossing has a higher sensitivity (76% vs 23%), a lower rate of unexplained detection (1.9 vs 4.3/patient-year), suggesting that impedance is a useful and better marker to weight change for heart failure monitoring.108a These studies confirm the usefulness of intrathoracic impedance to monitor ADHF but emphasize the need for fine-tuning the detection algorithm and individual programming of OptiVol detection level.
Advantages and Limitations
Intrathoracic impedance is one of the most extensively used sensors for monitoring heart failure. Its advantages include the relative ease of instrumentation, requiring no additional leads or complex implantation. The battery energy expenditure is low. Intrathoracic impedance has been relatively well characterized in acute setting and for long-term monitoring. Although sensitive, its specificity may be limited because impedance in the vector used may be affected by clinical events that do not indicate pulmonary congestion, such as pleural effusion109 (Table 5-8).
TABLE 5-8 Possible Causes of Increased OptiVol Fluid Index in Absence of Pulmonary Congestion
| Mechanism | Examples |
|---|---|
| Blood viscosity | Anemia |
| Extrapulmonary changes | Pneumothoracic |
| Pleural effusion | |
| Right-sided heart failure | Peripheral edema not detected |
| Pulmonary changes | Pneumonia |
Intracardiac Impedance
Impedance signals derived from fully intracardiac electrodes better reflect cardiac volume changes than transthoracic impedance. Indeed, Salo et al.110 reported the use of a tripolar RV lead to measure RV volume changes during the cardiac cycle, from which RV volume and contractility can be derived for rate-adaptive pacing. With the addition of an LV lead in CRT, more accurate measurement of LV volume is now possible for heart failure monitoring.
Unipolar Impedance from Right Ventricle
Unipolar impedance from the RV apex to the CIED casing samples a small region in the cardiac apex. This results in a signal recorded by the closed-loop stimulation (CLS) sensor (see earlier). Because most current is lost over a distance of about 1 cm from the apex, the signal reflects regional contractility of the ventricle rather than a change in stroke volume. While during acute induction of ventricular fibrillation, the fall in unipolar RV impedance reflects the fall in arterial pressure, the sensitivity is insufficient to discriminate between hemodynamically stable ventricular tachycardia and supraventricular tachycardia.111 These results suggest that unipolar impedance reflects LV contractility only when the changes are significant, and it may not be able to detect small changes in cardiac contractility, as in heart failure monitoring.
Multipolar Impedance
Several groups and manufacturers have investigated the optimal electrode arrangement for detecting ventricular volumes. With currents flowing between intracardiac electrodes (RV, LV, and RA) and to the CIED casing, enlargement in ventricular volumes will decrease impedance as more of the heart is encompassed. Examining four intrathoracic and two intracardiac vectors in 16 dogs and five sheep, Panescu et al.112 monitored cardiac function with biweekly cardiac catheterization and echocardiography and LA pressure with an implantable pressure sensor. After several weeks of high-rate pacing to induce heart failure, LVEF decreased significantly (52% to 34%), with increases in LV end-diastolic volume (65 to 97 mL), LV end-diastolic pressure (7 to 16 mm Hg), and LA pressure (7 to 26 mm Hg). Impedance value measured by all vectors decreased with the onset of heart failure (Fig. 5-31). The maximum decrease occurred with LV-can and LV-RV vectors. Importantly, LV-can impedance changes more with heart failure than vectors involving the right-sided heart electrodes (RA-can, RV-can, and RV coil-can), and RV-LV and LV-RA changes were intermediate. LA pressure correlated best with LV-can impedance (r2 = 0.73) than RV-can (r2 = 0.43) and RV coil-can (r2 = 0.52). Circadian variation in impedance also decreased in heart failure (5% ± 2% to 2% ± 1%). Thus, in these animal models, incorporation of an LV vector significantly improved the detection of LV volume increase in heart failure.
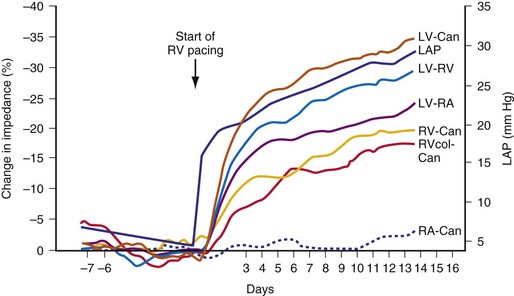
Figure 5-31 Impedance value measured by all vectors.
(From Panescu D, Naware M, Siou J, et al: Usefulness of monitoring congestive heart failure by multiple impedance vectors. Proc IEEE Eng Med Biol Soc 2008:5668-5670, 2008.)
Biventricular impedance has been measured using a quadripolar electrode arrangement.113,114 In nine mini-pigs with pacing-induced heart failure, biphasic pulses (15 µsec pulse width, 600 µA constant current amplitude) were injected between the RV ring and tip electrode, and impedance was sourced using the LV ring and tip electrode.114 The impedance signal (measured as voltage divided by 600 µA current) was recorded using 8-bite resolution, and the mean impedance was calculated over the entire cardiac cycle. “Stroke impedance” was calculated by the difference between impedance values during systole and diastole. “Systolic impedance” was defined as the highest impedance 50 to 500 msec after the R wave, whereas diastolic impedance was measured by a 20-msec window within the R wave. After 20 days of heart failure induction by rapid pacing in these animals, the increase in LV end-diastolic pressure was found to be significantly correlated with the end-diastolic impedance, which decreased by 30% (r = −0.81; P < .001). End-diastolic volume also trended in the same direction as the impedance value, which decreased by 20%. The corresponding measured intrathoracic impedance decreased by 8%, which had a poorer correlation with the end-diastolic pressure. The less striking change of intrathoracic impedance versus BiV-measured impedance might be attributed to the countering effect of lead/device casing maturation, which did not occur with BiV impedance, and pulmonary fluid collection being relatively less in the porcine model of mild heart failure studied (Fig. 5-32).
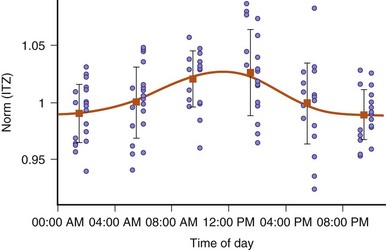
Figure 5-32 Variation in intrathoracic impedance depends on time of day.
(From Stahl C, Beierlein W, Walker T, et al: Intracardiac impedance monitors hemodynamic deterioration in a chronic heart failure pig model. J Cardiovasc Electrophysiol 18:985-990, 2007.)
These animal experiments suggest that biventricular impedance can be used to monitor the LV size and pressure changes that occur with heart failure. The theoretical advantages over transthoracic impedance are no significant time lag for lead/pocket maturation and no influence of changes in pulmonary condition on impedance values (e.g., pleural effusion, pneumonia). Because LV end-diastolic pressure increases before pulmonary edema occurs, this sensor can be used to detect deterioration of early heart failure that has not resulted in significant pulmonary fluid accumulation, and to monitor LV function. The limitations include the need for an LV lead (which restricts its use to a CRT device), dependence on the relative position of RV-LV leads (only relative changes rather than absolute value can be detected), and significant diurnal (and possibly postural) changes that must be considered in an implantable system (see Fig. 5-32).
Clinical Studies
An acute study of BiV impedance in 14 heart failure patients during implantation of a CRT device also tested the effect of different LV lead locations on BiV impedance measurements; changes in stroke volume were induced with overdrive pacing115 (Fig. 5-33). Data from 20 overdrive pacing episodes and six lead locations showed good correlation between measured stroke impedance and stroke volume (r = 0.82 ± 0.10) and pulse pressure (r = 0.81 ± 0.16). The authors reported no significant effect of LV lead positions on the efficacy of impedance measurement, although accuracy and signal size tended to be better in the midventricular region than in either the basal or the apical region. Lack of lead fixation was suggested for the one outlier in the study. At present, limited data are available on long-term outcome of these devices.
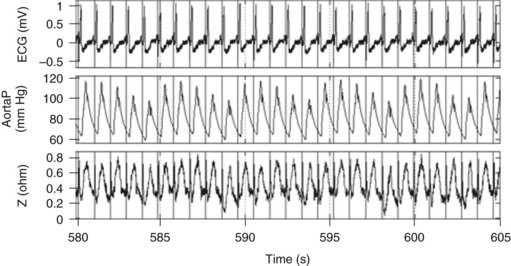
Figure 5-33 Biventricular (BiV) impedance in study of 14 heart failure patients.
(From Bocchiardo M, Meyer zu Vilsendorf D, Militello C, et al: Intracardiac impedance monitors stroke volume in resynchronization therapy patients. Europace 12:702-707, 2010.)
Table 5-9 summarizes the relative merits and limitations of intrathoracic and biventricular (intracardiac) impedance. In patients with a suitable device (i.e., LV lead), combined transthoracic and BiV impedance likely can be used.
TABLE 5-9 Intrathoracic vs. Intracardiac (Biventricular) Impedance
| Intrathoracic Impedance | Biventricular Impedance | |
|---|---|---|
| Heart failure parameters | Pulmonary edema | LV volume |
| Electrode arrangement | RV lead or coil to casing (tripolar) | RV-LV bipoles (quadripolar) |
| Lead/casing maturation | Takes about 1 month | Less |
| Influence of lung disease | Yes | Less |
| Influence of lead location | Less | Likely significant |
| Circadian and postural effect | Yes | Yes |
| Sensitivity and specificity | About 70% (depends on threshold) | N/A |
| Applicability | Pacemakers and ICD | CRT-P or CRT-D |
| Clinical evaluations | Relatively extensive | Limited |
CRT, cardiac resynchronization therapy; D, defibrillation ; ICD, implantable cardioverter-defibrillator; LV, Left ventricular; N/A, not available; P, pacing; RV, right ventricular.
Minute Ventilation
Because heart failure leads to compensatory hyperventilation (especially in the resting state), an expert system has been tested that combines activity and MV to predict heart failure.116 The algorithm includes (1) mean daily resting MV and MV during activity and (2) mean daily activity level. A stable MV and activity level will suggest stable clinical heart failure, whereas an increase in MV, especially at rest and combined with decrease in activity, suggests deteriorating heart failure. Conversely, a stable MV level with increase in activity indicates recovery from heart failure. A total of 19 patients with no heart failure history who had received a Talent DDDR (Sorin-ELA) were compared with 48 heart failure patients with a Talent CRT pacemaker. While mean activity was similar, the resting and activity MV levels were higher in the CRT group. Overall, the expert system resulted in a sensitivity of 88%, specificity of 94.7%, positive predictive value of 71%, and negative predictive value of 98.2% for heart failure detection.
ST-Segment Shift
An ST-segment deviation either heralds ischemia or myocardial injury. Myocardial ischemia requires medical therapy or revascularization, especially in symptomatic individuals. Myocardial injury, on the other hand, calls for medical emergency reperfusion. Prompt treatment of a myocardial infarction (MI) will significantly reduce mortality. Delay in patient recognition of MI-induced chest pain (or “silent” MI) contributes significantly to delayed MI presentation.117 Because long-term external ambulatory electrocardiographic recording is unlikely to be practical, electrograms have been proposed to reflect infarct and ischemia in an animal model.118 Incorporation into a CIED with patient alert and remote monitoring allows ST-segment monitoring.
A limited number of Guardian devices have been implanted in humans.119 During angioplasty with temporary coronary artery occlusion, ST-segment deviations occurred, with a negative shift during left anterior descending artery occlusion and a positive shift in other arteries (Fig. 5-34). Ten abnormal alerts occurred in six patients, leading to coronary artery interventions. During stress testing, the EGM showed a much cleaner signal and greater shift than the corresponding surface ECG. Typically, a 40% ST depression in the EGM corresponds to −0.8 mV on the surface ECG. Because the EGM is recorded at the RV apex close to left anterior descending artery territory, ischemia in this artery leads to ST depression, whereas ischemia in other territories results in a reciprocal ST elevation. Further work is required to explore the ST-segment sensor’s ability to detect the problem artery.
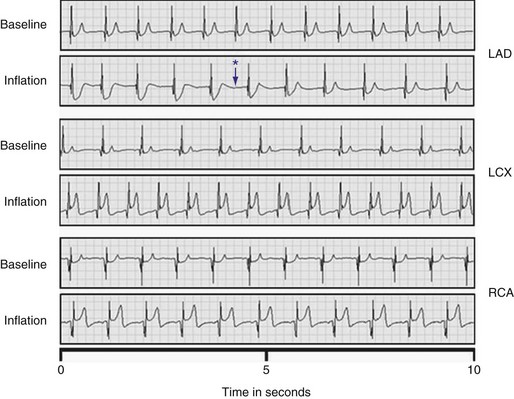
Peak Endocardial Acceleration
The PEA sensor has been used for rate adaptation. The PEA signal measures the closure sound of the mitral valve and reflects cardiac contractility. A minimal PEA signal occurs during optimal A-V interval in DDD devices120 and reflects the optimal A-V interval in most patients. A new CRT-P (New Living CHF, Sorin) is now available to monitor heart function and to program A-V interval in CRT device. Both contractility and LV filling contribute to PEA, and an index known as “PEA area” is derived from the PEA values at different A-V and V-V intervals. The maximum PEA area will define the optimal V-V and A-V interval for the patient.
In 15 patients implanted with CRT with PEA sensor, cardiac catheterization with LV dP/dt was measured with PEA area determined.35 A-V interval was scanned between 60 and 220 msec. The authors found a responder rate to CRT (defined as 10% increase in dP/dt) in 75% of patients. Concordance of PEA area versus dP/dt methods occurred in 8 of 12 patients. These data are interesting, although the role of PEA for A-V interval programming in the long term is uncertain, and the ability of the sensor to monitor LV function remains to be tested.
 Combined Heart Failure Diagnostics
The Program to Access and Review Trending Information and Evaluate Correlation to Symptoms in Patients with Heart Failure (PARTNERS HF) is an observational study on the use of diagnostics to predict heart failure.121 A total of 100 U.S. sites prospectively recruited 694 CRT-D patients and followed them for 11.7 ± 2 months. Table 5-10 shows the diagnostic data considered important in an algorithm to predict ADHF. A positive algorithm was defined as the occurrence of 22 events in eight variables during a 1-month period, including long duration of atrial fibrillation (AF), rapid AF rate, increased OptiVol fluid index, low patient activity, abnormal autonomic tone, and device therapy. A very high OptiVol fluid level (>100 Ω/day) alone is considered positive diagnosis of ADHF.
TABLE 5-10 Eight Cardiac Compass Heart Failure Device Diagnostic Parameters and Algorithms Used in PARTNERS Heart Failure Study
| Diagnostic Parameter | Algorithm |
|---|---|
| Atrial fibrillation (AF) duration | AF ≥6 hours on at least 1 day in patients without persistent AF (7 consecutive days with ≥23 hours of AF) |
| Ventricular rate during AF | AF = 24 hours and average ventricular rate during AF ≥90 bpm on at least 1 day |
| Fluid index (OptiVol) | High fluid index on at least 1 day; thresholds included ≥60, ≥80, and ≥100 Ω/day |
| Patient activity | Average patient activity <1 hour over 1 week (nonoverlapping weekly windows) |
| Night heart rate | Average night heart rate >85 bpm for 7 consecutive days (nonoverlapping weekly windows) |
| Heart rate variability (HRV) | HRV <60 msec every day for 1 week (minimum 5 measured days) (nonoverlapping weekly windows) |
| Percentage of pacing CRT | Ventricular pacing ≤90% for 5 of 7 days (nonoverlapping weekly windows) |
| ICD shock for potentially lethal VT/VF | ≥1 shocks during the evaluation period |
CRT, cardiac resynchronization therapy; HF, Heart failure; bpm, beats per minute; ICD, implantable cardioverter-defibrillator; VT/VF, ventricular tachycardia/ventricular fibrillation.
Data from Whellan DJ, Ousdigian KT, Al-Khatib SM, et al; PARTNERS Study Investigators: Combined heart failure device diagnostics identify patients at higher risk of subsequent heart failure hospitalizations: results from PARTNERS HF (Program to Access and Review Trending Information and Evaluate Correlation to Symptoms in Patients with Heart Failure) study. J Am Coll Cardiol 55:1803-1810, 2010.)
In PARTNERS heart failure, 90 patients had 141 adjudicated heart failure events, occurring 60 days after implantation. A positive combined diagnostic set predicts a 5.5-fold increased risk of hospitalization in the next month, even after adjusting for the clinical variables (Fig. 5-35). Figure 5-36 shows the main diagnostic parameters are OptiVol level of 60 Ω/day or greater, low activity, and heart rate variability (HRV). Additional OptiVol (≥100 Ω/day; 28% of patients) is also predictive of ADHF. Further subgroup analysis suggests that the specificity of ADHF improves with a higher fluid index and using more non-fluid-related indices at the expense of lower specificity. Interestingly, in patients with a prior heart failure history, diagnostic parameters are no longer predictive. The reason for this post-hoc analysis is uncertain. Diagnostic accuracy improves if sampling is performed every 15 days versus less often (Fig. 5-37).
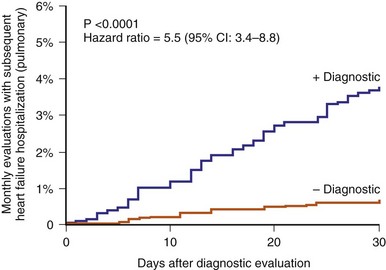
Figure 5-35 Kaplan-Meier estimates of heart failure risk.
(From Whellan DJ, Ousdigian KT, Al-Khatib SM, et al; PARTNERS Study Investigators: Combined heart failure device diagnostics identify patients at higher risk of subsequent heart failure hospitalizations: results from PARTNERS Heart Failure (Program to Access and Review Trending Information and Evaluate Correlation to Symptoms in Patients with Heart Failure) study. J Am Coll Cardiol 55:1803-1810, 2010.)
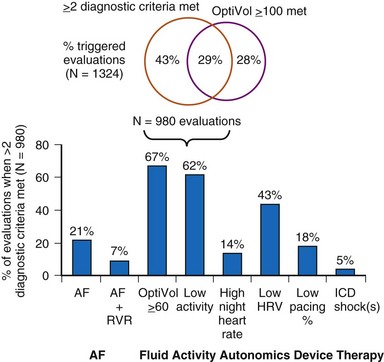
Figure 5-36 Combined heart failure device diagnostics triggered.
(From Whellan DJ, Ousdigian KT, Al-Khatib SM, et al; PARTNERS Study Investigators: Combined heart failure device diagnostics identify patients at higher risk of subsequent heart failure hospitalizations: results from PARTNERS Heart Failure (Program to Access and Review Trending Information and Evaluate Correlation to Symptoms in Patients with Heart Failure) study. J Am Coll Cardiol 55:1803-1810, 2010.)
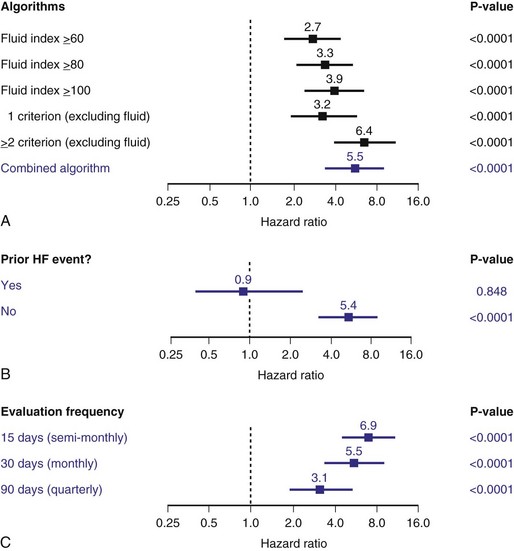
Figure 5-37 Risk stratification for different algorithms, heart failure event history, and evaluation frequencies.
Reproduced with permission. (From Whellan DJ, Ousdigian KT, Al-Khatib SM, et al; PARTNERS Study Investigators: Combined heart failure device diagnostics identify patients at higher risk of subsequent heart failure hospitalizations: results from PARTNERS HF (Program to Access and Review Trending Information and Evaluate Correlation to Symptoms in Patients with Heart Failure) study. J Am Coll Cardiol 55:1803-1810, 2010.)
 Conclusion
1 Karlof I. Haemodynamic effect of atrial triggered versus fixed rate pacing at rest and during exercise in complete heart block. Acta Med Scand. 1975;197:195-206.
2 Fananapazir L, Bennett DH, Monks P. Atrial synchronized ventricular pacing: contribution of the chronotropic response to improved exercise performance. Pacing Clin Electrophysiol. 1983;6:601-608.
3 Lau CP, Camm AJ. Role of left ventricular function and Doppler derived variables in predicting hemodynamic benefits of rate-responsive pacing. Am J Cardiol. 1988;62:906-911.
4 Tse HF, Siu CW, Lee KLF, et al. The incremental benefit of rate-adaptive pacing on exercise performance during cardiac resynchronization therapy. J Am Coll Cardiol. 2005;46:2292-2297.
5 Rickards AF, Norman J. Relation between QT interval and heart rate: new design of physiologically adaptive cardiac pacemaker. Br Heart J. 1981;45:56-61.
6 Wirtzfeld AL, Goedel-Meinen L, Bock T, et al. Central venous oxygen saturation for the control of automatic rate responsive pacing [abstract]. Circulation. 1981;64(Suppl IV):299.
7 Cammilli L. Initial use of a pH triggered pacemaker. Pacing Clin Electrophysiol. 1989;12:1000-1007.
8 Benditt DG, Mianulli M, Fetter J, et al. Single-chamber cardiac pacing with activity-initiated chronotropic response: evaluation by cardiopulmonary exercise testing. Circulation, 75. 1987:184-191.
9 Menozzi C, Brignole M, Moracchini PV, et al. Intrapatient comparison between chronic VVIR and DDD pacing in patients affected by high degree AV block without heart failure. Pacing Clin Electrophysiol. 1990;13:1816-1822.
10 Oldroyd KG, Ray AP, Carter R, et al. Double blind crossover comparison of the effects of dual chamber pacing (DDD) and ventricular rate adaptive (VVIR) pacing on neuroendocrine variables, exercise performance, and symptoms in complete heart block. Br Heart J. 1991;65:188-193.
11 Schuster P, Faerestrand S, Ohm OJ, et al. Proportionality of rate response to metabolic workload provided by a rate adaptive pacemaker with automatic rate profile optimization. Europace. 2005;7:54-59.
12 Duru F, Bloch KE, Weilenmann D, et al. Clinical evaluation of a pacemaker algorithm that adjusts the pacing rate during sleep using activity variance. Pacing Clin Electrophysiol. 2000;23:1509-1515.
13 Matula M, Alt E, Fotuhi P, et al. Rate adaptation of activity pacemakers under various types of means of locomotion. Eur J Cardiac Pacing Electrophysiol. 1992;2:49.
14 Lau CP, Mehta D, Toff WD, et al. Limitations of rate response of an activity-sensing rate–responsive pacemaker to different forms of activity. Pacing Clin Electrophysiol. 1988;11:141-150.
15 Lau CP, Ward DE, Camm AJ. Single-chamber cardiac pacing with two forms of respiration-controlled rate-responsive pacemaker. Chest. 1989;95:352-358.
16 Duru F, Radicke D, Wilkoff BL, et al. Influence of posture, breathing pattern, and type of exercise on minute ventilation estimation by a pacemaker transthoracic impedance sensor. Pacing Clin Electrophysiol. 2000;23:1767-1771.
17 Cole CR, Jensen DN, Cho Y, et al. Correlation of impedance minute ventilation with measured minute ventilation in a rate responsive pacemaker. Pacing Clin Electrophysiol. 2001;24:989-993.
18 Simon R, Ni Q, Willems R, et al. Comparison of impedance minute ventilation and direct measured minute ventilation in a rate adaptive pacemaker. Pacing Clin Electrophysiol. 2003;26:2127-2133.
19 Bonnet JL, Geroux L, Cazeau S. Evaluation of a dual-sensor rate-responsive pacing system based on a new concept. French Talent Dr Pacemaker Investigators. Pacing Clin Electrophysiol. 1998;25:2198-2203.
20 Mond HG, Kertes PJ. Rate-responsive pacing using a minute ventilation sensor. Pacing Clin Electrophysiol. 1988;11:1866-1874.
21 Lau CP, Antoniou A, Ward DE, et al. Initial clinical experience with a minute ventilation sensing rate modulated pacemaker: improvements in exercise capacity and symptomatology. Pacing Clin Electrophysiol. 1988;11:1815-1822.
22 Schaldach M, Hutten H. Intracardiac impedance to determine sympathetic activity in rate responsive pacing. Pacing Clin Electrophysiol. 1992;15:1778-1786.
23 Pichlmaier AM, Braile D, Ebner E, et al. Autonomic nervous system controlled closed loop cardiac pacing. Pacing Clin Electrophysiol. 1992;15:1787-1791.
24 Witte J, Reibis R, Pichlmaier AM, et al. ANS-controlled rate-adaptive pacing: clinical evaluation. Eur J Card Pacing Electrophysiol. 1996;6:53-59.
25 Wiegand U, Nuernberg M, Maier SK, et al. The COGNITION study rationale and design: influence of closed loop stimulation on cognitive performance in pacemaker patients. Pacing Clin Electrophysiol. 2008;31:709-713.
26 Occhetta E, Bortnik M, Audoglio R, et al. Closed loop stimulation in prevention of vasovagal syncope. Inotropy Controlled Pacing in Vasovagal Syncope (INVASY): a multicenter randomised, single-blind, controlled study. Europace. 2004;6:538-547.
27 Coenen M, Malinowski K, Spitzer W, et al. Closed loop stimulation and accelerometer-based rate adaptation: results of the PROVIDE study. Europace. 2008;10:327-333.
28 Clementy J. Dual-chamber rate-responsive pacing system driven by contractility: final assessment after 1-year follow-up. The European PEA Clinical Investigation Group. Pacing Clin Electrophysiol. 1998;21:2192-2197.
29 Gras D, Kubler L, Ritter P, et al. Recording of peak endocardial acceleration in the atrium. Pacing Clin Electrophysiol. 2009;32(Suppl 1):S240-S246.
30 Plicchi G, Marcelli E, Parlapiano M, et al. PEA-I and PEA-II based implantable haemodynamic monitor: preclinical studies in sheep. Europace. 2002;4:49-54.
31 Langenfeld H, Krein A, Kirstein M, et al. Peak endocardial acceleration–based clinical testing of the “BEST” DDDR pacemaker. European PEA Clinical Investigation Group. Pacing Clin Electrophysiol. 1998;21:2187-2191.
32 Bordachar P, Garrigue S, Reuter S, et al. Hemodynamic assessment of right, left and biventricular pacing by peak endocardial acceleration and echocardiography in patients with end-stage heart failure. Pacing Clin Electrophysiol. 2000;23:1726-1730.
33 Leung SK, Lau CP, Lau CT. Automatic optimization of resting a peak endocardial acceleration sensor: validation with Doppler echocardiography and direct cardiac output measurements. Pacing Clin Electrophysiol. 2000;23:1762-1766.
34 Deharo JC, Brunetto A, et al. DDDR pacing driven by contractility versus DDI pacing in vasovagal syncope: a multicenter, randomized study. Pacing Clin Electrophysiol. 2003;26:447-450.
35 Delnoy PP, Marcelli E, Oudeluttikhuis H, et al. Validation of a peak endocardial acceleration–based algorithm to optimize cardiac resynchronization: early clinical results. Europace. 2008;10:801-808.
36 Lau CP, Leung SK, Guerola M, et al. Efficacy of automatically optimized rate adaptive dual sensor to stimulate sinus rhythm: evaluation by continuous recording of sinus and sensor rates during exercise testing and daily activities. Pacing Clin Electrophysiol. 1996;19:1672-1677.
37 Leung SK, Lau CP, Tang MO, et al. New integrated sensor pacemaker: comparison of the rate responses between an integrated minute ventilation and activity sensor and single sensor modes during exercise and daily activities and non-physiological interference. Pacing Clin Electrophysiol. 1996;19:1664-1671.
38 Leung SK, Lau CP, Tang MO. Cardiac output is a sensitive indicator of difference in exercise performance between single and dual sensor pacemakers. Pacing Clin Electrophysiol. 1998;21:35-41.
39 Kay GN, Ashar MS, Bubien R, et al. Relationship between heart rate and oxygen kinetics during constant workload exercise. Pacing Clin Electrophysiol. 1995;18:1853-1860.
40 Leung SK, Lau CP, Wu CW, et al. Quantitative comparison of rate response and oxygen uptake kinetics between different sensor modes in multisensory rate adaptive pacing. Pacing Clin Electrophysiol. 1994;17:1920-1927.
41 Leung SK, Lau CP, Tang MO, et al. An integrated dual sensor system automaticity optimized by target rate histogram. Pacing Clin Electrophysiol. 1998;21:1559-1566.
42 Pieragnoli P, Colella A, Moro E, et al. Blended dual sensor does not give additional benefits to single sensor in DDDR PM patients: results from the DUSISLOG study. Heart Rhythm. 2005;2:S40-S41.
43 Coman J, Freedman R, Koplan BA, et al. A blended sensor restores chronotropic response more favorably than an accelerometer alone in pacemaker patients: the LIFE study results. Pacing Clin Electrophysiol. 2008;31:1433-1442.
44 Gilliam FR3rd, Giudici M, Benn A, et al. Design and rationale of the assessment of proper physiologic response with rate adaptive pacing driven by minute ventilation or accelerometer (APPROPRIATE) trial. J Cardiovasc Transl Res. 2011;4:21-26.
45 Lauer MS, Okin PM, Larson MG, et al. Impaired heart rate response to graded exercise: prognostic implications of chronotropic incompetence in the Framingham heart study. Circulation. 1996;93:1520-1526.
46 Azarbal B, Hayes SW, Lewin HC, et al. The incremental prognostic value of percentage of heart rate reserve achieved over myocardial perfusion single-photon emission computed tomography in the prediction of cardiac death and all-cause mortality: superiority over 85% of maximal age-predicted heart rate. J Am Coll Cardiol. 2004;44:423-430.
47 Lukl J, Doupal V, Sovova E, Lubena L. Incidence and significance of chronotropic incompetence in patients with indications for primary pacemaker implantation or pacemaker replacement. Pacing Clin Electrophysiol. 1999;22:1284-1291.
48 Protor EE, Leman RB, Mann DL, et al. Single versus dual chamber sensor-driven pacing: comparison of cardiac outputs. Am Heart J. 1991;122:728-732.
49 Wilkoff BL, Corey J, Blackburn G. A mathematical model of the cardiac chronotropic response to exercise. J Electrophysiology. 1989;3:176-180.
50 Kindermann M, Schwaab B, Finkler N, et al. Defining the optimum upper heart rate limit during exercise: a study in pacemaker patients with heart failure. Eur Heart J. 2002;23:1301-1308.
51 Vollmann D, Luthje L, Schott P, et al. Biventricular pacing improves the blunted force-frequency relation present during univentricular pacing in patients with heart failure and conduction delay. Circulation. 2006;113:953-956.
52 Lau CP. Comparative hemodynamic studies between different pacing modes. In: Lau CP, editor. Rate adaptive cardiac pacing. New York: Futura; 1993:55.
53 Lau CP, Rushby J, Leigh-Jones M, et al. Symptomatology and quality of life in patient with rate responsive pacemaker a double blind crossover study. Clin Cardiol. 1999;12:505-512.
54 Mabo P, Pouillot C, Kermarrec A, et al. Lack of physiological adaptation of the atrioventricular interval to heart rate in patients chronically paced in the AAIR mode. Pacing Clin Electrophysiol. 1991;14:2133-2142.
55 Lau CP, Tai YT, Leung WH, et al. Rate-adaptive pacing in sick sinus syndrome: effects of pacing modes and intrinsic conduction on physiological responses, arrhythmias, symptomatology and quality of life. Eur Heart J. 1994;15:1445-1455.
56 Passman R, Banthia S, Galvez D, et al. The effects of rate-adaptive atrial pacing versus ventricular backup pacing on exercise capacity in patients with left ventricular dysfunction. Pacing Clin Electrophysiol. 2009;32:1-6.
57 Van Hamel NM, Holwerda KJ, Slegers PC, et al. The contribution of rate-adaptive pacing with single or dual sensors to health-related quality of life. Europace. 2007;9:233-238.
58 Lamas GA, Knight JD, Sweeney MO, et al. Impact of rate-modulated pacing on quality of life and exercise capacity: evidence from the Advanced Elements of Pacing Randomized Controlled Trial (ADEPT). Heart Rhythm. 2007;4:1125-1132.
59 Tse HF, Wong KK, Siu CW, et al. Upgrading pacemaker patients with right ventricular apical pacing to right ventricular septal pacing improves left ventricular performance and functional capacity. J Cardiovasc Electrophysiol. 2009;20:901-905.
60 Fonarow GC, Heywood JT, Heidenreich PA, et al. ADHERE Scientific Advisory Committee and Investigators: Temporal trends in clinical characteristics, treatments, and outcomes for heart failure hospitalizations, 2002 to 2004: findings from Acute Decompensated Heart Failure National Registry (ADHERE). Am Heart J. 2007;153:1021-1028.
61 Ramani GV, Uber PA, Mehra MR. Chronic heart failure: contemporary diagnosis and management. Mayo Clin Proc. 2010;85:180-195.
62 Krumholz HM, Parent EM, Tu N, et al. Readmission after hospitalization for congestive heart failure among Medicare beneficiaries. Arch Intern Med. 1997;157:99-104.
63 Adamson PB, Magalski A, Braunschweig F, et al. Ongoing right ventricular hemodynamics in heart failure: clinical value of measurements derived from an implantable monitoring system. J Am Coll Cardiol. 2003;41:565-571.
64 Yu CM, Wang L, Chau E, et al. Intrathoracic impedance monitoring in patients with heart failure: correlation with fluid status and feasibility of early warning preceding hospitalization. Circulation. 2005;112:841-848.
65 Stevenson LW, Perloff JK. The limited reliability of physical signs for estimating hemodynamics in chronic heart failure. JAMA. 1989;261:884-888.
66 McGee SR. Physical examination of venous pressure: a critical review. Am Heart J. 1998;136:10-18.
67 Chandhry SI, Wang Y, Concato J, et al. Patterns of weight change preceding hospitalization for heart failure. Circulation. 2007;116:1549-1554.
68 Pfisterer M, Buser P, Rickli H, et al. BNP-guided vs. symptom-guided heart failure therapy. The Trial of Intensified vs. Standard Medical Therapy in Elderly Patients with Congestive Heart Failure (TIME-CHF) randomized trial. JAMA. 2009;301:383-392.
69 Klersy C, De Silvestri A, Gabutti G, et al. A meta-analysis of remote monitoring of heart failure patients. J Am Coll Cardiol. 2009;54:1683-1694.
69a Inglis SC, Clark RA, McAlister FA, et al: Structured telephone support or telemonitoring programmes for patients with chronic heart failure. Cochrane Database Syst Rev CD007228, 2010.
69b Ferrante D, Varini S, Macchia A, et al. Long-term results after a telephone intervention in chronic heart failure: DIAL (Randomized Trial of Phone Intervention in Chronic Heart Failure) follow-up. J Am Coll Cardiol. 2010;56:372-378.
69c Koehler F, Winkler S, Schieber M, et al. Impact of remote telemedical management on mortality and hospitalizations in ambulatory patients with chronic heart failure: the telemedical interventional monitoring in heart failure study. Circulation. 2011;123:1873-1880.
69d Chaudhry SI, Mattera JA, Curtis JP, et al. Telemonitoring in patients with heart failure. N Engl J Med. 2010;363:2301-2309.
70 Zrenner B, Ndrepepa G, Müssig D, et al. The recording of monophasic action potentials with fractal-coated iridium electrodes in humans. Pacing Clin Electrophysiol. 2000;23:54-62.
71 Wilensky RL, Yudelman P, Cohen AI, et al. Serial electrocardiographic changes in idiopathic dilated cardiomyopathy confirmed at necropsy. Am J Cardiol. 1988;62:276-283.
72 Callaghan F, Vollmann W, Livingston A, et al. The ventricular depolarization gradient: effects of exercise, pacing rate, epinephrine, and intrinsic heart rate control on the right ventricular evoked response. Pacing Clin Electrophysiol. 1989;12:1115-1130.
73 Cohn J, Levine TB, Olivari MT, et al. Plasma norepinephrine as a guide to prognosis in patients with chronic congestive heart failure. N Engl J Med. 1984;311:819-823.
74 Kadhiresan VA, Pastore J, Auricchio A, et al. Pacing therapies in congestive heart failure: a novel method—the activity log index—for monitoring physical activity of patients with heart failure. PATH-CHF Study Group. Am J Cardiol. 2002;89:1435-1437.
75 Braunschweig F, Mortensen PT, Gras D, et al. Monitoring of physical activity and heart rate variability in patients with chronic heart failure using cardiac resynchronization devices. InSync III Study Investigators. Am J Cardiol. 2005;95:1104-1107.
76 Bonaduce D, Petretta M, Marciano F, et al. Independent and incremental prognostic value of heart rate variability in patients with chronic heart failure. Am Heart J. 1999;138:273-284.
77 La Rovere MT, Pinna GD, Maestri R, et al. Short-term heart rate variability strongly predicts sudden cardiac death in chronic heart failure patients. Circulation. 2003;107:565-570.
78 Fantoni C, Raffa S, Regoli F, et al. Cardiac resynchronization therapy improves heart rate profile and heart rate variability of patients with moderate to severe heart failure. J Am Coll Cardiol. 2005;46:1875-1882.
79 Carbson G, Girouard S, Schlegl M, Butter C. Three-dimensional heart rate variability diagnostic for monitoring heart failure through an implantable device. J Cardiovasc Electrophysiol. 2004;15:506.
80 Roosevelt G, Singh JP, Mullin CM, et al. Prognostic value of heart rate variability footprint and standard deviation of average 5-minute intrinsic R-R intervals for mortality in cardiac resynchronization therapy patients. J Electrocardiol. 2007;40:336-342.
81 Singh JP, Rosenthal LS, Hranitzky PM, et al. Device diagnostics and long-term clinical outcome in patients receiving cardiac resynchronization therapy. Europace. 2009;11:1647-1653.
82 Adamson PB, Smith AL, Abraham WT, et al. Continuous autonomic assessment in patients with symptomatic heart failure: prognostic value of heart rate variability measured by an implanted cardiac resynchronization device. InSync III Model 8042 and Attain OTW Lead Model 4193 Clinical Trial Investigators. Circulation. 2004;110:2389-2394.
82a Koplan BA, Kaplan AJ, Weiner S, et al. Heart failure decompensation and all-cause mortality in relation to percent biventricular pacing in patients with heart failure: is a goal of 100% biventricular pacing necessary? J Am Coll Cardiol. 2009;27:355-360. 53
83 Kamath GS, Cotiga D, Koneru JN, et al. The utility of 12-lead Holter monitoring in patients with permanent atrial fibrillation for the identification of nonresponders after cardiac resynchronization therapy. J Am Coll Cardiol. 2009;53:1050-1055.
84 Steimle AE, Stevenson LW, Chelimsky-Fallick C, et al. Sustained hemodynamic efficacy of therapy tailored to reduce filling pressures in survivors with advanced heart failure. Circulation. 1997;96:1165-1172.
85 Gibbs JS, Keegan J, Wright C, et al. Pulmonary artery pressure changes during exercise and daily activities in chronic heart failure. J Am Coll Cardiol. 1990;15:52-61.
86 Nathan AW, Perry SG, Cochrane T, et al. Ambulatory monitoring of pulmonary artery pressure: a preliminary clinical evaluation. Br Heart J. 1983;49:33-37.
87 Lau CP, Butrous GS, Ward DE, Camm AJ. Comparison of exercise performance of six rate-adaptive right ventricular cardiac pacemakers. Am J Cardiol. 1989;63:833-838.
88 Ohlsson A, Nordlander R, Bennett T, et al. Continuous ambulatory haemodynamic monitoring with an implantable system: the feasibility of a new technique. Eur Heart J. 1998;19:174-184.
89 Steinhaus DM, Lemery R, Bresnahan DRJr, et al. Initial experience with an implantable hemodynamic monitor. Circulation. 1996;93:745-752.
90 Reynolds DW, Bartelt N, Taepke R, Bennett TD. Measurement of pulmonary artery diastolic pressure from the right ventricle. J Am Coll Cardiol. 1995;25:1176-1182.
91 Magalski A, Adamson P, Gadler F, et al. Continuous ambulatory right heart pressure measurements with an implantable hemodynamic monitor: a multicenter, 12-month follow-up study of patients with chronic heart failure. J Card Fail. 2002;8:63-70.
92 Zile MR, Bourge RC, Bennett TD, et al. Application of implantable hemodynamic monitoring in the management of patients with diastolic heart failure: a subgroup analysis of the COMPASS-HF trial. J Card Fail. 2008;14:816-823.
93 Bourge RC, Abraham WT, Adamson PB, et al. Randomized controlled trial of an implantable continuous hemodynamic monitor in patients with advanced heart failure: the COMPASS-HF study. J Am Coll Cardiol. 2008;51:1073-1079.
94 Zile MR, Bennett TD, St John Sutton M, et al. Transition from chronic compensated to acute decompensated heart failure: pathophysiological insights obtained from continuous monitoring of intracardiac pressures. Circulation. 2008;118:1433-1441.
94a Adamson PB, Conti JB, Smith AL, et al. Reducing events in patients with chronic heart failure (REDUCEhf) study design: continuous hemodynamic monitoring with an implantable defibrillator. Clin Cardiol. 2007;30:567-575.
95 Ritzema J, Melton IC, Richards AM, et al. Direct left atrial pressure monitoring in ambulatory heart failure patients: initial experience with a new permanent implantable device. Circulation. 2007;116:2952-2959.
96 Ritzema J, Troughton R, Melton I, et al. Physician-directed patient self-management of left atrial pressure in advanced chronic heart failure. Hemodynamically Guided Home Self-Therapy in Severe Heart Failure Patients (HOMEOSTASIS) Study Group. Circulation. 2010;121:1086-1095.
97 Verdejo HE, Castro PF, Concepción R, et al. Comparison of a radiofrequency-based wireless pressure sensor to Swan-Ganz catheter and echocardiography for ambulatory assessment of pulmonary artery pressure in heart failure. J Am Coll Cardiol. 2007;50:2375-2382.
97a Adamson PB, Abraham WT, Aaron M, et al. CHAMPION trial rationale and design: the long-term safety and clinical efficacy of a wireless pulmonary artery pressure monitoring system. J Card Fail. 2011;17:3-10.
97b Abraham WT, Adamson PB, Bourge RC, et al. Wireless pulmonary artery haemodynamic monitoring in chronic heart failure: a randomised controlled trial. Lancet. 2011;377:658-666.
97c Hoppe UC, Vanderheyden M, Sievert H, et al. Chronic monitoring of pulmonary artery pressure in patients with severe heart failure: multicentre experience of the monitoring Pulmonary Artery Pressure by Implantable device Responding to Ultrasonic Signal (PAPIRUS) II study. Heart. 2009;95:1091-1097.
98 Wang L, Lahtinen S, Lentz L, et al. Feasibility of using an implantable system to measure thoracic congestion in an ambulatory chronic heart failure canine model. Pacing Clin Electrophysiol. 2005;28:404-411.
99 Catanzariti D, Lunati M, Landolina M, et al. Monitoring intrathoracic impedance with an implantable defibrillator reduces hospitalizations in patients with heart failure. Italian Clinical Service OptiVol-CRT Group. Pacing Clin Electrophysiol. 2009;32:363-370.
100 Maines M, Landolina M, Lunati M, et al. Intrathoracic and ventricular impedances are associated with changes in ventricular volume in patients receiving defibrillators for CRT. Italian Clinical Service OptiVol-CRT Group. Pacing Clin Electrophysiol. 2010;33:64-73.
101 Perego GB, Landolina M, Vergara G, et al. Implantable CRT device diagnostics identify patients with increased risk for heart failure hospitalization. OptiVol-CRT Clinical Service Observational Group. J Interv Card Electrophysiol. 2008;23:235-242.
102 Lüthje L, Vollmann D, Drescher T, et al. Intrathoracic impedance monitoring to detect chronic heart failure deterioration: relationship to changes in NT-proBNP. Eur J Heart Fail. 2007;9:716-722.
102a Small RS, Wickemeyer W, Germany R, et al. Changes in intrathoracic impedance are associated with subsequent risk of hospitalizations for acute decompensated heart failure: clinical utility of implanted device monitoring without a patient alert. J Card Fail. 2009;15:475-481.
103 Maines M, Catanzariti D, Cemin C, et al. Usefulness of intrathoracic fluids accumulation monitoring with an implantable biventricular defibrillator in reducing hospitalizations in patients with heart failure: a case-control study. J Interv Card Electrophysiol. 2007;19:201-207.
104 Santini M, Ricci RP, Lunati M, et al. Remote monitoring of patients with biventricular defibrillators through the CareLink system improves clinical management of arrhythmias and heart failure episodes. J Interv Card Electrophysiol. 2009;24:53-61.
105 Jhanjee R, Templeton GA, Sattiraju S, et al. Relationship of paroxysmal atrial tachyarrhythmias to volume overload: assessment by implanted transpulmonary impedance monitoring. Circ Arrhythm Electrophysiol. 2009;2:488-494.
106 Ip JE, Cheung JW, Park D, et al. Temporal associations between thoracic volume overload and malignant ventricular arrhythmias: a study of intrathoracic impedance. J Cardiovasc Electrophysiol. 2011;22:293-299.
107 Ypenburg C, Bax JJ, van der Wall EE, et al. Intrathoracic impedance monitoring to predict decompensated heart failure. Am J Cardiol. 2007;99:554-557.
108 Vollmann D, Nägele H, Schauerte P, et al. Clinical utility of intrathoracic impedance monitoring to alert patients with an implanted device of deteriorating chronic heart failure. European InSync Sentry Observational Study Investigators. Eur Heart J. 2007;28:1835-1840.
108a Abraham WT, Compton S, Haas G, et al. Intrathoracic impedance vs daily weight monitoring for predicting worsening heart failure events: results of the Fluid Accumulation Status Trial (FAST). Congest Heart Fail. 2011;17:51-55.
109 Timperley J, Mitchell AR, Brown P, Betts TR. Changes in intrathoracic impedance from a pneumothorax: insights from an implanted monitoring system. Pacing Clin Electrophysiol. 2005;28:1109-1111.
110 Salo RW, Pederson BD, Olive AL, et al. Continuous ventricular volume assessment for diagnosis and pacemaker control. Pacing Clin Electrophysiol. 1984;7:1267-1272.
111 Kaye G, Arthur W, Edgar D, et al. The use of unipolar intracardiac impedance for discrimination of haemodynamically stable and unstable arrhythmias in man. Europace. 2006;8:988-993.
112 Panescu D, Naware M, Siou J, et al. Usefulness of monitoring congestive heart failure by multiple impedance vectors. Proc IEEE Eng Med Biol Soc. 2008;2008:5668-5670.
113 Zima E, Lippert M, Czygan G, Merkely B. Determination of left ventricular volume changes by intracardiac conductance using a biventricular electrode configuration. Europace. 2006;8:537-544.
114 Stahl C, Beierlein W, Walker T, et al. Intracardiac impedance monitors hemodynamic deterioration in a chronic heart failure pig model. J Cardiovasc Electrophysiol. 2007;18:985-990.
115 Bocchiardo M, Meyer zu Vilsendorf D, Militello C, et al. Intracardiac impedance monitors stroke volume in resynchronization therapy patients. Europace. 2010;12:702-707.
116 Page E, Cazeau S, Ritter P, et al. Physiological approach to monitor patients in congestive heart failure: application of a new implantable device-based system to monitor daily life activity and ventilation. Europace. 2007;9:687-693.
117 Faxon D, Lenfant C. Timing is everything: motivating patients to call 9-1-1 at onset of acute myocardial infarction. Circulation. 2001;104:1210-1211.
118 Fischell TA, Fischell DR, Fischell RE, et al. Real-time detection and alerting for acute ST-segment elevation myocardial ischemia using an implantable, high-fidelity, intracardiac electrogram monitoring system with long-range telemetry in an ambulatory porcine model. J Am Coll Cardiol. 2006;48:2306-2314.
119 Hopenfeld B, John MS, Fischell DR, et al. The Guardian: an implantable system for chronic ambulatory monitoring of acute myocardial infarction. J Electrocardiol. 2009;42:481-486.
120 Leung SK, Lau CP, Lam CT, et al. Automatic optimization of resting and exercise atrioventricular interval using a peak endocardial acceleration sensor: validation with Doppler echocardiography and direct cardiac output measurements. Pacing Clin Electrophysiol. 2000;23:1762-1766.
121 Whellan DJ, Ousdigian KT, Al-Khatib SM, et al. PARTNERS Study Investigators: Combined heart failure device diagnostics identify patients at higher risk of subsequent heart failure hospitalizations: results from PARTNERS HF (Program to Access and Review Trending Information and Evaluate Correlation to Symptoms in Patients with Heart Failure) study. J Am Coll Cardiol. 2010;55:1803-1810.
[/level-membership-for-cardiovascular-category][not-level-membership-for-cardiovascular-category]
5 Implantable Sensors for Rate Adaptation and Hemodynamic Monitoring
Sensors for Rate-Adaptive Pacing
Basis of Sensor-Driven Pacing
Atrioventricular (AV) synchrony enhances cardiac output by augmenting the stroke volume by 20% to 30% during exercise. However, this increase is relatively small compared with the threefold to fourfold increase achieved by an increase in heart rate. The relative contribution of AV synchrony and rate increase in patients with complete AV block was studied in dual-chamber (DDD) and a rate-matched ventricular pacing (VVI) mode.1 At rest, the cardiac output during DDD pacing was 18% higher than during VVI pacing because of AV synchrony. During exercise, however, the net cardiac output was only 8% higher during DDD pacing compared with VVI pacing at an identical rate. An equivalent exercise capacity was reported in another study,2 and both DDD and rate-matched VVI pacing were superior to fixed-rate VVI pacing during exercise. Cardiac output was similar in the two modes at near-maximal exercise, but at lower workload levels, cardiac output was maintained by an increased arteriovenous oxygen saturation difference and arterial lactate level. In addition, systolic and mean blood pressures were lower when exercise was performed without AV synchrony. These findings suggest that rate response is the primary driver for exercise cardiac hemodynamics, with a much smaller contribution of AV synchrony.
Exercise Response in Heart Failure
In a patient with heart failure, because the left ventricular (LV) filling pressure is elevated and the heart is working at the flat portion of the Frank-Starling curve, an increase in heart rate is the most important means to increase the cardiac output. In a study of 22 patients with poor LV function and implanted rate-adaptive pacemakers, the benefit of rate adaptation to exercise capacity was greatest in those with the poorest LV function.3
In patients with implanted cardiac resynchronization therapy (CRT) devices,4 chronotropic incompetence (maximum heart rate <70% of age-predicted maximum) was found in 70% of heart failure patients. In this group, sensor-driven CRT pacing improved maximum oxygen consumption and work capacity compared with CRT pacing without rate adaption. This increment is independent of A-V interval shortening during exercise. These data suggest that rate modulation plays a critical role in some patients with impaired LV function who require pacing therapy, even in those with CRT.
Ideal Sensor Characteristics
Classification of Sensors
In a sensor-driven pacing system, a sensor (or combination of sensors) must first detect a physical or physiologic parameter that is related to metabolic demand5 (Fig. 5-1). Second, the rate-modulating circuit in the pulse generator must have an algorithm that relates changes in the sensed parameter to a change in pacing rate. Third, because the magnitude of the physical or physiologic changes monitored by a sensor may differ between patients, clinician input may be necessary to adjust the algorithm, generally by programming one or more rate-responsive variables, to achieve the clinically desired rate response. This requirement for adjustment has decreased with automatic optimization of the rate-responsive settings. Most sensors operate in an open-loop algorithm; that is, the induced rate changes do not induce a negative feedback on the sensed parameter. In a closed-loop sensor system, the induced hemodynamic changes will induce an opposite change in the level of the sensed parameter that is responsible for the initial rate adaptation (negative feedback loop). Theoretically, minimal programming is required in a closed-loop system (see Fig. 5-1). Furthermore, the actual rate response is calculated using rate-response curves after programming a threshold of sensor detection (Fig. 5-2).
Technical Classification
A practical classification is to categorize sensors according to the technical methods that are used to measure the sensed parameter (Table 5-1). Body movements during exercise result in changes in acceleration forces that are transmitted to the pacemaker. Sensors that are capable of measuring the acceleration or vibration forces in the pulse generator are broadly referred to as activity sensors. Technically, detection of body movement can be achieved using a piezoelectric crystal, an accelerometer, a tilt switch, or an inductive sensor. Each of these devices transduces motion of the sensor either directly into a voltage or indirectly into measurable changes in the electrical resistance of a piezoresistive crystal. Activity sensing is the most widely used control parameter in rate-adaptive pacing because of its ease of implementation and its compatibility with standard unipolar and bipolar pacing leads. Additionally, activity sensors can be used for either atrial or ventricular pacing modes.
TABLE 5-1 Major Classes of Sensors Used in Implanted Devices, Classified According to Method of Technical Realization
The intracardiac ventricular electrogram (EGM) resulting from a suprathreshold pacing stimulus has been used to provide several parameters to guide rate modulation. The total duration of depolarization and repolarization can be estimated by the interval from the pacing stimulus to the intracardiac T wave: the QT interval, or stimulus-T interval. This parameter is sensitive to changes in heart rate and circulating catecholamines and can be derived from the paced EGM with conventional pacing electrodes. This was developed as a QT-sensing pacemaker, based on the QT interval shortening during exercise and stress.5
The last group of sensors is incorporated into the pacing lead itself. These specialized leads include thermistors (used to measure blood temperature), piezoelectric crystals (right ventricular pressure), optical sensors (mixed-venous oxygen level), and accelerometers at the tip of pacing leads. Some of these sensors measure highly physiologic parameters. For example, oxygen saturation is closely related to oxygen consumption during exercise. Physical activities increase cardiac output and oxygen extraction from the blood, and the tissue arteriovenous oxygen difference widens during increased tissue oxygen consumption. The fall in oxygen saturation will trigger an increase in rate that will improve cardiac output and minimize the decrease in mixed-venous oxygen saturation.6 The mixed-venous oxygen sensor is a true closed-loop system, although its technical complexity limits its use for rate-adaptive pacing. Sensing of changes in blood pH during exercise has also been suggested as a possible sensor, although the requirement for a specialized lead has impeded its clinical implementation.7
Over the years, many of these sensors have been implemented in implantable devices. Significant differences in rate response were found among sensors, notably between their sensitivity and specificity (Table 5-2). However, only activity, MV, and CLS sensors are currently used for rate response. The activity sensor has the advantage of reliability and ease of implementation; its lack of proportionality to exercise workload has not been a major clinical disadvantage for most patients. Sensors in special leads are no longer used for rate adaptation because of their uncertain long-term reliability and difficulty during pacemaker replacement. However, these sensors are now used for hemodynamic monitoring in heart failure.
Current Sensor-Driven Pacemakers
Activity-Sensing and Accelerometer-Based Pacemakers
Activity sensing is the most widely used sensor, alone or in combination. Because activity-based pacemakers are operationally simple and do not require a special sensor outside the pulse generator casing, they work with any type of pacing lead, have excellent long-term stability, and are highly reliable. Activity-guided pacemaker implantation is the same as for conventional pacemakers. Although activity sensors may not be excellent proportional sensors, they react promptly to the start and termination of physical exercise. The first activity sensors, piezoelectric crystals, mainly respond to the frequency of vibrations transmitted to the pulse generator, with more variable response depending on the pulse generator and the pocket. The subsequent activity sensors, accelerometers, detect body accelerations and have less interpatient variability and better proportionality (Fig. 5-3).
Current Activity-Sensing Devices
Medtronic (Kappa 700/900/400, Adapta, Advisa, EnRhythm)
The sensor-driven rate is adjusted by the use of a triphasic rate curve that incorporates two rate ranges, activity of daily living (ADL) and exertion response (ER) programming (Fig. 5-4). The physician determines the lower rate limit (LRL), the ADL rate, and the sensor-driven upper rate limit (SURL). With the nominal ADL response of 3 (I-5), counts between 12 and 20 will give the ADL rate, during which the rate response will be stable. When counts are greater than 20, ER will occur to the maximum programmed SURL. The flat portion of the response curve corresponds to 25% of the total counts. Adjustment of the ADL and ER to a more sensitive setting will decrease the number of counts needed to reach between ADL rate and SURL, and shorten the ADL portion of the response curve. The actual number of counts to effect a change in pacing rate is not fixed and differs among patients. Rather, an ADL response of 3 implies that the patient will spend up to 30 minutes daily at a sensor rate at or above the ADL. This is achieved by adjusting the rate/count relationship to achieve this percentage of rate response, the ADL set point. Similarly, an ER response of 3 means that the patient will be spending about 20 minutes weekly at the higher rates, 105 to 120 bpm, the upper-rate set point.
With automatic rate response, rate profile optimization will adjust these rate curves automatically, using daily comparison of the rate histogram with the target-rate histogram. The device adjusts more quickly in the first 10 days after a programming change so that the new setting will be achieved more quickly (Fig. 5-5).
St. Jude Medical (Identity, Vitality, Zephyr, Accent)
These activity devices use an Omnisense accelerometer bonded to the circuit board and are sensitive to accelerations that occur in the AP axis. Activity counts above a programmable threshold (1 = most sensitive; 7 = least sensitive) are integrated and translated to a rate response using a rate-response slope (1 = least sensitive; 16 = most sensitive) (Fig. 5-6).
Clinical Results of Activity Sensors
Clinical studies have demonstrated that activity-based pacing systems improve exercise capacity and reduce symptoms compared with VVI pacemakers. In an early study of a piezoelectric vibration-based sensor pacemaker, Benditt et al.8 compared exercise tolerance during VVI and VVIR pacing using treadmill tests. Sensor-driven pacing prolonged exercise duration by 35% and led to similar increments in peak oxygen consumption and oxygen consumption at anaerobic threshold. Activity sensor–driven pacing also reduced the patient’s perception of exertion at comparable exercise levels, and the benefit was sustained when exercise testing was repeated after an average 5 months of follow-up. Further, at follow-up exercise testing, reversion of the pacing system to a VVI mode resulted in prompt deterioration of both observed oxygen consumption and exercise duration. Crossover studies comparing VVIR mode to DDD pacing found no significant difference in symptom scores, maximal exercise performance (treadmill), or plasma concentrations of epinephrine, norepinephrine, and atrial natriuretic peptide, suggesting rate adaptation was the most important factor for exercise in the patient population studied.9,10
In a study of the efficacy of automatic “rate profile optimization” over time, 11 patients with Kappa 700 pacemakers performed treadmill testing at 1 month, 1 year, and 2 years after implantation.11 Based on the sinus profile at follow-up, a more aggressive slope was needed to match the sinus rate profile. This required a change in ADL response from 3 to 4 and in ER from 3 to 4 at 1 year, and a change in activity threshold from medium-low to low at 2 years. These adjustments enabled better approximation of pacing rate to sinus rate during treadmill exercise. Exercise capacity was maintained during the 2 years of follow-up. Variation in activity level (Activity Variance) as detected by an accelerometer is used to determine the rest rate in the St. Jude Medical devices,12 with an overall appropriate rate response.
Limitations of Activity-Sensing Devices
The effects of various means of locomotion on pacing rate were assessed for different activity-based pacemakers.13 Three different activity-based pacing systems (peak counting algorithm, integration type, and accelerometers) were strapped to the chests of volunteers. Bicycling on the street resulted in higher pacing rates than did stationary bicycling for each type of pacemaker, although none of the pacemakers reached the heart rate achieved by the normal sinus node. During driving, the pacemakers increased the pacing rate, although the intrinsic sinus rate continued to be higher. In passively riding passengers, the pacemakers tended to produce a higher pacing rate than that of the normal sinus node. Independent of the sensor, activity-initiated rate response depends on the manner in which activity is performed rather than the exercise workload, and proportionality is generally limited.14 Activity sensors typically produce a higher heart rate walking downhill than uphill because of the greater force of heel-strike in the descending direction. Nonexercise stresses such as emotional changes are not detected.
Minute Ventilation Sensing
Although a respiratory rate–sensing pacemaker was in use as early as 1983, it was limited by the need for an auxiliary subcutaneous electrode, as well as easy interference by arm movement because of unipolar impedance sensing.15 All subsequent generations of respiratory sensor detect impedance as a surrogate measure of minute ventilation for rate adaptation. Again, MV is the product of tidal volume and respiratory rate. Although MV is not actually measured, both the amplitude of changes in transthoracic and intravenous impedance (correlating with tidal volume) and the frequency of changes in these parameters (correlating with respiratory rate) can be measured by injecting a very-low-amplitude and short-duration electrical stimulus between an electrode on a pacemaker lead and the pulse generator casing. Thus, changes in MV can be estimated by changes in minute impedance. The advantage of this sensor is that it only requires a standard bipolar pacing lead in either the right atrium or right ventricle, without the need for additional hardware. The response of MV during exercise is proportional to oxygen consumption (below anaerobic threshold) and responds at a reasonable speed; battery drain is not excessive.
Current Minute Ventilation–Sensing Devices
Medtronic (Kappa 400)
Medtronic Kappa 400 has been evaluated using symptom-limited treadmill testing.16 All patients had cardiopulmonary gaseous analysis in conjunction with simultaneous recording of MV-induced impedance changes. Calibrations were made during resting, supine, sitting, and different types of exercise (bicycle or treadmill). The impedance-derived MV was smaller for sitting versus supine position, for shallow versus slow breathing, and for bicycle versus treadmill exercise, possibly because of change in chest cage geometry. Correlation coefficients of the best-fit line for measured and device-based MV were high (>0.9 in first-, second-, and third-order polynomial equations).17 Furthermore, the calibration between measured MV and impedance MV changes over time (1 week to 1 month). However, the changes were not correlative, with implications for the need of continual automatic adaptation. These findings also suggest the potential use of the sensor for MV monitoring.
Boston Scientific (Pulsar Max, Insignia, Altrua)
The telemetered MV impedance signal from a Boston Scientific device was compared with measured MV in 20 patients.18 Respiratory rate was accurately measured by the device during hyperventilation, with difference less than 0.2 breath/min. During 10-minute cycle ergometry at 50 W, the correlation between MV measured directly and by the device was 0.99. Large, individual variations exist between the measured MV and the impedance MV slope, requiring individualized rate-response curves.
ELA-Sorin (Chorus, Talent, Opus, Symphony, Rhapsody, Reply)
The automatic slope algorithm in the Chorus determines the resting and maximum MV values daily. If MV over 128 cycles remains below the 24-hour MV average, the lower rate will decrease to the LRL. The device calculates the exercise MV signal by looking for the maximal MV signal and recalculates this value every eighth cycle. The exercise MV value is increased or decreased in 6% intervals. The mean resting and exercise MV values are used to adjust the rate-response slope automatically over the range of values from 1 to 15 in steps of 0.1. The response of the Talent DR during exercise was compared in 81 patients. The correlation coefficient between the sensor rate and programmer-derived sensor rate was 0.983 ± 0.005, and a linear relationship was observed between the heart rate reserve and MV reserve.19
Clinical Experience of MV Sensor Pacemakers
Minute ventilation is an indirect but reliable marker of metabolic demand, and in the first generation of MV pacemakers (Meta MV, Telectronics), the rate response was proportional to the level of exertion and correlated with the normal sinus response.20,21 Compared with VVI pacing, MV-based VVIR pacing increased exercise capacity by 33%,21 and maximal oxygen consumption and cardiac output were significantly improved. In one study of 10 patients with the first version of MV-driven VVIR pacing, pacing rate was highly correlated with measured MV (r = 0.89), respiratory quotient (r = 0.89), Vco2 (r = 0.87), tidal volume (r = 0.87), Vo2 (r = 0.84), and respiratory rate (r = 0.84). Maximum oxygen consumption also increased from 13.4 ± 3.4 to 16.3 ± 4.1 mL/kg/min (P = .0004) using MV-driven over VVI pacing.
Improvement in symptoms were also documented in the VVIR mode.21 The MV sensor has good long-term stability; programming of the sensor is relatively simple; and the rate response is appropriate during daily activities. Compared with activity pacing, MV is significantly better in achieving a near-normal pacing rate–workload relationship, whereas activity sensing tends to overpace at low-level exercise and underpace at peak exercise and in the recovery period.
Limitations of Minute Ventilation Sensing
As with all impedance systems, the MV sensor will likely be affected by electromagnetic interference, arm swinging, coughing, and hyperventilation.16 Artificial ventilation will induce an unphysiologic rate, so MV sensing needs to be disabled in such patients (e.g., general anesthesia, mechanical ventilation). The use of MV devices in patients with lung disease and heart failure remain controversial. Early generations of MV-sensing devices limited the maximum detectable respiratory rates to less than 48 to 60 breaths/min to minimize the cardiac effects of changes in impedance. Because of this filtering of the cardiac component of changes in impedance, MV sensors may not accurately reflect rate adaptation at very high respiratory rates, as may occur in children. A bipolar ventricular lead is needed for MV sensing in several models. The battery current for MV sensing may consume approximately 2% of the total current of a dual-chamber pacemaker.
Unipolar Ventricular Impedance: Closed-Loop Stimulation Sensor
Sensor and Algorithm
The CLS sensor is based on unipolar impedance at the tip of a pacing lead.22 Subthreshold pulses of automatically selected outputs, ranging from 100 to 400 microamperes (µA), with biphasic duration of 46 msec are emitted 50 to 300 msec after a sensed or paced ventricular event. During late diastole immediately after a ventricular paced (Vp) or sensed (Vs) event, the blood volume of the right ventricle is highest and RV impedance is lowest. On the other hand, as contraction occurs, the walls surrounding the electrode tip draw closer, and impedance rises (Fig. 5-7, A). A baseline waveform will depend on the conduction state of the heart: AsVs, AsVp, ApVs, ApVp (As, atrial sensed; Ap, atrial paced event). Baseline CLS waveforms will be acquired only when the associated accelerometer indicates “no activity,” and a waveform will be discarded within 48 hours if not referenced. An average template of the baseline CLS waveform will take 2 to 3 days to optimize.
As contractility increases during exercise, unipolar impedance will change. The time-integrated difference between the exercise and baseline impedance waveforms is converted to a pacing rate using an auto response factor, which is continually adapted and patient specific. The magnitude of rate response is then determined by a programmable exertion threshold rate (ETR; very low, low, medium, high, and very high) (Fig. 5-7, B). The ETR, acting through the auto response factor, will determine that 80% of the heart rate will occur below the ETR and 20% above the ETR. An active young individual will probably require a higher ETR than an inactive elderly patient. Again, the type of rate profile attained will be determined by the patient’s cardiac condition, physical state, and specific automatic response factor.
Current Closed-Loop Stimulation Devices: Biotronik (Inos, Protos, Cyclos, Entovis, Evia)
Acute measurements of the CLS parameter (previously known as “ventricular inotropic index”) were taken in 82 patients with chronically implanted unipolar ventricular leads at pulse generator replacement.22 A wide fluctuation of baseline impedance was observed (500-1500 Ω), whereas CLS fluctuated by about 4 to 25 ohms (Ω), with a good correlation between CLS and the baseline impedance. A clinical study of 205 patients evaluating the CLS pacemaker included a significant number of young subjects with complete AV block caused by Chagas’ disease.23 Satisfactory rate modulation was reported in 93% of patients. In the remaining 7% of patients, rate adaptation could not be achieved because of poor exercise tolerance, severe myocardial dysfunction, and intermittent intrinsic AV conduction. In a multicenter study that included 178 VVIR (Biotronik Neos-PEP) and 84 DDDR (Biotronik Diplos-PEP, InosDR) devices, physiologic rate adaptation was possible in 93% and 96% of patients with these devices, respectively.24 Apart from exercise rate response, this study also involved mental stress testing using color-word matching and the infusion of inotropic agents. A moderate level of rate response was documented in some patients with CLS pacemakers during these nonexercise conditions that was greater than during accelerometer-guided pacing. The benefit of CLS sensor pacing during mental stress and cognitive function has also been studied.25
Considerable interest surrounds the use of the CLS sensor to detect changes in posture. Passive head-up tilt, which depletes intravascular volume, increases the inotropic state of the heart. In a multicenter study, Inotropy Controlled Pacing in Vasovagal Syncope (INVASY), 50 patients with severe vasovagal syncope and positive head-up tilt test were randomized between DDD-CLS and DDI mode at 40 bpm.26 Whereas 7 of 9 patients in the DDI arm experienced syncope within 1 year, only 4 of 41 patients in the DDD-CLS arm had presyncope. The authors suggested the efficacy of this approach, although a placebo effect of pacing was suspected in 22% of patients. In 131 patients with chronotropic incompetence, CLS pacing resulted in a higher pacing rate compared with accelerometer sensor, but no difference in 6-minute walking distance (6MWD) test.27 However, twice as many patients preferred the CLS mode. The use of CLS in the left ventricle, as in a CRT device for monitoring, may be a useful application of this technology (see later discussion).
Peak Endocardial Acceleration
Sensor and Algorithm
The contractile state of the heart can be identified by the maximal velocity of shortening of unloaded myocardial contractile elements, which can be measured with a catheter tip accelerometer attached to the ventricular wall. The “peak endocardial acceleration” represents the endocardial vibration measured by the accelerometer in the right ventricle during isovolumetric contraction phase of the ventricles. This signal is closely associated with the intensity of the first heart sound. The ELA-Sorin BEST (Biomechanical Endocardial Sorin Transducer) sensor is a microaccelerometer consisting of an acceleration sensor built into a nondeformable capsule on the tip of a standard unipolar ventricular pacing lead. The lead is placed against the RV wall so as to be sensitive to its acceleration and insensitive to the pressure of blood and myocardium (Fig. 5-8). This system has a frequency response up to 1 kHz and a sensitivity of 5 mV/G (1 G = 9.8 m/sec/sec).
In early animal experience using an external system and an implantable radiotelemetry system, the PEA was not affected by heart rate but significantly increased by emotional stress, exercise stress testing, and inotropic stimulation.28 The PEA signal changes in parallel to the maximal LV dP/dt and appears to measure the global LV contractile performance rather than the regional mechanical function. The PEA signal that occurs 150 msec after the R wave corresponds to the isovolumetric contraction phase of the left ventricle (PEA-I)29 (Fig. 5-9). A smaller signal also occurs in the 100-msec period after the T wave, the so-called PEA-II, which corresponds to the isovolumetric LV relaxation. PEA-II is related to peak negative dP/dt (r = 0.92) and aortic diastolic pressure (r = 0.91).30 To enable the PEA sensor to be used in patients requiring an ICD lead, the sensor has been incorporated into a right atrial (RA) lead (SonR sensor). Preliminary results suggest that the SonR sensor is similar to the RV PEA signal and that it might be useful in patients receiving cardiac resynchronization therapy with defibrillation (CRT-D).29 This offers the potential to measure cardiac hemodynamics in heart failure patients with an ICD.
Figure 5-9 BEST tracings.
Electrocardiogram (ECG), left ventricular (LV) dP/dt, aortic pressure (Ao Press), LV pressure, and endocardial accelerometer tracing (EA) recordings in a sheep with the BEST sensor (see Fig. 5-8). The peak of the accelerometer tracing during the isovolumic diastole (PEA-II) occurs in a 100-msec period after the T wave on the ECG.
(From Plicchi G, Mercelli E, Parlapiano M, et al: PEA-I and PEA-II based implantable haemodynamic monitor: preclinical studies in sheep. Europace 4:49, 2002.)
Current PEA Devices: BEST Sensor Rate–Adaptive Pacemakers (Sorin Best-Living Systems: Miniliving D and S)
Clinical Results
Clinical studies show good correlation between the sinus rate and PEA sensor–indicated rate during daily life activities and submaximal stress testing.31,32 Similar results were obtained in patients tested during electrophysiologic studies using an external system; changes in PEA were linearly related to the RV dp/dt during dobutamine infusion. PEA signals have been used to monitor hemodynamic function and program the A-V interval. In 13 patients with end-stage heart failure implanted with a DDD-PEA device with a custom lead arrangement, PEA level during RV, LV, and biventricular (BiV) pacing were compared.32 Both LV and BiV pacing increased stroke volume (21% and 37%, respectively) compared with RV pacing, and mean PEA changes over 15 minutes were also higher (43% and 38%). In addition, an apparent minimum PEA level at the optimal A-V interval has shown promise in automatically detecting the optimal A-V interval in a dual-chamber device.33 The algorithm is now automatic. An increase in PEA during head-up tilt-table testing has been observed, and the use of PEA-driven overdrive pacing in patients with vasovagal syncope has been reported.34 Patients randomized to DDDR have a reduced frequency of syncope compared with DDI pacing. In 15 patients with a CRT pacemaker, the PEA correctly indentified the optimal AV interval in 75% of patients.35 These data suggest the potential use of PEA sensor for hemodynamic monitoring (see later).
Current Combined Sensor Devices
Experience with sensors has suggested that rapidly responding sensors (e.g., activity) are not proportional at higher levels of cardiac workload, whereas proportional sensors are usually slow in response. As a result, an activity sensor overpaces at low activity levels but underpaces at higher exertional levels (Fig. 5-10). Furthermore, single sensors may be limited by insensitivity to nonexercise stress and are prone to interference by nonphysiologic causes. Thus, it is logical to enhance their rate-response profile by combining two or more sensors.
Two principles guide the combining of sensors: sensor blending and sensor cross-checking. Sensor blending involves combining sensor-driven rates from individual sensors in a certain ratio. This can be the “faster win” method, in which the higher rate indicated by either sensor is chosen as the pacing rate, or ratios of the individual rates are added together to compute the actual rate response. Sensor cross-checking enhances the specificity of each sensor. If a more specific sensor registers “no exercise” or physiologic stress, changes in the other, less specific sensor can be ignored or its response attenuated (Fig. 5-11). Table 5-3 summarizes instrumentation of current dual-sensor devices. Details of the combined CLS/activity and PEA/activity devices are discussed earlier.
Current Dual-Sensor Devices
Medtronic Pacemakers
Medtronic marketed two dual-sensor pacemakers: the combined activity and QT sensors (Vitatron) and the combined activity and MV sensors (Kappa 400). Both are no longer manufactured. In the activity/QT device, a “faster win” algorithm was used, with highest rate of two sensors used to determine actual pacing rate. Since the QT sensor is more specific for physiologic changes, an increase in activity sensor level in the absence of QT documenting exercise was used as a cross-check, resulting only in a brief and limited rate response. Using an adaptive sensor level to the SURL, the QT sensor level was continuously scaled down if, at the SURL, QT continued to shorten, suggesting the sensor level had reached the upper rate too soon. The converse was also operative. The combined sensor rate was found to be closer to the sinus rate during daily activities.36
The dual-sensor rate response has been reported to be reliable for both maximal and submaximal activities, as well as resistant to nonphysiologic interference.37 Compared with MV sensor alone, dual-sensor mode reduces oxygen deficit acquired during exercise by enhancing the initial rate response.38 “Quantitative rate adaptation” is also superior in the dual-sensor mode.39,40 “Rate profile optimization” was found to be a useful method for rate-adaptive programming, comparable to manual programming,41 and may be superior to accelerometer alone for rate optimization.11
Boston Scientific (Insignia, Pulsar Max, Altrua)
An accelerometer activity sensor is integrated with the MV sensor, using differential sensor blending. At low heart rates, the blended sensor rate is approximately 80% accelerometer and 20% MV sensor. This ratio changes to 40%/60% near the SURL. In addition, if the MV rate is higher than the accelerometer rate, the dual-sensor rate follows the MV level. In a study involving 120 patients with Insignia, the programmed sensor modes were randomized to the accelerometer sensor alone, the MV sensor alone, or the dual-sensor mode, each for a 3-month period.42 Using the implanted Activity Log to determine the mean percentage and intensity of activity, quality of life (QOL), and New York Heart Association (NYHA) classes were assessed at the end of each period. Overall, either single-sensor DDDR mode improved Activity Log, QOL, and NYHA scores compared with DDD pacing, but with no difference between the two sensors. The dual-sensor mode did not improve these measurements. This study may have been limited by the prolonged, triple-crossover design but does suggest that clinical differences are likely minimal between sensors and their combinations.
The Limiting Chronotropic Incompetence for Pacemaker Recipients (LIFE) study of 1256 patients with chronotropic incompetence found that the blended sensor improved metabolic-chronotropic slope compared with the activity sensor alone43 (Fig. 5-12). However, besides improved physical activity time/energy expenditure, there was no measurable difference in QOL between the blended sensor and the activity sensor alone. A prospective randomized parallel study on activity and MV with the primary outcome of Vo2 is planned (APPROPRIATE study).44 This study will randomize 1000 patients who will be screened for CI using a 6MWD and treadmill heart rate at 1 month. Patients with confirmed CI will have their sensors optimized with a brief walking test. Apart from Vo2 max, rate changes during daily activities will be assessed. This study will shed light in the role of different sensors on exercise oxygen uptake. (Unfortunately, the study was prematurely terminated because of suboptimal recruitment.)
ELA-Sorin (Chorus, Talent, Symphony, Rhapsody, Reply)
An accelerometer and a MV sensor are combined in these devices. Sensor blending and cross-checking are both operative to effect rate adaptation during exercise (Fig. 5-13). When the accelerometer is active but MV has not increased, as may occur at the beginning of exercise, rate response occurs according to a fixed activity response curve to a limited rate. When MV increases, rate response follows the MV sensor–driven rate. Persistent absence of accelerometer signal is considered the cessation of exercise, and this allows a decrease in the pacing rate using a recovery curve to the LRL, even though MV remains higher than baseline.
A multicenter study involved 81 patients with the ELA dual-sensor pacemakers.19 In patients who underwent exercise stress testing at 1-month follow up, sensor-driven rate had good correlation with the sinus rate (r = 0.92 ± 0.07; P < .001), with the slope of linearity at 1.0 ± 0.2. Using metabolic reserve to relate to heart rate reserve, a slope of 1.1 ± 0.2 was obtained, suggesting a close relation between the dual-sensor rate and metabolic workload.
Are dual sensors justified?
Dual-sensor implementation is technically and clinically feasible and provides a rate profile closer to the normal sinus rate. In practice, a more specific sensor is added to the activity sensor to enhance its specificity. However, apart from physiologic parameters such as oxygen uptake and transport kinetics, no clinical benefit over single sensor has been seen in large groups of patients, likely reflecting the limited exercise activities of most patients meeting standard indications for pacing. For select patients who are highly active, however, these dual-sensor pacemakers may provide important clinical benefits (Table 5-4).
| Clinical Situation | Examples |
|---|---|
| High exercise heart rate preferred | Young, athletic individuals may require a more physiologic sensor. |
| Avoidance of undue rate acceleration | Working in a vibrational environment |
| Need for nonexercise rate response | Vasovagal syncope |
| Stress response | |
| Hemodynamic or other monitoring |
