Chapter 7 Imaging Techniques
Plain Chest Radiography
Technical Considerations
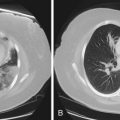
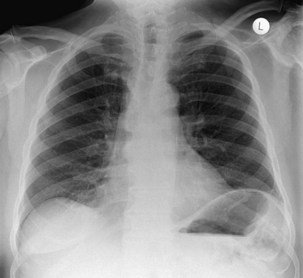
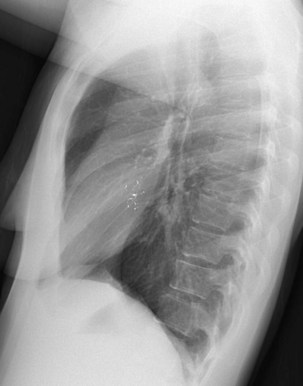
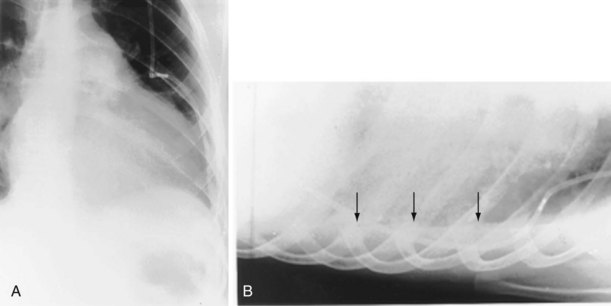
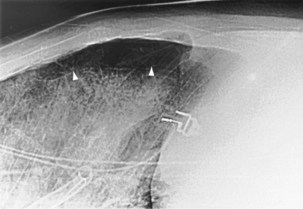
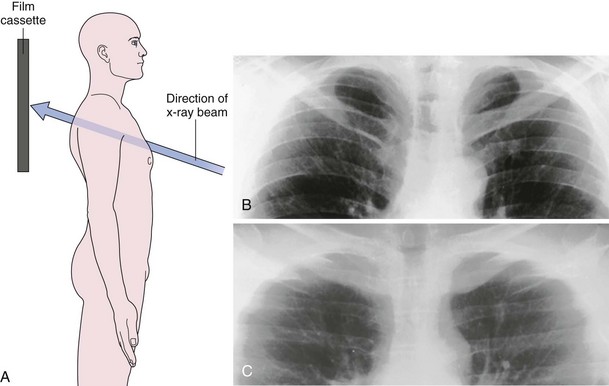
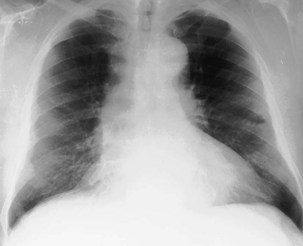
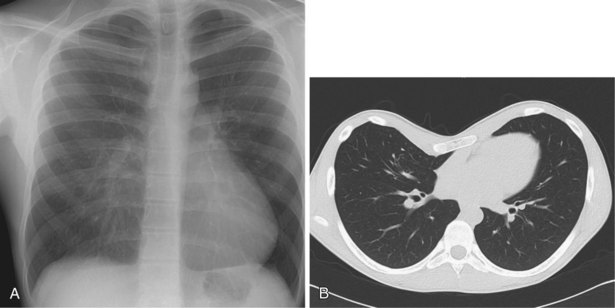
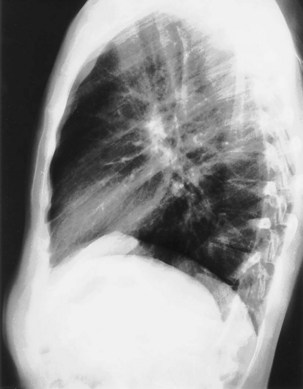
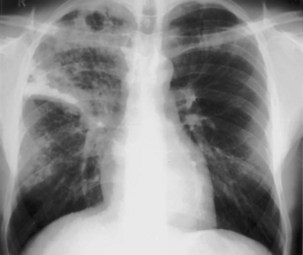
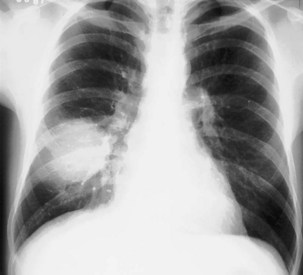
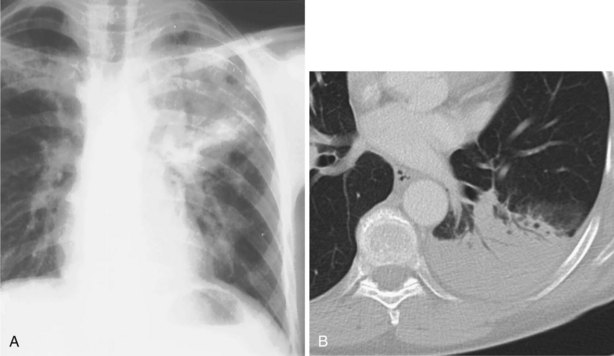
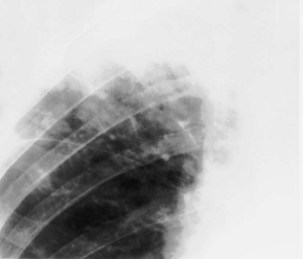
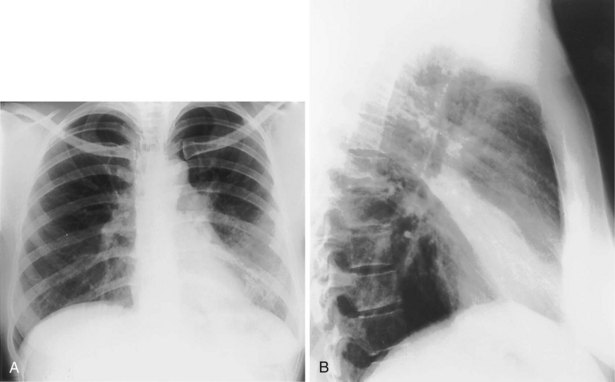
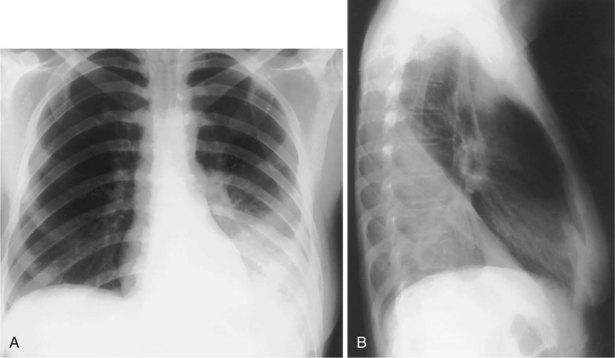
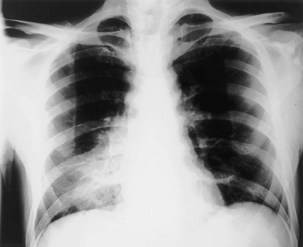
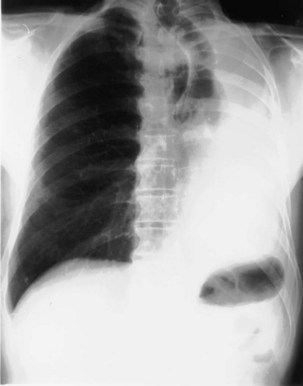
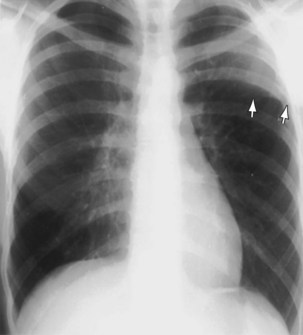
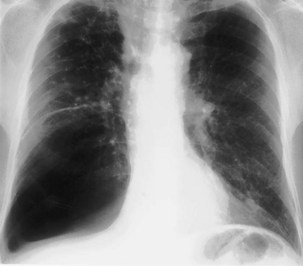
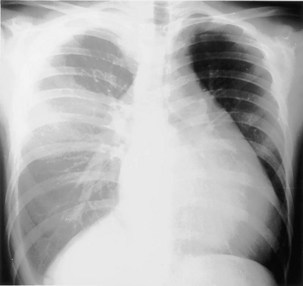
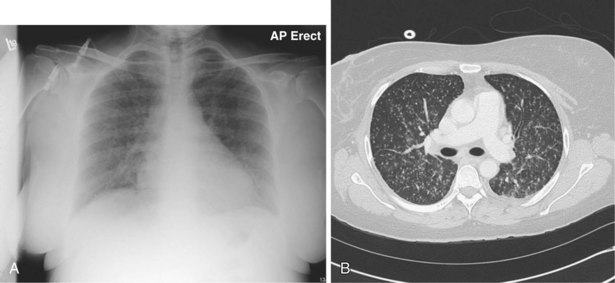
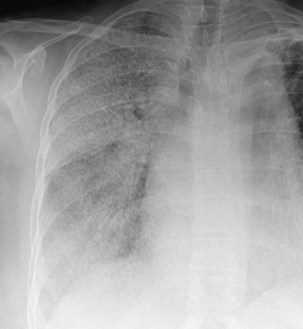
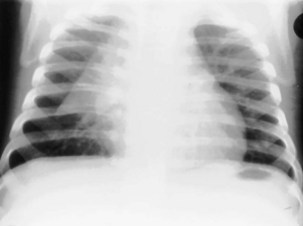
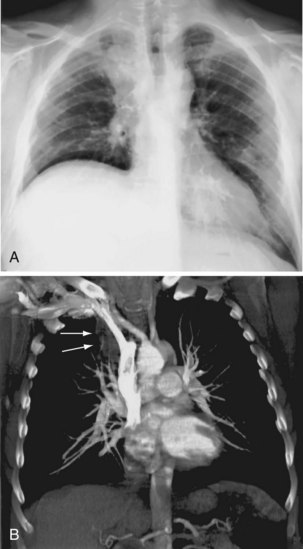
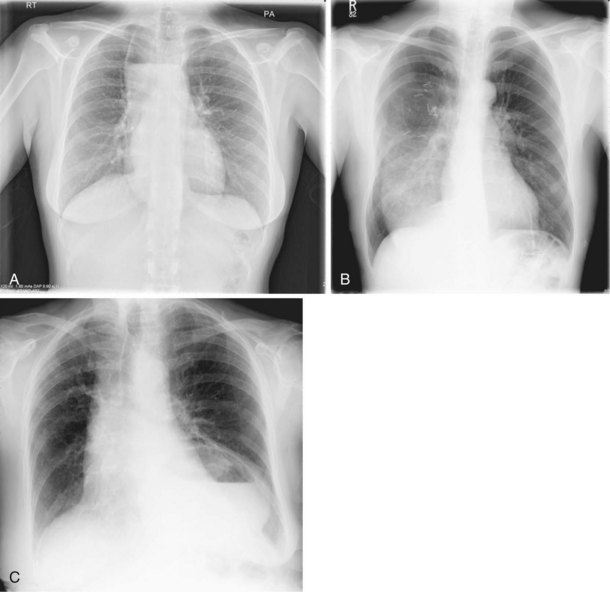
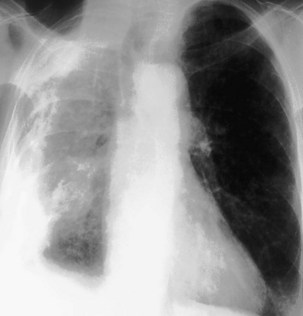
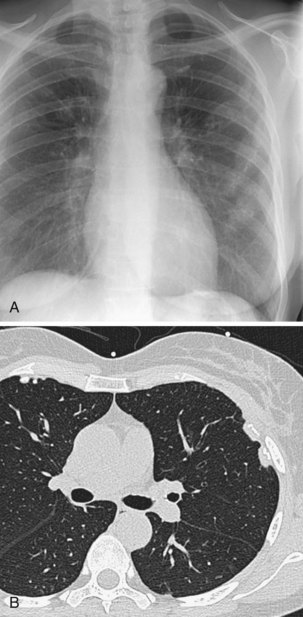
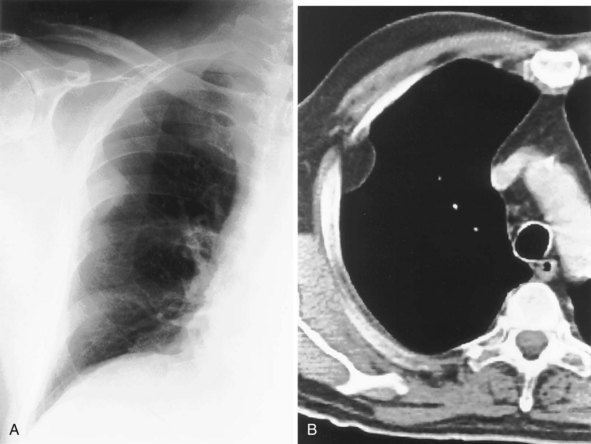
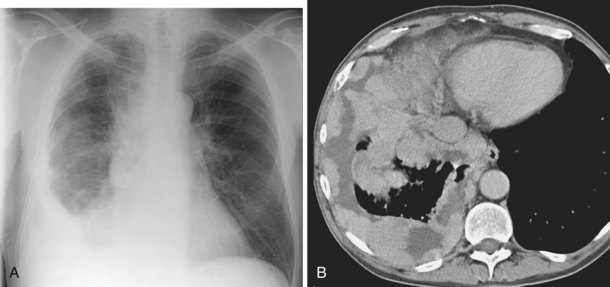
The frontal (posteroanterior) (Figure 7-1) and lateral (Figure 7-2) projections are sufficient for most purposes in chest radiography. Other radiographic views are less frequently required, but they should not be overlooked because they may solve a particular problem quickly and cheaply. The lateral decubitus view is not, as its name implies, a lateral view. It is a frontal view taken with use of a horizontal beam and the patient in a side-lying position. Its main purpose is to demonstrate the movement of fluid in the pleural space (Figure 7-3). An adaptation of this view is the “lateral shoot-through” sometimes used in bed-bound patients: A lateral radiograph of the supine patient is taken to show an anterior pneumothorax behind the sternum (not always visible on a frontal chest radiograph) (Figure 7-4). If a pleural effusion is not loculated, it gravitates, to some extent, to the dependent part of the pleural cavity. Thus, in a decubitus patient, the fluid will layer between the chest wall and the lung edge. This view also may be useful for demonstrating a small pneumothorax, because the visceral pleural edge of the lung falls away from the chest walls in the nondependent hemithorax.
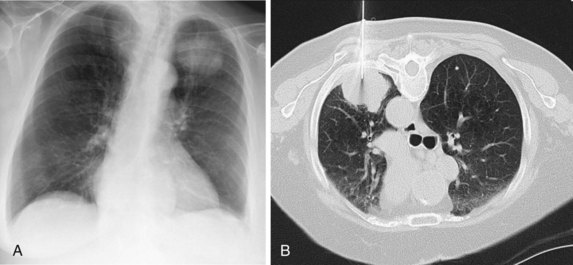
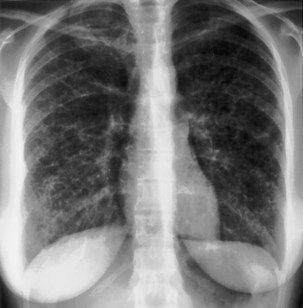
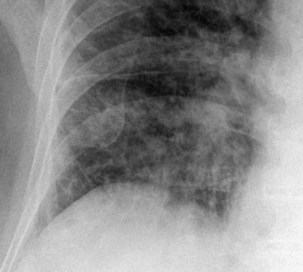
For the lordotic view, now rarely performed, the x-ray beam is angled 15 degrees cranially, either by positioning the patient upright and directing the beam up or by leaving the beam horizontal and leaning the patient backward. On this view, the lung apices are demonstrated free from the superimposed clavicle and first rib. It may be useful to differentiate pulmonary shadows from incidental calcification of the costochondral junctions (Figure 7-5).
Computed Tomography
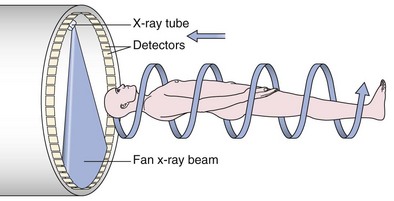
An impressive and rapid improvement in CT hardware capability has occurred over the past decade. Most particularly, the advent of multiple-channel CT scanners has resulted in the ability to acquire simultaneous helical datasets. An accompanying increase in gantry rotation speed coupled with the reduction in the size of the individual detectors has resulted in the ability to acquire extremely detailed images in very short scan times. On the current “top specification” scanners from the major manufacturers, up to 320 channels are available, each with a detector size of as small as 0.5 mm. The entire thorax can now be scanned at submillimeter resolution in 1 to 2 seconds. Thus, spiral (also known as volume or helical) scanning entails continuous scanning and table movement into the CT gantry (Figure 7-6). The information is reconstructed into axial sections, perpendicular to the long axis of the patient, identical to conventional CT sections.
The analysis of what is frequently hundreds of individual images that are produced as the result of a single CT examination is undertaken on dedicated CT or PACS workstations. Postprocessing of these thin sections also allows the production of multiplanar reformats (MPRs), maximum and minimum intensity projections (MIPs and MinIPs), and angiographic images. Skeletal structures can be automatically removed, or surface-rendered images that mimic appearances familiar to the bronchoscopist can be produced with a few mouse clicks. These images are visually pleasing and allow an exquisite appreciation of anatomy. They also have a role in the planning of interventional procedures, including transbronchial needle biopsy and endoluminal stent insertion (Figure 7-7).
Section Thickness
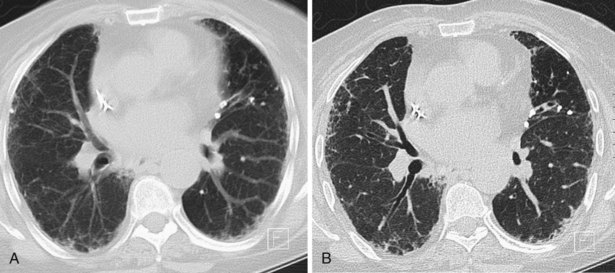
Although a CT section is viewed as a two-dimensional image, it has a third dimension of depth. The depth, or section thickness, is determined by a combination of factors, depending on the exact parameters utilized, including focal spot size, thickness of the individual detector elements, and width of the x-ray beam collimation. Because a section has a predetermined thickness, each pixel has a volume and this three-dimensional element is referred to as a voxel. The computer calculates the average radiographic density of tissue within each voxel, and the final CT image consists of a representation of the numerous voxels (not individually visible without magnification) in the section. The single attenuation value of a voxel represents the average of the attenuation values of all of the various structures within the voxel. The thicker the section, the greater the chance that different structures will be included within the voxel and the greater the signal averaging that occurs. This is known as the partial volume effect; the easiest way to reduce this effect is to use thinner sections (Figure 7-8).
Window Settings
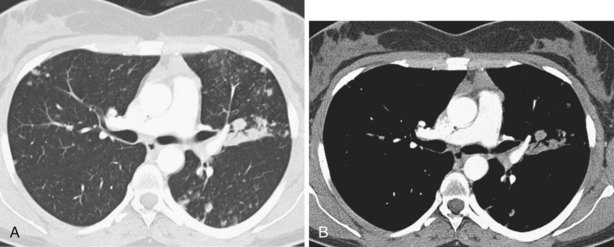
The window width determines the number of Hounsfield units to be displayed. Any densities greater than the upper limit of the window width are displayed as white, and any below the limit of the window are displayed as black. Between these two limits, the densities are displayed in shades of gray. The median density of the window chosen is the window center or level; this center can be moved higher or lower as desired, thus moving the window up or down through the range. The narrower the window width, the greater the contrast discrimination within the window. No single window setting can depict the wide range of densities encountered in the chest on a single image. For this reason, at least two sets of images are required to demonstrate the lung parenchyma and soft tissues of the mediastinum, respectively (Figure 7-9). Standard window widths and centers for thoracic CT vary between departments, but generally for the soft tissues of the mediastinum, a window width of 400 to 600 H and a center of +30 H is appropriate. For the lungs, a wide window of 1500 H and a center of approximately −500 H are usually satisfactory. For bones, the widest possible window setting at a center of +30 H is best.
High-Resolution Computed Tomography
Technical Considerations
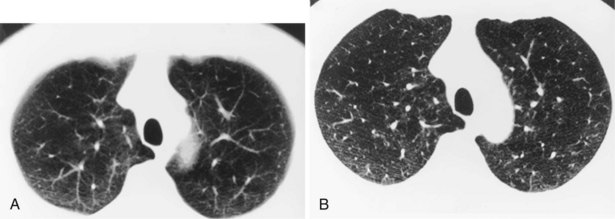
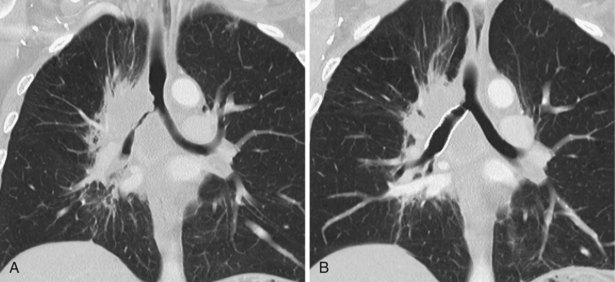
Narrow collimation of the x-ray beam reduces volume averaging within the section and so increases spatial resolution compared with standard 10-mm collimation. For routine HRCT scanning, 1.50-mm beam collimation generally is regarded as optimal. Narrow collimation has a marked effect on the appearance of the lungs, notably the vessels and bronchi—the branching vascular pattern seen particularly in the midzones on standard 10-mm sections has a more nodular appearance with narrow sections, because shorter segments of the obliquely running vessels are included in the section. In addition, parenchymal details become more clearly visualized (Figure 7-10).
In HRCT lung imaging, a high-spatial-frequency algorithm is used to take advantage of the inherently high-contrast environment of the lung. The high-spatial-frequency algorithm (also known as the edge-enhancing, sharp, or formerly “bone” algorithm) reduces image smoothing and makes structures visibly sharper but at the same time makes image noise more obvious (see Figure 7-10).
The size of the patient has a direct effect on the quality of the lung image—the larger the patient, the more conspicuous the noise, which is seen as granular streaks because of increased x-ray absorption by the patient. This artifact is particularly evident in the posterior lung adjacent to the vertebral column. The phenomenon of aliasing results in a fine, streaklike pattern radiating from sharp, high-contrast interfaces. The severity of the aliasing artifact is related to the geometry of the CT scanner, and, unlike quantum mottle, aliasing is independent of the radiation dose. These artifacts are exaggerated by the nonsmoothing, high spatial-resolution reconstruction algorithm but do not mimic normal anatomic structures and are rarely severe enough to obscure important detail in the lung parenchyma (Figure 7-11).
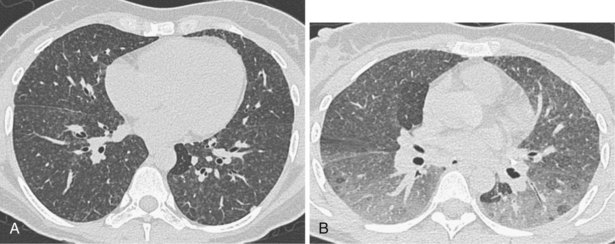
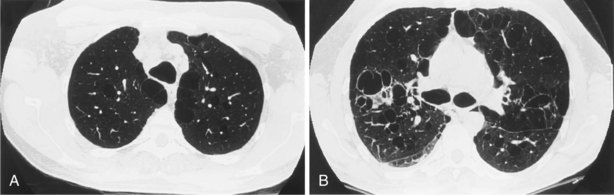
A limited number of scans taken at end expiration can reveal evidence of air trapping caused by small airway disease, which may not be detectable on routine inspiratory scans. Areas of air trapping range from a single secondary pulmonary lobule to a cluster of lobules that give a patchwork appearance of low attenuation areas adjacent to higher attenuation, normal lung parenchyma (Figure 7-12).
Clinical Applications of High-Resolution Computed Tomography
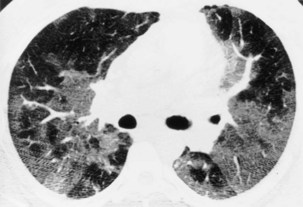
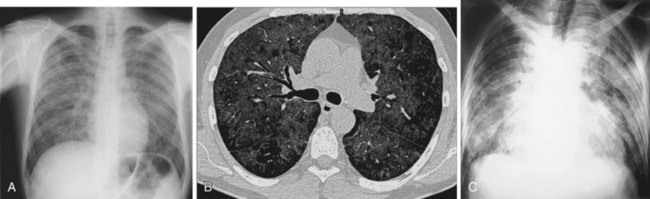
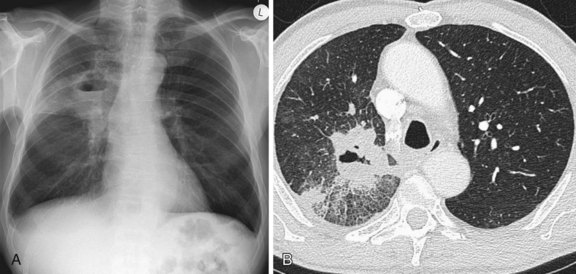
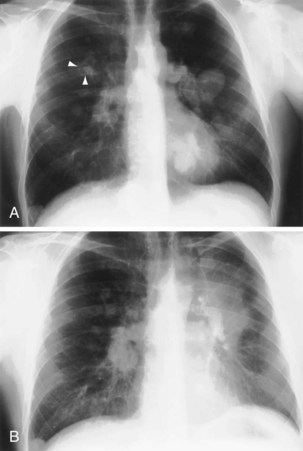
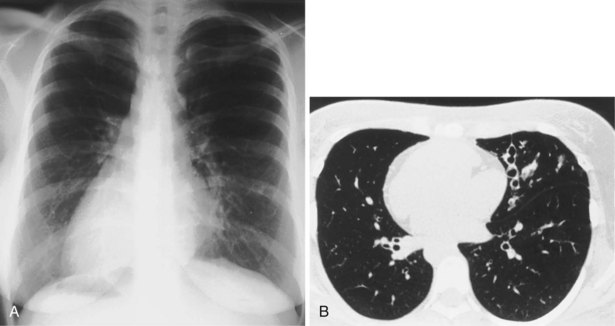
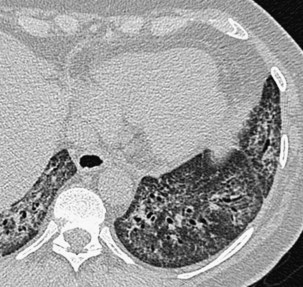
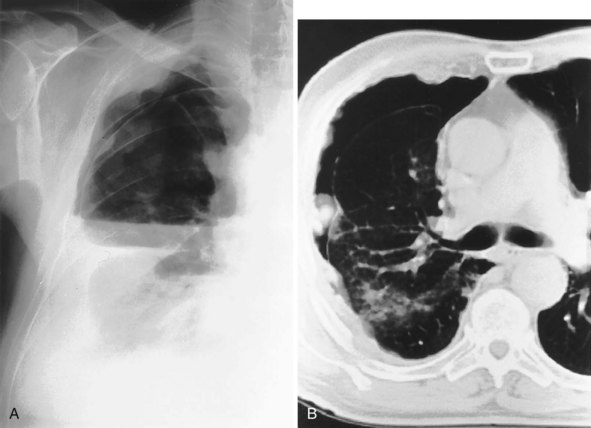
In patients with clinical and lung function evidence of diffuse lung disease, HRCT is now central in the diagnostic workup, with clinical performance greatly exceeding that of plain chest radiography and may obviate the need for lung biopsy. In the original study that compared the diagnostic accuracy of chest radiography and CT in the prediction of specific histologic diagnosis in patients with diffuse lung disease, Mathieson and associates showed that three observers could make a confident diagnosis in 23% of cases on the basis of chest radiographs and in 49% of cases with use of CT; the correct diagnosis was made in 77% and 93% of these readings, respectively (Figure 7-13).
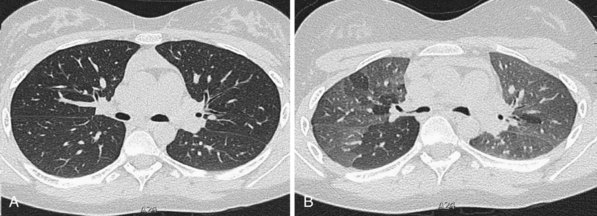
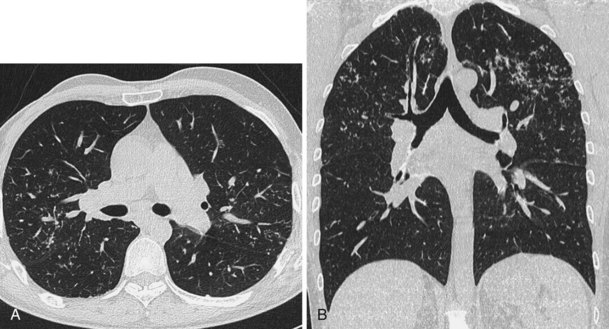
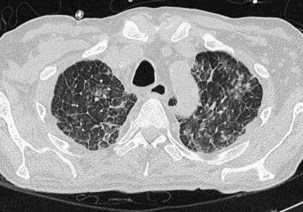
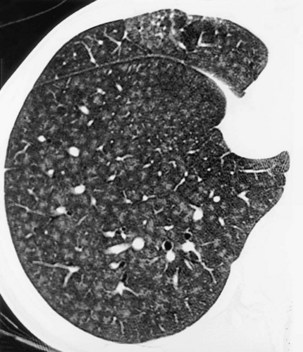
A number of subsequent early HRCT studies acted as the forerunners of a large body of work that has established HRCT as a cornerstone in the assessment of patients suspected of having diffuse lung disease but for whom the clinical features and appearance on the chest radiograph do not allow a confident diagnosis to be made. A number of diffuse lung diseases can have a “diagnostic” appearance on HRCT when findings are interpreted by experienced chest radiologists; such diseases include fibrosing alveolitis, sarcoidosis, Langerhans cell histiocytosis, lymphangioleiomyomatosis, pneumoconiosis, and hypersensitivity pneumonitis (Figure 7-14). An intriguing observation is that the ability of HRCT to allow observers to provide correct histospecific diagnoses seems to be maintained in advanced end-stage disease.
Much interest has been shown in defining the role of HRCT in staging disease activity, particularly for fibrosing alveolitis, in which cellular histology indicates disease activity and is used to predict both responses to treatment and prognosis. As shown by more recent evidence, a predominance of ground glass opacification in fibrosing alveolitis predicts a good response to treatment and increased actuarial survival compared with patients with a more reticular pattern, which denotes established fibrosis. Similar observations about the potential reversibility of disease can be made with use of HRCT in patients who have sarcoidosis, in whom a ground glass or a nodular pattern predominates. In other conditions, the identification of ground glass opacification on HRCT, although nonspecific, almost invariably indicates a potentially reversible disease—for example, extrinsic allergic alveolitis, diffuse pulmonary hemorrhage, and Pneumocystis jiroveci pneumonia (Box 7-1). An important exception is bronchoalveolar cell carcinoma, in which areas of ground glass opacification that merge into areas of frank consolidation or a more nodular pattern may be seen. Another caveat applies with the situation in which fine, intralobular fibrosis is seen on HRCT as widespread ground glass opacification; in this rare occurrence, evidence of traction bronchiectasis usually is present within the areas of ground-glass opacification.
Box 7-1
Causes of Ground Glass Opacification
In patients for whom lung biopsy is deemed necessary, HRCT may be invaluable to indicate which type of biopsy procedure is likely to be successful in obtaining diagnostic material. The broad distinction between peripheral disease versus central and bronchocentric disease is easily made on HRCT. Thus, disease with a subpleural distribution, such as fibrosing alveolitis, is most unlikely to be sampled by transbronchial biopsy, whereas diseases with a bronchocentric distribution on HRCT, such as sarcoidosis and lymphangitis carcinomatosa, are consistently accessible to transbronchial biopsy. In patients for whom an open or thoracoscopic lung biopsy is contemplated, HRCT assists in determining the optimal biopsy site. Pathologic examination of a lung biopsy specimen can still justifiably be regarded as the final arbiter of the presence or absence of subtle interstitial lung disease. Because HRCT images provide a kind of “in vivo big picture,” many lung pathologists now combine the imaging and pathologic information before assigning a final diagnosis, and in many centers, the benefits of a team approach to the diagnosis of diffuse lung disease are recognized. The indications for HRCT that have been developed over the past 20 years are summarized in Box 7-2.
Box 7-2
Indications for High-Resolution Computed Tomography of the Lungs
 To narrow the differential diagnosis or to make a histospecific diagnosis in patients with obvious but nonspecific radiographic abnormalities
 To detect diffuse lung disease in patients with normal or equivocal radiographic findings
 To elucidate unexpected pulmonary function test results
 To investigate the underlying problem in patients presenting with hemoptysis
 To evaluate disease reversibility, particularly in patients who have fibrosing alveolitis

Magnetic Resonance Imaging
Mediastinal and Chest Wall Imaging
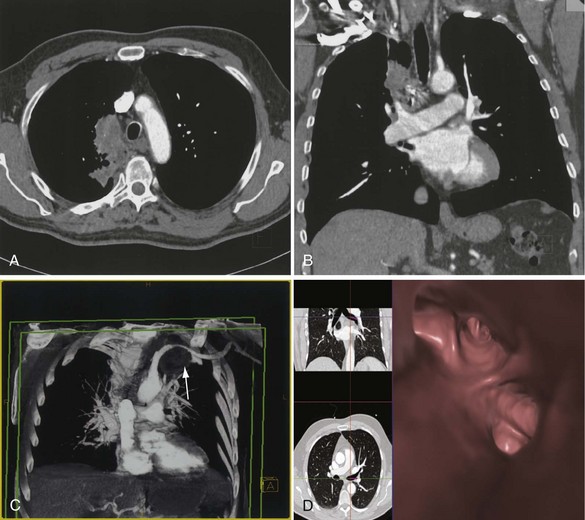
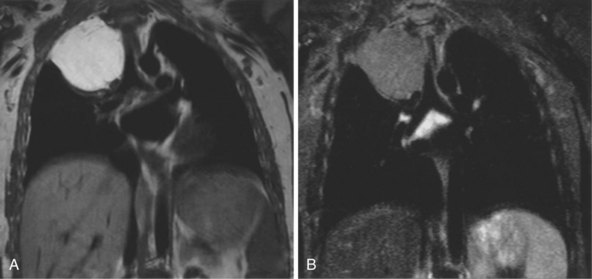
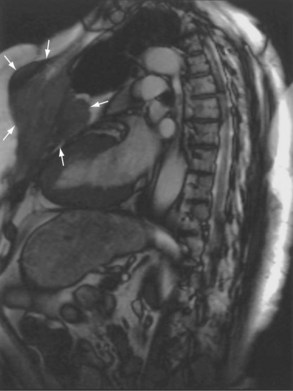
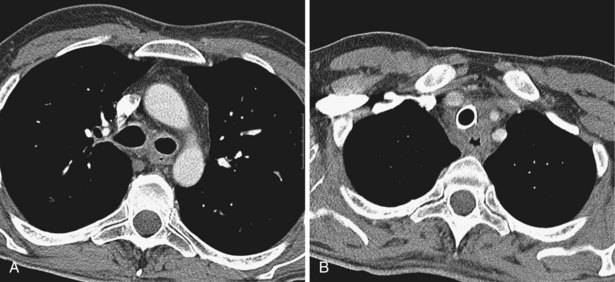
The most common indications for the use of MRI in respiratory disease are for investigation of neoplastic disease, most commonly bronchogenic carcinoma. In addition to the primary disease, secondary complications such as cerebral secondaries, spinal metastases, and retroperitoneal fibrosis all lend themselves to evaluation by MRI. MRI also permits assessment for invasion of mediastinal structures such as the major airways, heart and great vessels, chest wall, and diaphragm and allows differentiation among different forms of soft tissue, fluid, hemorrhage, local hematoma formation, and aneurysms (Figures 7-15 and 7-16). With modern multichannel CT techniques, MRI now holds relatively little advantage over CT in assessing chest wall invasion, except with superior sulcus tumors. However, MRI does provide superb anatomic detail without subjecting the patient to radiation exposure—an important consideration in the pediatric age group, in which a number of follow-up studies may be required (Figure 7-17). The disadvantage of MRI in the very young child is the necessity for general anesthesia in many cases.
Magnetic Resonance Angiography
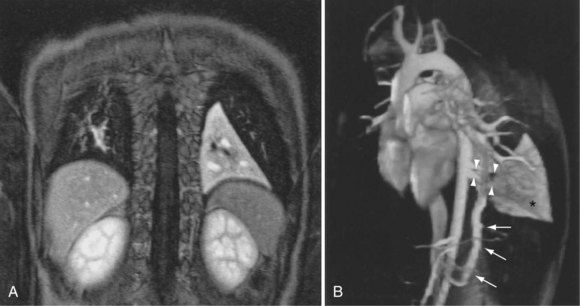
Magnetic resonance also can be used to demonstrate vascular anatomy by differential visualization of flowing blood and stationary tissue; this may be achieved with or without intravenous MRI contrast agents. Generally, the use of contrast increases the signal returned from blood, increases the signal-to-noise ratio, and allows acquisition times to be shorter. This modality, known as magnetic resonance angiography (MRA), can be used to look at venous or arterial flow, together or separately (see Figure 7-17).
Vascular Malformations and Congenital Anomalies
Increasing evidence suggests that MRI can clearly define a number of vascular and developmental anomalies of the lungs by combining anatomic and flow studies. Such anomalies include the scimitar syndrome, hypogenetic lung syndrome, pulmonary artery agenesis, bronchopulmonary sequestration, and vascular malformations (see Figure 7-17).
Pulmonary Angiography
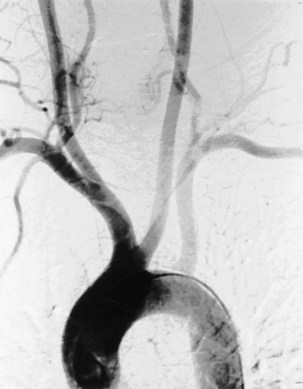
The technique of pulmonary angiography involves fluoroscopically directed insertion of a guidewire followed by a modified pigtail catheter into the right and then the left main pulmonary arteries in turn, with injection of a nonionic contrast administered at an appropriate flow rate. At least two views per side are required, with additional oblique or magnification views as necessary. Catheter access usually is through the femoral vein, with use of the internal jugular and subclavian veins as possible alternatives. Most departments undertake angiography with digital subtraction vascular equipment (Figure 7-18). Problems with misregistration artifact, inherent in digital subtraction systems and caused by respiratory or cardiac cycle phase differences between the mask image and the contrast image, usually can be overcome. Crossing the tricuspid valve may induce an arrhythmia that usually is transient. Therefore, electrocardiogram (ECG) monitoring is mandatory, and the use of prophylactic antiarrhythmic agents or temporary pacing-wire insertion is common practice in some centers. Right-sided heart catheter pressure measurements and gas analysis also may be undertaken.
Bronchial Artery Embolization
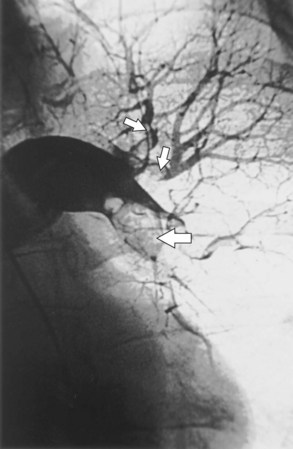
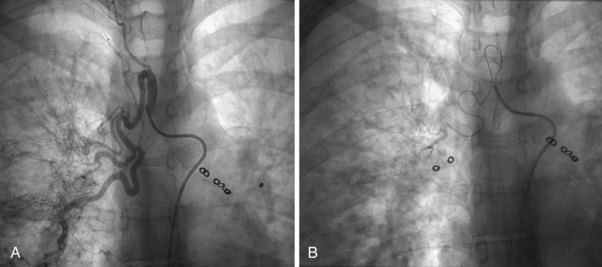
Fiberoptic bronchoscopy often is advocated before bronchial artery embolization to establish the site of hemorrhage. However, a large-volume hemoptysis almost invariably results in vigorous coughing, thereby spreading blood throughout the bronchial tree, which makes localization impossible. CT angiography also is a useful preliminary investigation, delineating bronchial artery anatomy, guiding intervention, and sometimes localizing the lobe or segment from which the bleeding originates. Few criteria exist to determine which angiographically demonstrated bronchial arteries should be embolized. Guidelines are particularly relevant when several bronchial arteries have been identified and the site of hemorrhage is not obvious from previous thoracic imaging. Embolization is directed at the vessels considered most likely to be the source of hemorrhage (Figure 7-19). Bronchial arteries of diameter greater than 3 mm may be considered to be pathologically enlarged. In patients with diffuse, suppurative lung disease, most commonly cystic fibrosis, attempts are made to embolize all significantly enlarged bronchial arteries bilaterally. If no abnormal bronchial arteries are identified, a systematic search is made for aberrant bronchial arteries. When a patient continues to experience hemoptysis after embolization, all suspicious systemic arteries should be examined for a source of bleeding, and it may be necessary to angiographically investigate the pulmonary circulation for a source of bleeding.
Superior Vena Cava Stenting
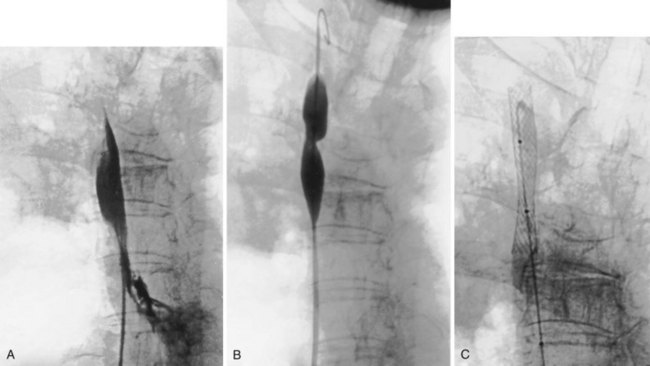
The percutaneous placement of metallic stents for the treatment of SVCO has several attractions. With increasing experience, reliable and successful palliation of SVCO has been reported with use of various stent designs. A superior venacavagram is necessary to identify the length of the stenosis and its site in relation to the confluence of the brachiocephalic veins and the right atrium. Identification of intraluminal thrombus or tumor may require thrombolysis before stent insertion, or the use of a covered stent. After balloon dilatation of the superior vena cava stricture, the stent is positioned across the stricture, and a postplacement venacavagram is performed to confirm free flow of blood into the right atrium (Figure 7-20). Subsequent to angioplasty and stent placement, relief of SVCO symptoms usually is rapid and dramatic. Recurrence of symptoms may be caused by venous thrombosis or tumor progression. Although rupture of the superior vena cava at the time of angioplasty is a risk, this complication seems to be extremely rare, possibly because of the tamponade provided by surrounding tumor or postirradiation fibrosis.
Normal Radiographic Anatomy
Mediastinum and Hilar Structures
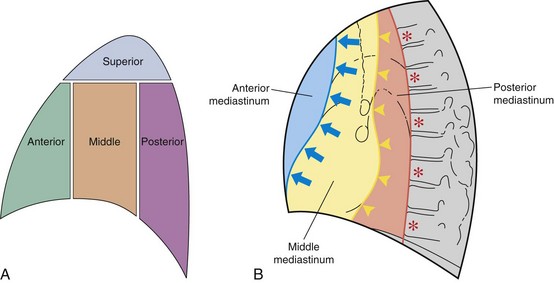
The mediastinum is conventionally divided into superior, anterior, middle, and posterior compartments (Figure 7-21). The practical benefit of use of these arbitrary divisions is that specific mediastinal pathologies show a definite predilection for individual compartments (e.g., a superior mediastinal mass most frequently is caused by intrathoracic extension of the thyroid gland; a middle mediastinal mass usually results from enlarged lymph nodes). However, localization of a mass within one of these compartments does not normally allow a specific diagnosis to be made, and neither do the arbitrary boundaries preclude disease from involving more than one compartment.
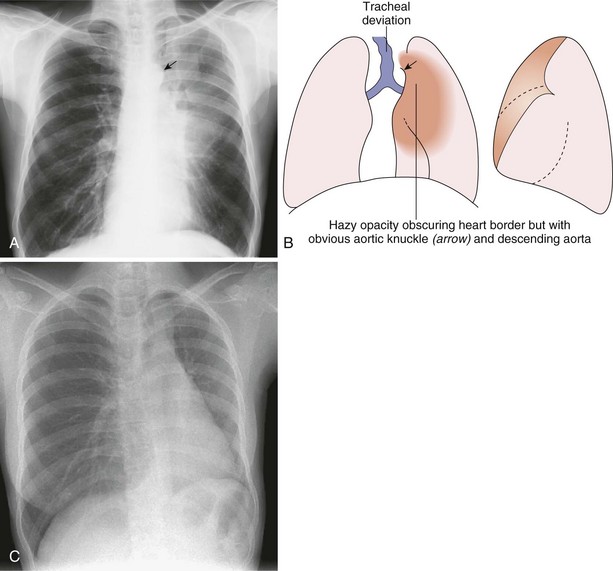
Only the outline of the mediastinum and the air-containing trachea and bronchi (and sometimes esophagus) is clearly seen on a normal posteroanterior chest radiograph. On a chest radiograph, the right brachiocephalic vein and superior vena cava form the right superior mediastinal border. This border usually is vertical and straight (in contrast with the situation in which right paratracheal lymphadenopathy is present, when the right superior mediastinal border tends to be undulate), and it becomes less distinct as it reaches the thoracic inlet. The right side of the superior mediastinum can appear to be considerably widened in patients who have an abundance of mediastinal fat (Figure 7-22); such persons often have prominent cardiophrenic fat pads. The mediastinal border to the left of the trachea above the aortic arch is the result of summation of the left carotid and left subclavian arteries, together with the left brachiocephalic and jugular veins. The left cardiac border consists of the left atrial appendage, which merges inferiorly with the left ventricle. The silhouette of the heart should always be sharply outlined. Any blurring of the border results from loss of immediately adjacent aerated lung, usually by collapse or consolidation.
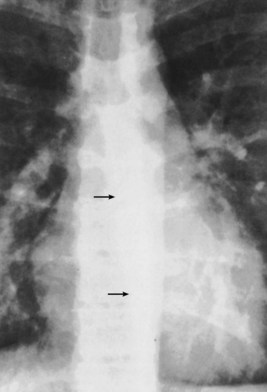
The trachea and main bronchi should be visible through the upper and middle mediastinum. The trachea is rarely straight and often is to the right of the midline at its midpoint. In older persons, the trachea may be markedly displaced by a dilated aortic arch below. In approximately 60% of normal subjects, the right wall of the trachea (the right paratracheal stripe) can be identified as a line of uniform thickness (less than 4 mm in width); when visible, it excludes the presence of any adjacent space-occupying lesion, most usually lymphadenopathy. The angle between the left and right main bronchi, which forms the carina, usually is somewhat less than 80 degrees. Splaying of the carina is a relatively crude sign of subcarinal disease, in the form of either a massive subcarinal lymphadenopathy or a markedly enlarged left atrium. A more sensitive sign of subcarinal disease is obscuration of the upper part of the azygoesophageal line, which usually is visible in its entirety on a chest radiograph with good penetration (Figure 7-23). The origins of the lobar bronchi, when they are projected over the mediastinal shadow, usually can be identified, but segmental bronchi within the lungs generally are not seen on plain radiography.
Pulmonary Fissures, Vessels, and Bronchi
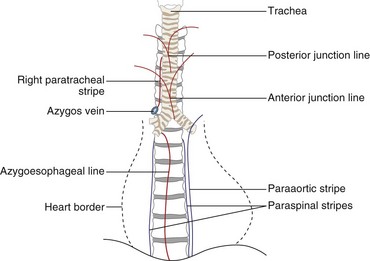
The two lungs are separated by the four layers of pleura behind and in front of the mediastinum. The resultant posterior and anterior junction lines often are visible on frontal chest radiographs as nearly vertical stripes, the posterior junction line lying higher than the anterior (Figure 7-24). Because these junction lines are not invariably seen (their visibility is largely dependent on whether the pleural reflections are tangential to the x-ray beam), their presence or absence is not usually of significance.
Diaphragm and Thoracic Cage
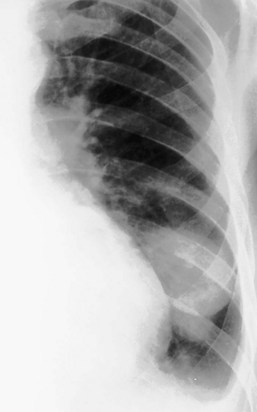
Apparent pleural thickening along the lateral chest wall in the middle zones is a frequent observation in obese patients; it is caused by subpleural fat bulging inward. Deformities of the thoracic cage may cause distortion of the normal mediastinum and so simulate disease. One of the most common deformities is pectus excavatum, which, by compressing the heart between the depressed sternum and vertebral column, causes displacement of the apparently enlarged heart to the left and blurring of the right heart border (Figure 7-25). A similar appearance may arise with an unusually straight thoracic spine, referred to as straight back syndrome.
Anatomy of the Lateral Chest Radiograph
Consistent viewing of lateral chest radiographs in the same orientation, whether a right or a left lateral projection, improves the ability to detect deviations from normal. In the lateral view, the trachea is angled slightly posteriorly as it runs toward the carina, and its posterior wall is always visible as a fine stripe (Figure 7-26). The posterior walls of the right main bronchus and the right intermediate bronchus are outlined by air and also are seen as a continuous stripe on the lateral radiograph. The overlying scapulae are invariably seen running almost vertically in the upper part of the lateral radiograph (and may be misinterpreted as intrathoracic structures). Further confusing shadows are formed by the soft tissues of the outstretched arms, which project over the upper mediastinum. The carina is not visible as such on the lateral radiograph, and the two transradiancies projected over the lower trachea represent the right main bronchus (superiorly) and the left main bronchus (inferiorly).
Overlying structures on a lateral radiograph obscure most of the lung. In normal persons, the unobscured lung in the retrosternal and retrocardiac regions should be of the same transradiancy. Furthermore, as the eye travels down the spine, a gradual increase in transradiancy should be apparent. The loss of this phenomenon suggests the presence of disease in the posterior-basal segments of the lower lobes (e.g., fibrosing alveolitis) (Figure 7-27).
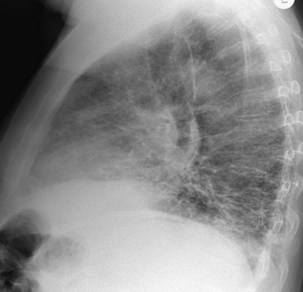
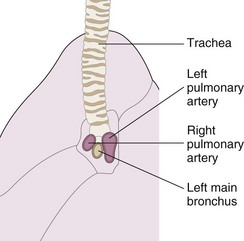
The summation of both hilar on the lateral radiograph generates a complex shadow. However, one general point is useful in the interpretation of this difficult area—the right pulmonary artery lies anterior to the trachea and right main bronchus, whereas the left pulmonary artery arches over the left main bronchus so that a large part of it lies posterior to the major bronchi (Figure 7-28). A bandlike opacity often is seen along the lower third of the anterior chest wall behind the sternum. It represents a normal density and occurs because less aerated lung is in contact with the chest wall, because the space is occupied by the heart; it should not be confused with pleural disease.
Points in the Interpretation of a Chest Radiograph
Radiographic Signs
Consolidation
Consolidation, also referred to as air space shadowing, is caused by opacification of the air-containing spaces of the lung. The causes of consolidation are numerous (Table 7-1) and include almost any pathologic process that results in the filling of the normal alveolar spaces and small airways. The responsible material is almost invariably of fluid density, and usually the volume of the displacing fluid equals the volume of air displaced. This normally results in no net change in size of the lobar anatomy. Typically, it is not possible to tell from the radiologic appearances what has caused the air space filling, especially in the absence of a clinical history. The possible exception to this generalization is with air space shadowing resulting from cardiogenic alveolar edema, when associated signs of congestive cardiac failure are found. In analyzing an area of pulmonary opacification, the presence of a number of radiologic characteristics allows the confident characterization of air space shadowing.
| Common | Rare |
|---|---|
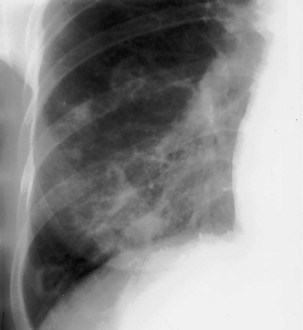
Typically, the shadowing is ill-defined, except when it directly abuts a pleural surface (including the interlobar fissures), in which case it is sharply demarcated (Figure 7-29). Although consolidation respects lobar boundaries, there are no such barriers to spread into adjacent lung segments, which are frequently contiguously involved. Thus, an area of consolidation within a single lobe often enlarges in an irregular manner, and a discrete, well-defined opacity (so-called round pneumonia) is the exception and not the rule (Figure 7-30).
The vascular markings within an area of consolidation usually become obscured, because the contrast between the air-containing lung and the soft tissue density vascular markings is lost. By contrast, the bronchi, which usually are too thin-walled to be differentiated from the surrounding lung parenchyma, become apparent in negative contrast to the air space opacification, to produce the true hallmark of consolidation, the air bronchogram (Figure 7-31). A relatively uncommon but very suggestive radiologic sign of consolidation is the acinar shadow, in which an individual secondary pulmonary lobule becomes opacified but remains surrounded by normally aerated lung. The resultant soft tissue density nodule usually is on the periphery of a more confluent area of consolidation and normally measures 0.5 to 1 cm in diameter. These acinar opacities most commonly are seen in association with mycobacterial and varicella-zoster pneumonias but can occur with any other cause of consolidation (Figure 7-32). Occasionally, an acinus is left normally aerated but surrounded by opacified air spaces; this radiologic sign has been termed the air alveologram. When consolidation is not fully developed and has caused only partial filling of the air spaces, the resultant radiographic appearance is ground glass opacification (Figure 7-33). Again, a wide range of possible causes has been documented, and in addition to causes of consolidation, this pattern may result from interstitial lung infiltration.
When an area of consolidation undergoes necrosis, because of either infection or infarction, liquefaction may result, and if either a gas-forming organism or communication with the bronchial tree is present, an air-fluid level may develop in addition to cavity formation (Figure 7-34). Consolidation frequently produces a silhouette sign, as described by Felson and Felson. Although this radiographic sign may be seen in association with a wide number of intrapulmonary pathologic processes, it is the relatively transitory nature of many forms of consolidation that best demonstrates the features of this finding. The original description stated that when an intrathoracic lesion touched a border of the heart, aorta, or diaphragm, it obliterated that border on the radiograph. Furthermore, a small area of consolidation may obliterate a normal air–soft tissue interface as effectively as a large area. This contingency is demonstrated well by the obliteration of the right heart border by subtle middle lobe consolidation that might otherwise be overlooked.
Understanding the significance of the silhouette sign allows the observer to localize an area of consolidation or other pulmonary opacity. Only if an area of consolidation lies in direct contact with a normal structure is the silhouette of that structure lost. If an area of consolidation and a normal structure–lung interface merely lie along the same x-ray path, they are superimposed on the radiograph but do not demonstrate the silhouette sign. Thus, lingular consolidation is likely to obscure the heart border, but left lower lobe consolidation usually does not (Figures 7-35 through 7-37). Several potential causes for a falsely positive silhouette sign are recognized. Some relatively common anatomic variants that result in a reduced anteroposterior diameter of the thorax, such as pectus excavatum or straight back syndrome, cause loss of the right heart border as the depressed sternum distorts the normal anatomy (see Figure 7-25). Occasionally, a scoliosis, usually concave to the left and often of relatively trivial clinical significance, causes the right heart border to be projected over the spine. It is only when the heart border is projected over the right lung that the silhouette sign can be elicited. Underexposed radiographs may appear to demonstrate the silhouette sign, so it is imperative that the technical quality of the radiograph be taken into account.
Collapse
Radiographic Signs of Lobar Collapse
Hilar Displacement
The hilum may be elevated in upper lobe collapse and depressed in lower lobe collapse.
Complete Lung Collapse
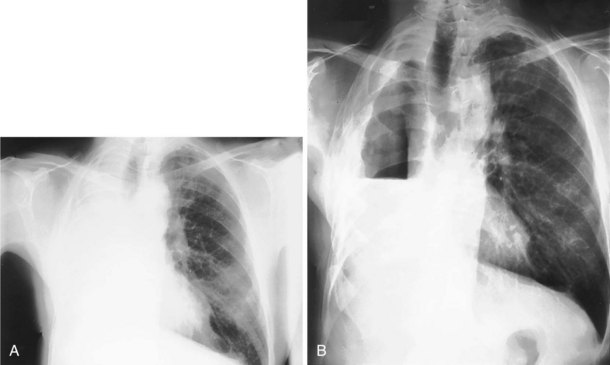
With complete collapse of an entire lung (in the absence of an accompanying pneumothorax, large pleural effusion, or extensive consolidation), complete opacification of that hemithorax is seen, with displacement of the mediastinum to the affected side and elevation of the hemidiaphragm. Compensatory hyperinflation of the contralateral lung occurs, often with herniation across the midline. Herniation most often is in the retrosternal space, anterior to the ascending aorta, but may occur posterior to the heart (Figure 7-38).
Individual Lobar Collapse
The descriptions that follow apply to collapse of individual lobes, uncomplicated by preexisting pulmonary or pleural disease. The alterations in the positions of the fissures, mediastinal structures, and diaphragms are shown in Figures 7-39 to 7-43.
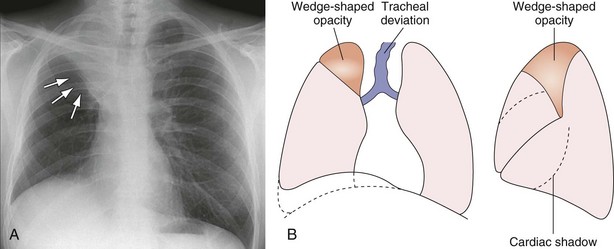
Right Upper Lobe Collapse
As the right upper lobe collapses (see Figure 7-39), the horizontal fissure rotates around the hilum and the lateral end moves upward and medially toward the superior mediastinum. The anterior end moves upward, toward the apex. The upper half of the oblique fissure moves anteriorly. The two fissures become concave superiorly. In severe collapse, the lobe may be flattened against the superior mediastinum and may obscure the upper pole of the hilum. The hilum is elevated, and its lower pole may be prominent. Deviation of the trachea to the right is usual, and compensatory hyperinflation of the right middle and lower lobes may be apparent.
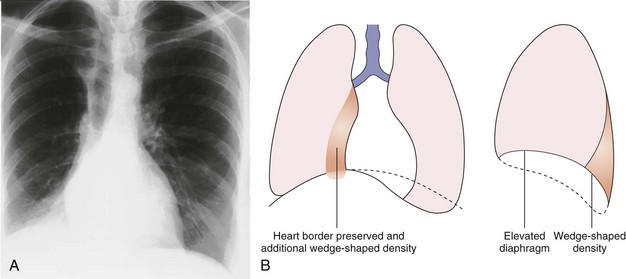
Middle Lobe Collapse
In right middle lobe collapse (see Figure 7-40), the horizontal fissure and lower half of the oblique fissure move toward each other, a feature best seen on the lateral projection. Because the horizontal fissure tends to be more mobile, it usually shows greater displacement. On the frontal (anteroposterior) radiograph, changes associated with middle lobe collapse may be subtle, because the horizontal fissure may not be visible, and increased opacity does not become apparent until collapse is almost complete. Critical analysis of the radiograph sometimes reveals obscuration of the right heart border as the only clue. The lordotic anteroposterior projection is rarely required but may be used to bring the displaced fissure into the line of the x-ray beam and occasionally may elegantly demonstrate middle lobe collapse. Because the volume of this lobe is relatively small, indirect signs of volume loss are rarely obvious.
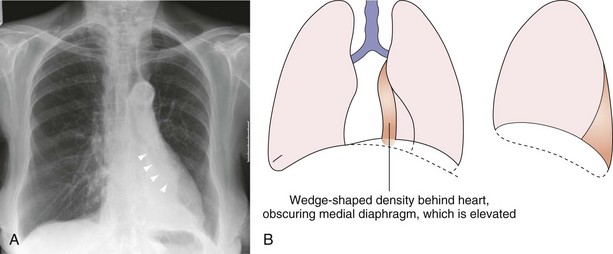
Left Lower Lobe Collapse
In left lower lobe collapse (see Figure 7-41), the normal oblique fissures extend from the level of the fourth thoracic vertebra posteriorly to the diaphragm, close to the sternum anteriorly. The position of these fissures on the lateral projection is the best index of lower lobe volumes. When a lower lobe collapses, the oblique fissure moves posteriorly but maintains its normal slope. In addition to posterior movement, the collapsing lower lobe causes medial displacement of the oblique fissure, which may become visible in places on the frontal projection.
Right Lower Lobe Collapse
Right lower lobe collapse (see Figure 7-42) causes partial depression of the horizontal fissure, which may be apparent on the frontal projection. Increased opacity of a collapsed lower lobe is usually visible on the frontal projection also. A completely collapsed lower lobe may be so small that it flattens and merges with the mediastinum to produce a thin, wedge-shaped shadow. In left lower lobe collapse, the heart may obscure this opacity, and a penetrated view may be required to demonstrate it. Mediastinal structures and parts of the diaphragm adjacent to the nonaerated lobe are obscured. When significant lower lobe collapse occurs, especially when the collapsed lobe is so small as to be invisible as a separate opacity, confirmatory evidence usually is apparent from close inspection of the relevant hilum. This area typically is depressed and rotated medially, with loss of the normal hilar vascular structures, which is made all the more obvious if a previous film is available for comparison. In addition, indirect signs of collapse, such as upper lobe hyperinflation, are present. Diaphragmatic elevation is unusual.
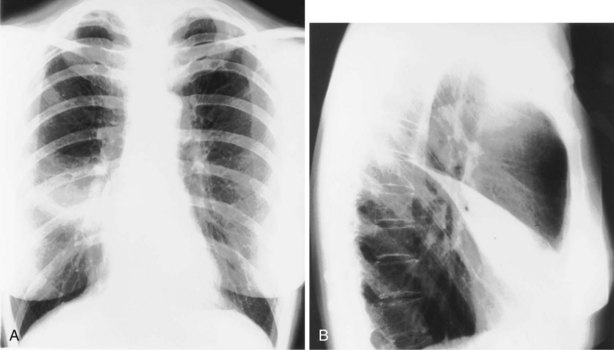
Left Upper Lobe Collapse
The pattern of upper lobe collapse is different in the two lungs. Left upper lobe collapse (see Figure 7-43) is apparent on the lateral projection as anterior displacement of the entire oblique fissure, which becomes oriented almost parallel to the anterior chest wall. With increasing collapse, the upper lobe retracts posteriorly and loses contact with the anterior chest wall. With complete collapse, the left upper lobe may lose contact with the chest wall and diaphragm and retract medially against the mediastinum. On a lateral film, therefore, left upper lobe collapse is seen as an elongated opacity that extends from the apex and reaches, or almost reaches, the diaphragm; it is anterior to the hilum and is bounded by the displaced oblique fissure posteriorly and by the hyperinflated lower lobe.
Combined Lobar Collapses
Right Lower and Middle Lobe Collapse
Because the right lower and middle lobes take their origin from the bronchus intermedius, an extensive lesion involving those sites may cause combined collapse. The radiographic appearance is similar to that in right lower lobe collapse (Figure 7-44), except that the horizontal fissure is not apparent, and the opacification reaches the lateral chest wall on the frontal view and similarly extends to the anterior chest wall on the lateral view.
Right Upper and Middle Lobe Collapse
Combined collapse of the right upper and middle lobes is unusual because of the distance between the origins of their bronchi; it generally can be taken to imply the presence of more than one lesion. This combination produces appearances almost identical to those of left upper lobe collapse (Figure 7-45). On occasion, isolated right upper lobe collapse also produces appearances that are identical to those with left upper lobe collapse.
Rounded Atelectasis
Rounded atelectasis is an unusual form of pulmonary collapse that may be misdiagnosed as a pulmonary tumor. The plain film will show an opacity that may be several centimeters in diameter, frequently with ill-defined edges. Rounded atelectasis is always pleura-based and associated with pleural thickening. Vascular shadows may radiate from part of the opacity, said to resemble a comet’s tail (Figure 7-46). The appearance is caused by peripheral lung tissue folding in on itself. Rounded atelectasis usually is related to previous asbestos exposure but also may be secondary to any exudative pleural effusion. It is not of any other pathologic significance, although when present often raises the question of a malignancy. The CT appearance usually is sufficiently diagnostic to allow differentiation from other pulmonary masses.
Unilateral Increased Transradiancy
Chest Wall
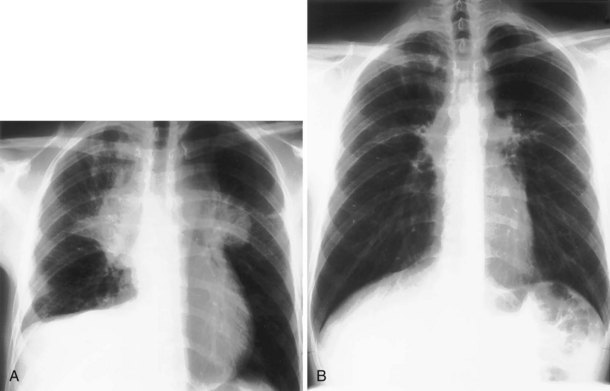
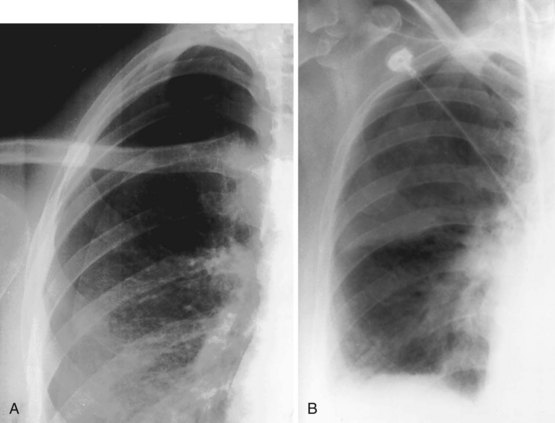
A hemithorax may appear of increased transradiancy (blacker) if the x rays are less attenuated because of a reduction in the amount of overlying soft tissue. The most common cause for this appearance is a mastectomy. Rarely, the same phenomenon may be seen in patients who have congenital unilateral absence of pectoral muscles in Poland syndrome (Figure 7-47). This defect may be accompanied by associated skeletal abnormalities in the ipsilateral ribs but may be recognized by loss of the normal axillary skin fold.
Reduced Vascularity
Interruption or significant reduction in the blood supply to one lung, either congenital or acquired, has increased transradiancy (Figure 7-48).
The Pulmonary Mass
When a pulmonary mass is clearly defined around its entire circumference and is projected over the lung on frontal and lateral projections, the mass is truly intrapulmonary (Figure 7-50). If a surface is in contact with another soft tissue structure, however, the possibility of an extrapulmonary mass projecting into the lung must be considered. Analysis of the breadth of the base of the lesion, the angle made with the adjacent structure, and the presence of bone destruction often allows the observer to differentiate an extrapulmonary mass that extends into the adjacent lung from an intrapulmonary mass that has grown to contact the mediastinum, diaphragm, or chest wall.
Density
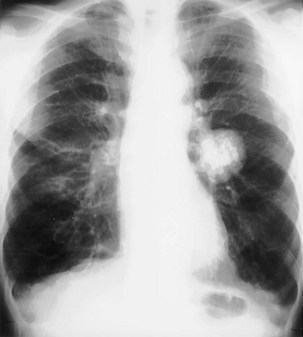
Most pulmonary masses are of soft tissue density. However, careful inspection must be made for the presence of calcification, because certain patterns of calcification are typical of benign lesions that may be safely observed rather than resected (Figure 7-51). A completely or centrally calcified nodule is diagnostic of a tuberculoma or histoplasmoma. Often, CT is required to confirm this pattern of calcification. Likewise, concentric rings of calcification are typical of healed histoplasmosis infection. Popcorn calcification, within the matrix of a pulmonary nodule, is highly suggestive of a hamartoma (Figure 7-52). Other forms of calcification do not reliably indicate whether a nodule is benign or malignant, and dystrophic calcification within a pulmonary malignancy is relatively common.
Growth Rate
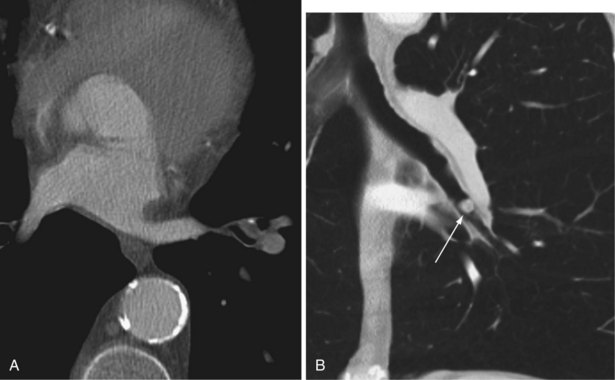
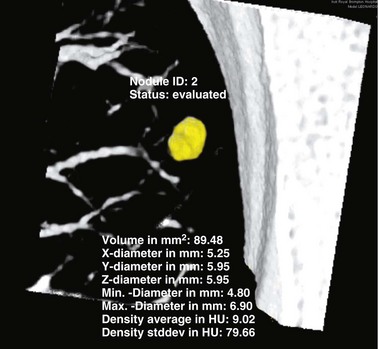
Review of previous radiographs, when available, may establish whether a lesion is static or increasing in size. It is usual practice to express the growth of a pulmonary tumor in terms of the time taken for it to double in volume, which equates to an increase in diameter of 25%, assuming that the tumor is roughly spherical, as is usually the case. Tumors with a doubling time of less than 30 days or more than 2 years are very unlikely to result from malignancy. Often, however, no previous films are available, so the use of growth rate as a diagnostic aid is limited. Modern CT allows small pulmonary lesions to be followed over increasing intervals to confirm lack of growth. This is facilitated by the use of automated software that allows volumetric information to be derived from the CT dataset (Figure 7-53).
Enhancement Characteristics
Because carcinoma of the bronchus arises in the bronchial mucosa, the tumor is likely to grow into the bronchial lumen and around the bronchus. As the bronchial lumen narrows, the distal lung may become consolidated and lose volume. Depending on the site of the tumor, a malignant solitary lung mass may be associated with lobar or segmental collapse (Figure 7-54) or even collapse of an entire lung (see Figure 7-38).
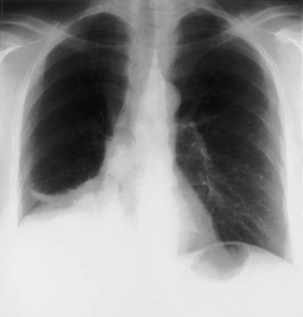
Figure 7-54 Right lower and partial middle lobe collapse secondary to a proximal bronchogenic carcinoma.
Peripheral tumors usually appear as solitary nodules or masses, but no features on plain films reliably differentiate a benign from a malignant pulmonary nodule. As described previously, malignant tumors often are larger, poorly defined, spiculated, or lobulated. Satellite opacities around a mass are more commonly seen with benign lesions, notably granulomatous diseases (see Figure 7-32). At least 5% of bronchial carcinomas cavitate as a consequence of central necrosis or abscess formation; the resultant cavity typically is thick-walled with an irregular inner margin (Figure 7-55). Peripheral tumors may invade the ribs or spine directly. Bone destruction must be specifically looked for and, when present, almost invariably indicates malignancy (Figure 7-56).
Multiple Pulmonary Nodules
The differential diagnosis of multiple pulmonary nodules is wide in scope (Box 7-3), but analysis of the chest radiograph and a review of the clinical status of the patient will rapidly narrow the number of possibilities. Many of the radiographic features used in the analysis of the solitary pulmonary nodule can be used to advantage in the assessment of multiple lesions.
Radiographically, multiple nodules are described in terms of size, number, distribution, density, definition, cavitation, speed of growth (if serial films are available), and accompanying pleural, mediastinal, or skeletal abnormalities. Further important clinical clues may come from the clinical status of the patient. Specifically, evidence of infection, systemic illness, and previous malignancy is sought (Figures 7-57 to 7-60). Miliary nodules are a particular form of nodular shadowing. The term miliary derives from the resemblance in size and shape of the nodules to millet seeds, being round, well defined, and 2 to 3 mm in diameter. Although the description usually is associated with tuberculosis, this pattern of nodular infiltrate also may be due to histoplasmosis, organic and inorganic dust diseases, sarcoid, or metastases.
Diffuse Shadowing
Reticular Shadowing
Reticular or linear shadowing (Figure 7-61) is made up of multiple, short, irregular linear densities, usually randomly oriented and often overlapping to produce a netlike pattern. When profuse, they may summate to form ring shadows or sometimes a nodular pattern. Occasionally, the linear shadows may be oriented at right angles to the pleural surface, so-called Kerley B lines (Figure 7-62)—a feature that indicates thickening of the interlobular septa. When the linear opacities are extremely profuse or coarse, the impression of a ring or honeycomb pattern is typical.
Nodular Opacities
Nodules may be well or poorly defined and of varying density, ranging from soft tissue to calcific (Figure 7-63). They may be discrete or coalescent, with areas of confluence producing consolidation. When the nodules are greater than a few millimeters in diameter, the differential diagnosis changes. Larger discrete nodules were discussed previously.
Ground Glass Shadowing
Ground glass shadowing (see Figure 7-33) refers to a generalized increase in density of the lung, which may be diffuse or patchy but most commonly is bilateral and in a middle and lower zone or perihilar location. The underlying vascular branching pattern is not totally obscured as it is in consolidation, but the vessels become less distinct; likewise, the hila and hemidiaphragms may appear less sharp. This subtle abnormality is considerably easier to appreciate with the benefit of a previous normal film for comparison.
Airway Disease
Tracheal Narrowing
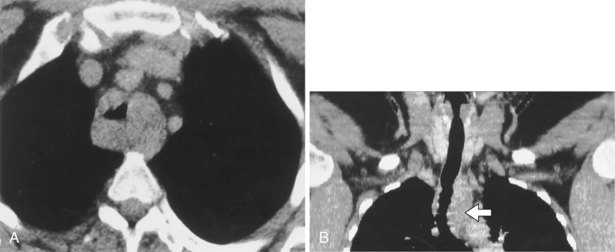
Tracheal narrowing may be caused by an extrinsic mass, mediastinal fibrosis, or an intrinsic abnormality of the tracheal wall. Chronic inflammatory causes include fibrosing mediastinitis, sarcoidosis, chronic relapsing polychondritis, infection (Figure 7-64), and Wegener’s granulomatosis. Primary tumors of the trachea are rare. Benign tumors manifest as small, well-defined, intraluminal nodules that are difficult or impossible to visualize on the chest radiograph. Malignant tumors of the trachea tend to occur close to the carina (Figure 7-65), although they may be quite extensive and cause a long stricture. Tracheal wall thickening and tracheal luminal narrowing can be detected on the plain chest radiograph, especially when specifically sought, but are best appreciated on CT (Figure 7-66). The right lateral wall of the trachea (the right paratracheal stripe) above the level of the azygos vein, typically is a 2-mm-thick soft tissue stripe, and tracheal wall thickening can be detected on the plain radiograph if this portion of the airway is involved.
Tracheal Widening
Mounier-Kuhn syndrome is the condition that causes the most dramatic tracheal dilatation (Figure 7-67). It is extremely rare and was first described in 1932. On the plain radiograph, shift of the right paratracheal stripe to the right often is the only sign of tracheal widening, and because the trachea frequently is not central in location, tracheal widening can be recognized only if the left wall of the trachea also is identified. The Mounier-Kuhn syndrome is underreported because it may go undiagnosed—clinical signs and symptoms are similar to those of chronic bronchitis, COPD, or bronchiectasis. Other features include marked dilatation of the trachea and major bronchi associated with repeated respiratory infections and copious sputum production. CT scans demonstrate tracheobronchial dilatation; some will often reveal parenchymal scarring secondary to chronic infection. Bronchoscopy demonstrates dilated central airways with thickened walls. Dilatation results in ineffective mucociliary expectoration, and the subsequent chronic inflammation contributes to the cycle of infection and continued inflammation, leading to bronchiectasis and recurrent pneumonia and the development of emphysema.
Bronchiectasis
The chest radiograph is relatively insensitive for the detection of bronchiectasis, and in most series, a significant proportion of plain radiographs obtained in patients with clinical bronchiectasis are judged to be normal (Figure 7-68). The use of HRCT is discussed later on; this modality is now the investigation of choice for bronchiectasis. Abnormalities present on the chest radiograph are as follows.
Mediastinal Abnormalities
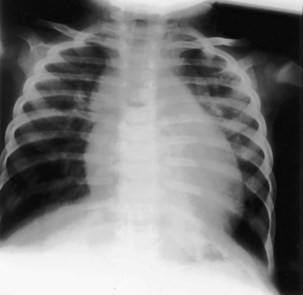
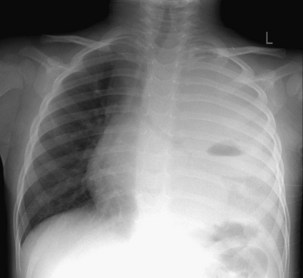
The most common cause of mediastinal enlargement visible on the chest radiograph in children is the normal thymus, which may enlarge and contract in certain disease states but typically remains relatively prominent, especially on CT scans, until puberty (Figure 7-69). Lymphadenopathy, tumor, hiatal hernia, and vascular abnormalities account for most mediastinal masses seen in adults.
Mediastinal Lymphadenopathy
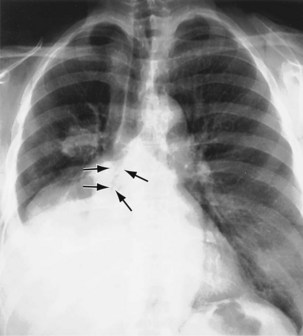
Lymph nodes are present in all compartments of the mediastinum but are visible on the chest radiograph only when they are calcified or enlarged. Causes of mediastinal nodal enlargement are discussed elsewhere. The chest radiograph is a relatively insensitive indicator of lymphadenopathy. Enlargement of right paratracheal nodes is identified more easily than that of left paratracheal nodes, aortic-pulmonary nodes, and subcarinal lymphadenopathies (Figure 7-70). Barium swallow is a simple method of identifying some cases of subcarinal lymphadenopathy, but CT is the most comprehensive and accurate method of assessing mediastinal nodes.
Abnormalities of the Thoracic Aorta
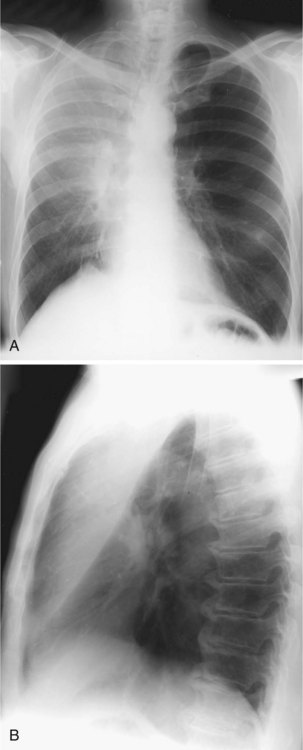
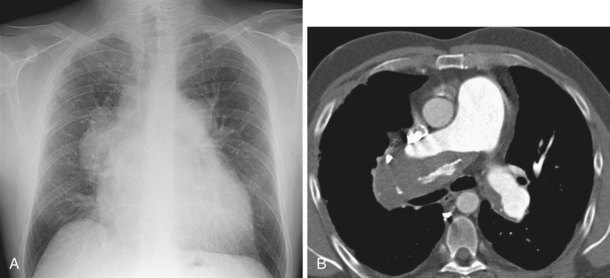
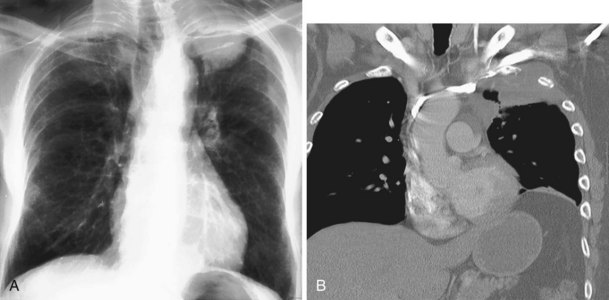
The thoracic aorta arises in the middle mediastinum and then arches through the anterior, middle, and posterior mediastinal compartments. The greater vessels arise from the aortic arch in the superior mediastinum (Figure 7-71). Dilatation or tortuosity of the aortic arch or its branches may cause widening of the mediastinal shadow. So-called unfolding of the aorta is a common chest radiographic finding in elderly or hypertensive patients. Aneurysm of the aorta most often results from atherosclerosis (Figure 7-72). Cystic medial necrosis (Marfan syndrome), infection (mycotic aneurysm), syphilitic aortitis, and a history of trauma are less common causes. Most aortic aneurysms are asymptomatic and manifest as mediastinal opacities on the radiograph, sometimes with curvilinear calcification visible in the wall. Aneurysms of the ascending aorta are best appreciated on the lateral radiograph as a filling in of the retrosternal window. Aneurysms of the arch and descending aorta frequently are evident on the frontal radiograph, but a lateral view often is required for more accurate localization, and cross-sectional imaging may be warranted to confirm that the mediastinal abnormality in question is of vascular origin.
In the acutely injured patient, traumatic aortic rupture may be suspected from the appearance on the chest radiograph, and confirmation of injury usually requires angiography (Figure 7-73). When the chest radiographic findings are equivocal, however, in concert with a degree of trauma less than that usually associated with aortic injury, a spiral CT scan may be performed in the stable patient to exclude a mediastinal hematoma. If any doubt remains, the patient should proceed to angiography. If the aortic injury remains undetected and the patient survives, an aneurysm secondary to the trauma may develop subsequently. Such lesions almost always are confined to the junction of the aortic arch and descending aorta. Aortic abnormalities may produce remodeling due to chronic pressure in adjacent skeletal structures.
Aneurysm of the ascending aorta may be associated with erosion of the posterior surface of the sternum, and descending aortic aneurysms may cause scalloping of the spine. Tortuosity of the innominate artery is a common cause of widening of the superior mediastinum in elderly persons. Right-sided aortic arch (Figure 7-74) and pseudocoarctation of the aorta are two anomalies that may alter the appearance of the mediastinum, suggestive of a mass.
Abnormalities of the Esophagus
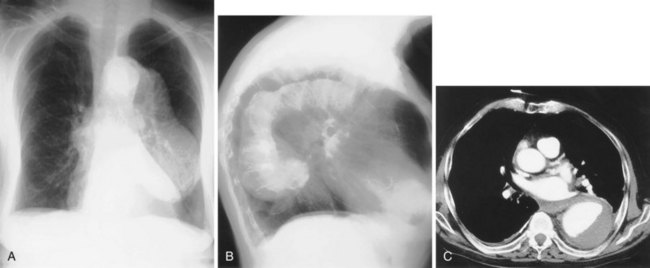
Abnormalities of the esophagus are relatively common. They include infection and inflammation, trauma and perforation, and benign and malignant neoplastic processes. Esophageal abnormalities may be associated with diseases that also involve the lungs. Such conditions are best exemplified by achalasia of the cardia (Figure 7-75) or systemic sclerosis (Figure 7-76), in which esophageal motility disorders resulting in significant dilatation and reflux may be encountered in conjunction with pulmonary fibrosis and the sequelae of recurrent aspiration.
Dilatation of Central Veins
The superior vena cava and the azygos vein may dilate because of increased pressure, increased flow, obstruction, or congenital abnormality. Increased flow in the superior vena cava is seen with supracardiac, total, anomalous pulmonary venous drainage (Figure 7-77), and in the azygos vein, with congenital absence of the inferior vena cava. Rarely, aneurysmal dilatation of the superior mediastinal veins produces an abnormal mediastinal silhouette. Likewise, obstruction of the superior vena cava may cause dilatation of the great veins in the superior mediastinum, which results in widening of the mediastinal contour. However, the clinical features are likely to be obvious by the time radiographic abnormalities become significant.
Other Mediastinal Abnormalities
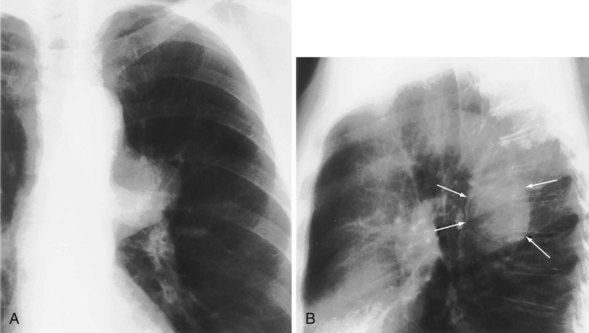
Pneumomediastinum or mediastinal emphysema is the presence of air between the tissue planes of the mediastinum. This condition may be secondary to interstitial pulmonary emphysema (most often caused by mechanical ventilation); to perforation of the esophagus, trachea, or a bronchus; or to a penetrating chest injury. Chest radiography may show vertical, translucent streaks in the mediastinum, which represent the soft tissue planes separated by air (Figure 7-78). The air may extend up into the neck and over the chest wall (causing subcutaneous emphysema) and also over the diaphragm. The mediastinal pleura may be displaced laterally and then become visible as a thin stripe alongside the mediastinum.
Hilar Abnormalities
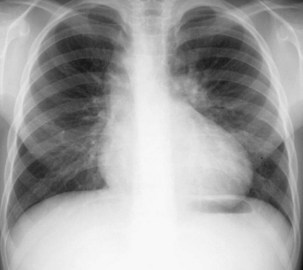
Having identified a hilar abnormality, the observer must differentiate between a vascular and a nonvascular cause. Vascular prominence often is bilateral and accompanied by enlargement of the main pulmonary artery (Figure 7-79). Although the hila are large, they are of relatively normal density, and it usually is possible to trace the pulmonary artery branches in continuity from the adjacent lung to their point of convergence with the interlobar arteries, known as the hilar convergence sign. By comparison, enlargement caused by lymph nodes or hilar tumor generally produces a lobulated hilar contour, with discernible lateral or inferior borders. Frequently, the normal hilar point is obliterated, and on the left, the aortopulmonary angle is filled in (Figure 7-80).
Occasionally, a pulmonary lesion is superimposed directly on the hilum on the frontal radiograph, which produces a spuriously large or dense hilum. The true position of the abnormality is revealed on the lateral radiograph (see Figure 7-72). A further pitfall arises when the vessels to the lingula or, more commonly, the right middle lobe are superimposed on the lower part of the hilar shadow, particularly when the film is taken anteroposteriorly, in a lordotic projection, or with a poor inspiratory effort. A lateral radiograph usually confirms the vascular nature of the shadowing.
Pleural Disease
Pleural Fluid
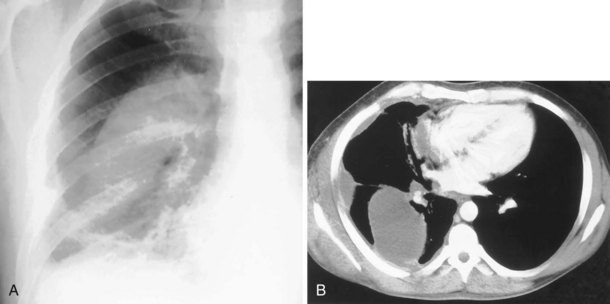
The most dependent recess of the pleural space is the posterior costophrenic angle, which is where a small effusion tends to collect. As little as 100 to 200 mL of fluid accumulated in this recess can be seen above the dome of the diaphragm on the frontal view. Even smaller effusions may be seen on a lateral radiograph, and it is possible to identify effusions of only a few milliliters by use of decubitus radiographic views made with a horizontal beam, ultrasound imaging, or CT. Eventually, the costophrenic angle on the frontal view fills in, and with increasing fluid a homogeneous opacity spreads upward, obscuring the lung base (Figure 7-81). The fluid usually demonstrates a concave upper edge, higher laterally than medially, and obscures the diaphragm. Fluid may track into the fissures. A massive effusion may cause complete opacification of a hemithorax with passive atelectasis. The space-occupying effect of the effusion may push the mediastinum toward the opposite side, especially when the lung does not collapse significantly (Figure 7-82).
Encapsulated or encysted fluid may be difficult to differentiate from an extrapleural opacity, parenchymal lung disease, or mediastinal mass. Of note, however, an encysted effusion often is associated with free pleural fluid or other pleural shadowing and may extend into a fissure (see Figure 7-81). Loculated effusions tend to have comparatively little depth but considerable width, rather like a biconvex lens. Their appearance, therefore, depends on whether they are viewed end on, in profile, or obliquely. Extrapleural opacities tend to have a much sharper outline, with tapered, sometimes concave edges where they meet the chest wall. Peripheral, pleurally based lung lesions may show an air bronchogram, which differentiates them from true pleural disease. The differentiation between pleural thickening or mass and loculated pleural fluid may be difficult on plain films; CT and ultrasound imaging are particularly useful in this context.
Fluid may become loculated in the interlobar fissures and most frequently is seen in heart failure. Fluid that collects in the horizontal fissure produces a lenticular, oval, or round shadow, with well-demarcated edges. Loculated fluid in an oblique fissure may be poorly defined on a frontal radiograph, but a lateral film usually is diagnostic, because the fissure is seen tangentially and the typical lenticular configuration of the effusion is demonstrated. Loculated interlobar effusions can appear rounded on two views and may disappear rapidly. Hence, they are sometimes known as pulmonary pseudotumors (Figure 7-83). With subsequent episodes of heart failure, they may return at the same site.
Pneumothorax
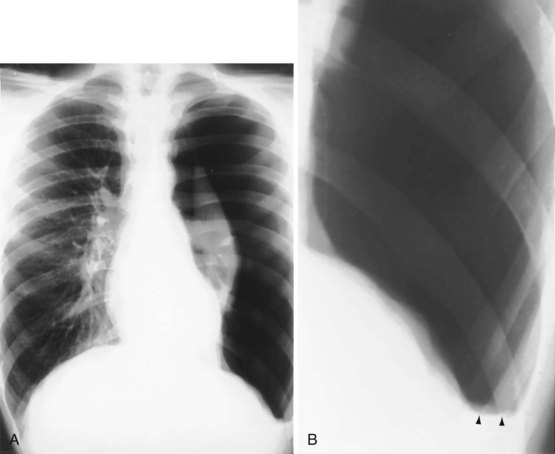
A small pneumothorax is easily overlooked, and in an erect patient, the air usually collects at the apex. The lung retracts toward the hilum, and on a frontal chest film, the sharp white line of the visceral pleura is visible, separated from the chest wall by the radiolucent pleural space, which is devoid of lung markings. This appearance should not be confused with that of a skin fold (Figure 7-84). The lung usually remains aerated, although perfusion is reduced in proportion to ventilation, so the radiodensity of the partially collapsed lung remains relatively normal. A closed pneumothorax is easier to see on an expiratory film, although expiratory radiographs are not routinely required to detect clinically significant pneumothoraces. A lateral decubitus film made with the affected side uppermost occasionally is helpful, because the pleural air can be seen along the lateral chest wall. This view is particularly useful in infants, because small pneumothoraces are difficult to see on supine anteroposterior films, because the air tends to collect anteriorly and medially.
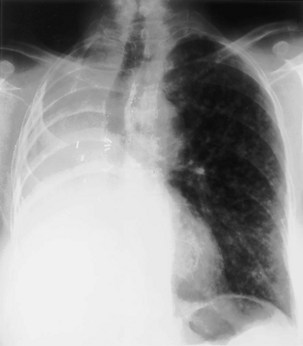
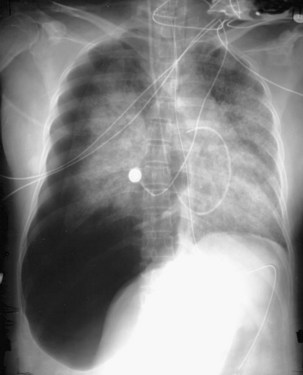
A large pneumothorax may lead to complete relaxation and retraction of the lung, with some mediastinal shift toward the normal side (Figure 7-85). Because it constitutes a medical emergency, tension pneumothorax often is treated before a chest radiograph is obtained. However, if a radiograph is taken in this situation, it shows marked displacement of the mediastinum (Figure 7-86). Radiographically, the lung may be squashed against the mediastinum or herniate across the midline, and the ipsilateral hemidiaphragm may be depressed.
Complications of Pneumothorax
Because the normal pleural space contains a small volume of fluid, blunting of the costophrenic angle by a “short” fluid level commonly is seen on radiographs of a pneumothorax (see Figure 7-85). In a small pneumothorax, this fluid level may be the most obvious radiologic sign. A higher fluid level usually signifies a complication and represents exudate, pus, or blood, depending on the etiology of the pneumothorax (Figure 7-87).
The usual radiographic appearance of a hydropneumothorax is that of a pneumothorax containing a horizontal fluid level that separates opaque fluid below from lucent air above. A hydrothorax or pyopneumothorax may arise as a result of a bronchopleural fistula (an abnormal communication between the bronchial tree and the pleural space). This may be a complication of surgery but also may occur as a complication of a subpleural lung tumor (Figure 7-88).
Pleural Thickening
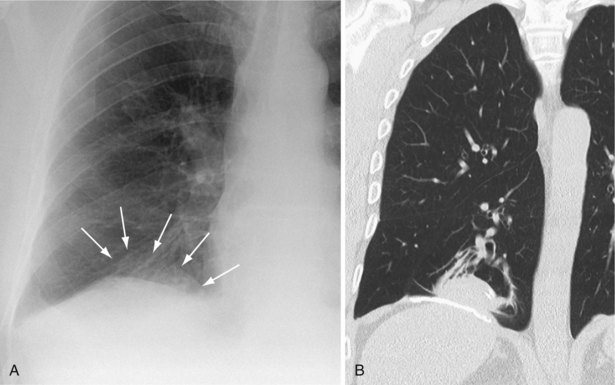
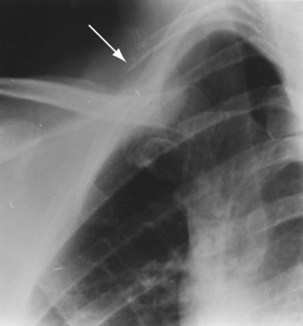
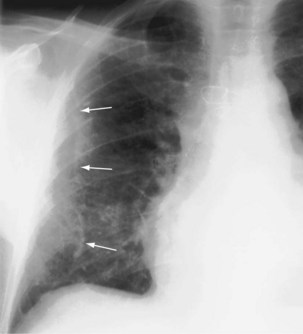
Bilateral apical pleural thickening is common, usually symmetric in distribution, and more frequent in elderly patients and does not necessarily indicate previous tuberculosis. The etiology is uncertain, but in some affected persons, the “caps” represent extrapleural fat that has descended because of scarring and consequent retraction of the upper lobes. By contrast, asymmetric or unilateral apical pleural thickening may be highly significant, especially if associated with pain. Asymmetric apical pleural shadowing may represent a Pancoast tumor, and bone destruction should be specifically sought (Figure 7-89).
More extensive unilateral pleural thickening usually is the result of a previous thoracotomy or an exudative pleural effusion. A simple transudate typically resolves completely, but empyema and hemothorax are more likely to resolve with residual pleural fibrosis. The thickened pleura may calcify (Figure 7-90), and the entire lung may become surrounded by fibrotic pleura, which may be as much as a few centimeters thick (Figure 7-91). Bilateral (parietal) pleural plaques are a common manifestation of asbestos exposure, and occasionally more diffuse, visceral pleural thickening is seen.
Pleural Calcification
In general, pleural calcification has the same causes as for pleural thickening. Unilateral pleural calcification is therefore likely to be the result of previous empyema or hemothorax, and bilateral calcification occurs after asbestos exposure (Figure 7-92). Pleural calcification may be discovered in a patient who was not aware of previous chest disease.
The calcification associated with previous pleurisy, empyema, or hemothorax occurs in the visceral pleura (Figure 7-93); associated pleural thickening is almost always present and separates the calcium from the ribs. The calcium may be in a continuous sheet or in discrete plaques, which usually produce dense, coarse, irregular shadows, often sharply demarcated laterally. When a plaque is viewed end on, it may be less well defined, mimicking a pulmonary infiltrate.
Pleural Masses
Primary tumors of the pleura are rare. Benign tumors of the pleura include pleural fibroma and lipoma (Figure 7-94). The most common malignant disease of the pleura is metastatic, usually adenocarcinoma from the bronchus or breast (Figure 7-95). Malignant mesothelioma typically is associated with previous asbestos exposure.
Computed Tomography
Anatomy of the Mediastinum
The soft tissue contrast provided by CT, as well as its cross-sectional nature, makes the diagnostic information available from CT far superior to that provided by two-dimensional radiography. Modern CT scanners can acquire a volume of imaging information that includes the whole of the mediastinum within the time of a single breath-hold. This three-dimensional dataset can then be displayed as continuous or overlapping axial slices, free from breathing movement artifact. Usually, a collimation and slice width of between 5 and 10 mm is used, and it is usual, but not always essential, to give intravenous contrast. The normal mediastinal anatomy is demonstrated in Figures 7-96 to 7-101.
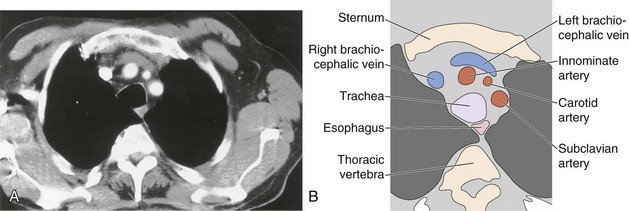
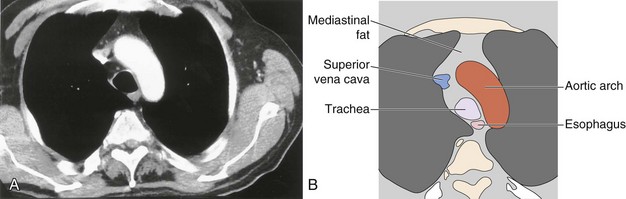
Figure 7-97 Mediastinal anatomy at the level of the aortic arch: computed tomography scan (A) with labeled diagram (B).
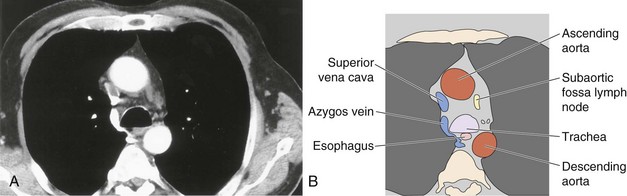
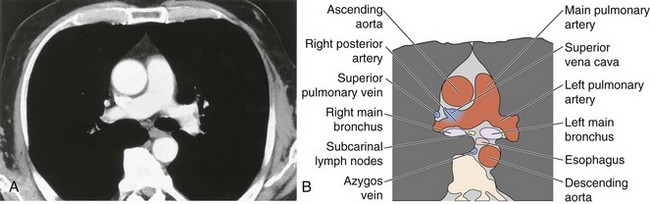
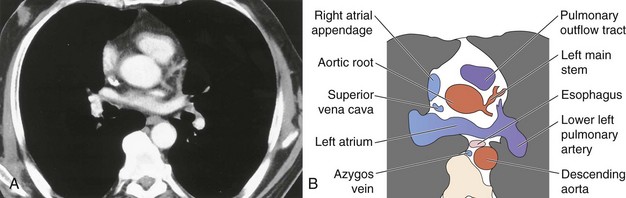
Figure 7-100 Mediastinal anatomy through the aortic root: computed tomography scan (A) with labeled diagram (B).
Great Vessels
The great vessels constitute the most familiar anatomic landmarks within the mediastinum. Knowledge of the relationship of these vessels to other mediastinal components allows accurate description of the location of pathology and has important implications for planning the approach to either an open operation or mediastinoscopy. The most common branching pattern of the aortic arch is for three arteries to arise from the upper arch—the right innominate, left common carotid, and left subclavian (see Figure 7-96). However, many variations to this basic anatomy exist (see Figures 7-71, 7-74, and 7-77). The transverse portion of the aortic arch is the most readily recognizable vascular structure within the mediastinum (see Figure 7-97). The great veins lie anterior to the arterial structures. The left brachiocephalic vein is situated above and anterior to the aortic arch and aortic branches, although its position is variable. The right brachiocephalic vein descends more directly in the anterior right mediastinum to merge with its counterpart to form the superior vena cava. Because CT contrast is given from one arm, one brachiocephalic vein is heavily opacified, whereas the other remains of soft tissue density.
The pulmonary outflow tract ascends, usually outlined by fat within the pericardium, to divide adjacent and just posterior to the ascending aorta. The main pulmonary artery diameter typically is equal to or less than that of the ascending aorta as measured on CT. When the pulmonary artery diameter exceeds the aortic diameter, underlying pulmonary hypertension is likely. The right pulmonary artery swings dorsally and to the right, behind the ascending aorta and the superior vena cava and anterior to the right main bronchus (see Figure 7-99). After giving a branch to the upper lobe, it descends posterolaterally to the bronchus intermedius. The left pulmonary artery follows a shorter course and arches up and over the left main bronchus.
Hilar anatomy is well demonstrated on contrast-enhanced CT, especially when vascular structures are traced sequentially over contiguous images. Knowledge of normal anatomy enables differentiation of vascular structures from normal or enlarged mediastinal lymph nodes, even on unenhanced scans; however, if there is any cause for doubt, intravenous contrast always clarifies the situation (see Figure 7-101).
Airways
The trachea descends through the thoracic inlet, where reduction in caliber may occur, and usually appears rounded on scans obtained in full inspiration. If scans are obtained during expiration, the membranous posterior wall of the trachea is seen to bow forward into the tracheal lumen. The wall of the trachea is only 2 mm thick, and any intramural thickening is well demonstrated on CT. Modern scanners also allow reformatting of the data in sagittal or coronal planes, thus allowing more elegant demonstration of tracheal abnormalities. The anatomy of the bronchial tree can be traced from the tracheal carina out into the lungs, at least to the segmental level, with excellent correlation between CT and bronchoscopic findings. Furthermore, the three-dimensional dataset acquired on modern spiral scanners can be manipulated to provide a computer simulation of the bronchoscopic appearances (see Figure 7-7, D).
Lymph Nodes
Numerous lymph nodes occur within the mediastinum, usually less than 1 cm in long axis and discrete; they may not be visible on CT scanning. Previous granulomatous disease may result in extensive mediastinal lymph node calcification, which reveals the true extent of normal mediastinal lymph node distribution (Figure 7-102). An extensive chain of lymph nodes also accompanies the internal mammary vessels bilaterally. Additional nodes are present in the intercostal chain adjacent to the heads of the ribs in a posterior, paraspinal position and alongside the esophagus and descending thoracic aorta. These merge with the retrocrural lymph node chain and the paraaortic nodes in the abdomen.
Computed Tomographic Evaluation of Mediastinal Masses
The differential diagnosis of a mediastinal mass is wide in scope. Masses can arise from any of the normal structures in the mediastinum, as well as from metastatic disease from a distant primary tumor. In addition, mediastinal abscesses also may manifest as a mass. The diagnosis is considerably narrowed by CT, which enables the organ of origin of the mass to be assessed, defines the attenuation and enhancement characteristics, and detects evidence of invasion of adjacent structures. It is usual to classify mediastinal masses according to the anatomic portion of the mediastinum from which they appear to arise (Figure 7-103).
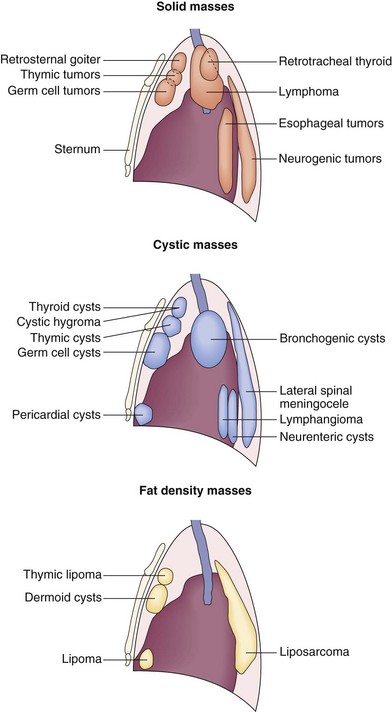
Figure 7-103 Distribution and classification of mediastinal masses depending on density derived from computed tomography scan.
Superior Mediastinal Masses
Thyroid
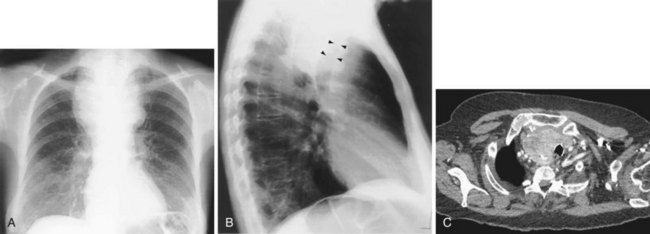
An enlarged thyroid may extend inferiorly into the superior mediastinum and may be large enough to reach into the middle mediastinum. However, this picture rarely presents a diagnostic problem, because the mass is obviously continuous with the cervical thyroid tissue and enhances avidly after intravenous contrast. Frequently, the enlarged gland contains low-density cysts and areas of calcification, particularly within cyst walls. Large thyroid masses may cause tracheal deviation or narrowing and may enlarge acutely with hemorrhage into the gland (Figure 7-104). Although the thyroid originates anterior to the trachea, extension to the right and even posterior to the trachea within the upper mediastinum may be observed.
Anterior Mediastinal Masses
Thymus
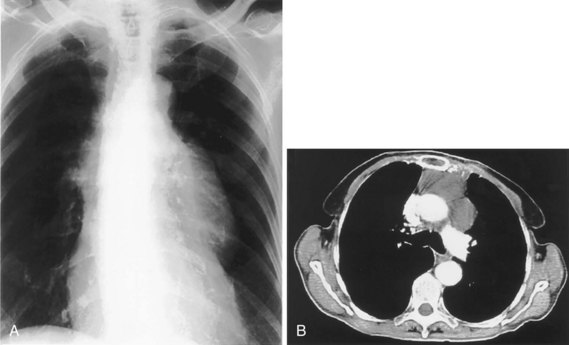
The normal thymus involutes after puberty but may show reactive enlargement in certain disease states or after chemotherapy. Intrinsic neoplasia of the thymus, however, is a relatively common cause of an anterior mediastinal mass in adult life. Causes of thymic neoplasia include thymoma, thymic carcinoma, thymic cysts (Figure 7-105), thymic lipoma, thymic carcinoid, and thymic lymphoma. With CT, fat or fluid elements may be identified within a thymic mass, and invasion of adjacent structures can be shown. With the exception of thymolipoma and thymic cysts, histopathologic examination usually is required for definitive diagnosis.
Teratomas and Germ Cell Tumors
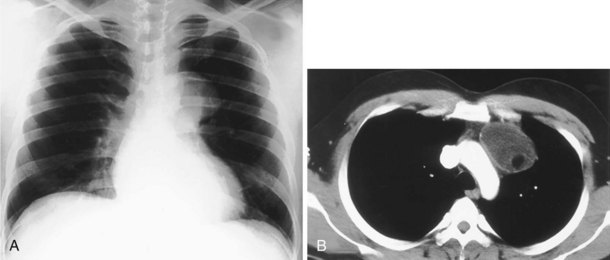
Teratomas and germ cell tumors originate from primitive stem cell rests. It is useful to separate these neoplasms into benign and malignant forms—the former is the benign cystic teratoma (synonymous with dermoid cyst). Benign cystic teratomas (Figure 7-106) may contain differentiated elements and consequently may display a variety of densities on CT, ranging from fat to calcified tissue, and even that of teeth. The malignant teratomas comprise a variety of tumors that usually arise in the testes—namely, seminomas, teratocarcinoma, embryonal carcinoma, yolk sac tumors, and choriocarcinoma. Some mediastinal germ cell tumors may be secondary to a primary tumor arising within the gonads. Malignant germ cell tumors usually are found in young men, secrete tumor markers, and are chemosensitive.
Posterior Mediastinal Masses
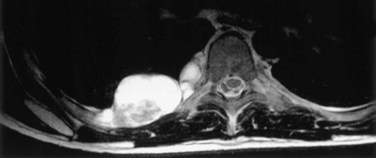
The posterior mediastinum contains neural elements, which give rise to a range of benign and malignant neural tumors. These may attain considerable size by the time of clinical presentation, and modeling abnormalities may occur in the adjacent ribs and spine, which provide a clue to their chronicity. On CT scanning, they typically are paraspinal in location and of soft tissue density, with patchy calcification. Also, CT may show the typical dumbbell extension of a neurofibroma, from an extraspinal position through an intervertebral foramen. In the assessment of neurogenic tumors, MRI has a distinct advantage over CT in that it can definitively confirm or exclude tumor extension into the spinal canal (Figure 7-107).
Interpretation of High-Resolution Computed Tomography Scans of the Lungs
Appearance of Normal Lung Anatomy
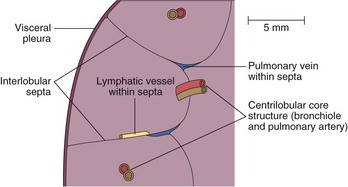
In normal persons, HRCT shows a clear and definite interface between the bronchovascular bundle and surrounding lung. Any thickening of the connective tissue interstitium results in apparent bronchial wall thickening and blurring of this interface. The size of the smallest subsegmental bronchi visible on HRCT scans is determined by the thickness of the bronchial wall, rather than by the bronchial diameter. In general, bronchi with a diameter less than 3 mm and walls less than 300 mm thick are not consistently identifiable on HRCT scans. Airways reach this critical size at approximately 2 to 3 cm from the pleural surface. The secondary pulmonary lobule is the smallest anatomic unit of the lung that is surrounded by a connective tissue septum (Figure 7-108). Within the septa lie lymphatic vessels and venules. The lobule contains between 5 and 12 acini, which each measure approximately 6 to 10 mm in diameter. Each lobule is approximately 2 cm in diameter and polyhedral in shape and often resembles a truncated cone. In the lung periphery, the bases of the cone-shaped lobules lie on a visceral pleural surface. In the central parts of the lung, the interlobular septa and thus the lobules are less well developed. The centrilobular bronchiole and accompanying pulmonary artery enter through the apex of the lobule.
Patterns of Parenchymal Disease
Reticular Pattern
Because the various parts of the lung interstitium are in continuity, widespread interstitial disease that causes interlobular septal thickening also results in bronchovascular interstitial thickening (e.g., by lymphangitis carcinomatosa). The bronchovascular thickening seen on HRCT is equivalent to the peribronchial “cuffing” seen around bronchi in end-on views on chest radiography. The HRCT finding of peribronchovascular thickening in isolation must be interpreted with caution, because it may be seen in reversible pure airway disease, for example, asthma. With thickening of the subsegmental and segmental bronchovascular bundles caused by lymphangitis carcinomatosa, for example, the interface between the thickened bronchial wall and surrounding lung sometimes has a “feathery” appearance (Figure 7-109).
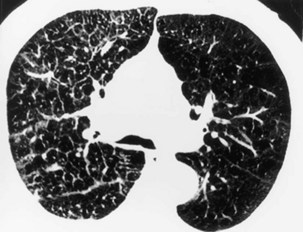
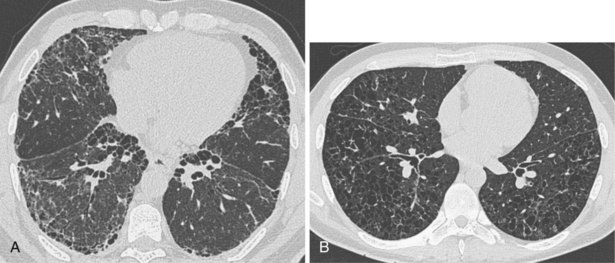
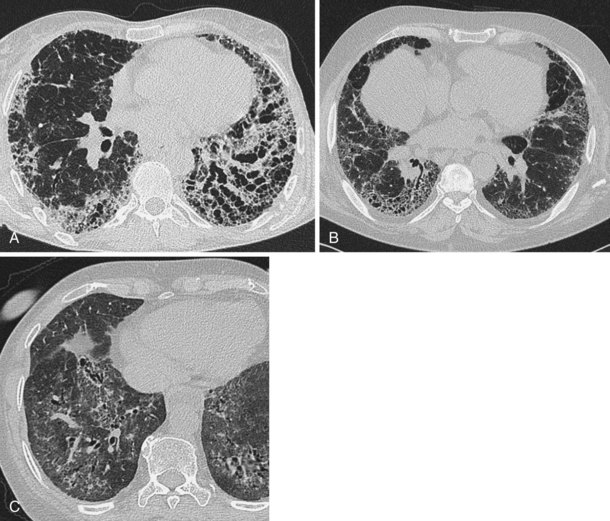
Extensive pulmonary fibrosis causes complete destruction of the architecture of the secondary pulmonary lobules, which results in a coarse reticular pattern made up of irregular, linear opacities. The reticular pattern of end-stage fibrotic or honeycomb lung mirrors the appearance on chest radiographs and is characterized by cystic spaces that measure a few millimeters to several centimeters across and are surrounded by discernible walls (Figure 7-110). Paradoxically, thickened interlobular septa are not an obvious feature of advanced fibrosing alveolitis, probably because of the severe disturbance of the normal lung architecture. The distortion that accompanies interstitial fibrosis may result in irregular dilatation of the segmental and subsegmental bronchi without honeycomb change, a phenomenon termed traction bronchiectasis (see Figure 7-110).
Nodular Pattern
A nodular pattern on HRCT consists of innumerable, small, discrete opacities that range in diameter from 1 to 10 mm and is a feature of both interstitial and air space diseases. The location of nodules in relation to the lobules and bronchovascular bundles, as well as their density, clarity of outline, and uniformity of size, may indicate whether the nodules lie predominantly within the interstitium or air spaces. Because most diffuse lung pathoses have both interstitial and air space components, this distinction does not always aid in the diagnosis. Whether pulmonary nodules can be detected on CT depends on their size, profusion, and density and on the scanning technique. Narrow-collimation HRCT clearly is superior to conventional CT for the detection of micronodular disease because it is associated with less partial volume effect, which can average out the attenuation of tiny nodules. A further refinement is the use of maximum-intensity projection images obtained with spiral CT to detect extremely subtle micronodular disease. Nodules within the lung interstitium are seen in the interlobular septa, subpleural regions (particularly in relation to the fissures), and in a peribronchovascular distribution. Nodular thickening of the bronchovascular interstitium results in an irregular interface between the margins of the bronchovascular bundles and the surrounding lung parenchyma. These features are most pronounced in cases of sarcoidosis, in which coalescent, perilymphatic granulomas cause a beaded appearance of the thickened bronchovascular bundles. The bronchovascular distribution of nodules, in conjunction with a perihilar concentration of disease, is virtually pathognomonic for sarcoidosis (Figure 7-111).
When the air spaces are filled, or partially filled, with exudate, individual acini may become visible as poorly defined nodules approximately 8 mm in diameter. Acinar nodules may merge with areas of ground glass opacification and sometimes are seen around the periphery of areas of dense parenchymal consolidation (Figure 7-112). Such nodules usually are centrilobular, although this localization may be difficult to appreciate if the nodules are very profuse. Conditions in which this nonspecific pattern is seen include organizing pneumonia, hypersensitivity pneumonitis (Figure 7-113), endobronchial spread of tuberculosis, idiopathic pulmonary hemorrhage, and some cases of bronchoalveolar cell carcinoma.
Increased Lung Density
An amorphous increase in lung density on HRCT often is described as a ground glass opacification appearance (Figure 7-114). Unlike the equivalent abnormality on chest radiography, in which the pulmonary vessels often are indistinct, a ground glass pattern on HRCT does not obscure the pulmonary vasculature. In cases in which the presence of a ground glass pattern is equivocal, HRCT often is useful to compare the density of the lung parenchyma with air in the bronchi—in the normal state, the difference in density is marginal. Although this HRCT abnormality usually is easily recognizable, particularly when it is interspersed with areas of normal lung parenchyma, subtle degrees of increased parenchymal opacification may not be obvious. It is important to recognize that a normal increase in parenchymal density, indistinguishable from a generalized opacification caused by infiltrative lung disease, results in a ground glass pattern in patients who breath-hold at end expiration.
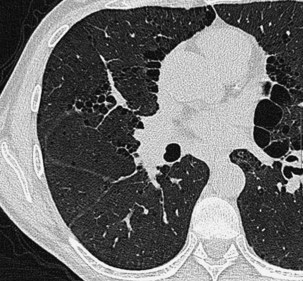
On a pathologic level, the changes responsible for ground glass opacification are complex and include partial filling of the air spaces and thickening of the interstitium, or a combination of the two (Figure 7-115). Conditions that are characterized by these pathologic changes and result in the nonspecific pattern of ground glass opacification include fibrosing alveolitis in the active cellular phase, Pneumocystis pneumonia, subacute hypersensitivity pneumonitis, sarcoidosis, drug-induced lung damage, diffuse pulmonary hemorrhage, and acute lung injury. The amorphous ground glass density seen on HRCT in these conditions usually represents a potentially reversible process. However, mild thickening of the intralobular interstitium by irreversible fibrosis may rarely produce a ground glass appearance in fibrosing alveolitis. Furthermore, ground glass opacification may be seen in areas of bronchoalveolar cell carcinoma, usually in conjunction with patches of denser, consolidated lung (Figure 7-116).
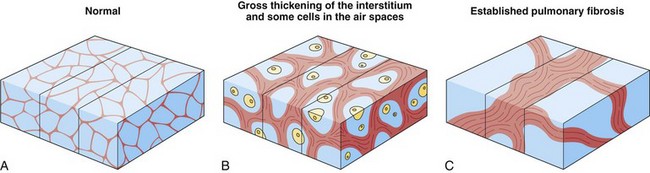
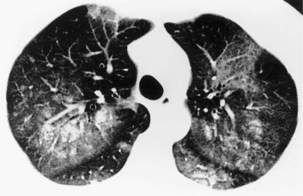
Figure 7-116 Patchy areas of ground glass opacification in a patient with biopsy-proven bronchoalveolar cell carcinoma.
A pitfall in identifying a ground glass pattern on HRCT occurs when regional differences in pulmonary perfusion are present—regional alterations in pulmonary blood flow, caused by thromboembolism, for example, may result in striking differences in lung density (Figure 7-117). The density difference between the underperfused lung and normal lung may give the appearance of a ground glass density in normal (but relatively overperfused) lung parenchyma. These areas of different density have often been termed mosaic oligemia. A similar appearance is seen in patients who have patchy air trapping caused by small airway disease, such as in an obliterative bronchiolitis: The relatively transradiant areas of underventilated and thus underperfused lung make the normal lung parenchyma appear more than usually dense and thus simulate a ground glass infiltrate. This potential pitfall often can be recognized for what it is by the relative paucity of vessels in the underventilated parts of the lungs caused by hypoxic vasoconstriction. The vessels in the relatively normal lung of higher density are engorged because of shunting of blood to these regions (see Figure 7-117).
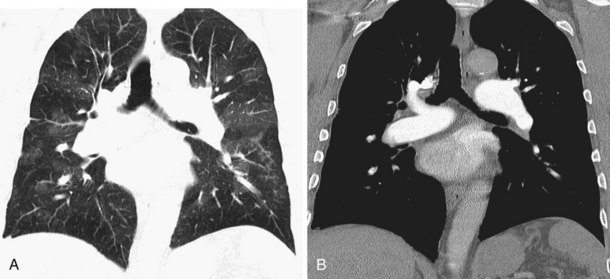
Cystic Air Spaces
The term cystic air space describes a clearly defined, air-containing space that has a definable wall 1 to 3 mm thick. Many conditions are characterized by a profusion of cystic air spaces, which may not be recognizable as such on chest radiography (Figure 7-118), whereas the size and distribution of these cysts on HRCT may suggest the diagnosis.
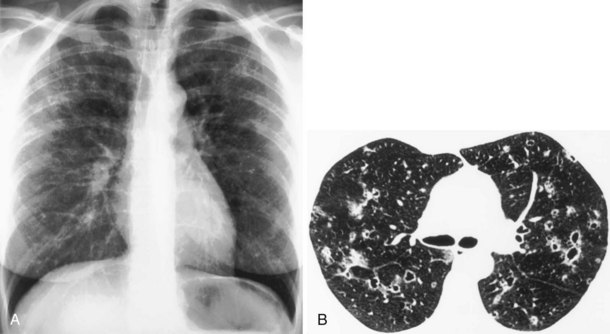
The destruction of alveolar walls that characterizes emphysema produces areas of low attenuation on HRCT, which often merge imperceptibly with normal lung (Figure 7-119). In patients who have predominantly centrilobular emphysema, circular areas of lung destruction may resemble cysts; however, the centrilobular core usually is visible as a dotlike structure in the center of the apparent cyst. Although bullae of varying sizes are clearly seen on HRCT in patients who have emphysema, usually a background permeative, destructive parenchyma prevents confusion with other conditions in which cystic air spaces are a prominent feature.
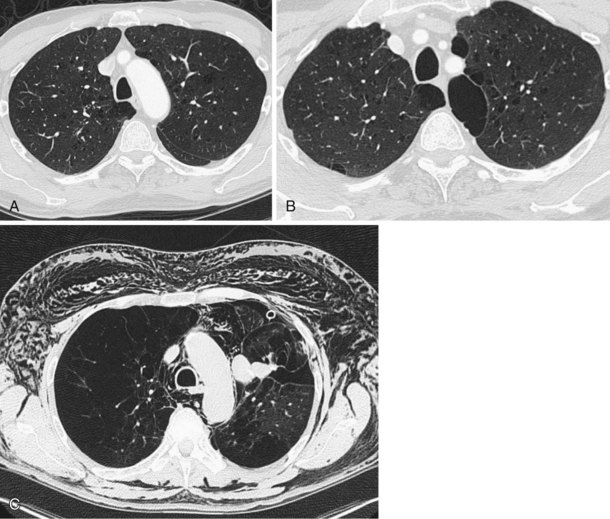
Cystic air spaces as the dominant abnormality are seen in only a few conditions, which include lymphangioleiomyomatosis, Langerhans cell histiocytosis, end-stage fibrosing alveolitis, and postinfective pneumatoceles. In lymphangioleiomyomatosis, the cysts usually are uniformly scattered throughout the lungs, with normal lung parenchyma intervening; the individual cysts rarely are larger than 4 cm in diameter (Figure 7-120). As the disease progresses, the larger cystic air spaces coalesce; the circumferential, well-defined walls of the cysts become disrupted; and the HRCT pattern in advanced lymphangioleiomyomatosis, and indeed in Langerhans cell histiocytosis, may be practically indistinguishable from that in severe centrilobular emphysema. Distinction of the delicate, “lacelike” reticular pattern of lymphangioleiomyomatosis on HRCT from that of end-stage fibrosing alveolitis usually is possible, because the cystic air spaces in a fibrotic honeycomb lung are smaller and have thicker walls. Furthermore, the tendency for fibrosing alveolitis to have a peripheral distribution, even in its end stage, usually is still obvious in the upper zones.
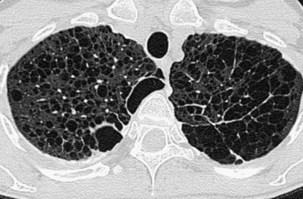
Similar, confluent cystic air spaces that give a delicate pattern on HRCT are seen in images obtained in patients who have advanced Langerhans cell histiocytosis. Earlier in the disease, however, a nodular component is present, and some of the nodules cavitate. The combination of cavitating nodules, some of which have curious shapes (e.g., cloverleaf shape), and cystic air spaces with a predominantly upper zone distribution is virtually pathognomonic for this diagnosis (see Figure 7-118). Serial HRCT scans show the natural history of nodules, which cavitate, become cystic air spaces, and, in end-stage disease, coalesce. In a few cases, these pathologic changes may resolve, with the lung parenchyma reverting to a normal appearance. Some of the cavitating nodules in Langerhans cell histiocytosis superficially resemble bronchiectatic airways, but a lack of continuity between these lesions will be observed on adjacent sections, and the segmental bronchi, when they can be identified, do not have any of the HRCT features of bronchiectasis.
Diseases of the Airways
Now that bronchography is rarely performed, the imaging modality of choice to diagnose bronchiectasis is HRCT. Bronchiectasis is defined as damage to the bronchial wall that results in irreversible dilatation of the bronchi, whatever the cause. Thus, the main feature of bronchiectasis on HRCT is dilatation of the bronchi with or without bronchial wall thickening. Criteria for the HRCT identification of abnormally dilated bronchi depend on the orientation of the bronchi in relation to the plane of the HRCT section (Figure 7-121).
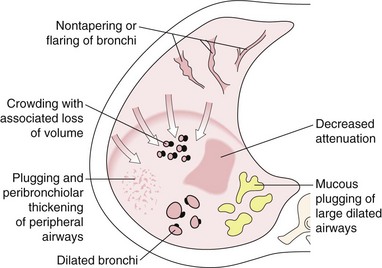
Vertically oriented bronchi are seen in transverse section, so reference can be made to the accompanying pulmonary artery, which in normal persons is of approximately the same caliber; any dilatation of the bronchus results in the so-called signet ring sign (Figure 7-122). Although this generally constitutes reliable evidence of abnormal bronchial dilatation, care must be taken in comparing the diameter of the bronchi and adjacent pulmonary arteries just below the division of the lower lobe bronchus. At this level, pairs of segmental and sometimes subsegmental bronchi converge, and the resulting fusion of the two bronchi may give the spurious impression of an abnormally dilated bronchus. Bronchi that have a more horizontal course on CT scans, particularly the anterior segmental bronchi of the upper lobes and the segmental bronchi of the lingula and right middle lobe, are demonstrated along their length, and abnormal dilatation is seen as nontapering parallel walls or even flaring of the bronchi as they course distally (Figure 7-123). In more severe cases of bronchiectasis, the bronchi are obviously dilated and have a varicose or cystic appearance.
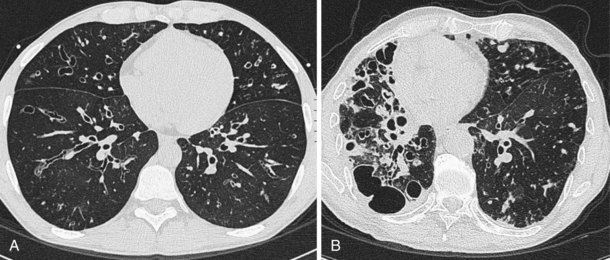
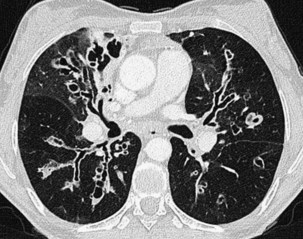
Bronchial wall thickening is a frequent but not invariable feature of bronchiectasis. The definition of what constitutes abnormal bronchial wall thickening remains contentious, particularly because mild degrees of wall thickening are seen in normal subjects, asymptomatic smokers, asthmatic individuals, and patients affected by an acute, lower respiratory tract, viral infection. In brief, no robust and reproducible criterion for the identification of abnormal bronchial wall thickening has been identified, so bronchial wall thickening remains a subjective sign with an attendant high variation in observer interpretation. However, it is the presence of peribronchial thickening that renders the smaller peripheral airways visible on HRCT. Although there is no exact level beyond which visualization of the bronchi can be regarded as abnormal on HRCT, normal bronchi should not be visible within 2 to 3 cm of the pleural surface. Large elliptical and circular opacities, which represent secretion-filled, dilated bronchi, constitute a sign of gross bronchiectasis and are almost invariably seen in the presence of other obviously dilated bronchi, some of which may contain air-fluid levels (Figure 7-124). When mucous plugging of the smaller airways occurs, minute branching structures or dots in the lung periphery may be identifiable. In some cases, plugging of the numerous centrilobular bronchioles gives a curious nodular appearance to the lungs (Figure 7-125).
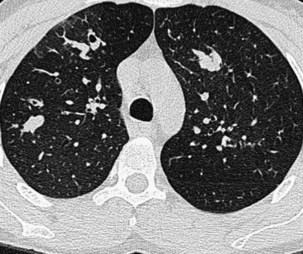
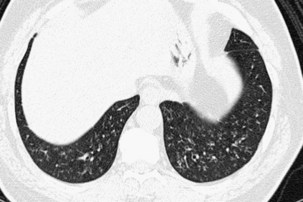
A positive diagnosis of bronchiectasis on HRCT is straightforward in patients who have moderate and severe disease. In some situations, however, subtle signs of bronchiectasis may be obscured by technical artifacts. Conversely, the HRCT appearance of bronchiectasis may be mimicked by other lung pathoses. Some of the causes of false-negative and false-positive diagnoses of bronchiectasis are listed in Table 7-2.
Table 7-2 Causes of False-Positive and False-Negative Diagnosis of Bronchiectasis on High-Resolution Computed Tomography
| False-Negative Factors | False-Positive Factors |
|---|---|
| Inappropriately thick computed tomography section | Cardiac pulsation causing “double vessels” |
| Movement artifact obscuring lung detail | Confluence of subsegmental bronchi leading to spurious impression of bronchiectasis, at a single level (particularly in the lower lobes) |
| Focal, inconspicuous, thin-walled bronchiectasis | Cavitating nodules mimicking bronchiectasis (e.g., Langerhans cell histiocytosis) |
| Masking of bronchiectatic airways by surrounding fibrosis | Reversible dilatation of bronchi with acute pneumonic consolidation |
Hansell DM, Lynch DA, McAdams HP, Bankier AA. Imaging of diseases of the chest. St. Louis: Mosby; 2010.
Webb R, Higgins C. Thoracic imaging. Philadelphia: Lippincott Williams & Wilkins; 2010.
Muller N, Silva C. Imaging of the chest. Philadelphia: Saunders; 2008.
de Lacey G, Simon Morley S, Berman L. The chest X-ray: a survival guide. London: Saunders, 2008.
Collins J, Stern EJ. Chest radiology: the essentials. Philadelphia: Lippincott Williams & Wilkins; 2007.
Brant WE, Helms CA. Fundamentals of diagnostic radiology. Philadelphia: Lippincott Williams & Wilkins; 2007.
McLoud TC, Boiselle PM. Thoracic radiology: the requisites. St. Louis: Mosby; 2009.