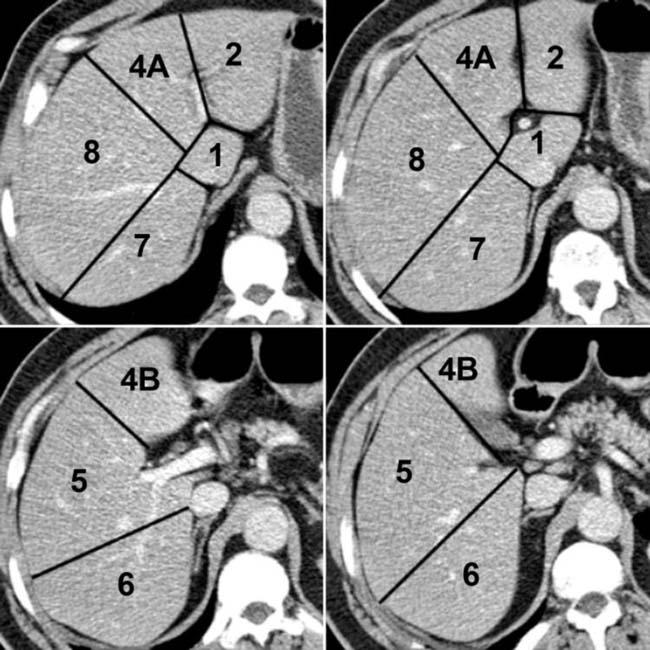
(Left) Graphic shows 4 sections that depict the 8 segments of the liver, which are separated by vertical planes through the hepatic veins and a horizontal plane through the portal vein.
(Right) The sections in this axial CECT correspond to levels in the previous graphic. The liver segments are numbered. The falciform ligament plane separates the medial (segment 4) from the lateral (segments 2 and 3) left lobe. Segment 3 is not shown.
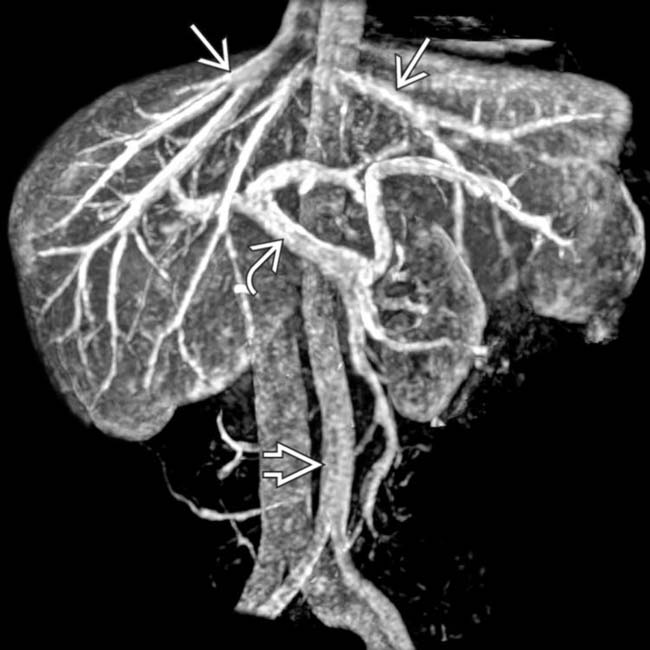
(Left) CT arteriogram shows conventional hepatic arterial anatomy. This coronal reformation shows both hepatic arteries arising from the proper hepatic artery , which in turn arises from the common hepatic artery .
(Right) MR angiogram in the venous phase shows the hepatic and portal vein branches. Some of the intravenously injected contrast medium is still circulating through the arteries, resulting in enhancement of the aorta .
(Left) In this previously healthy young woman with RUQ pain and hypotension, CECT shows a brightly enhancing mass that has ruptured, causing massive hemorrhage with a sentinel clot . This is essentially diagnostic of an hepatic adenoma.
(Right) This man with known cirrhosis presented with acute pain and hypotension. A coronal CECT image shows an encapsulated mass , ascites, and sentinel clot indicating rupture of the mass, essentially diagnostic of HCC in this setting.
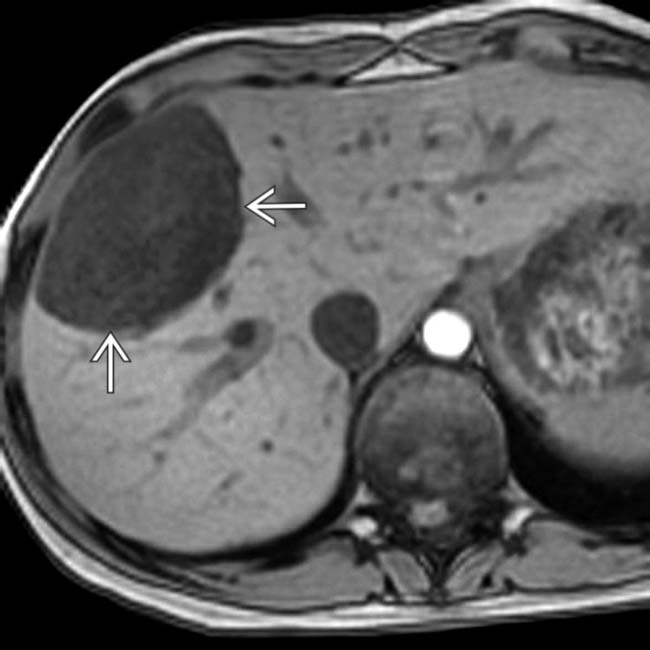
(Left) This 18-year-old girl had a hepatic mass discovered incidentally on CT. In-phase T1W MR shows a uniformly hyperintense mass with a thin capsule .
(Right) An opposed-phase T1W MR image in the same case shows signal dropout from the mass , indicating the presence of lipid within the lesion. This, along with the presence of a capsule in a young, otherwise healthy woman is essentially diagnostic of hepatic adenoma.
(Left) Axial CECT shows a geographic area of low attenuation throughout the anterior and medial segments in this patient with multifocal steatosis. In addition there are spherical and oval lesions in other segments of the liver. The hepatic vessels course through the low-density lesions without being displaced or occluded.
(Right) Axial CECT arterial phase (A) and parenchymal phase (B) show multiple THAD lesions due to portal venous branch occlusions from metastases .
(Left) Venous phase CT of a young man with a palpable epigastric mass shows the mass as a lobulated, homogeneous lesion that is slightly hyperdense to underlying liver. Considering FNH the most likely diagnosis, MR with gadoxetate (Eovist) enhancement was recommended.
(Right) 20-minute delayed phase MR image shows persistent enhancement of the mass , indicating the presence of functioning hepatocytes but disordered biliary drainage, findings considered diagnostic of FNH.
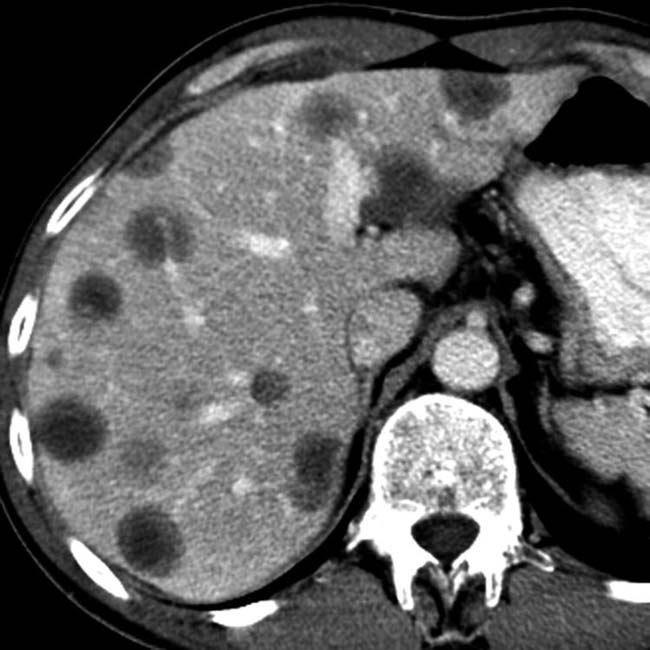
(Left) CECT shows a liver mass with innumerable septations, and slightly higher than water density contents. While a neoplastic mass could not be excluded by imaging characteristics alone, the appearance is more suggestive of infection. Needle aspiration yielded pus, and a catheter was inserted for drainage.
(Right) Arterial phase CT shows a large hypervascular pancreatic tail mass and innumerable hypervascular liver lesions , typical of metastases from a malignant neuroendocrine tumor of the pancreas.
(Left) Arterial phase CECT shows multiple foci of hypervascularity within a cirrhotic liver in this patient with classic hypervascular HCC.
(Right) Portal venous (parenchymal) phase in the same patient shows washout of enhancement , typical of hypervascular malignant hepatic tumors. Metastases could have an identical appearance but are rare within a cirrhotic liver.
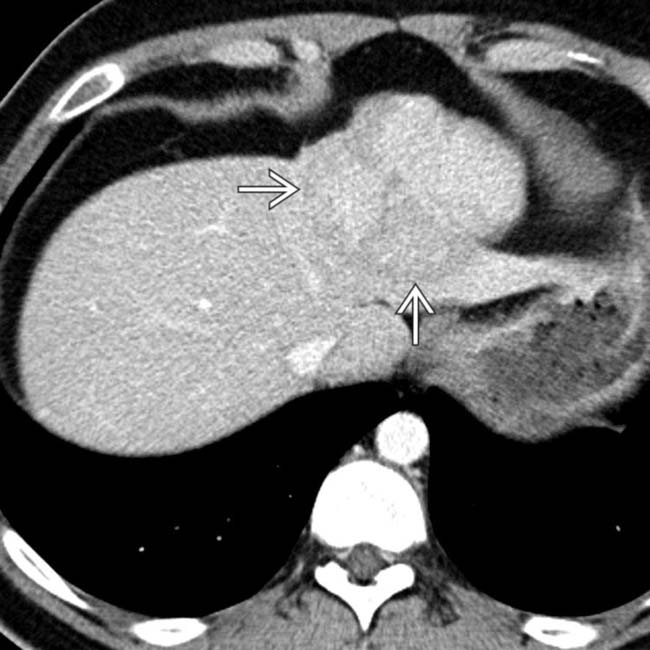
(Left) NECT shows a hypodense “mass” in the anterior and medial segments of a cirrhotic liver in a patient with focal confluent fibrosis. Note the wedge shape and overlying retraction of the hepatic capsule.
(Right) Delayed phase CT in the same patient shows that the lesion has become hyperdense to the remaining liver. While cholangiocarcinoma could have a similar appearance, the diagnosis of focal confluent fibrosis is much more likely given the clinical and radiographic evidence of alcoholic cirrhosis.
(Left) Portal venous phase CECT shows a large mass in the liver with heterogeneous enhancement, capsular retraction , and obstruction of the intrahepatic bile ducts in this patient with intrahepatic (peripheral) cholangiocarcinoma.
(Right) Delayed phase image in the same patient shows persistent hyperdense enhancement of most of the tumor . The combination of findings is essentially diagnostic of cholangiocarcinoma.
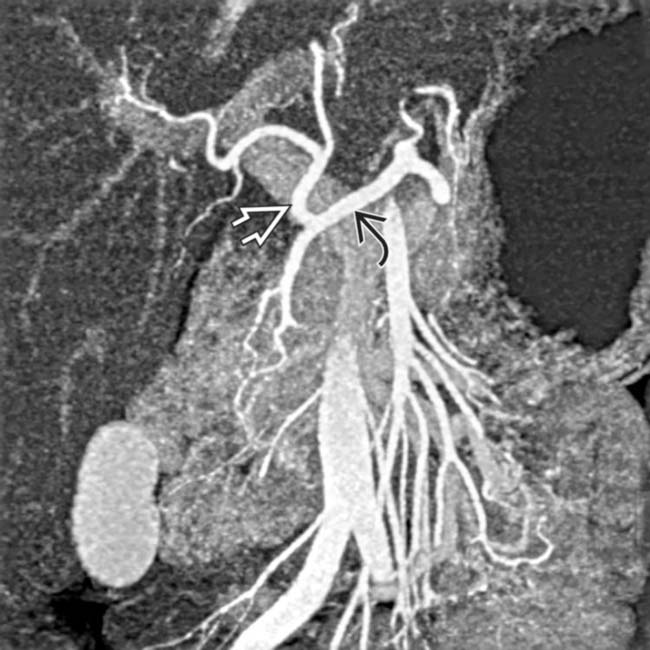
 , which in turn arises from the common hepatic artery
  .
.
 and portal vein
  branches. Some of the intravenously injected contrast medium is still circulating through the arteries, resulting in enhancement of the aorta
  .
.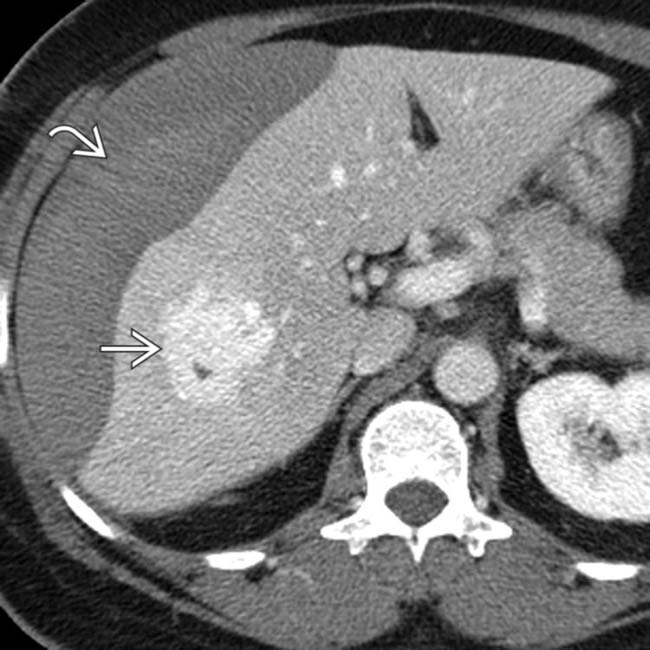
 that has ruptured, causing massive hemorrhage with a sentinel clot
  . This is essentially diagnostic of an hepatic adenoma.
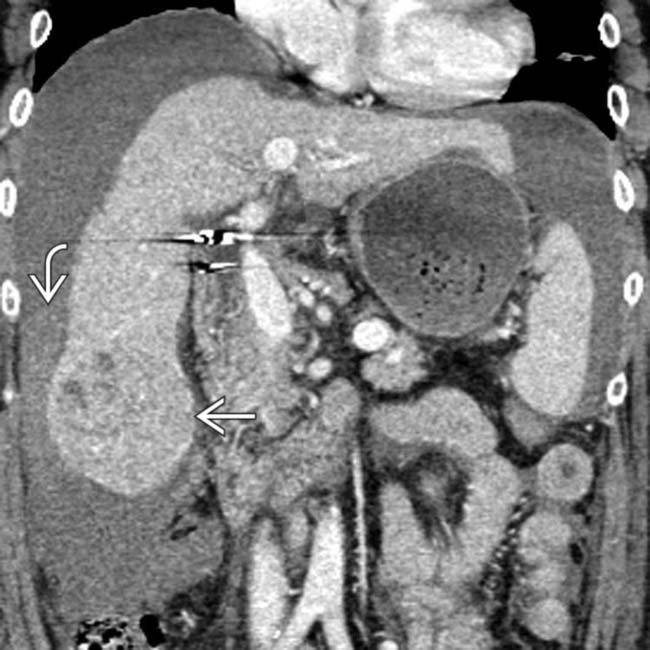
 , ascites, and sentinel clot
  indicating rupture of the mass, essentially diagnostic of HCC in this setting.
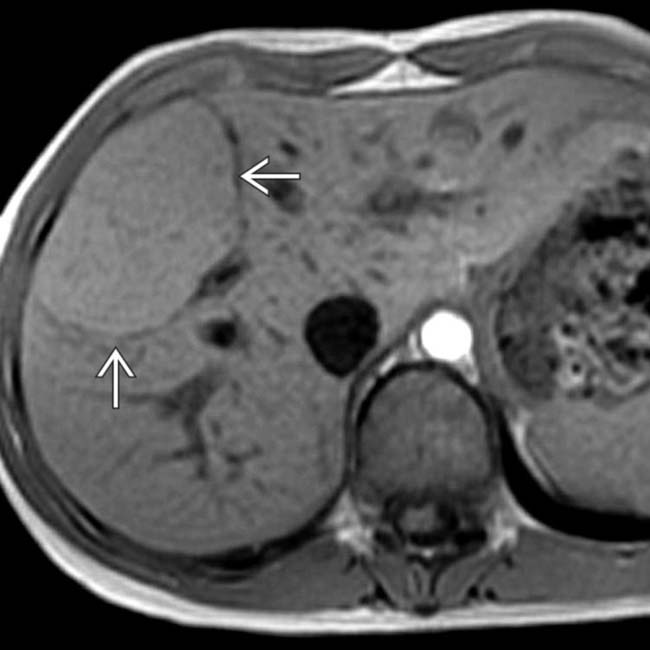
 .
.
 , indicating the presence of lipid within the lesion. This, along with the presence of a capsule in a young, otherwise healthy woman is essentially diagnostic of hepatic adenoma.
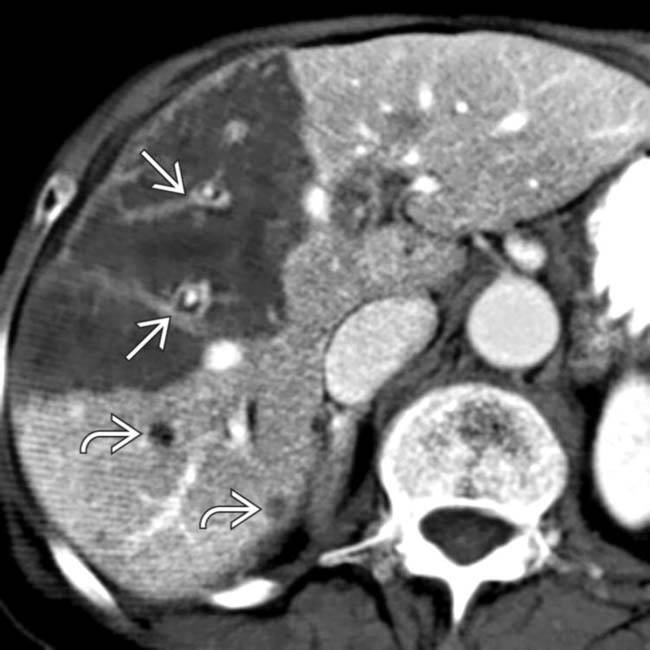
 in other segments of the liver. The hepatic vessels
  course through the low-density lesions without being displaced or occluded.
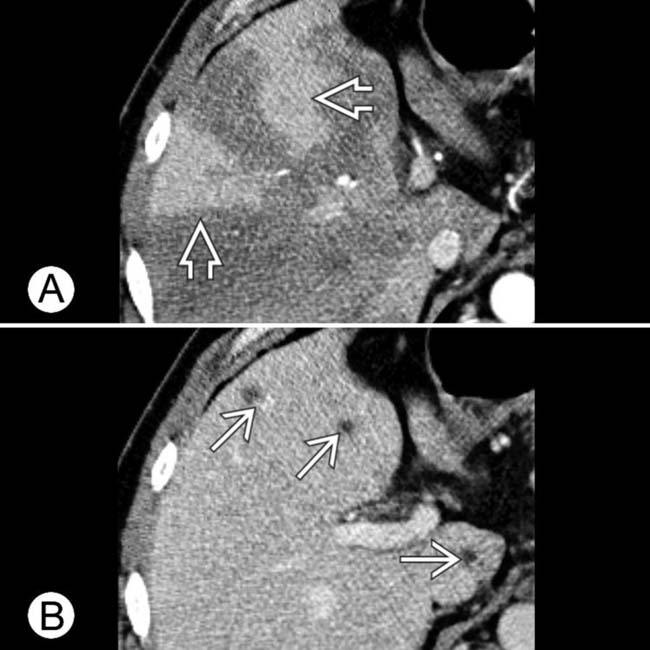
 due to portal venous branch occlusions from metastases
  .
.
 as a lobulated, homogeneous lesion that is slightly hyperdense to underlying liver. Considering FNH the most likely diagnosis, MR with gadoxetate (Eovist) enhancement was recommended.
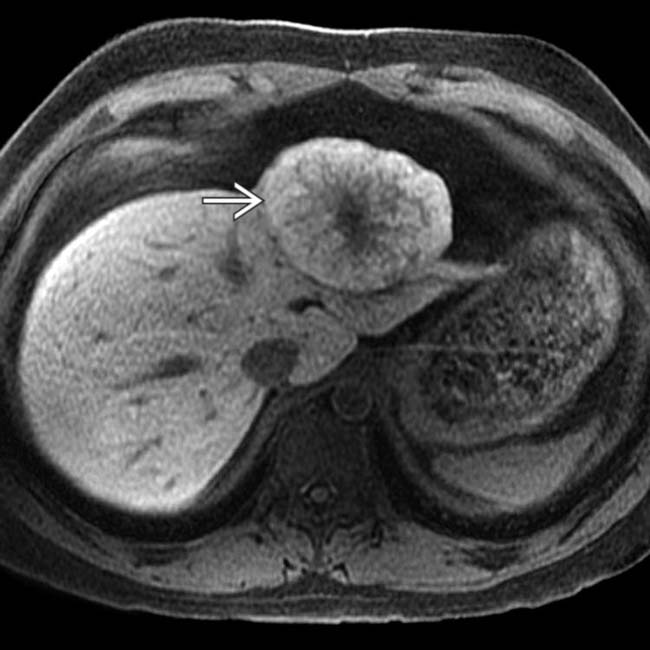
 , indicating the presence of functioning hepatocytes but disordered biliary drainage, findings considered diagnostic of FNH.
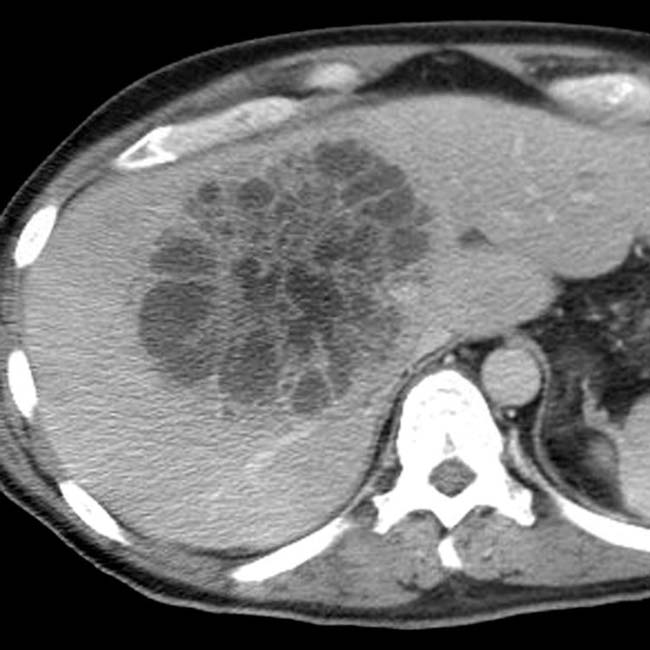
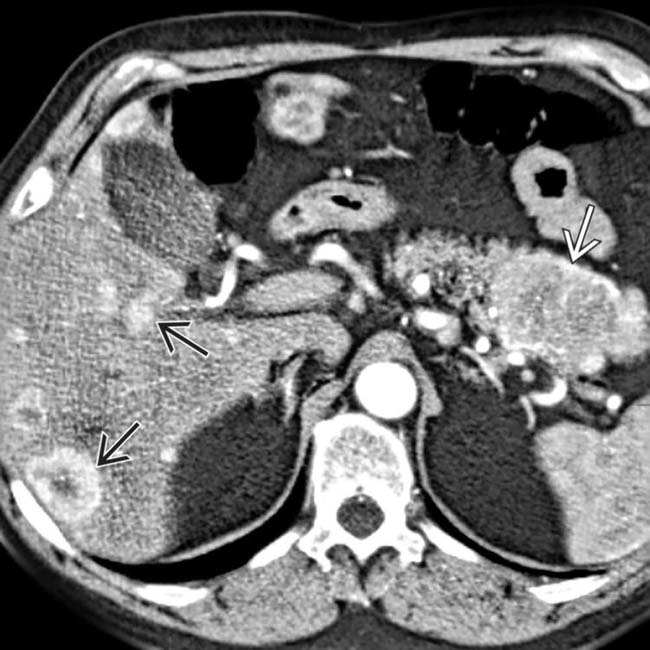
 and innumerable hypervascular liver lesions
  , typical of metastases from a malignant neuroendocrine tumor of the pancreas.
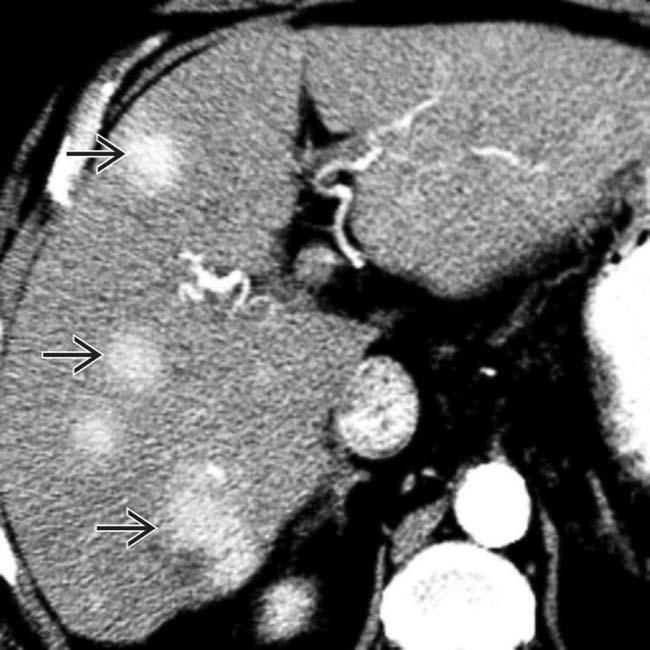
 within a cirrhotic liver in this patient with classic hypervascular HCC.
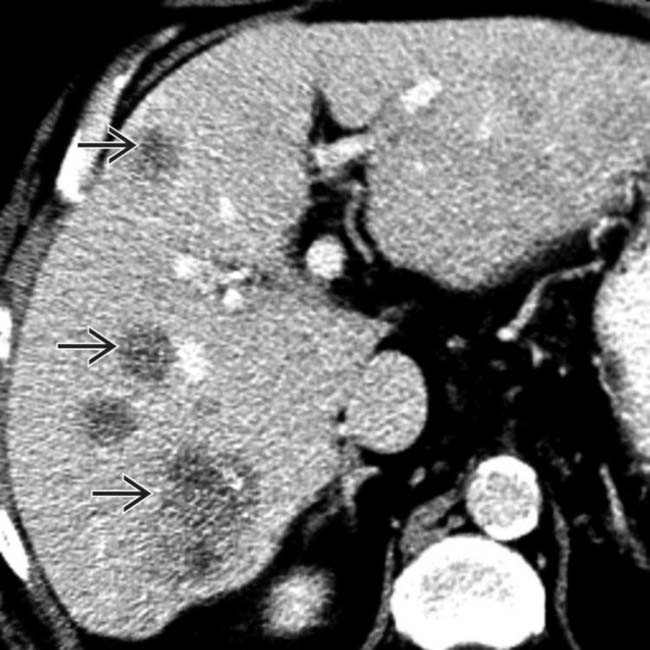
 , typical of hypervascular malignant hepatic tumors. Metastases could have an identical appearance but are rare within a cirrhotic liver.
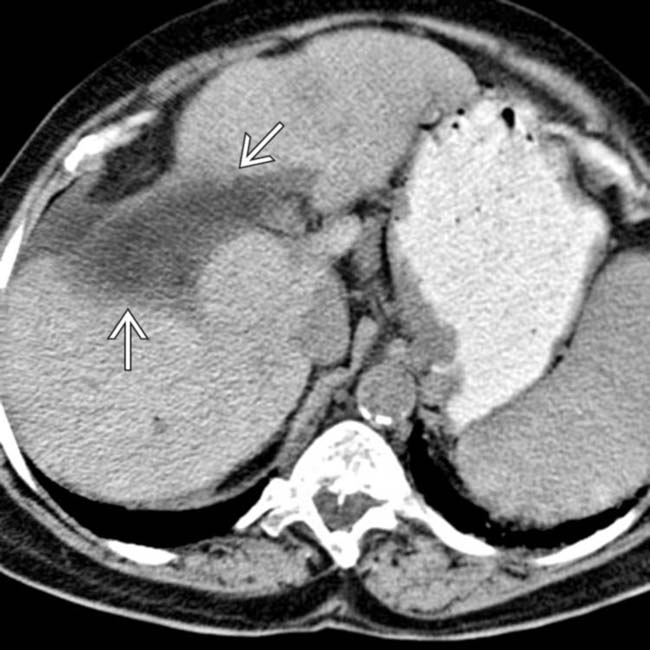
 in the anterior and medial segments of a cirrhotic liver in a patient with focal confluent fibrosis. Note the wedge shape and overlying retraction of the hepatic capsule.
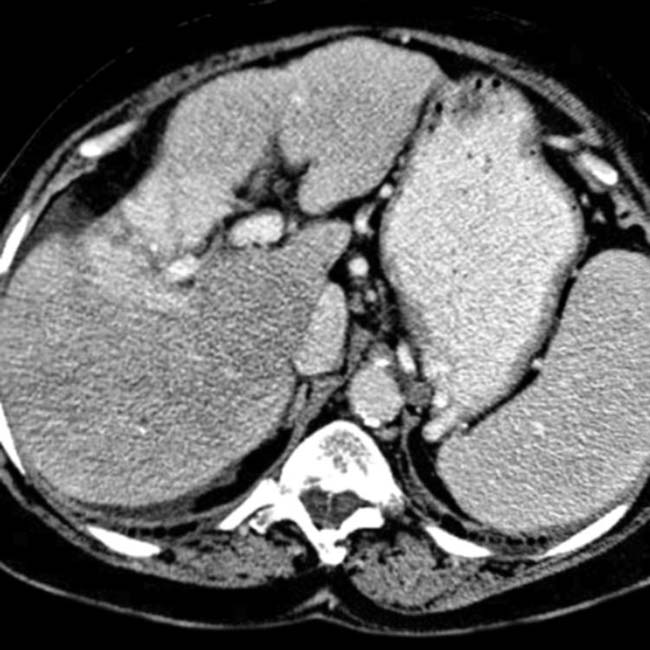
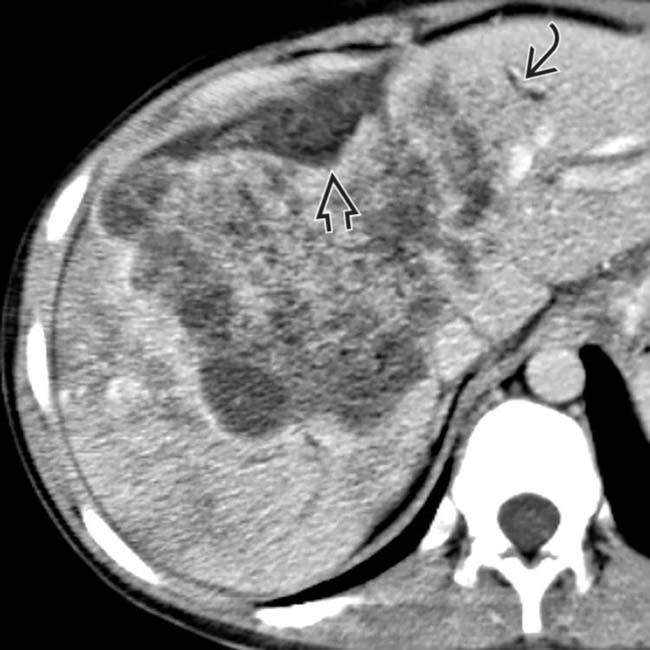
 , and obstruction of the intrahepatic bile ducts
  in this patient with intrahepatic (peripheral) cholangiocarcinoma.
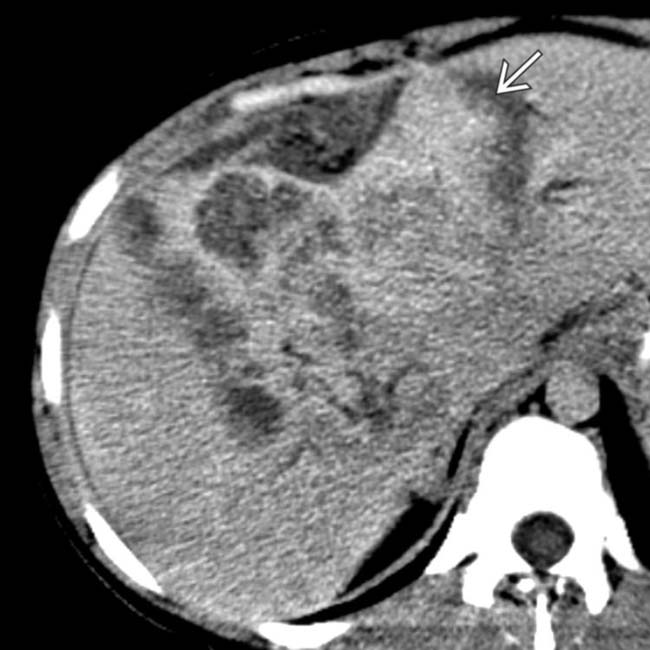
 . The combination of findings is essentially diagnostic of cholangiocarcinoma.