CHAPTER 12 Image Postprocessing in Cardiac Computed Tomography
The role of CT in the evaluation of cardiac disease is no longer the subject of possible applications, but more in the realm of determining positive and negative predictive values as cardiac CT angiography becomes a central part of cardiac imaging. Whether the application is to determine coronary artery stenosis in native vessels, to determine patency of bypass grafts or stents, or to detect anomalous anatomy, CT has been shown in many cases to be the study of choice. In the emergency department, the power of a 100% negative predictive value promises to lead to a paradigm shift in emergency department triage for patients with chest pain.1,2 Similarly, a gated CT acquisition has become the standard of care to evaluate aortic root pathology, including valvular disease, suspected dissection, Marfan syndrome, and Loeys-Dietz syndrome.3–5 Other applications, such as preoperative assessment and postoperative evaluation in congenital heart disease, are becoming a well-accepted application for CT angiography.6,7
Despite more than 400 articles on the subject and a body of literature that continues to grow, few published data have focused on the technical aspects of different processing techniques for the evaluation of the heart and coronary arteries.8–13 The “how-to” of data acquisition (16 vs. 64 vs. 128 detector scanners)14–16 is addressed in detail in the literature, as are contrast delivery techniques (test bolus vs. bolus triggering vs. timed injection),17–19 but the analysis of the resultant CT data has been the topic of only a few articles of note. This chapter provides a systematic approach to data analysis, with emphasis on how to use each postprocessing tool to its greatest advantage (Figs. 12-1 through 12-4), to interpret most accurately an isotropic multidetector CT volume of the heart.
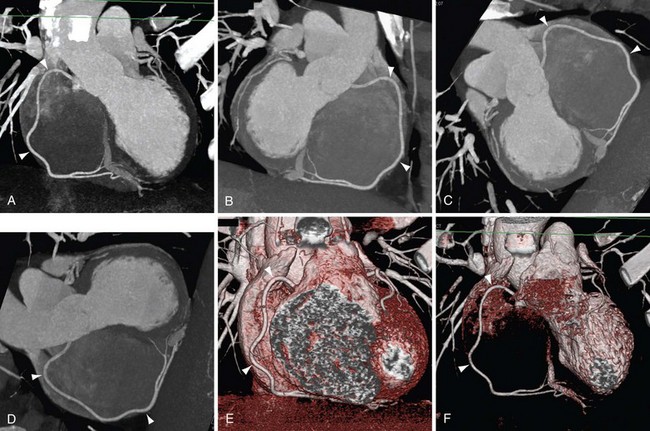
 FIGURE 12-1
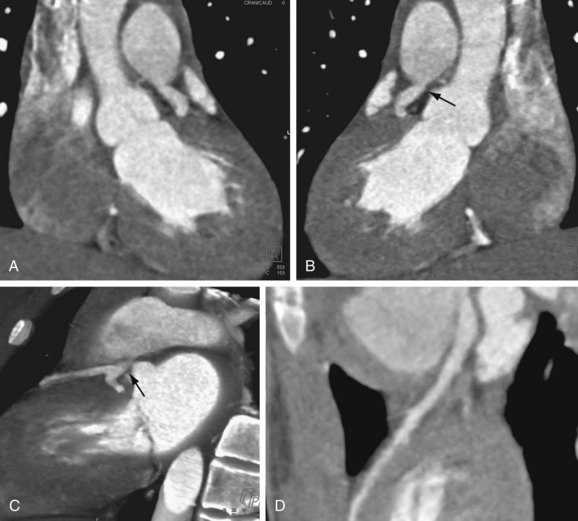
 FIGURE 12-2
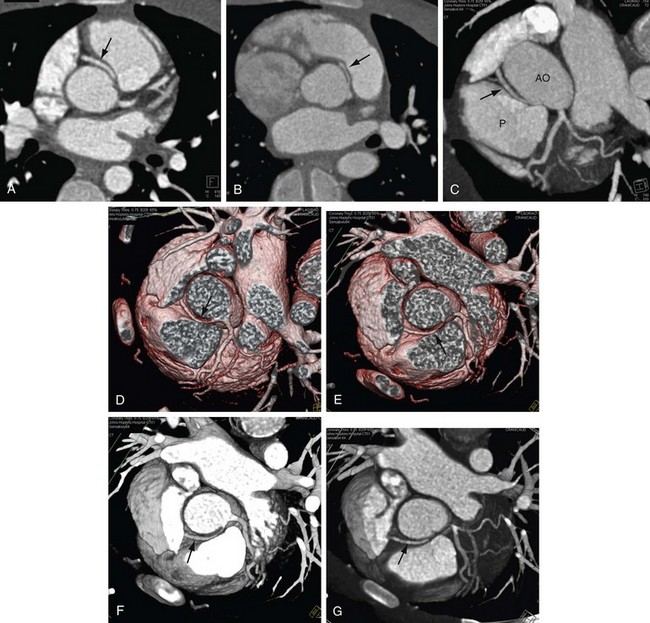
 FIGURE 12-3
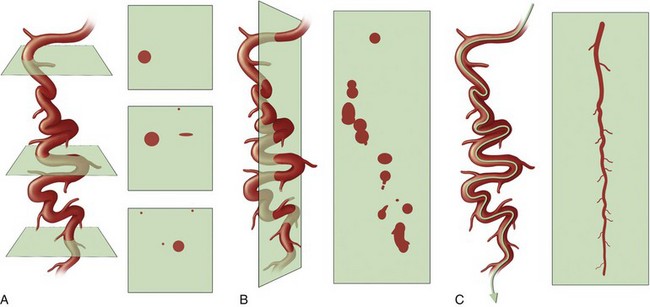
 FIGURE 12-4
TECHNICAL REQUIREMENTS
With respect to data analysis, the most comprehensive article has been by Ferencik and colleagues.11 Two important statements from this article are as follows:
TECHNIQUE
Axial Images
Although a cardiac CT scan typically is reviewed at least using multiplanar reconstruction and three-dimensional renderings, the axial images (see Fig. 12-3) remain a crucial part of the study workflow. At some sites with highly experienced interpreting physicians, interpretation is typically limited to the axial images with sparing use of additional views in selected cases. On a workstation with a composite display of axial, coronal, and sagittal images combined with a three-dimensional image, our strategy for axial images is to scroll interactively through the data set in what the scanner selects as the optimal phase (0% to 90% of R–R interval on retrospective gated study) for coronary artery visualization. We then do the following:
The limitation of axial images is that one may need to look at 200 to 350 individual slices to get through a single vessel, such as the left anterior descending coronary artery. Vessels with off-axis courses, such as the right coronary artery, are best defined when one is looking beyond the axial plane. A more global presentation of an entire coronary artery is impossible without a curved planar reconstruction (CPR) (see Fig. 12-4) or three-dimensional display.
Multiplanar Reconstruction—Coronal and Sagittal Images
The use of coronal and sagittal reconstructions is common in a range of CT applications, and in cardiac CT its role is also defined. With isotropic data, the individual cardiac chambers, aorta, and pulmonary vasculature can benefit from these displays, and they are routinely used. Whether it is for suspected aortic dissection or suspected pulmonary embolism, these displays are essential. On most workstations, the thickness of the reconstruction can be interactively adjusted (Fig. 12-5), but when slabs are reduced to beyond a few millimeters, the images become fuzzy and are of no value. This is in contrast to MIP images, where often less data may prove to be useful for these large-volume applications. One issue with coronal and sagittal reconstruction and evaluation of the coronary arteries is that because the vessels have a nonlinear pathway, only short segments can be analyzed at a time. When the left anterior descending coronary artery is analyzed with a coronal or axial display, one must constantly change the angle of the reconstruction plane to follow the vessel. Changing the angle can be done interactively, but potentially results in more room for error and less than ideal image displays. For analyzing selected segments of a vessel, this technique might be perfect. If there is a suspect area on the axial views, the coronal or sagittal view may help clarify and quantify this potential narrowing. Key points include the following:
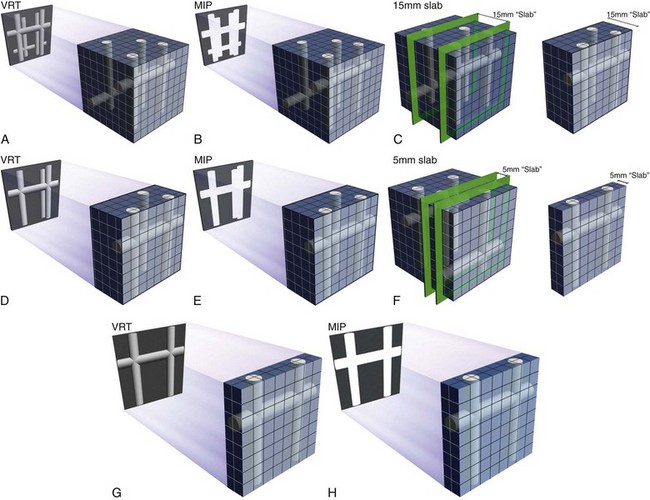
 FIGURE 12-5
Curved Planar Reconstruction
As discussed, the limitations with coronal and sagittal reconstruction largely involve the inability to track the complex courses of the coronary arteries. CPR addresses the issue directly (Fig. 12-6). CPR is best thought of as a reconstruction plane that perfectly tracks a vessel regardless of the complexity of its course or direction. In the initial versions of CPR, the user would drop multiple points through the path of a vessel, and the computer algorithm would track the points and create a vessel map. Currently, most vendors have designed software that makes the process more robust and easier to use, and requires minimal user interaction.10,12 On some workstations, there is a program that can be used for tracking the coronary vessels. One simply picks a start and an end point, and the computer automatically tracks the vessel. The vessel is laid out like a string or piece of spaghetti, and the user can rotate the plane to look at the vessel and analyze it from multiple perspectives. The vessel path is calculated as a central line through the vessel, which is also crucial in avoiding errors in analysis. The curved planar images can be viewed in classic soft tissue window or altered to be presented in MIP mode. In cases where there is a gap or stenosis in the vessel, dropping additional seed points can be done to help with vessel tracking.
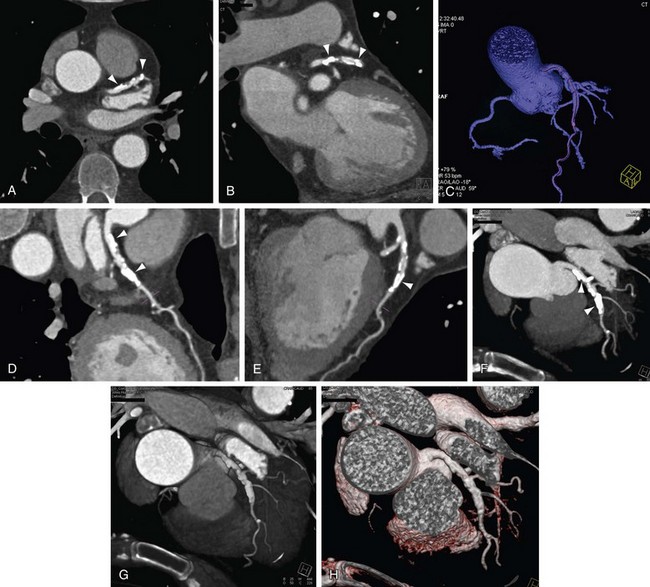
 FIGURE 12-6
We use CPR for every coronary artery CT angiography (Figs. 12-7 and 12-8). The ability to lay out a vessel without the worry of partial averaging is important not only when trying to define the presence of stenosis, but also for calculating the degree of stenosis. On some systems, the CPR also serves as the basis for the system to calculate automatically the percent stenosis present. A function that is common on all cardiac-specific software packages and many vessel analysis packages has the user pick the area of concern (usually area with greatest stenosis) and select a point of normal vessel proximal and distal to the stenosis. When selected, the system automatically calculates the percent stenosis. It is important to be careful with these programs because there are many potential sources of error, but at least they are a guide, and in the future they should be more robust. Several key points regarding CPR and some highlights and pitfalls are as follows:
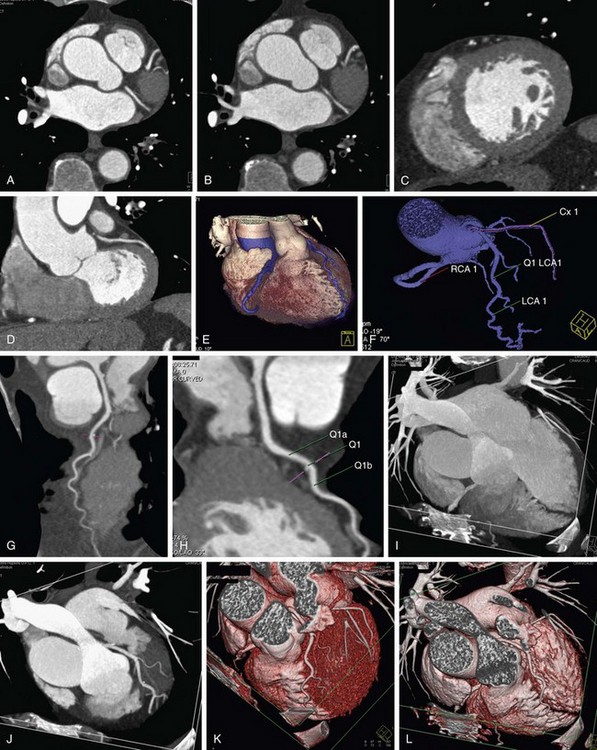
 FIGURE 12-7
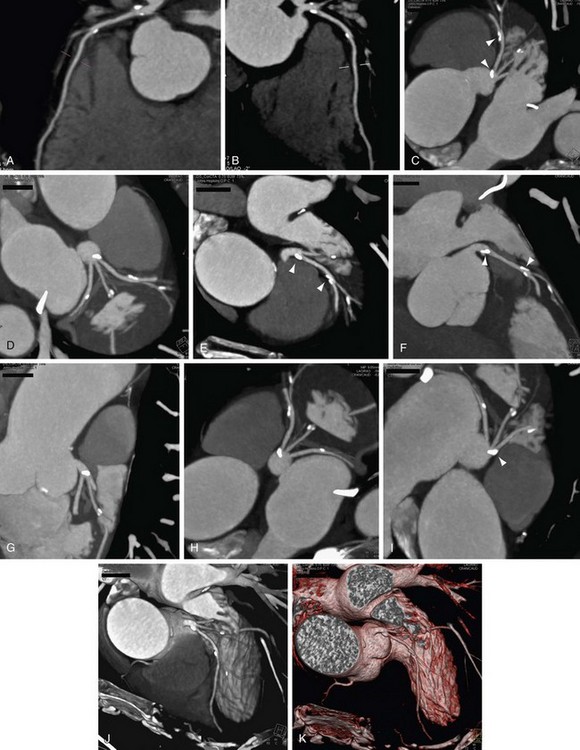
 FIGURE 12-8
Maximum Intensity Projection
In practice, MIP is usually performed with a sliding slab to look at the coronary arteries. The term sliding MIP is used to emphasize that it is done interactively at the workstation by the interpreting physician to define the best plane for vessel display. There are numerous tricks of the trade and pitfalls with MIP in general.20,22 By adjusting the MIP slab thickness (1 to 30 mm), one can interactively vary the size of the segmented volume as needed (see Fig. 12-5), but one always needs to be careful not to edit out crucial parts of the data set. The potential issues with MIP can be seen through a careful understanding of the technique itself. Some key points from a technical perspective are as follows:
In a patient without calcification, MIP can create agreeable images of long segments of the coronary arteries that superficially appear as a comprehensive display. Soft plaque is overlooked, however, unless it creates significant lumen narrowing. Rybicki and coworkers13 also noticed this issue and issued the following warning:
Volume Rendering Technique
VRT has a crucial role in evaluation of cardiac and coronary CT angiography (Fig. 12-9). The role of VRT in the analysis of these cases is based on numerous factors, including the ability of VRT to display large volumes of data accurately, especially from complex data sets. The best way to understand the crucial role of VRT is to remember several of the basics of VRT.20
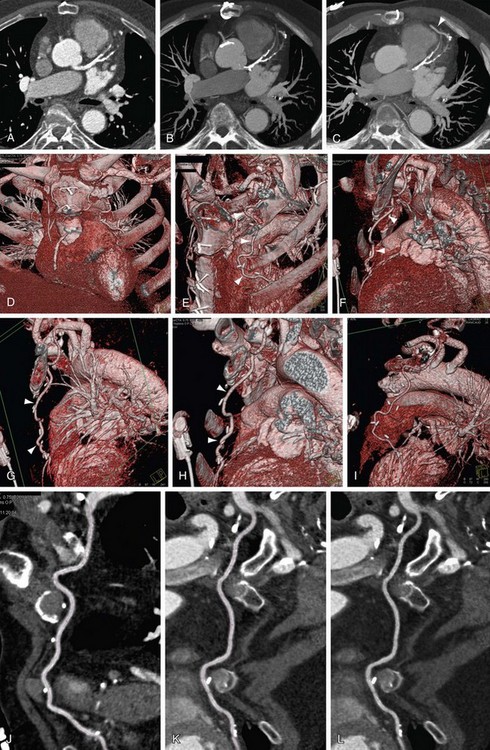
 FIGURE 12-9
CONCLUSION
KEY POINTS
 The method of data set evaluation (interactive interrogation of the volume by the interpreting physician vs. review of preset images generated by an individual not performing the interpretation) is perhaps even more important than the postprocessing tools used. Interactivity means that the interpreting physicians must process the images themselves.


Calhoun PS, Kuszyk BS, Heath DG, et al. Three-dimensional volume rendering of spiral CT data: theory and method. RadioGraphics. 1999;19:745-764.
Dalrymple NC, Prasad SR, Freckleton MW, et al. Informatics in radiology (infoRAD): introduction to the language of three-dimensional imaging with multidetector CT. RadioGraphics. 2005;25:1409-1428.
Fishman EK, Ney DR, Heath DG, et al. Volume rendering versus maximum intensity projection in CT angiography: what works best, when, and why. RadioGraphics. 2006;26:905-922.
1 Hoffmann U, Nagurney JT, Moselewski F, et al. Coronary multidetector computed tomography in the assessment of patients with acute chest pain. Circulation. 2006;114:2251-2260.
2 Rubinshtein R, Halon DA, Gaspar T, et al. Usefulness of 64-slice cardiac computed tomographic angiography for diagnosing acute coronary syndromes and predicting clinical outcome in emergency department patients with chest pain of uncertain origin. Circulation. 2007;115:1762-1768.
3 Feuchtner GM, Dichti W, Muller S, et al. 64-MDCT for diagnosis of aortic regurgitation in patients referred to CT coronary angiography. AJR Am J Roentgenol. 2008;191:W1-W7.
4 Konen E, Goitein O, Feinberg MS, et al. The role of ECG-gated MDCT in the evaluation of aortic and mitral mechanical valves: initial experience. AJR Am J Roentgenol. 2008;191:26-31.
5 Laissy JP, Messika DZ, Serfaty JM, et al. Comprehensive evaluation of preoperative patients with aortic valve stenosis: usefulness of cardiac multidetector computed tomography. Heart. 2007;93:1121-1125.
6 Leschka S, Oechslin E, Husmann L, et al. Pre- and postoperative evaluation of congenital heart disease in children and adults with 64-section CT. RadioGraphics. 2007;27:829-846.
7 Spevak PJ, Johnson PT, Fishman EK. Surgically corrected congenital heart disease: utility of 64-MDCT. AJR Am J Roentgenol. 2008;191:854-861.
8 Cademartiri F, Mollet N, Alemos PA, et al. Standard versus user-interactive assessment of significant coronary stenoses with multislice computed tomography coronary angiography. Am J Cardiol. 2004;94:1590-1593.
9 Choi JW, Seo JB, Do KH, et al. Comparison of transaxial source images and 3-plane, thin-slab maximal intensity projection images for the diagnosis of coronary artery stenosis with using ECG-gated cardiac CT. Korean J Radiol. 2006;7:20-27.
10 Cordeiro MA, Lardo AC, Brito MS, et al. CT angiography in highly calcified arteries: 2D manual vs. modified automated 3D approach to identify coronary stenoses. Int J Cardiovasc Imaging. 2006;22(3-4):507-516.
11 Ferencik M, Ropers D, Abbara S, et al. Diagnostic accuracy of image postprocessing methods for the detection of coronary artery stenoses by using multidetector CT. Radiology. 2007;243:696-702.
12 Dewey M, Schnapauff D, Laule M, et al. Multislice CT coronary angiography: evaluation of an automatic vessel detection tool. Rofo. 2004;176:478-483.
13 Rybicki FJ, Lu M, Fail P, Daniels M. Utilization of thick (>3 mm) maximum intensity projection images in coronary CTA interpretation. Emerg Radiol. 2006;13:157-159.
14 Dewey M, Hoffmann H, Hamm B. CT coronary angiography using 16 and 64 simultaneous detector rows: intraindividual comparison. Rofo. 2007;179:581-586.
15 Heffernan EJ, Dodd JD, Malone DE. Cardiac multidetector CT: technical and diagnostic evaluation with evidence-based practice techniques. Radiology. 2008;248:366-377.
16 Flohr T, Stierstorfer K, Raupach R, et al. Performance evaluation of a 64-slice CT system with z-flying focal spot. Rofo. 2004;176:1803-1810.
17 Cademartiri F, Luccichenti G, Marano R, et al. Techniques for optimisation of coronary artery opacification in non-invasive angiography with a 16-row multislice computed tomography. Radiol Med (Torino). 2004;107(1-2):24-34.
18 Cademartiri F, Nieman K, van der Lugt A, et al. Intravenous contrast material administration at 16-detector row helical CT coronary angiography: test bolus versus bolus-tracking technique. Radiology. 2004;233:817-823.
19 Bae KT. Test-bolus versus bolus-tracking technique for CT angiographic timing. Radiology. 2005;235:369-370.
20 Fishman EK, Ney DR, Heath DG, et al. Volume rendering versus maximum intensity projection in CT angiography: what works best, when, and why. RadioGraphics. 2006;26:905-922.
21 Duran C, Kantarci M, Durur S, et al. Remarkable anatomic anomalies of coronary arteries and their clinical importance: a MDCT angiographic study. J Comput Assist Tomogr. 2006;30:939-948.
22 Calhoun PS, Kuszyk BS, Heath DG, et al. Three-dimensional volume rendering of spiral CT data: theory and method. RadioGraphics. 1999;19:745-764.
