[level-membership-for-radiology-category]
7 Image manipulation
| To produce an excellent image to maximise diagnostic accuracy |
| Analogue | Represents a quantity changing in steps which are continuous, i.e. a sine wave |
| Brightness | The intensity values of the individual pixels in an image, the lower the brightness the darker the image |
| Compression | The reduction in size (in bytes) of an image to save storage space |
| Contrast | The density difference between two adjacent areas on the image |
| Digital | An image comprised of discrete areas or pixels |
| Edge Enhancement | The highlighting of a straight line or edge of an object to visually increase the sharpness of the image |
| Fourier Transform | A method of mathematically changing data, e.g. changing spatial data to frequency data |
| Frequency Data | The number of times a specific value occurs in an image |
| Heuristic | When an image is automatically improved because the program has changed due to a previous imaging experience |
| Hough Transform | A method of highlighting areas of a specific shape within an image |
| Noise | Anything that may detract from the image |
| Resolution (Sharpness) | The size of the smallest object or distance between two objects that must exist before the imaging system will record that object or objects as separate entities. |
| Segmentation | Selection of an area of interest and eliminating unwanted data. Can be done manually or automatically with an appropriate software package |
| Signal | The information required from the imaging system, e.g. the radiograph, the minimum size of the object that must be visible |
| Spatial Data | Gives the position of the varying intensities (brightness) across an image |
| Spatial Frequency | Object size, measured in line pairs per millimetre |
| Spatial Resolution | The smallest part of an image that can be seen |
| Window | The range of colour (or grey) scale values displayed on a digital image |
| An Analogue Image | |
| A Digital Image | |
| Changing an Analogue Image to a Digital Image | |
| Nyquist Theorem | States that an analogue signal waveform may be reconstructed without error from a sample which is equal to, or greater than, twice the highest frequency in the analogue signal, e.g. |
| Fourier Transform |
| Methods of manipulating the pixel values to improve or enhance the area of interest in the image | |
| Windowing | |
| Narrow Window | |
| Wide Window |
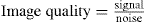
| Signal to Noise Ratio | Image quality may be defined as the signal to noise ratio:
The signal is the information required from the imaging system The noise is anything that may detract from that signal |
| Image Quality | |
| Contrast | A radiograph is the product of a transfer of information. During this transfer it is exposed to a number of different influences. Contrast helps to determine the quality of the radiograph There are three principal ‘types’ of contrast |
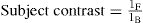
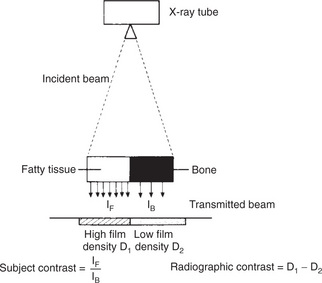
| Subject Contrast | Subject contrast (Fig. 7.2) can be defined as the ratio of the emergent intensities, i.e.:
• This is caused by differential attenuation and absorption of the X-ray beam as it passes through the patient (i.e. the subject)
• It is responsible for the differing intensities of the emergent X-ray beam, and therefore the exposures that eventually reach the film
|
| Factors Affecting Subject Contrast | |
| Different Thicknesses of the Same Tissue Type | Subject contrast is the ratio of the intensity that has passed through the thin part, compared with the thicker part The thicker of the two will: |
| Different Densities of the Same Tissue with the Same Volume but at a Higher Density | Subject contrast is the ratio of the intensity that has passed through the less dense part, compared with the denser part The higher density will: |
| Different Atomic Numbers of Different Tissues | The higher the atomic number: |
| Note At the energies used in diagnostic radiography, photoelectric absorption predominates and is the largest contributing factor to subject contrast |
|
| Radiation Quality – The kiloVoltage (kV) Set for the Exposure |
For the same subject, increasing the kV: Low kV will produce high subject contrast |
| Note The kV must be high enough to adequately penetrate the area being examined |
|
| X-ray Equipment | Factors affecting subject contrast include: |
| Scattered Radiation | Radiation fog, which increases the overall density of the image Scatter can be limited by: In general (below 150 kV), the lower the selected kV, the lower the amount of scatter and the lower the radiation fog and reduction in image latitude The use of: |
| Use of Contrast Agents | Used to fill a cavity or space in the body that usually has a low subject contrast when compared with surrounding structures Positive agents |
| Negative agents
• Carbon dioxide or air which decrease the absorption properties, with an effect on the intensity of the emergent beam
These can also be used in combination, e.g. double contrast barium meals and enemas |
|
| Radiographic Contrast | |
| Subjective Contrast |


Contrast Enhancement in Digital Imaging
| Histogram Production | For a given image, a histogram can be produced, plotting: |
| Histogram Equalisation Software | |
| Note If the intensity range of the original histogram is small the changed image will have a lot of noise |
|
| Contrast Stretching Software |
| Density Slicing or Thresholding | The separating (segmenting) of an area of interest and removing unwanted information. Works best if there is a clear peak on the histogram that can be selected |
| Image Smoothing | Neighbourhood averaging (Gaussian smoothing) |
| Median filtering | |
| Hough Transform | A method of highlighting areas of a specific shape in an image
• As curved lines are usually used, the technique is useful for highlighting specific anatomical areas
|
| Note This process does not work if the image has a lot of noise as clear edges of the object have to be identified |
|
| Unsharpness | Unsharpness on a radiograph – total image unsharpness is caused by the following three factors: |
| Movement of the Object | Calculating movement |
 |
|
| Movement Unsharpness | Movement unsharpness can be either voluntary or involuntary |
| Voluntary movement | |
| Involuntary movement | |
| Example:
Therefore unsharpness would be improved by a factor of 10 |
|
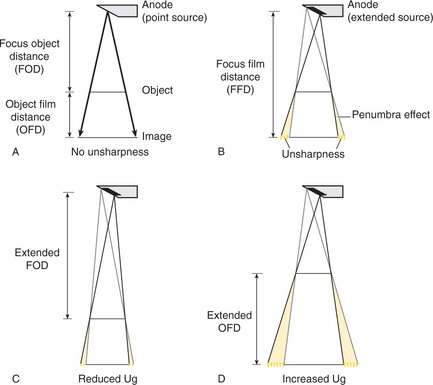
| Geometric Unsharpness | This is caused because the focal spot in the tube is not a point source
• For an extended source, each edge of the object receives a ray as if it were two separate points, causing the penumbra effect, which produces unsharpness
Note |
| To calculate geometric unsharpness: | |
| Example If the focus film distance (ffd) = 100 cm and the focus object distance (fod) = 80 cm calculate the geometric unsharpness if a 1.2 mm focal spot was used |
|
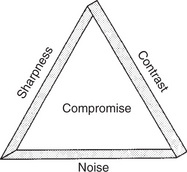
| To Produce a Sharp Image | Theoretically use:
In reality, a number of compromises must be made |
| Measurement of Resolution (Sharpness) |
• The line pair phantom is made up of strips of lead separated by an air gap equal to the width of the preceding lead strip
|
| Resolution | The size of the smallest object or distance between two objects that must exist before the imaging system will record that object or objects as separate entities. It gives no indication of how the system will record objects of larger dimensions |
| Note Definition |
|
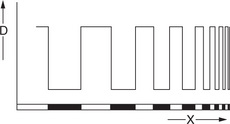
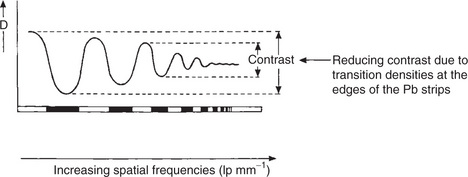
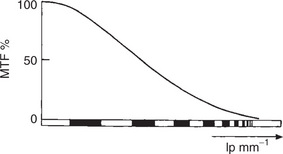
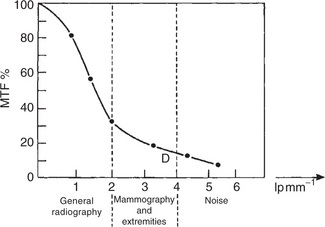
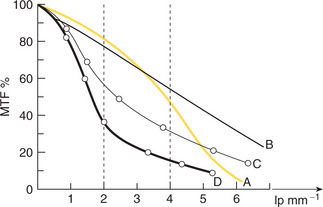
| Modulation Transfer Function (MTF) | Allows assessment of system performance at different spatial frequencies (i.e. ‘object sizes’)
• It would be expected that the differences in density of the line pair phantom would be recorded in exactly the same way as the original phantom with the sharp edges clearly delineated
• Because of transition density within the image, distinct transition edges are formed which produce a density profile when scanned with a microdensitometer
• As the frequencies get higher the contrast begins to drop rapidly and the pairs of lines become impossible to see
• Figures can be obtained for the percentage of accuracy of the transfer of the signal through the system
• Therefore the modulation, or altering, of the signal through the system is measured and the modulation transfer function (MTF) for the system is obtained
|
| Application |
• Film A appears to be most suited to a general radiographic department which requires about 2 lp mm−1
|
| Note | |


 of the focal spot size
 = 0.3 mm
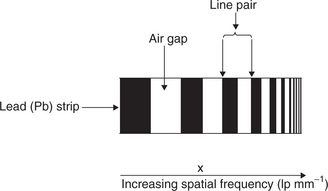
| Edge Enhancement | The use of filters to highlight the boundaries between objects |
| Application | |
| Note | |
| Frequency Domain Method |
| To Demonstrate Arterial System |


| JPEG |
[/level-membership-for-radiology-category][not-level-membership-for-radiology-category]
7 Image manipulation
| To produce an excellent image to maximise diagnostic accuracy |
| Analogue | Represents a quantity changing in steps which are continuous, i.e. a sine wave |
| Brightness | The intensity values of the individual pixels in an image, the lower the brightness the darker the image |
| Compression | The reduction in size (in bytes) of an image to save storage space |
| Contrast | The density difference between two adjacent areas on the image |
| Digital | An image comprised of discrete areas or pixels |
| Edge Enhancement | The highlighting of a straight line or edge of an object to visually increase the sharpness of the image |
| Fourier Transform | A method of mathematically changing data, e.g. changing spatial data to frequency data |
| Frequency Data | The number of times a specific value occurs in an image |
| Heuristic | When an image is automatically improved because the program has changed due to a previous imaging experience |
| Hough Transform | A method of highlighting areas of a specific shape within an image |
| Noise | Anything that may detract from the image |
| Resolution (Sharpness) | The size of the smallest object or distance between two objects that must exist before the imaging system will record that object or objects as separate entities. |
| Segmentation | Selection of an area of interest and eliminating unwanted data. Can be done manually or automatically with an appropriate software package |
| Signal | The information required from the imaging system, e.g. the radiograph, the minimum size of the object that must be visible |
| Spatial Data | Gives the position of the varying intensities (brightness) across an image |
| Spatial Frequency | Object size, measured in line pairs per millimetre |
| Spatial Resolution | The smallest part of an image that can be seen |
| Window | The range of colour (or grey) scale values displayed on a digital image |
| An Analogue Image | |
| A Digital Image | |
| Changing an Analogue Image to a Digital Image | |
| Nyquist Theorem | States that an analogue signal waveform may be reconstructed without error from a sample which is equal to, or greater than, twice the highest frequency in the analogue signal, e.g. |
| Fourier Transform |
| Methods of manipulating the pixel values to improve or enhance the area of interest in the image | |
| Windowing | |
| Narrow Window | |
| Wide Window |
| Signal to Noise Ratio | Image quality may be defined as the signal to noise ratio:
The signal is the information required from the imaging system The noise is anything that may detract from that signal |
| Image Quality | |
| Contrast | A radiograph is the product of a transfer of information. During this transfer it is exposed to a number of different influences. Contrast helps to determine the quality of the radiograph There are three principal ‘types’ of contrast |
| Subject Contrast | Subject contrast (Fig. 7.2) can be defined as the ratio of the emergent intensities, i.e.:
• This is caused by differential attenuation and absorption of the X-ray beam as it passes through the patient (i.e. the subject)
• It is responsible for the differing intensities of the emergent X-ray beam, and therefore the exposures that eventually reach the film
|
| Factors Affecting Subject Contrast | |
| Different Thicknesses of the Same Tissue Type | Subject contrast is the ratio of the intensity that has passed through the thin part, compared with the thicker part The thicker of the two will: |
| Different Densities of the Same Tissue with the Same Volume but at a Higher Density | Subject contrast is the ratio of the intensity that has passed through the less dense part, compared with the denser part The higher density will: |
| Different Atomic Numbers of Different Tissues | The higher the atomic number: |
| Note At the energies used in diagnostic radiography, photoelectric absorption predominates and is the largest contributing factor to subject contrast |
|
| Radiation Quality – The kiloVoltage (kV) Set for the Exposure |
