Chapter 176 Hypoglycemia
 Diagnostic Summary
 Introduction
Hypoglycemia is divided into two main categories: reactive hypoglycemia and fasting hypoglycemia. Reactive hypoglycemia, the most common, is characterized by the development of symptoms of hypoglycemia 3 to 5 hours after a meal and may herald the onset of early type II diabetes. Gastric surgeries may induce this condition,1 and anorexia nervosa has been a reported to be cause in the literature.2 Reactive hypoglycemia may also result from the use of oral hypoglycemic drugs. These sulfa drugs (sulfonylureas) appear to stimulate the secretion of additional insulin by the pancreas as well to as enhance the sensitivity of body tissues to insulin. Common examples of this class of drugs are listed in Box 176-1.
BOX 176-1 Oral Hypoglycemic Drugs
Some researchers, however, recommend that for many patients, this syndrome instead be designated idiopathic postprandial syndrome because, although symptoms do exist and are related to rapid drops in blood glucose, the absolute glucose levels are not reliable indicators of the syndrome. Many asymptomatic controls have glucose levels below 50, while many symptomatic patients have normal postprandial glucose levels.3–5
Fasting hypoglycemia is rare, because it usually appears only in severe disease states such as pancreatic tumors, extensive liver damage, prolonged starvation, autoantibodies against insulin or its receptor, various cancers, or as a result of excessive exogenous insulin in diabetic patients. Pregnant diabetic women using insulin or oral glycemic medications also have a high incidence of asymptomatic hypoglycemic events.6
Hypoglycemia can promote untoward physiologic changes in the body. Insulin-induced hypoglycemia is known to increase the levels of C-reactive protein, a known cardiac risk factor.7 Because glucose is the primary fuel for the brain, low levels affect the brain first. Symptoms of hypoglycemia can range from mild to severe, including the following:
 Diagnostic Considerations
Clinical hypoglycemia is identified by modified Whipple’s criteria consisting of (1) central nervous system symptoms including confusion, aberrant behavior, or coma; (2) a simultaneous blood glucose level equal to or less than 40 mg/dL; and (3) relief of these symptoms by the administration of glucose.1 The normal fasting blood glucose level is between 65 and 100 mg/dL. A fasting plasma blood glucose measurement greater than 126 mg/dL on two separate occasions is diagnostic of diabetes.8 Although the most specific criterion for the presence of hypoglycemia is a blood glucose level of 40 mg/dL or less, a blood glucose level below 50 mg/dL should arouse clinical suspicion.1
A more functional test of blood sugar control is the oral GTT. It is used in the diagnosis of both reactive hypoglycemia and diabetes, although it is rarely required for the latter. After fasting for at least 12 hours, a baseline blood glucose measurement is made. Then the subject is given a liquid containing glucose to drink. The amount consumed is based on body weight: 1.75 g/kg. Blood sugar levels are measured at 30 minutes, 1 hour, and then hourly for up to 6 hours. Basically blood sugar levels greater than 200 mg/dL indicate diabetes. Levels below 50 mg/dL indicate reactive hypoglycemia. Table 176-1 explains in detail how to interpret the results of a GTT.
TABLE 176-1 Criteria of Response to the Glucose Tolerance Test
| Diagnosis | Response |
|---|---|
| Normal | No elevation >200 mg <200 mg at the end of the first hour <140 mg at the end of the second hour Never <20 mg below fasting |
| Flat | No variation more than ± 20 mg from fasting value |
| Prediabetic | >140 mg at the end of the second hour |
| Diabetic | ≥200 mg at the end of the second hour |
| Reactive hypoglycemia | A normal 2- or 3-hour response curve, followed by a decrease of ≥20 mg from the fasting level during the final hours |
| Probable reactive hypoglycemia | A normal 2- or 3-hour response curve, followed by a decrease of 10-20 mg from the fasting level during the final hours |
| Flat hypoglycemia | An elevation of >20 mg, followed by a decrease of ≥20 mg below the fasting level |
| Prediabetic hypoglycemia | A 2-hour response identical to the hypoglycemic prediabetic response but showing a hypoglycemic response during the final 3 hours |
| Hyperinsulinism | A marked hypoglycemic response with a value of <50 mg during the third, fourth, or fifth hour |
The Glucose-Insulin Tolerance Test
Relying on blood sugar levels alone is often not enough to diagnose hypoglycemia, because it is now widely recognized that the signs and symptoms of hypoglycemia can occur in individuals having blood glucose levels well above 50 mg/dL and there is a wide overlap between symptomatic patients and asymptomatic controls.3 Many of the symptoms linked to hypoglycemia appear to be the result of increases in insulin or epinephrine. Therefore, it has been recommended that insulin or epinephrine (adrenaline) be measured during a GTT because symptoms often correlate better with elevations in these hormones than with glucose levels.9,10 Several studies have shown that the glucose-insulin tolerance test (G-ITT) leads to a greater sensitivity in the diagnosis of both hypoglycemia and diabetes than the standard GTT.10,11
The G-ITT uses a standard 6-hour GTT coupled with measurements of insulin levels. The G-ITT appears to be one of the best diagnostic indicators for faulty sugar metabolism.11 As many as two thirds of subjects with suspected diabetes or hypoglycemia who have normal GTTs will demonstrate abnormal insulin tolerance tests. Table 176-2 lists the various patterns seen with the G-ITT.
| PATTERN | RESPONSE |
|---|---|
| Pattern 1 | Normal fasting insulin 0-30 units. Peak insulin at 0.5-1 hour. The combined insulin values for the second and third hours is <60 units. This pattern is considered normal. |
| Pattern 2 | Normal fasting insulin. Peak at 0.5-1 hour with a “delayed return to normal.” Second- and third-hour levels between 60 and 100 units are usually associated with hypoglycemia and are considered borderline for diabetes; values >100 units considered definite diabetes. |
| Pattern 3 | Normal fasting insulin. Definite diabetes. |
| Pattern 4 | High fasting insulin. Definite diabetes. |
| Pattern 5 | Low insulin response. All tested values for insulin < 30. If this response is associated with elevated blood sugar levels, it probably indicates insulin-dependent diabetes (“juvenile pattern”). |
24-Hour Continuous Glucose Monitoring
Continuous glucose monitors (CGMs) are electronic diagnostic systems that require the insertion of a sensing catheter under the skin of the patient’s abdomen. The catheter contains a miniaturized electronic device that measures blood sugar and then sends this information every few seconds to a pager-sized computer module worn on the patient’s belt for up to a week. The portable computer module translates and records blood sugar data, which can then be downloaded to a larger computer. A graph showing the average blood sugar reading every 5 minutes (288 blood sugar readings per day) can then be generated and studied in relation to food intake, appetite, food cravings, hypoglycemic symptoms, medication, and exercise. CGMs have been shown to be very useful tools in the diagnosis and monitoring of blood sugar control.12,13
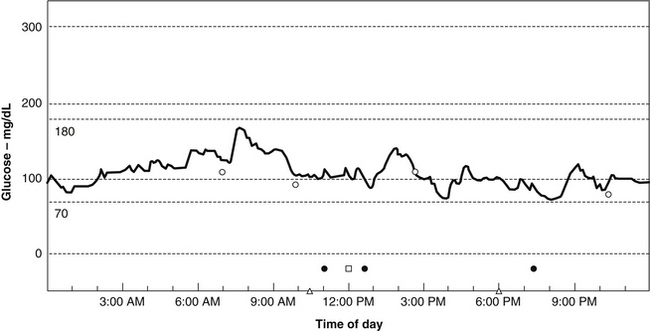
Using a CGM, Michael R. Lyon, MD, has discovered that most people with weight problems and insulin resistance go through their days with remarkably fluctuating blood sugar, or increased glycemic volatility. Rather than the absolute glucose level being the prime determinant of hypoglycemic symptoms, Lyon has found that feelings of hypoglycemia occur when the blood sugar drops rapidly, even when it was above the normal range (i.e., between 70 and 100 mg/dL) (Figure 176-1). In such cases, symptoms of hypoglycemia can range from mild to severe and include such things as food cravings, headache, depression, anxiety, irritability, blurred vision, excessive sweating, and mental confusion.
Rather than referring to these patients as suffering from hypoglycemia, Lyon and Michael T. Murray, ND, propose that they suffer from a new clinical entity they refer to as “elevated glycemic volatility.”63 These authors also believe that such volatility is at the heart of most weight problems. Their data indicate that rapidly fluctuating blood sugar levels are generally related to some degree of insulin resistance and made worse by more than moderate consumption of foods with a high glycemic impact.
The Hypoglycemia Questionnaire
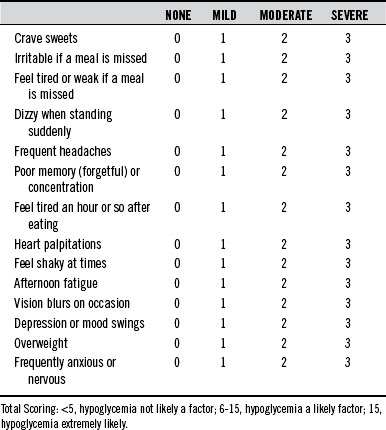
In many cases, when all is considered (especially cost to the patient), the most useful measure in the diagnosis of hypoglycemia remains an assessment of symptoms. In general, when symptoms appear 3 to 4 hours after eating and disappear with the ingestion of food, hypoglycemia should be considered. The questionnaire shown in Table 176-3 is an excellent screening method for hypoglycemia.
 General Considerations
In the 1970s, hypoglycemia was a popular “self-diagnosis” for a long list of symptoms; every symptom on the questionnaire in Table 176-3 was linked to hypoglycemia. Although all of these symptoms may be due to hypoglycemia, there are obviously other causes in many cases. The tremendous public interest in hypoglycemia and sugar intake was fueled by a number of popular books like Sugar Blues, by William Duffy; Hope for Hypoglycemia, by Broda Barnes; and Sweet and Dangerous, by John Yudkin. The popularity of these books and the diagnosis of hypoglycemia were met with much skepticism from the medical community. Editorials in the Journal of the American Medical Association and the New England Journal of Medicine during the 1970s denounced this public interest in hypoglycemia and tried to invalidate the concept.14,15
Research in the past 15 years has provided an ever-increasing amount of information concerning the roles that refined carbohydrates and the faulty control of blood sugar play in many disease processes. New terminology and descriptions are now used to describe the complex hormonal fluxes that are largely a result of ingesting too many refined carbohydrates. For example, the term metabolic syndrome or syndrome X has been introduced to describe a cluster of abnormalities that owe their existence largely to a high intake of refined carbohydrates, leading to the development of hypoglycemia, excessive insulin secretion, and glucose intolerance followed by diminished insulin sensitivity and leading to high blood pressure, elevated cholesterol levels, obesity, and, ultimately, type 2 diabetes. Metabolic syndrome is discussed in greater detail later.
Hypoglycemia, or idiopathic postprandial syndrome, is without question a valid clinical entity. A substantial amount of information indicates that hypoglycemia is caused by an excessive intake of refined carbohydrates.16,17 Although most medical and health organizations as well as the U.S. government have recommended that no more than 10% of the total caloric intake be derived from refined sugars added to foods, added sugar accounts for roughly 30% of the total calories consumed by most Americans.18 The average American consumes more than 100 lb of sucrose and 40 lb of high-fructose corn syrup each year. This sugar addiction plays a major role in the high prevalence of ill health and chronic disease in the United States.
Health Impacts of Hypoglycemia
Hypoglycemia and the Brain
The association between hypoglycemia and impaired mental function is well known. What is not as well known is the role that hypoglycemia plays in various psychological disorders. For example, despite numerous studies of depressed individuals showing a high percentage of abnormal glucose or insulin tolerance tests, rarely is hypoglycemia considered and rarely are depressed individuals offered dietary therapy.19,20 There is no explanation for this oversight among so many physicians, especially because dietary therapy (usually simply eliminating refined carbohydrates from the diet) is occasionally all that is necessary for effective therapy in patients who suffer from depression due to reactive hypoglycemia.
Aggressive and Criminal Behavior
A strong yet controversial link exists between hypoglycemia and aggressive or criminal behavior. Several controlled studies among psychiatric patients and habitually violent and impulsive criminals have shown that reactive hypoglycemia (as determined by an oral GTT) is a common finding.21,22 Furthermore, during the GTT, abnormal and sometimes emotionally explosive behavior is often observed. In one study, reactive hypoglycemia was shown to induce fire-setting behavior in arsonists.23
Several large studies involving more than 6000 inmates in 10 correctional institutions in three states have now evaluated the effect of dietary intervention (i.e., the elimination of refined sugar) on antisocial or aggressive behavior.24,25
In the first study, 174 incarcerated juvenile delinquents were placed on a sugar-restricted diet while another 102 offenders were placed on a control diet.24 During the 2-year study, the incidence of antisocial behavior was reduced by 45% in the treatment group. The most significant changes were in the reduction of assaults (83%), theft (77%), “horseplay” (65%), and refusal to obey orders (55%). Antisocial behavior changed most in those charged with assault, robbery, rape, aggravated assault, auto theft, vandalism, child molestation, arson, and possession of a deadly weapon.
In the largest study, 3999 incarcerated juveniles were studied over a period of 2 years.25 This study limited the dietary revisions to replacing sugary soft drinks with fruit juices and high-sugar snacks with nonrefined carbohydrate snacks (e.g., replacing a candy bar with popcorn). When the 1121 young men on the sugar-restricted diet were compared with the 884 on the control diet, there were significant differences: suicide attempts were reduced by 100%; the need for restraints to prevent self-injury was reduced by 75%; disruptive behavior was reduced by 42%; and assaults and fights were reduced by 25%. Interestingly, the dietary changes did not seem to affect the behavior of female subjects. This lack of effect seems to indicate that men and women may react to hypoglycemia differently. From an anthropologic and evolutionary view, this makes sense. Low blood sugar levels were undoubtedly an internal signal for men to hunt for food.
The link between hypoglycemia and aggressive behavior also extends to men without a history of criminal activity. In one study, a GTT was given to a group of men who did not have a history of aggressive behavior or hypoglycemia.17 In these subjects, a significant correlation was found between the tendency to become mildly hypoglycemic and scores on questionnaires used to measure aggression. The results indicate that aggressiveness often coincides with hypoglycemia.
Premenstrual Syndrome
The premenstrual syndrome (PMS) is a recurrent condition of women characterized by troublesome yet often ill-defined symptoms that usually appear 7 to 14 days before menstruation. The syndrome affects about one third of women between 30 and 40 years of age, about 10% of whom may have a significantly debilitating form.
An authority on PMS, Guy Abraham, MD, attempted to clarify the different forms by subdividing PMS into four distinct subgroups (A, C, D, and H).26 Each subgroup is linked to specific symptoms, hormonal patterns, and metabolic abnormalities (see Chapter 202 for further information).
PMS-C is associated with increased appetite, craving for sweets, headache, fatigue, fainting spells, and heart palpitations. GTTs on PMS-C patients during the 5 to 10 days before their menses typically displayed a flattening of the early part of the curve and reactive hypoglycemia, whereas during other parts of the menstrual cycle the GTT was normal. A flat early part of the GTT curve usually implies excessive secretion of insulin in response to sugar consumption. This appears to be hormonally regulated, but other factors may also be involved.27 Sodium chloride ingestion enhances the insulin response to sugar ingestion, and decreased magnesium levels in the pancreas can result in the increased secretion of insulin in response to glucose. Regardless of the cause, women with PMS-C appear to be extremely sensitive to hypoglycemia.
Migraine Headaches
Migraine headaches are probably caused by excessive dilation (expansion) of a blood vessel in the head (see Chapter 190). Migraines are a surprisingly common disorder, affecting 15% to 20% of men and 25% to 30% of women at some time in their lives. More than one half of the patients have a family history of the illness. Since 1933, hypoglycemia has been shown to be a common precipitating factor in migraine headaches.28
Several studies have found that by eliminating refined sugar from the diets of migraine sufferers with confirmed hypoglycemia, significant improvement may be seen. In one study of 48 migraine sufferers with reactive hypoglycemia, 27 (56%) showed a greater than 75% improvement in symptoms, 17 (35%) showed a greater than 50% improvement, and 4 (8%) showed a greater than 25% improvement.29
Atherosclerosis, Intermittent Claudication, and Angina
Substantial evidence indicates that reactive hypoglycemia or impaired glucose tolerance is a significant factor in the development of atherosclerosis. Although a high sugar intake leads to elevations in triglyceride and cholesterol levels, the real culprit may be the elevations of insulin.30 Abnormal GTTs and elevations in insulin secretion are common findings in patients with heart disease.31,32
In addition to playing a role in atherosclerosis, high sugar consumption and reactive hypoglycemia can be a cause of angina and intermittent claudication.33,34
Metabolic Syndrome
The term metabolic syndrome is used to describe a set of cardiovascular risk factors including glucose or insulin disturbances, high blood cholesterol and triglyceride levels, elevated blood pressure, and android obesity. Other terms to describe this syndrome include syndrome X, Reaven’s syndrome, insulin resistance syndrome, and atherothrombogenic syndrome.35,36
The underlying common metabolic denominator in the metabolic syndrome is an elevated insulin level along with insulin resistance. There is little doubt about what contributes to these elevations: an elevated intake of refined carbohydrates. An increased intake of simple sugar leads first to hypoglycemia and later to diabetes. There now exists considerable scientific evidence that the development of type 2 diabetes is preceded by elevations of serum insulin values and insulin insensitivity due to the prolonged consumption of refined sugars and the resulting elevations in insulin eventually lead to type 2 diabetes.45 In most cases these defects presented themselves decades before the development of diabetes.
 Therapeutic Considerations
Dietary Factors
Currently, more than one half of the carbohydrates consumed in the United States are in the form of sugars added to processed foods as sweetening agents.18 Patients should be instructed to read food labels carefully for clues to sugar content. They should know that various words are used to describe refined simple carbohydrates; any of the following might appear on the label: sucrose, glucose, maltose, lactose, fructose, corn syrup, and white grape juice concentrate.
A Closer Look at Simple Carbohydrates
Many physicians have recommended that individuals with diabetes or hypoglycemia avoid fruits and fructose. However, recent research challenges this. Fructose does not cause a rapid rise in blood sugar levels. Because fructose must be changed to glucose in the liver in order to be used by the body, blood glucose levels do not rise as rapidly with fructose consumption as they do with that of other simple sugars. For example, the ingestion of sucrose results in an immediate elevation in the blood sugar level. Although most diabetic and hypoglycemic individuals cannot tolerate sucrose, most can tolerate moderate amounts of fruits and fructose without loss of blood sugar control. In fact, fructose and fruits are not only much better tolerated than white bread and other refined carbohydrates but they also produce less sharp elevations in blood sugar levels compared with most sources of complex carbohydrates (starch).37 As a bonus, fructose at concentrations found in most single servings of fruit (e.g., 10 g) has actually been shown to enhance sensitivity to insulin.38
Regular fruit consumption also may help to control sugar cravings and promote weight loss in overweight individuals. Although studies have shown aspartame (NutraSweet), glucose, and sucrose to increase the appetite, fructose has actually been shown in several double-blind studies to decrease the calories and fat consumed. Typically, subjects are given food or drink containing an equivalent caloric amount of fructose or other sweetener 30 minutes to 2.5 hours before they are allowed to consume as much food as they want at a dinner buffet. Consistently, subjects receiving the fructose-sweetened food or drink consume substantially fewer calories and fat compared with the groups receiving aspartame, sucrose, or glucose.39–41
The Glycemic Index and Glycemic Load
The GI was developed in 1981 to express the rise of blood glucose after a particular food is eaten.42 The standard value of 100 is based on the rise seen with the ingestion of glucose. The GI ranges from about 20 for fructose and whole barley, and to about 98 for a baked potato. The insulin response to carbohydrate-containing foods is similar to the rise in blood sugar.
The GI is used as a guideline for dietary recommendations for people with either diabetes or hypoglycemia (see Table 176-4). People with blood sugar problems are advised to avoid foods with high values and choose carbohydrate-containing foods with lower values. However, the GI should not be the only dietary guideline.
TABLE 176-4 Glycemic Index of Isocaloric Amounts of Some Common Foods
| FOOD | GLYCEMIC INDEX | |
|---|---|---|
| Sugars | Fructose | 20 |
| Glucose | 100 | |
| Honey | 75 | |
| Maltose | 105 | |
| Sucrose | 60 | |
| Fruits | Apples | 39 |
| Bananas | 62 | |
| Orange juice | 46 | |
| Oranges | 40 | |
| Raisins | 64 | |
| Vegetables | Beets | 64 |
| Carrot, cooked | 36 | |
| Carrot, raw | 31 | |
| Potato, baked | 98 | |
| Potato (new), boiled | 70 | |
| Grains | Bran cereal | 51 |
| Bread, white | 69 | |
| Bread, whole grain | 72 | |
| Corn | 59 | |
| Corn flakes | 80 | |
| Oatmeal | 49 | |
| Pasta | 45 | |
| Rice | 70 | |
| Rice, puffed | 95 | |
| Wheat cereal | 67 | |
| Legumes | Beans | 31 |
| Lentils | 29 | |
| Peas | 39 | |
| Other foods | Ice cream | 36 |
| Milk | 34 | |
| Nuts | 13 | |
| Sausages | 28 |
Modified from Truswell AS. Glycaemic index of foods. Eur J Clin Nutr 1992;46(suppl 2):S91-S101.
The GL uses the information the GI provides in a more comprehensive way to assess the impact of carbohydrate consumption.43 Although the GI reveals how quickly a particular food’s carbohydrate content can raise blood glucose levels, it still does not help us to understand how much of the blood sugar–increasing carbohydrate is in a certain food.

The point of this example is that even though the GI for watermelon is fairly high, its GL is low, indicating that within reasonable serving amounts, it does not adversely stress blood sugar control. For a complete listing of foods and their GI, fiber content, and GL, see Appendix 6.
The GL reinforces the idea that foods containing natural soluble and insoluble fibers as well as whole foods that are minimally processed remain better choices in terms of glycemic influence and insulin response.44
Further research indicates that diets with a high GL are directly linked to conditions such as diabetes45 and coronary heart disease46 as well as colon,47 ovarian,43 and pancreatic48 cancers.
The Importance of Fiber
Population studies as well as clinical and experimental data show blood sugar disorders to be clearly related to inadequate dietary fiber intake.18,49 These results indicate that although the intake of refined sugars should be curtailed, the intake of complex carbohydrate sources that are rich in fiber should be increased.
• Slowing down the digestion and absorption of carbohydrates, thereby preventing rapid rises in blood sugar
• Increasing cell sensitivity to insulin, thereby preventing the excessive secretion of insulin
• Improving uptake of glucose by the liver and other tissues, thereby preventing a sustained elevation of blood sugar (Figure 176-2)
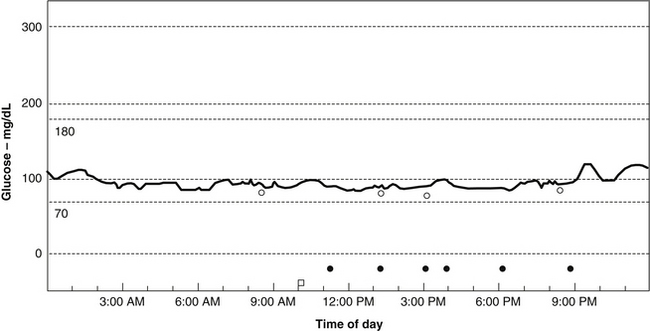
FIGURE 176-2 Blood sugar stabilization from fiber supplementation (same patient as in Figure 176-1).
Courtesy of Dr. Michael Lyon.
For a full discussion of the importance of fiber, see Chapter 52.
PolyGlycoPlex
Based on their work with CGM, Drs. Lyon and Murray have uncovered many important findings on how to effectively reduce blood sugar volatility. For example, they confirmed earlier work that although a low glycemic diet is very important in reducing blood sugar levels, it has little effect in eliminating blood sugar volatility.50 They have found that the most effective way to reduce glycemic volatility is a low glycemic diet along with the use of a novel matrix of soluble fibers known as PolyGlycoPlex (PGX). Several double-blind studies have shown a reduction of postprandial hypoglycemia by PGX in a dose-dependent manner, independent of food form.51–53 The PGX matrix produces a higher level of viscosity, gel-forming properties, and expansion with water compared with any other known fiber. This translates to a significant reduction in the glycemic impact of any food or meal. The typical dosage is 1.5 to 5 g before meals.
Chromium
Chromium is vital to proper blood sugar control, because it functions in the body as a key constituent of the “glucose tolerance factor.” Without chromium, insulin’s action is blocked and glucose levels are elevated. A chromium deficiency may be an underlying contributing factor to the tremendous number of Americans who have hypoglycemia or diabetes or who are obese.54 Evidence exists that marginal chromium deficiency is quite common in the United States and may be responsible for many cases of reactive hypoglycemia.55
In one double-blind crossover study of eight female patients, 200 mcg of chromium (as chromium chloride) given twice daily for 3 months alleviated hypoglycemic symptoms and the glucose nadir at 2 to 4 hours after a glucose load.55 In addition, insulin binding improved and the number of insulin receptors increased.56,57
Lifestyle Factors
Alcohol
Hypoglycemia is an important complication of acute and chronic alcohol abuse. Hypoglycemia aggravates the mental and emotional problems of the alcoholic and the withdrawing alcoholic with such symptoms as the following58:
Although acute alcohol ingestion induces hypoglycemia, in the long run it leads to hyperglycemia and diabetes. Eventually the body becomes insensitive to the augmented insulin release caused by the alcohol. In addition, alcohol itself can cause insulin resistance even in healthy individuals.59 There is also evidence from large population studies that alcohol intake is strongly correlated with diabetes.18,60 The higher the alcohol intake, the more likely it is that an individual will have or develop diabetes.
Exercise
An appropriate exercise training program is an important part of a treatment and prevention plan. Regular exercise has been well documented to prevent type 2 diabetes, and it improves many aspects of glucose metabolism including enhancing insulin sensitivity and improving glucose tolerance in those who are already diabetic. Some effects of exercise on blood sugar control may stem from the fact that exercise increases tissue chromium concentrations.61
 Therapeutic Approach
Diet
All simple, processed, and concentrated carbohydrates as well as food choices with a high GL must be avoided. Foods rich in soluble fiber such as legumes and low glycemic vegetables should be consumed regularly. Frequent small meals may be more effective than larger meals further apart in stabilizing blood sugar levels. Alcohol must be avoided, because it can cause hypoglycemia. Further dietary recommendations mirror those in Chapter 161.
Exercise
Because the beneficial effects of exercise in improving insulin sensitivity decrease within 3 days after exercise and are no longer evident after 1 week, a sustained program is required.62 A graded long-term exercise program should be developed that is appropriate to the individual’s fitness level and interest; it should elevate the heart rate at least 60% of its maximum for half an hour three times a week.
1. Pourmotabbed G., Kitabchi A.E. Hypoglycemia. Obstet Gynecol Clin North Am. 2001;28:383–400.
2. Yasuhara D., Deguchi D., Tsutsui J., et al. A characteristic reactive hypoglycemia induced by rapid change of eating behavior in anorexia nervosa: a case report. Int J Eat Disord. 2003;34:273–277.
3. Chalew S.A., Koetter H., Hoffman S., et al. Diagnosis of reactive hypoglycemia: pitfalls in the use of the oral glucose tolerance test. South Med J. 1986;79:285–287.
4. Palardy J., Havrankova J., Lepage R., et al. Blood glucose measurements during symptomatic episodes in patients with suspected postprandial hypoglycemia. N Engl J Med. 1989;321:1421–1425.
5. Kwentus J.A., Achilles J.T., Goyer P.F. Hypoglycemia etiologic and psychosomatic aspects of diagnosis. Postgrad Med. 1982;71:99–104.
6. Yogev Y., Ben-Haroush A., Chen R., et al. Undiagnosed asymptomatic hypoglycemia: diet, insulin, and glyburide for gestational diabetic pregnancy. Obstet Gynecol. 2004;104:88–93.
7. Galloway P.J., Thomson G.A., Fisher B.M., et al. Insulin-induced hypoglycemia induces a rise in C-reactive protein. Diabetes Care. 2000;23:861–862.
8. World Health Organization. Definition, diagnosis and classification of diabetes mellitus and its complications. Geneva: Department of Non-communicable Disease Surveillance; 1999.
9. Chalew S.A., McLaughlin J.V., Mersey J.H., et al. The use of the plasma epinephrine response in the diagnosis of idiopathic postprandial syndrome. JAMA. 1984;251:612–615.
10. Hadji-Georgopoulus A., Schmidt M.I., Margolis S., et al. Elevated hypoglycemic index and late hyperinsulinism in symptomatic postprandial hypoglycemia. J Clin Endocrinol Metab. 1980;50:371–376.
11. Fabrykant M. The problem of functional hyperinsulinism on functional hypoglycemia attributed to nervous causes. 1. Laboratory and clinical correlations. Metabolism. 1955;4:469–479.
12. Gross T.M., Mastrototaro J.J. Efficacy and reliability of the continuous glucose monitoring system. Diabetes Technol Ther. 2000;2(suppl 1):S19–S26.
13. Sabbah H., McCulloch K., Frederickson L., et al. Detailed Data from a Continuous Glucose Monitoring System (CGMS) facilitates comprehensive diabetes management recommendations. Diabetes. 2000;49(suppl 1):718.
14. No authors. Statement on hypoglycemia. JAMA. 1973;223:682.
15. Cahill G.F., Jr., Soeldner J.S. A non-editorial on non-hypoglycemia. N Engl J Med. 1974;291:905–906.
16. Hofeldt F.D. Patients with bona fide meal-related hypoglycemia should be treated primarily with dietary restriction of refined carbohydrate. Endocrinol Metab Clin North Am. 1989;18:185–201.
17. Sanders L.R., Hofeldt F.D., Kirk M.C., et al. Refined carbohydrate as a contributing factor in reactive hypoglycemia. South Med J. 1982;75:1072–1075.
18. National Research Council. Diet and health: implications for reducing chronic disease risk. Washington, DC: National Academy Press; 1989.
19. Winokur A., Maislin G., Phiillips J.L., et al. Insulin resistance after glucose tolerance testing in patients with major depression. Am J Psychiatry. 1988;145:325–330.
20. Wright J.H., Jacisin J.J., Radin N.S., et al. Glucose metabolism in unipolar depression. Br J Psychiatry. 1978;132:386–393.
21. Schauss A.G. Nutrition and behavior: complex interdisciplinary research. Nutr Health. 1984;3:9–37.
22. Benton D. Hypoglycemia and aggression: a review. Int J Neurosci. 1988;41:163–168.
23. Virkkunen M. Reactive hypoglycemic tendency among arsonists. Acta Psychiatr Scand. 1984;69:445–452.
24. Schoenthaler S.J. Diet and crime: an empirical examination of the value of nutrition in the control and treatment of incarcerated juvenile offenders. Int J Biosocial Res. 1983;4:25–39.
25. Schoenthaler S.J. The northern California diet-behavior program: an empirical evaluation of 3,000 incarcerated juveniles in Stanislaus County Juvenile Hall. Int J Biosocial Res. 1983;5:99–106.
26. Abraham G.E. Nutritional factors in the etiology of the premenstrual tension syndromes. J Reprod Med. 1983;28:446–464.
27. Walsh C.H., O’Sullivan D.J. Studies of glucose tolerance, insulin and growth hormone secretion during the menstrual cycle in healthy women. Ir J Med Sci. 1975;144:18–24.
28. Critchley M. Migraine. Lancet. 1933;1:123–126.
29. Dexter J.D., Roberts J., Byer J.A. The five hour glucose tolerance test and effect of low sucrose diet in migraine. Headache. 1978;18:91–94.
30. Mykkanen L., Laakso M., Pyorala K. High plasma insulin levels associated with coronary heart disease in the elderly. Am J Epidemiol. 1993;137:1190–1202.
31. Yudkin J. Metabolic changes induced by sugar in relation to coronary heart disease and diabetes. Nutr Health. 1987;5:5–8.
32. Pyorala K. Relationship of glucose tolerance and plasma insulin to the incidence of coronary heart disease: results from two population studies in Finland. Diabetes Care. 1979;2:131–141.
33. Bansal S., Toh S.H., LaBresh K.A. Chest pain as a presentation of reactive hypoglycemia. Chest. 1983;84:641–642.
34. Hanson M., Bergentz S.E., Ericsson B.F., et al. The oral glucose tolerance test in men under 55 years of age with intermittent claudication. Angiology. 1987;38:469–473.
35. Hjermann I. The metabolic cardiovascular syndrome: syndrome X, Reaven’s syndrome, insulin resistance syndrome, atherothrombogenic syndrome. J Cardiovasc Pharmacol. 1992;20:S5–S10.
36. Maseri A. Syndrome X. Still an appropriate name. J Am Coll Cardiol. 1991;17:1471–1472.
37. Gregersen S., Rasmussen O., Larsen S., et al. Glycaemic and insulinaemic responses to orange and apple compared with white bread in non-insulin dependent diabetic subjects. Eur J Clin Nutr. 1992;46:301–303.
38. Koivisto V.A., Yki-Jarvinen H. Fructose and insulin sensitivity in patients with type 2 diabetes. J Intern Med. 1993;233:145–153.
39. Rodin J. Effects of pure sugar vs. mixed starch fructose loads on food intake. Appetite. 1991;17:213–219.
40. Rodin J. Comparative effects of fructose, aspartame, glucose, and water preloads on calorie and macronutrient intake. Am J Clin Nutr. 1990;51:428–435.
41. Spitzer L., Rodin J. Effects of fructose and glucose preloads on subsequent food intake. Appetite. 1987;8:135–145.
42. Jenkins D.J., Wolever T.M., Taylor R.H., et al. Glycemic index of foods: a physiological basis for carbohydrate exchange. Am J Clin Nutr. 1981;34:362–366.
43. Lukaczer D. Sweet, hot and deadly: the link between glycemic index, inflammation, and cardiovascular disease: evolving research and practical applications. Portland, OR: Proceedings of the American Association of Naturopathic Physicians 18th Annual Convention and Exposition; 2003.
44. Granfeldt Y., Eliasson A.C., Bjorck I. An examination of the possibility of lowering the glycemic index of oat and barley flakes by minimal processing. J Nutr. 2000;130:2207–2214.
45. Willett W., Manson J., Liu S. Glycemic index, glycemic load, and risk of type 2 diabetes. Am J Clin Nutr. 2002;76:274S–2780S.
46. Liu S., Willett W.C., Stampfer M.J., et al. A prospective study of dietary glycemic load, carbohydrate intake, and risk of coronary heart disease in U.S. women. Am J Clin Nutr. 2000;71:1455–1461.
47. Franceschi S., Dal Maso L., Augustin L., et al. Dietary glycemic load and colorectal cancer risk. Ann Oncol. 2001;12:173–178.
48. Michaud D.S., Liu S., Giovannucci E., et al. Dietary sugar, glycemic load, and pancreatic cancer risk in a prospective study. J Natl Cancer Inst. 2002;94:1293–1300.
49. Trowell H., Burkitt D.P. Western diseases: their emergence and prevention. Cambridge, MA: Harvard University Press; 1981.
50. Brynes A.E., Lee J.L., Brighton R.E., et al. A low glycemic diet significantly improves 24-h blood glucose profile in people with type 2 diabetes, as assessed using the continuous glucose MiniMed monitor [Letter to the Editor]. Diabetes Care. 2003;26:548–549.
51. Jenkins A.L., Kacinik V., Lyon M., et al. Effect of adding the novel fiber, PGX®, to commonly consumed foods on glycemic response, glycemic index and GRIP: a simple and effective strategy for reducing post prandial blood glucose levels: a randomized, controlled trial. Nutr J. 2010 Nov 22;9:58.
52. Brand-Miller J.C., Atkinson F.S., Gahler R.J., et al. Effects of PGX, a novel functional fibre, on acute and delayed postprandial glycaemia. Eur J Clin Nutr. 2010 Dec;64(12):1488–1493.
53. Jenkins A.L., Kacinik V., Lyon M.R., et al. Reduction of postprandial glycemia by the novel viscous polysaccharide PGX, in a dose-dependent manner, independent of food form. J Am Coll Nutr. 2010 Apr;29(2):92–98.
54. Anderson R.A. Chromium, glucose tolerance, and diabetes. Biol Trace Elem Res. 1992;32:19–24.
55. Anderson R.A., Polansky M.M., Bryden N.A., et al. Effects of supplemental chromium on patients with symptoms of reactive hypoglycemia. Metabolism. 1987;36:351–355.
56. McCarty M.F. Chromium and other insulin sensitizers may enhance glucagon secretion: implications for hypoglycemia and weight control. Med Hypoth. 1996;46:77–80.
57. Anderson R.A. Nutritional factors influencing glucose/insulin system: chromium. J Am Coll Nutr. 1997;16:404–410.
58. Wyngaarden J.B., Smith L.H., Bennett J.C. Cecil Textbook of Medicine. Philadelphia: WB Saunders, 1992.
59. Hirata Y. Diabetes and alcohol. Asian Med J. 1988;31:564–569.
60. Selby J.V., Newman B., King M.C., et al. Environmental and behavioral determinants of fasting plasma glucose in women: a matched co-twin analysis. Am J Epidemiol. 1987;125:979–988.
61. Vallerand A.L., Cuerrier J.P., Shapcott D., et al. Influence of exercise training on tissue chromium concentrations in the rat. Am J Clin Nutr. 1984;39:402–409.
62. Sato Y., Nagasaki M., Nakai N., et al. Physical exercise improves glucose metabolism in lifestyle-related diseases. Exp Biol Med (Maywood). 2003;228:1208–1212.
63. Murray M.T., Lyon M.R. Hunger Free Forever. New York: Atria; 2008.