Hydroxychloroquine Toxicity
Clinical Features:
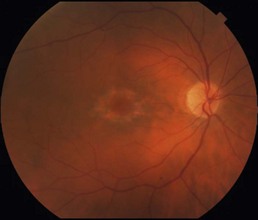
The findings of hydroxychloroquine retinopathy, even in early and moderate disease, can be clinically silent. Later in the disease, there is a bull’s eye maculopathy that becomes evident (Fig. 12.2.1).
OCT Features:
OCT is one of the most useful and sensitive diagnostic tests for identifying retinal toxicity due to hydroxychloroquine. Findings in early disease can be very subtle and may only show up clearly on a retinal thickness map (Fig. 12.2.2). In moderate disease, there is more obvious thinning of the outer retinal layers in a parafoveal distribution including loss of the retinal pigment epithelium (RPE) and IS/OS/ellipsoid zone (Fig. 12.2.3). With advanced disease, there can be profound outer retinal layer loss in a parafoveal wreath pattern leading to a flying saucer-like appearance (Fig. 12.2.4). The central fovea is characteristically preserved even in advanced disease.
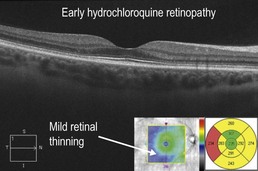
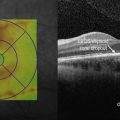
Figure 12.2.2 OCT in a patient with very early hydrochloroquine retinopathy shows an essentially normal line scan. The key finding is on the thickness map (inset), which reveals mild retinal thinning in a parafoveal pattern, more in the temporal macula.
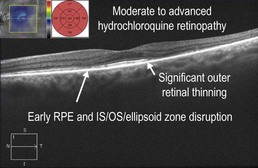
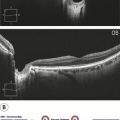
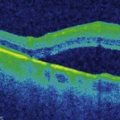
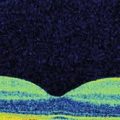
Figure 12.2.3 OCT in a patient with moderate to advanced hydrochloroquine retinopathy shows fairly extensive outer retinal thinning with loss of the RPE and IS/OS/ellipsoid zone, particularly temporally (to right of arrowhead). There is also outer retinal loss to a milder degree in the nasal macula with early RPE and IS/OS/ellipsoid zone disruption. The corresponding thickness map (inset) nicely illustrates the degree of overall thinning.
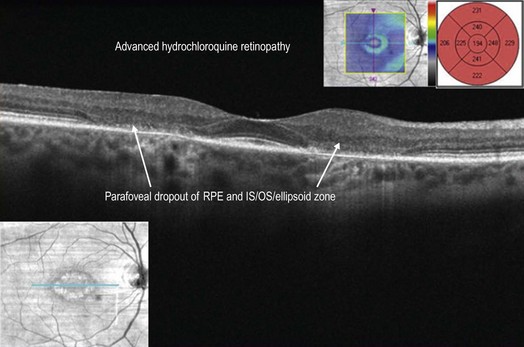
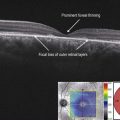
Figure 12.2.4 OCT in a patient with advanced hydrochloroquine retinopathy (corresponding to Fig. 12.2.1) shows outer retinal thinning with abrupt dropout of the RPE and IS/OS/ellipsoid zone in a parafoveal ring (between arrowheads). There is a classic ‘flying saucer’ appearance due to preservation of the central fovea. The bull’s eye maculopathy is seen on the corresponding OCT image (inset, left) and the degree of overall thinning is seen on the corresponding thickness map (inset, right).