Chapter 22 How to Interpret an ECG
ECG Interpretation: Big Picture and General Approach
Many of the most common mistakes are errors of omission, specifically the failure to note certain subtle but critical findings. For example, overlooking a short PR interval may cause you to miss the important Wolff-Parkinson-White (WPW) pattern. Marked prolongation of the QT interval, a potential precursor of torsades de pointes (see Chapter 16) and sudden cardiac arrest (see Chapter 19), sometimes goes unnoticed. These and other major, and avoidable, pitfalls in ECG diagnosis are reviewed in Chapter 23.
Fourteen Specific ECG Features to Analyze
On every ECG, 14 features (parameters) should be analyzed. These features are listed in Box 22-1 and discussed in the following sections.
Standardization and Technical Features
Make sure that the electrocardiograph has been properly calibrated so that the standardization mark is 10 mm tall (1 mV = 10 mm) (see Chapter 2).
Also check for limb lead reversal (see Chapter 23) and ECG artifacts (discussed later in this chapter).
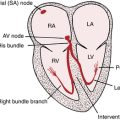
Rhythm
• Sinus rhythm (or a sinus variant such as sinus bradycardia or sinus tachycardia)
• Sinus rhythm with extra (ectopic) beats such as APBs or ventricular premature beats (VPBs)
• An entirely ectopic (nonsinus) mechanism such as paroxysmal supraventricular tachycardia (PSVT), atrial fibrillation or flutter, ventricular tachycardia, or an AV junctional escape rhythm
• Sinus rhythm or some ectopic rhythm (e.g., atrial tachycardia) with second- or third-degree heart block or other AV dissociation mechanism. When complete heart block is present, both the atrial rate and the escape mechanism should be described, along with whether it is narrow or wide complex in duration.
Heart Rate(s)
Calculate the heart rate (see Chapter 2). Normally, the ventricular (QRS) rate and atrial (P) rates are the same (1:1 AV conduction), as implied in the term “normal sinus rhythm.” If the rate is faster than 100 beats/min, a tachycardia is present. A rate slower than 60 beats/min means that a bradycardia is present.
PR Interval
The normal PR interval (measured from the beginning of the P wave to the beginning of the QRS complex) is 0.12 to 0.2 sec. A uniformly prolonged PR interval is often referred to as first-degree AV block (see Chapter 17). A short PR interval with sinus rhythm and with a wide QRS complex and a delta wave is seen in the Wolff-Parkinson-White (WPW) pattern. By contrast, a short PR interval with retrograde P waves (negative in lead II) generally indicates an ectopic (atrial or AV junctional) pacemaker.
QRS Width (Interval or Duration)
Normally the QRS width is 0.1 sec (100 ms) or less, measured by eye, in all leads (or 110 ms if measured by computer). The differential diagnosis of a wide QRS complex is described in Chapter 10. The differential diagnosis of wide complex tachycardias is described in Chapter 20.
QT/QTc Interval
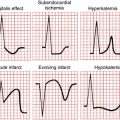
A prolonged QT/QTc interval may be a clue to electrolyte disturbances (hypocalcemia or hypokalemia), drug effects (quinidine, procainamide, amiodarone, or sotalol), or myocardial ischemia (usually with prominent T wave inversions). Shortened QT intervals are seen with hypercalcemia and digitalis effect. The finding of a prolonged QT/QTc interval as determined by computer interpretation should always be rechecked manually. Conversely, computers sometimes miss prolonged QT intervals that are present. Formulas for computing the calculation of a rate-corrected QT interval (QTc) are discussed in Chapter 2.
QRS Voltage
Look for signs of right or left ventricular hypertrophy (see Chapter 6). Remember that thin people, athletes, and young adults frequently show tall voltage without left ventricular hypertrophy (LVH).
Low voltage may result from pericardial effusion or pleural effusion, hypothyroidism, emphysema, anasarca obesity, myocardial disease, or other factors (see Chapter 24).
Mean QRS Electrical Axis
Estimate the mean QRS axis in the frontal plane. Decide by inspection whether the axis is normal (between −30° and +100°) or whether left or right axis deviation is present (see Fig. 5-13).
R Wave Progression in Chest Leads
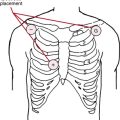
Inspect leads V1 to V6 to see if the normal increase in the R/S ratio occurs as you move across the chest (see Chapter 4). The term “poor” or, preferably, “slow” R wave progression (small or absent R waves in leads V1 to V3) refers to a finding that may be a sign of anterior myocardial infarction (MI), but may also be seen in many other settings, including: altered lead placement, LVH, chronic lung disease, left bundle branch block, and many other conditions in the absence of infarction.
Abnormal Q Waves
Prominent Q waves in leads II, III, and aVF may indicate inferior wall infarction. Prominent Q waves in the anterior leads (I, aVL, and V1 to V6) may indicate anterior wall infarction (see Chapter 8).
Formulating an Interpretation
For example, the ECG might show a prolonged QT/QTc interval and prominent U waves. The interpretation could be “Repolarization abnormalities consistent with drug effect or toxicity (sotalol, dofetilide, etc.) or hypokalemia. Clinical correlation suggested.”
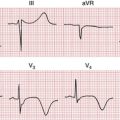
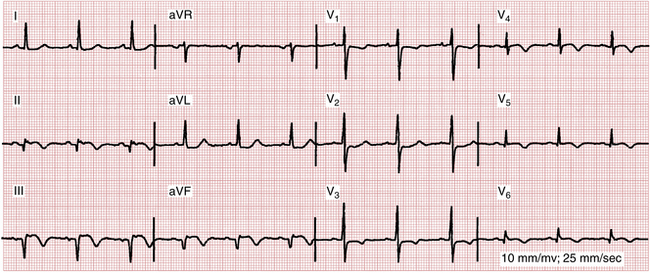
Another ECG might show wide P waves, right axis deviation, and a tall R wave in lead V1 (see Fig. 22-1). The interpretation could be “Findings consistent with left atrial abnormality (enlargement) and right ventricular hypertrophy. This combination is highly suggestive of mitral stenosis.”
In yet a third case the overall interpretation might simply be “Within normal limits.”
Every ECG abnormality you identify should summon a list of differential diagnostic possibilities (see Chapter 24). You should search for an explanation of every abnormality found.
Caution: Computerized ECG Interpretations
Therefore, computerized interpretations (including measurements of basic ECG intervals and electrical axes) must never be accepted without careful review.
ECG Artifacts
60-Hertz (Cycle) Interference
Interference from alternating current generators produces the characteristic pattern shown in Figure 22-2. Notice the fine-tooth comb 60-hertz (Hz) artifacts. You can usually eliminate 60-Hz interference by switching the electrocardiograph plug to a different outlet or turning off other electrical appliances in the room.
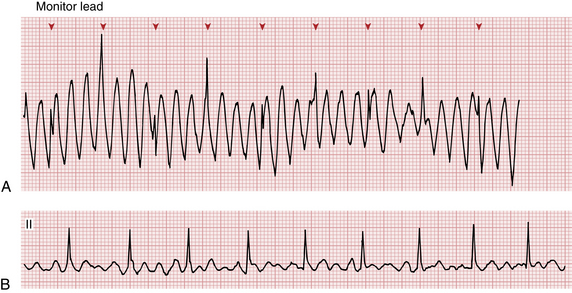
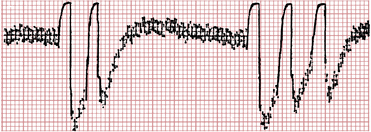
Muscle Tremor
Involuntary muscle tremor (e.g., Parkinsonism) or voluntary movements (e.g., due to teeth brushing) can produce undulations in the baseline that may be mistaken for atrial flutter or fibrillation or sometimes even ventricular tachycardia (Fig. 22-3).
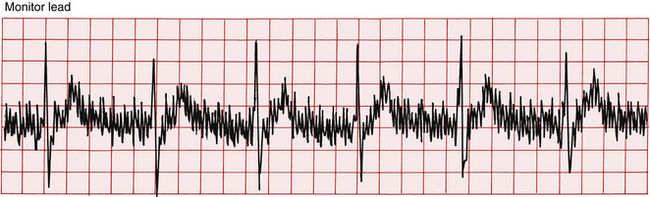
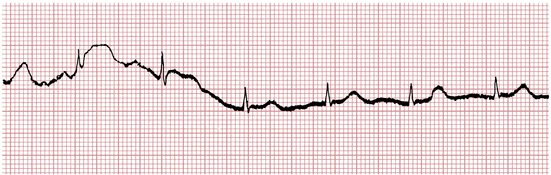
Wandering Baseline
Upward or downward movement of the baseline may produce spurious ST segment elevations or depressions (Fig. 22-4).
Poor Electrode Contact or Patient Movement
Poor electrode contact or patient movement (Figs. 22-4 and 22-5) can produce artifactual deflections in the baseline that may obscure the underlying pattern or be mistaken for abnormal beats.
Improper Standardization
The electrocardiograph, as mentioned, should be standardized before each tracing so that a 1-mV pulse produces a square wave 10 mm high (see Fig. 2-5). Failure to standardize properly results in complexes that are either spuriously low or spuriously high. Most ECG machines are left in their default mode of 10 mm/mV. However, be aware that electrocardiographs are usually equipped with half-standardization and double-standardization settings. As noted, unintentional recording of an ECG on either of these settings may also result in a misleading reading of “low” or “high” voltage.