[level-membership-for-gastroenterology-and-hepatology-category]
Chapter 3 How Endoscopes Work
Overview
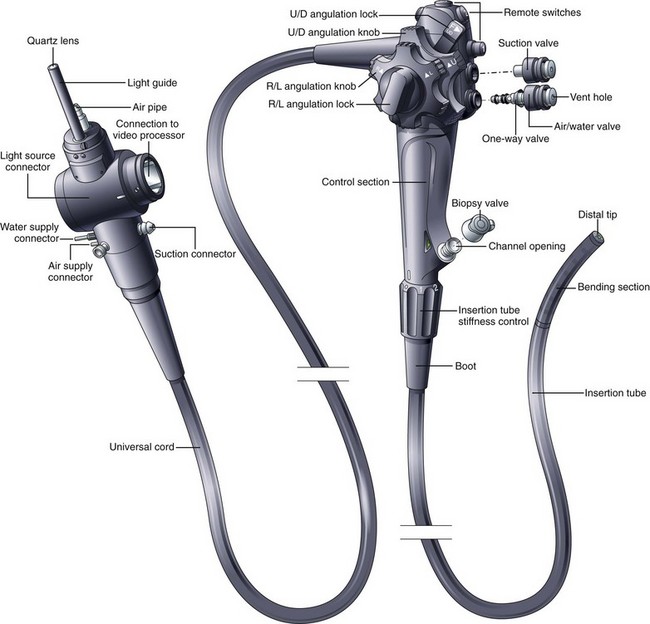
The flexible videoendoscope embodies more than 3 decades of refinements in solid-state imaging and mechanical design. Many different models are available, each having slightly different features and each optimized for the portion of the gastrointestinal (GI) tract that it is designed to examine. Although alternative designs for the control section of the endoscope have been proposed (e.g., “pistol-grip”), the basic shape and layout of the instrument are relatively unchanged since flexible endoscopes were first introduced. The basic components and controls of all flexible videoendoscopes are quite similar (Fig. 3.1).
Insertion Tube
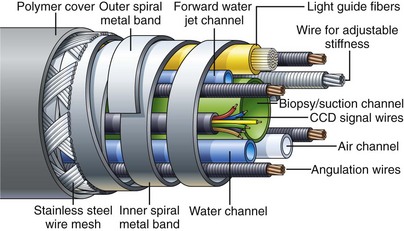
Endoscope manufacturers have put significant effort into refining the construction of the insertion tube and selecting ideal materials. Fig. 3.2 shows the internal components of a typical colonoscope. The insertion tube usually contains (1) tubes for suction (biopsy), air, and water feeding; (2) often an additional tube for a forward water jet; (3) four angulation control wires; (4) fine electrical wires connecting the charge-coupled device (CCD) image sensor at the distal tip of the endoscope to the videoprocessor; and (5) delicate glass fibers for bringing light from the light source to the distal end of the endoscope. Colonoscopes with adjustable insertion tube flexibility have an additional component—a tensioning wire to control insertion tube stiffness. Duodenoscopes also have an additional wire/coil sheath running the length of the insertion tube for controlling the up-and-down position of the forceps elevator (see later discussion). It is the task of the endoscope designer to pack all of these individual components into the smallest space possible while still providing freedom for the components to move about without damaging the more fragile elements (CCD wires, fiberoptic strands) as the instrument is torqued and flexed during use. A dry powdered lubricant is applied to all internal components to reduce the stress that they place on each other during manipulation of the insertion tube.
Insertion Tube Flexibility
As previously mentioned, the handling characteristics of the insertion tube are extremely important, particularly for colonoscopes. For easy insertion, the instrument must be capable of accurately transmitting all of the subtle movements and torque applied by the endoscopist. Any rotation that the endoscopist applies to the proximal portion of the shaft (torque) must be transferred to the distal tip of the instrument in a 1 : 1 ratio, although this capability is lost when the instrument is looped. The torquing ability of the instrument is facilitated by flat, spiral metal bands that run just under the skin of the insertion tube (see Fig. 3.2). Because these bands are wound in opposite directions, they lock against one another as the tube is torqued, accurately transmitting rotation of one end of the tube to the other. At the same time, gaps between these spiral bands allow the shaft to flex freely. The bands also give the insertion tube its round shape. Their stiffness prevents the internal components of the insertion tube from being crushed by external forces. These spiral bands are covered by fine strands of stainless steel wire, braided into a tubular mesh. A plastic polymer layer, typically black (or dark green on colonoscopes), is extruded over this wire mesh to create the smooth outer surface of the insertion tube. The polymer layer provides an atraumatic, biocompatible, and watertight surface for the insertion tube. It is usually marked with numbers to gauge the depth of insertion.
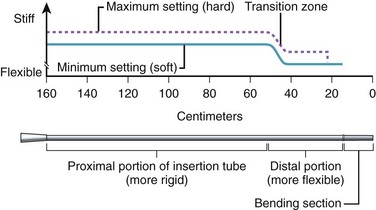
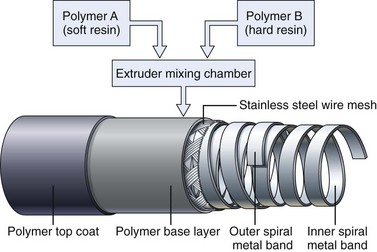
Obtaining the best combination of flexibility, elasticity, column strength, and torquing ability is the art and science of insertion tube design. Improvements in one of these characteristics often negatively affect one or more of the others. The final design is usually a compromise between these ideal characteristics, confirmed by months of clinical testing. To improve insertion further, the flexibility of both gastroscope and colonoscope insertion tubes typically varies from end to end. As Fig. 3.3 illustrates, the distal 40 cm of a colonoscope insertion tube is significantly more flexible than the proximal portion. This variation in flexibility is achieved by changing the formulation of the tube’s outer polymer layer as it is extruded over the wire mesh during manufacturing. As Fig. 3.4 illustrates, the extruder contains two types of resins, one significantly harder than the other. Initially, as the distal end of the insertion tube passes through the machine, a layer of soft resin is applied to the distal 40 cm of the wire mesh. This soft resin is gradually replaced by the hard resin within a transition zone near the middle of the tube. The proximal portion of the insertion tube (50 to 160 cm) is constructed of only the hard resin.1 The end result is an insertion tube that has a soft distal portion for atraumatically snaking through a tortuous colon, with a stiffer proximal portion that is effective at preventing loop reformation in the portions of the colon that have already been straightened by the colonoscope.
Adjustable Flexibility
Clinical experience has shown that endoscopists often disagree over what constitutes the ideal insertion tube. This disagreement may be due to differences in training, insertion technique, or past experience. In addition, some endoscopists have expressed a desire to change the characteristics of the insertion tube during the procedure, based either on insertion depth or on the patient’s anatomy, which has led to the development of an insertion tube with adjustable stiffness.2
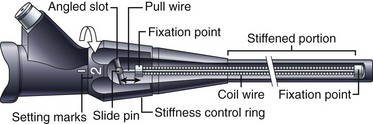
Colonoscopes with adjustable stiffness have a tensioning wire that runs the length of the insertion tube (see Fig. 3.2). The amount of tension in this wire is controlled by rotating a ring at the proximal end of the insertion tube, just below the control section (Fig. 3.5). When the pull wire in this stiffening system is in the “soft” position, the stiffening system provides no additional stiffness to the insertion tube beyond that provided by the wire mesh and polymer coat. As Fig. 3.5 illustrates, when the control ring is rotated to one of the “hard” positions, an angled slot in the control ring pulls on the slide pin at the end of the pull wire, stretching the pull wire and placing it under heavy tension. This tension stiffens the coil wire that surrounds the pull wire and adds significant rigidity to the insertion tube. As Fig. 3.3 illustrates, although the base stiffness of the insertion tube is established by varying the mixture of hard and soft resins in the polymer base layer, the insertion tube can be stiffened further at will during the procedure by rotating the stiffness control ring. The variable stiffness mechanism does not run the entire length of the insertion tube so that the distal portion of the endoscope is not affected.
Distal Tip
Fig. 3.6 illustrates the components found in the distal tip of a typical end-viewing endoscope, such as a gastroscope or colonoscope. The larger of the circular glass lenses on the distal tip is the objective lens. This lens focuses a miniature image of the GI mucosa on the surface of a solid-state CCD image sensor. The image sensor sends a continuous stream of images back to the videoprocessor via a collection of very fine electrical wires. The objective lens and CCD unit are tightly sealed to prevent condensation from fogging the image and to protect the imaging system from damage if fluid were to enter the instrument accidentally. Light to illuminate the interior of the body travels through the instrument via fiberoptic illumination fibers. This light is evenly dispersed across the endoscope’s field of view via a light guide lens system.
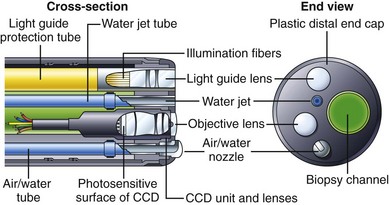
Some endoscopes have a single illumination system (as shown in Fig. 3.6). Other endoscope models have two fiberoptic bundles and two light guide lenses to improve illumination on both sides of the biopsy forceps (e.g., snare) and to facilitate the packing of components within the insertion tube. The channel used for biopsy and suction exits close to the objective lens on the distal tip. The position of the biopsy channel relative to the objective lens determines how accessories appear in the image as they enter the visual field. On some instruments, the snare or biopsy forceps appears to emanate from the lower right corner of the image; on other instruments, these accessories enter the visual field from the lower left corner, and so forth. When planning difficult procedures, such as piecemeal polypectomy or hemostasis, it is crucial that the endoscopist know where the accessories will enter into his or her field of view.
The insertion tube also contains small tubes that carry air and water through the instrument (see Fig. 3.2). These tubes typically merge into a single tube a few inches from the distal tip (see Fig. 3.9 further on). This combined air/water tube connects to the air/water nozzle on the tip of the instrument. Under control of the endoscopist, water can be fed across the objective lens to clean it, or air can be fed from the nozzle to insufflate the GI tract. Some gastroscopes and colonoscopes have an additional water tube and a water-jet nozzle on the distal tip for washing debris from the mucosa (see Fig. 3.6).
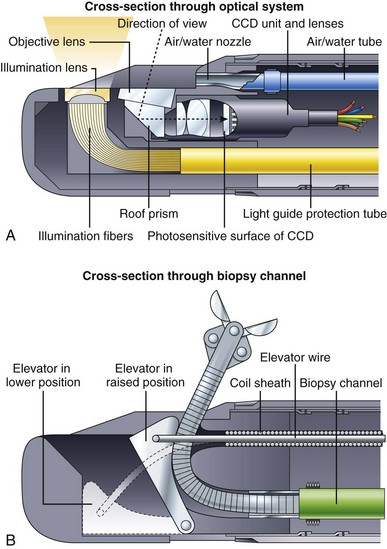
Fig. 3.7 illustrates the components found in the distal end of a typical duodenoscope. Fig. 3.7A is a schematic cross section through the optical and illumination systems found in the distal tip of the duodenoscope. The objective lens for viewing the tissue is now located on the side of the distal end rather than on the very tip of the instrument. A prism is used to deflect the angle of view 90 to 105 degrees and to convert the instrument into a side-viewing endoscope. The illumination fibers are likewise steeply bent at the tip of the instrument, directing the light to emanate from the side. As in end-viewing instruments, an air/water nozzle positioned near the objective lens directs water across the lens to clean it, followed by air to blow away any remaining water droplets. Air from this nozzle is also used to insufflate the patient. All duodenoscopes have a forceps elevator to deflect actively the tip of any accessory passed through the channel. The elevator mechanism is shown in Fig. 3.7B. This elevator normally lies in a recess within the tip of the endoscope (lowered position). When the endoscopist wishes to raise the accessory up into the field of view, he or she operates a thumb control on the control section of the instrument (not shown). This thumb control pulls on the elevator wire, lifting the elevator out of its recess into a raised position, deflecting the tip of the accessory up into the field of view. In some instruments, such as the V-scope (Olympus Corp, Melville, NY), this elevator has a small groove that entraps a 0.035-inch guidewire to aid in wire stabilization during accessory exchanges.
Bending Section and Tip Angulation
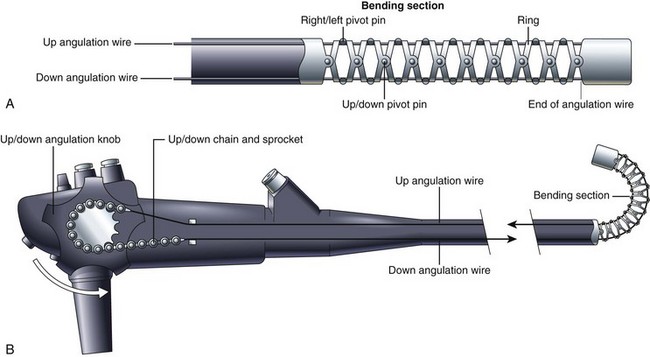
The distal tip of the insertion tube of the endoscope can also be manipulated by the endoscopist. The deflectable portion, referred to as the bending section, is constructed differently from the rest of the insertion tube. As Fig. 3.8 illustrates, the bending section is composed of a series of oddly shaped metal rings, each one connected to the ring on either side of it via a freely moving joint. These joints are constructed using a series of pivot pins, each one displaced from its neighbors by 90 degrees. One set of pivots allows the bending section to curl in the up-and-down direction. A second set allows the bending section to curl in the right-and-left direction. Together, they enable the bending section to curl in any direction. The direction of the curl is controlled by four angulation wires that run the length of the insertion tube (see Fig. 3.2). These four wires are firmly attached to the tip of the bending section at the 3 o’clock, 6 o’clock, 9 o’clock, and 12 o’clock positions. Pulling on the wire attached at the 12 o’clock position causes the bending section to curl in the up direction and achieves what endoscopists refer to as “up tip deflection.” Pulling on the wire attached at the 3 o’clock position causes right tip deflection. Pulling the other two wires causes down and left deflection. The endoscopist is able to pull on each of these wires in turn by rotating either the up-and-down or right-and-left angulation knobs. (For simplicity, Fig. 3.8 illustrates only the up-and-down angulation system.) Rotating the up-and-down and right-and-left knobs together produces a combined tip movement (e.g., upward and to the right) and allows the endoscopist to sweep the tip of the endoscope in any direction.
Air, Water, and Suction Systems
A schematic of a typical endoscopic air, water, and suction system is shown in Fig. 3.9. An air pump in the light source provides air under mild pressure to a pipe protruding from the light source connector of the endoscope. This air is carried by an air channel (tube) to the air/water valve on the control section. If this valve is not covered, the air simply exits from a vent hole in the top of the valve (see Fig. 3.1). This vent hole allows the air pump to pump freely when air is not needed, reducing wear and tear on the pump. If the endoscopist wants to insufflate the patient, he or she covers the vent hole with a fingertip; this closes off the vent and forces air down the air channel, exiting the instrument through the nozzle on the distal tip. A one-way valve is incorporated into the shaft of the air/water valve (see Fig. 3.1) to hold air in the patient during examination. During endoscopy, the GI tract is typically insufflated to a pressure slightly above atmospheric pressure. If it were not for this one-way valve in the system, air from the organ under examination would flow back into the nozzle on the distal tip, up the air channel in the insertion tube, and out the hole in the air/water valve whenever the operator removed his or her finger from the valve. The antireflux valve is required to keep the patient insufflated.
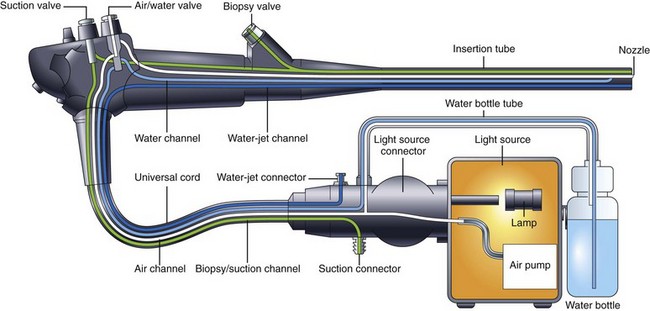
Water, used to clean the objective lens during the procedure, is stored in a water bottle attached to the light source or cart (see Fig. 3.9). In addition to feeding air for insufflation, the air pump also pressurizes this water container, forcing water out of the bottle and into the endoscope. This water is carried via a tube on the water bottle cap to the light source connector of the endoscope and then by a water channel up the universal cord to the air/water valve. When the endoscopist depresses the air/water valve, water continues down the water channel in the insertion tube and flows out of the nozzle at the distal tip. The nozzle directs this water across the surface of the objective lens, cleaning it.
There are several inherent safety features in the design of the air, water, and suction system shown in Fig. 3.9. The air supply system has no moving parts and no mechanical valves that could stick in a continuously “on” position, resulting in accidental overinsufflation of the patient. Instead, the air simply exits the vent hole in the valve, unless the physician has his or her finger over this opening, and in the event that the suction system becomes obstructed and the endoscopist has difficulty with possible overinsufflation, he or she simply can quickly remove all valves from the endoscope. This action stops all feeding of air and water and allows the patient’s GI tract to depressurize through the open valve cylinders.
Illumination System
Endoscopes use an incoherent fiberoptic bundle to carry light from the external light source to the distal tip of the endoscope. This fiber bundle is composed of thousands of hairlike glass fibers (30 µm in diameter) that are optically coated to trap light within the fiber and to transmit light from end to end via a phenomenon known as total internal reflection. Light rays entering one end of such a fiber reflect off of the walls of the fiber many thousands of times before exiting the opposite end of the fiber. The types of glass used to make the core and cladding of the fiber and the thickness of the core and cladding all are carefully chosen to enable the fiber bundle to carry as much light as possible (see Kawahara and Ichikawa3 for a more complete discussion of fiberoptics).
Endoscopic light sources typically use 300-W xenon arc lamps to produce the intense, white light needed for videoendoscopy. These lamps also produce considerable heat. Heat sinks, infrared filters, and forced-air cooling systems within the light source prevent the fiber bundle of the endoscope from overheating and burning. A close inspection of the tip of the endoscope’s light guide reveals a burn-resistant quartz lens that serves to collect light from the light source lamp and to direct it into the endoscope (see Fig. 3.1). At the other end of the endoscope, the light guide lens at the distal tip of the instrument spreads this light uniformly over the visual field (see Fig. 3.6). An automatically controlled aperture (iris) in the light source controls the intensity of the light emitted from the endoscope tip.
Solid-State Image Capture
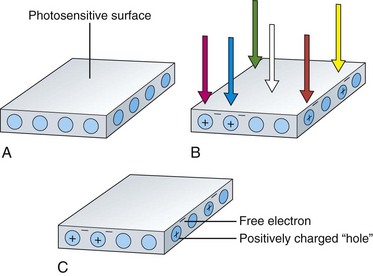
The image sensors used in videoendoscopes are typically referred to as CCDs. These sensors are solid-state imaging devices constructed of silicon semiconductor material. The silicon on the surface of the sensor is responsive to light. When a photon of light strikes the photosensitive surface of the CCD, it displaces an electron from a silicon atom at the surface. A free, negatively charged electron is produced in the silicon material along with a corresponding positively charged “hole” in the crystalline structure of the silicon where the electron was previously bound. This action is referred to as the photoelectric effect and is illustrated in Fig. 3.10. As additional photons hit the surface of the sensor, additional free electrons and additional corresponding holes are created. The charges built up in the sensor are directly proportional to the amount of light falling on the CCD. Also, these charges are created regardless of the color of the light falling on the sensor.
Although a single photosensitive element is useful for measuring the brightness of light falling on a surface (as in a light meter), it cannot reproduce an image. To reproduce an image, the photosensitive surface must be divided up into a matrix of thousands of small, independent photosites. When an image is focused on the surface of such a sensor, the brightness of the image is automatically measured at each individual photosite within the matrix. Knowing the brightness of every point in the image allows a vision system to reproduce the image accurately. The CCD is a common component of such a solid-state vision system. The surface of a CCD image sensor is divided into a rectangular array of discrete photosites, individually referred to as picture elements, or pixels. Fig. 3.11 illustrates a CCD sensor with such an array. In a video image endoscope, the CCD is located in the distal tip of the instrument directly behind the objective lens (as shown in Fig. 3.6). The objective lens focuses a miniature image of the observed mucosa directly on the surface of this sensor. The pattern of light falling on the CCD (i.e., the image) is instantly converted into an array of stored electrical charges because of the photoelectric effect previously described. Because the charges stored in each of the individual pixels are isolated from neighboring pixels, the sensor faithfully transforms the optical image into an electrical replica of the image.
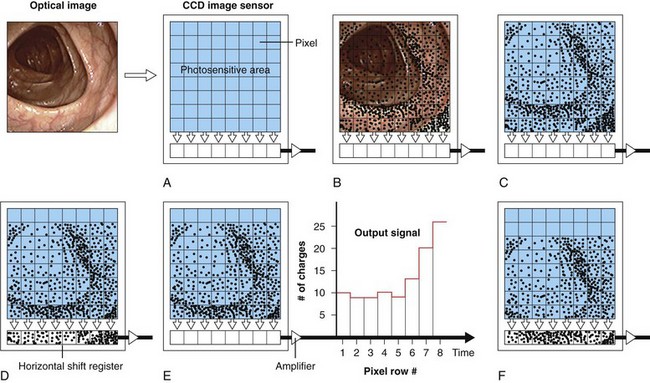
This electrical representation is processed and sent to a video monitor for reproduction. As Fig. 3.11 illustrates, pixels in dark areas of the image develop a low voltage because of the generation of fewer charges. Pixels in brighter areas of the image develop a proportionately higher voltage because of the creation of more electron/hole pairs. Each pixel is able to develop any level of charge, from some minimum to some maximum, depending on the brightness of the incident light. The conversion process from light to electrical charges is linear. Doubling the number of photons falling on a pixel doubles the number of charges generated at the pixel, until the storage capacity of the photosite is full.
Reading the Image Created on the Charge-Coupled Device
After the CCD is exposed to the image, the charges developed in the CCD must be “read out” in an orderly manner and processed to reproduce the original optical image. The manner in which the charges are moved about within the CCD as they are read out depends on the configuration of the CCD. The three most common types of CCDs are the line transfer CCD, the frame transfer CCD, and the interline transfer CCD.4 Each of these CCD types has specific advantages in terms of sensitivity of the CCD to light (i.e., the brightness required of the endoscope’s illumination system), the type of light source required (strobed vs. nonstrobed), the size of the CCD (which affects the size of the endoscope’s distal tip), and the speed at which the charges can be transferred out of the CCD. The CCD schematically illustrated in Fig. 3.11 is a line transfer CCD. Fig. 3.11A illustrates the projection of an optical image onto the photosensitive surface of the CCD. Electrical charges are developed at each photosite in the array after brief exposure to the image (Fig. 3.11B and C). For simplicity, Fig. 3.11 illustrates an array with only a very few pixels and only a very few resulting charges. These charges are represented by small dots within the photosites.
The charges within each pixel are controlled and shifted over the surface of the CCD via electrodes adjacent to each photosite (these electrodes are not shown in Fig. 3.11). By varying the voltages applied to these electrodes, the electrons within individual pixels are transferred as charge packets from one pixel to another. Sequential voltage changes on these electrodes march the charges toward the bottom edge of the CCD and into a horizontal shift register (see Fig. 3.11D). The charges in the horizontal shift register are passed through an output amplifier and are converted into an output signal. The output signal fluctuates in direct proportion to the number of charges stored in each pixel. At the point in the process illustrated in Fig. 3.11E, the charges in the bottom row of the original image have been read out and passed through the output amplifier and sent to the videoprocessor for reconstruction. The electrical representation of the entire image has shifted down one row on the CCD. Once the horizontal shift register has been read out and cleared (emptied), the charges in each pixel of the array are sequentially transferred down to the pixel below, resulting in a second shift of the image replica. This transfer fills the horizontal shift register with the charges that were originally in the second-to-the-bottom row of the array, as shown in Fig. 3.11F. The charges in the horizontal shift register are again read out, resulting in an output signal that is representative of the brightness of the image falling on the second-to-the-bottom row of the original image.
The processing of the image replica continues, in a similar step-by-step fashion, until the entire CCD has been read out. Once the CCD is read and cleared, it is ready for another exposure. The charge-coupling process—the transfer of charges from pixel to pixel as packets—gives the CCD its name (charge-coupled device). The charges in the furthermost corners of the CCD are moved sequentially through several hundred photosites before they reach the horizontal shift register. In current videoendoscopes, the CCD is exposed, read out, and reexposed 60 to 90 times each second. To maintain image fidelity during these repetitive transfers, it is essential that these charge packets remain intact with no loss or gain in charge quantity in the process of undergoing hundreds of thousands of transfers per second as the CCD is being read out. The photosensitive array of a line transfer CCD must be shielded from light during the entire time that the image is being moved and read out (the steps illustrated in Fig. 3.11C and following). This shielding is necessary to prevent mixing information from the image under transfer with new charges being generated at the photosites by the light still falling on them. To preserve the original image, the photosites must be completely dark while the image replica is read out. One method of doing this in an endoscopic application is to strobe, or momentarily interrupt, the light emitted by the endoscope as the CCD is being read; this creates a momentary burst of light to expose the image sensor, followed by a brief period of darkness as the CCD is read out and cleared. Endoscopists who have used a red, green, and blue (RGB) sequential endoscopy system (typically called a black and white CCD system) are familiar with the concept of strobed endoscopic light sources.
Interline Charge-Coupled Device
Although strobed video systems are in common use in endoscopy, they have several disadvantages, particularly with the smooth reproduction of motion. An alternative to a line transfer CCD with a strobed light source is an interline transfer CCD with a continuous (nonstrobed) light source. As illustrated in Fig. 3.12, an interline transfer CCD has a series of vertical shift registers placed adjacent to each column of photosites. Immediately after light exposure, the charges developed at the photosites are transferred in one quick step to the adjacent vertical shift registers. Because of the rapid, one-step transfer of charges to the vertical shift registers, it is unnecessary to interrupt illumination of the CCD during the read-out process. In the meantime, the charges in the vertical shift registers are transferred, step-by-step, down to the horizontal shift register, where they are read out in a conventional manner. (The red arrows in Fig. 3.12 illustrate the read-out path of the charges created in the upper left corner pixel.) The vertical shift registers are shielded from light, allowing them to be emptied as the CCD is continuously exposed to light. The CCD collects a second image as the first image is being read. When the vertical shift registers are finally empty, the newly created image replica in the sensor array is instantly transferred from the photosites to the vertical shift registers, and the process repeats.
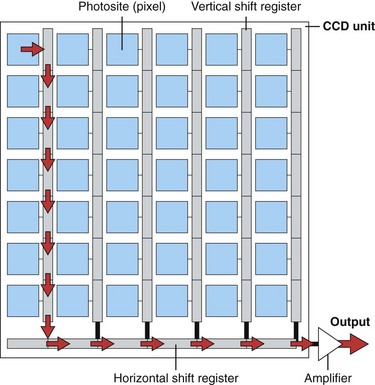
Image Resolution
Image resolution is a key component of endoscopic image quality. Resolution is commonly measured using a test method similar to that illustrated in Fig. 3.13. A test chart consisting of sharply printed black and white lines is positioned at a measured distance from the tip of the endoscope. This test chart contains a series of increasingly closely spaced lines. The image of this chart (Fig. 3.13C) as reproduced on the video monitor of the endoscope is carefully studied. The more widely spaced lines are clearly distinguishable as individual line pairs. The more closely spaced lines typically blur together, however, and are unrecognizable as distinct lines.
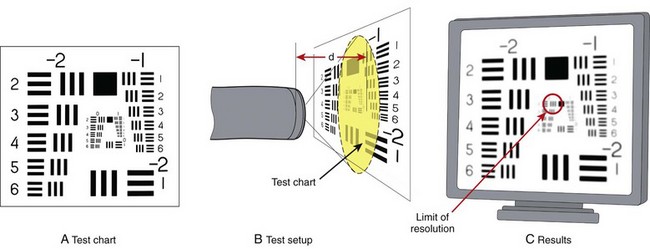
The limit of resolution of the endoscope is defined as the distance between the closest set of line pairs that can still be distinguished as lines before the image becomes so blurred that the lines simply blend together. As the test chart is moved closer to the tip of the endoscope, the image of the test chart has increased magnification, and the endoscope is able to resolve smaller and smaller line pairs. Fig. 3.14 illustrates a typical plot of endoscope resolving power as a function of distance. As the endoscope is moved closer and closer to the test chart, finer and finer line pairs are resolved by the endoscope, until at point A the endoscope reaches its maximum resolving power. At this point, the endoscope is also at its point of closest focus. Moving the test chart closer to the endoscope degrades the image because of increasing loss of focus. Limited by image blur, the working range of the typical standard colonoscope illustrated in Fig. 3.14 is 7 to 200 mm (as depicted by the solid purple line).
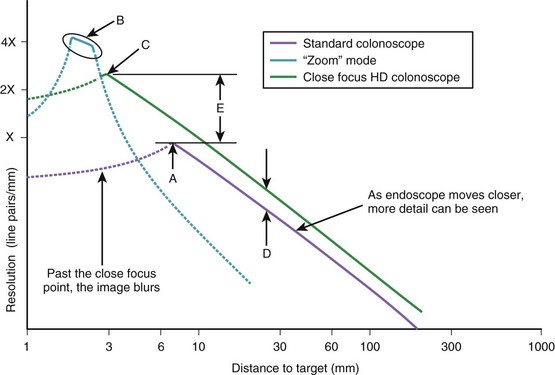
A few videoendoscopes available on the market have an optical zoom feature. These endoscopes typically have a control on the endoscope’s body that adjusts the lenses in the distal tip of the endoscope for sharp focus when the endoscope is very close to the target tissue. As illustrated in Fig. 3.14, these endoscopes can resolve line pairs that are perhaps four times smaller than a standard endoscope; this is accomplished by allowing the endoscope to focus at a distance of only a couple of millimeters from the tissue. This fourfold increase in resolving power comes at a price, however. Similar to microscopes, these instruments have a very limited depth of field—in the range of 1 or 2 mm. If the endoscope moves too close or too far from the tissue, the image quickly goes out of focus, and image quality deteriorates. As depicted by the solid blue line in Fig. 3.14B, the working range of a zoom endoscope in its “zoomed” mode is very limited, and the endoscope is very difficult to keep in focus.
More recently, close focus high-definition (HD) endoscopes have been introduced that offer advantages over standard and optical zoom endoscopes. Overall, the HD endoscope has increased resolving power because it has a greater number of pixels in its image sensor versus a standard endoscope (see Fig. 3.14D). In addition, the optics on close focusing endoscopes allow them to approach the observed tissue much more closely before going out of focus. The close focus HD colonoscope illustrated in Fig. 3.14 is able to come within 3 mm of the test chart before going out of focus, resulting in threefold greater resolving power (Fig. 3.14E) compared with a standard colonoscope. Although its resolving power is still less than that of an optical zoom colonoscope, the fact that this close focusing colonoscope has a very broad depth of field (3 to 200 mm, as depicted by the solid green line) makes this colonoscope as convenient to use as any standard endoscope.
Reproduction of Color
All solid-state image sensors are inherently monochromatic devices. They can reproduce only black and white images. The silicon photosites on the surface of the CCD develop charges in proportion only to the intensity (brightness) of the light falling on the array. Simple image sensors cannot distinguish the color of the incident light. As shown in Fig. 3.10, a photon of red light produces the same charge as a photon of blue light. For an endoscope to reproduce the necessary attribute of color, the system must have an additional means to analyze the color (wavelength) of the light falling on the sensor.
Trichromatic Vision
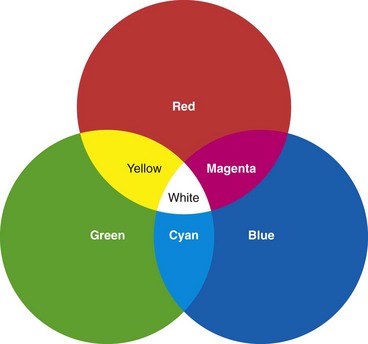
It has been discovered that nearly any color to which the human eye is sensitive can be matched by mixing light of three colors—red, green, and blue (RGB). If three light projectors are fitted with RGB filters and the projected spotlights are overlapped, the resulting image would appear similar to that shown in Fig. 3.15. The color resulting from the overlap of the red and green projectors is indistinguishable from monochromatic yellow light. Likewise, light from the overlapping green and blue projectors produces the mental sensation of looking at pure cyan light. The overlap of red and blue produces magenta. Surprisingly, where all three of the projectors overlap in the center, the observer sees an area of pure white, with no hint of the three component colors. If the intensities of each of the three projectors are accurately controlled and varied, it is possible to reproduce virtually any spectral color in the central area of the overlap.
All video images are reconstructed using the three component colors of RGB. Because these three colors can be additively combined to mimic all other spectral colors, they are commonly referred to as the three additive primary colors. These three colors, RGB, are the colors of the phosphors used to create full color images on the face of a video monitor (Fig. 3.16). The colors yellow (Ye), cyan (Cy), and magenta (Mg) also play an important role in video imaging and are referred to as complementary colors. Commercial videoendoscopes currently use two different systems for recreating color. The first commercial video image endoscope, the VideoEndoscope introduced by Welch Allyn in 1983, was based on an RGB sequential imaging system.5 Many current instruments continue to use this system. The second system, the so-called color-chip endoscope, has now become the predominant system worldwide. Each color reproduction system has its own advantages and disadvantages, as explained later.
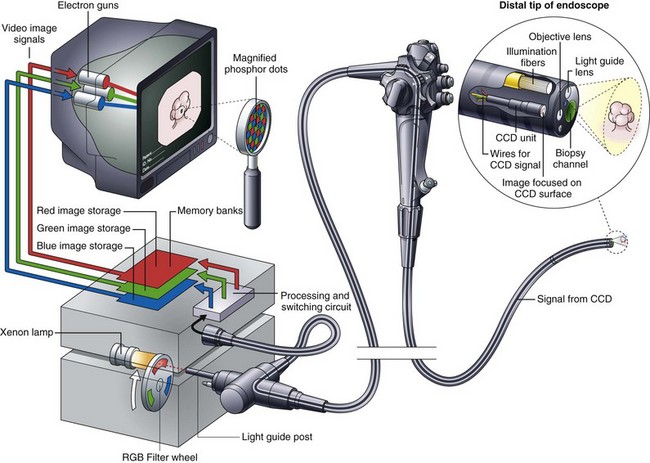
Red, Green, and Blue Sequential Imaging (“Color Wheel”)
The components of an RGB sequential videoscope system are schematically illustrated in Fig. 3.16. The endoscope has a monochromatic (black and white) CCD mounted in its distal tip. The objective lens at the tip of the endoscope focuses a miniature image of the endoscope’s field of view on the photosensitive surface of this CCD. This image is illuminated via a fiberoptic bundle running through the endoscope. This fiberoptic bundle carries light from a lamp within the light source to the distal tip of the endoscope. In contrast to the light used for fiberoptic endoscopes or the light used for color-chip endoscopes, this light is not continuous but is strobed or pulsed. The high-intensity xenon lamp within the light source emits continuous white light with the approximate color temperature of sunlight. A rotating filter wheel with three colored segments (RGB) is placed between this lamp and the light guide post of the endoscope. This filter wheel chops and colors the light falling on the light guide bundle into alternating bursts of red, black (no light), green, black, blue, and black. When observed at the distal tip of the endoscope, this illumination appears to the eye to be a flickering white light, rather than the actual sequential bursts of RGB. Rotating at 20 to 30 revolutions/sec, these three primary colors appear to merge, creating white illumination when observed with the unaided eye.
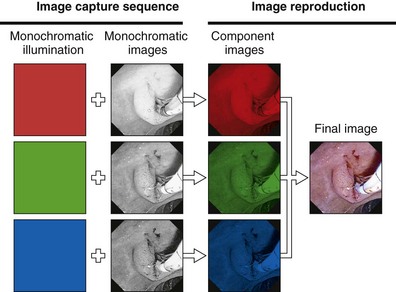
The purpose of this unique illumination system is to produce three separate monochromatic images, each obtained when the field of view is sequentially illuminated by the three primary colors in turn. During the fraction of a second when the red filter is in the light path, the GI mucosa is illuminated only by red light. The CCD image sensor captures a monochromatic (black and white) image of the mucosa as it appears under this red illumination (Fig. 3.17). Tissue that is naturally reddish in color reflects heavily under red light and appears to be bright. Areas of the tissue with less red reflect red light weakly and appear dark under red illumination. After a monochromatic image of the mucosa is obtained under red illumination, the filter wheel rotates to the adjacent opaque area of the wheel. At this point, the endoscopic illumination goes momentarily dark, and the image on the CCD is read out, directed through a processing and switching circuit, and stored in the “red image” memory bank of the videoprocessor (see Fig. 3.16). After the red image is stored, the filter wheel rotates to place the green filter in the light path. A monochromatic image of the mucosa as it appears under green illumination is obtained by the CCD (see Fig. 3.17). This image is read out and sent to the videoprocessor for storage in the “green image” memory bank. In a similar manner, a third monochromatic image is obtained when the filter wheel rotates to the blue segment. This image is correspondingly stored in the “blue image” memory bank. This sequence of capturing a set of images for each of the three primary colors is repeated 20 to 30 times each second—the precise speed being determined by the specifications of the videoprocessor. Synchronization circuitry matches the rotation of the filter wheel with the readout of the CCD and sequences the switching circuit to direct each new image to the proper memory bank.
Color-Chip Imaging
As an alternative to the RGB sequential imaging system, some videoendoscopes use a color-chip imaging system. A color-chip CCD is essentially a black and white image sensor with a custom-fabricated, multicolored microfilter bonded to its surface. This filter allows the CCD to resolve directly and simultaneously the component colors of the image. The term instantaneous single-plate CCD is sometimes used for this device to emphasize that all three color components are obtained concurrently by a single “plate,” or CCD. A color-mosaic filter of the type shown in Fig. 3.18 is commonly used in color-chip CCDs. It is possible to design a mosaic filter with myriad different color configurations; however, the color choices shown in Fig. 3.18 are very common. The colors used in this mosaic filter are yellow, cyan, magenta, and green (Ye/Cy/Mg/G). These segments are arranged in a 2 × 2 pixel box pattern that regularly repeats over the face of the CCD.
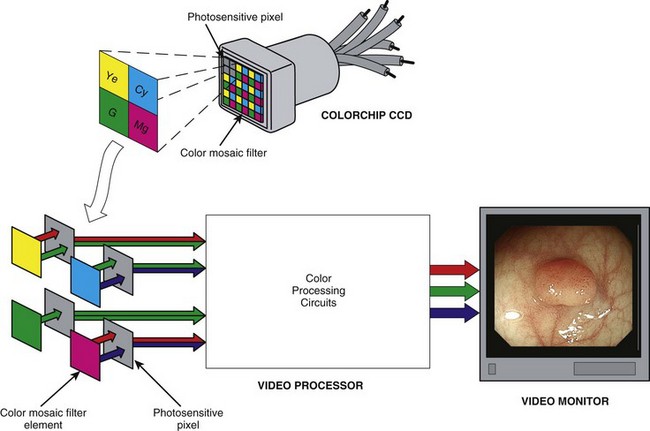
Because the final output signals sent to the video monitor must be the standard RGB component images, the image produced behind this Ye/Cy/Mg/G filter must be converted into its primary RGB components before display. This conversion is done by adding and subtracting information from neighboring pixels until the specific values for RGB are calculated for each pixel in the sensor. As Fig. 3.19 illustrates, yellow filter elements absorb blue light but pass red and green light; this enables the pixels behind all yellow filter elements to receive both red and green information. Fig. 3.19 also shows that pixels behind cyan filter elements receive both blue and green portions of the color spectrum. Magenta pixels receive both red and blue light. In a representative block of four Ye/Cy/Mg/G pixels, two pixels receive red information, three pixels receive green information, and two pixels receive blue information (see Fig. 3.18).
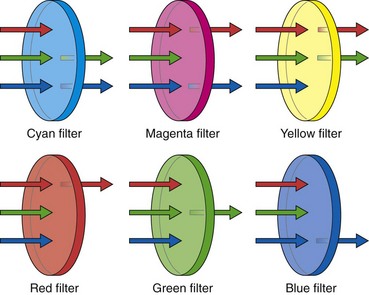
When RGB filter segments are used, each pixel is filtered to receive only one of the three primary colors (see Fig. 3.19). A cyan-filtered pixel is exposed to both blue and green light. It is more heavily illuminated than a pure blue or pure green pixel. Likewise, pixels behind a yellow filter (red + green) or a magenta filter (blue + red) receive more photons (light) than pixels behind a pure RGB filter. Because of the increased light intensity passing through a Ye/Cy/Mg/G mosaic filter, a CCD with this construction exhibits far greater light sensitivity. The clear advantage of complementary colored mosaic filters is that because of the increased light sensitivity, these filters allow the videoscope designer to construct an endoscope with a smaller light guide fiber bundle, to maximize the angle of view of the endoscope and to increase the depth of field of the endoscope. All of these features improve performance, but each requires additional light. For this reason, all commercial color-chip endoscopes use complementary color mosaic CCDs.
 second (with a 30-rps filter wheel) to capture the three component images that make up a single video image. If there is relative motion between the endoscope and the object being viewed, as often occurs during endoscopy, the three component images may differ slightly with respect to object size and position. When these three RGB images are subsequently superimposed on the video monitor, they are likely to be misaligned. This misalignment is clearly visible if the endoscopist happens to freeze the image while it is moving rapidly. Although the RGB sequential videoscope has difficulty reproducing motion, the color-chip videoscope is excellent at imaging moving tissue because all three color components of the image are captured simultaneously. Because the illumination is continuous and nonstrobed and the frame rate is consistent with contemporary television standards, reproduction of moving images with a color-chip videoscope is smooth and natural.
 second. Although this time period is relatively short, quickly moving subjects that are frozen may appear to be slightly blurred (but with no color separation) because of movement during the capture period. To reduce this blur, it is advantageous to shorten the electronic capture period to a fraction of its normal time (e.g., from
  second to
  second). As in traditional film photography, the shorter the exposure period, the sharper the subject, but the more brightly the subject must be illuminated to prevent underexposure. The fast-shutter mode found on many color-chip endoscopes may not provide enough light for distant panoramic images, but in situations in which it is truly needed, the fast-shutter capture mode is very effective at producing bright, sharp, frozen images (i.e., close-up still images of quickly moving mucosa).
Advantages of a Color-Chip Videoscope
The color-chip videoscope has several inherent advantages over the RGB sequential system (Table 3.1). Advantages discussed previously include (1) a smooth, natural reproduction of motion; (2) the absence of color separation on frozen images; and (3) a fast-shutter mode that prevents image blur of even the fastest moving subjects. Additional advantages include (4) compatibility with standard (nonstrobing) xenon light sources, (5) increased transillumination, and (6) superior performance during laser therapy. With RGB sequential endoscopes, abdominal transillumination is problematic because its strobed light output is substantially weaker than that of nonstrobed systems. Many RGB sequential light sources have a means for temporarily removing the spinning filter wheel from the light path when operating in the “transillumination” mode. A steady, intense white light that is ideal for transillumination is produced. However, once the filter wheel is removed, the image is lost because in most cases the illumination is so intense that it saturates the CCD, producing a largely white image. Even if an image is visible, it is in black and white because the filter wheel must be in its proper position to reproduce color.
Table 3.1 Advantages and Disadvantages of Videoscope Imaging Systems
| Advantages | Disadvantages |
|---|---|
| COLOR CHIP SYSTEM | |
| Smooth, natural reproduction of motion | Difficult to adapt to color analysis research |
| No color separation on captured images | |
| Fast shutter mode prevents image blur even when subject is moving | |
| Uses standard (nonstrobing) xenon light source | |
| Transillumination is possible under normal viewing conditions | |
| Superior performance during laser therapy | |
| RGB SEQUENTIAL SYSTEM | |
| High-resolution image possible | Image slip between RGB component images |
| Each pixel images all three colors | “Rainbow effect” on rapidly moving objects |
| Advanced color analysis is possible by changing filters | Requires strobed light source |
| Laser therapy is hindered by white aiming beam and image “bloom” | |
| Transillumination requires removing filter wheel and produces a black and white image | |
RGB, Red, green, and blue.
Narrow Band Imaging with a Red, Green, and Blue Sequential Videoscope
In recent years, Olympus (Tokyo, Japan) has introduced videoendoscopy systems with a new observation mode called narrow band imaging (NBI).6–9 The purpose of this feature is to enhance the observation of mucosal surface detail (e.g., pit patterns) and to increase the contrast between microvascular structures and the surrounding tissue through the selective manipulation of the imaging of hemoglobin. Hemoglobin is a major chromophore in tissue. Fig. 3.20 shows the relative absorbance of light by oxyhemoglobin over the visible spectrum. Peak absorption occurs at 415 nm (blue light). A secondary peak is observed around 540 nm (green light). It is clear from Fig. 3.20 that hemoglobin reflects rather than absorbs red light, giving hemoglobin its characteristic color. Using such information regarding the characteristic absorbance of hemoglobin, it is possible to design an imaging system that increases image contrast based on the relative presence or absence of hemoglobin in the tissue being endoscopically studied.
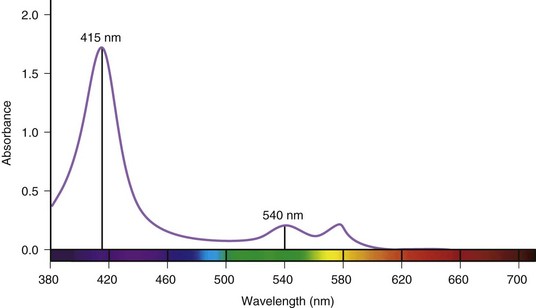
Fig. 3.21 schematically illustrates the implementation of NBI imaging in an RGB sequential videoscope system. The light source has the same xenon lamp and the same rotating RGB filter wheel as the standard endoscopy system illustrated in Fig. 3.16. However, for NBI imaging, a special NBI filter has been temporarily placed in front of the xenon lamp. This device filters the broad-spectrum white light produced by the xenon lamp (Spectrum 1 in Fig. 3.21) and allows only a very narrow band of blue light with wavelengths centered around 415 nm and a very narrow band of green light with wavelengths centered around 540 nm to pass through the filter (Spectrum 2 in Fig. 3.21). It is this use of narrow bands of light (i.e., very limited wavelengths of light) to illuminate the tissue that gives NBI its name.
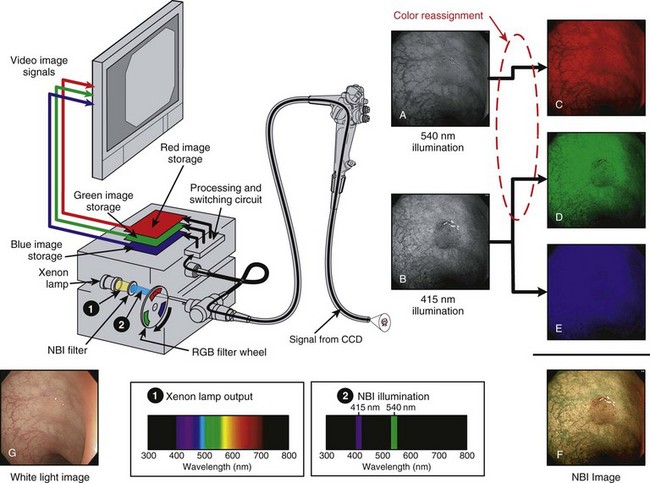
Fig. 3.21 Narrow band imaging (NBI) with red, green, and blue (RGB) sequential videoendoscope system.
(Endoscopic images courtesy of Y. Sano and S. Yoshida.)
The imaging sequence of an RGB sequential NBI system is as follows: When the red filter segment is in the light path, no light enters the endoscope because there is no red light in the NBI-filtered light. No image is created, and no image is stored at this point. The filter wheel rotates to the green filter segment. The green light (540 nm) passing through the NBI filter also passes through the green segment of the rotating filter wheel, passes through the endoscope, and illuminates the tissue. (The 415-nm blue light emitted by the NBI filter is blocked by the green filter in the rotating filter wheel.) A monochromatic (black and white) image of the tissue as it appears under this narrow band of 540-nm green illumination is captured by the CCD (see Fig. 3.21A); however, rather than storing this image in the expected green image memory bank, the videoprocessor switching circuit sends the 540-nm image to the empty red image storage bank (see Fig. 3.21C). This action is an intentional reassignment of color.
Finally, the filter wheel rotates to the blue filter segment. This filter segment passes the 415-nm blue light from the NBI filter, and the tissue is illuminated by a narrow spectrum of blue light centered at 415 nm. The CCD captures a black and white image of the mucosa as it appears under 415-nm illumination (see Fig. 3.21B), and the videoprocessor stores the image as expected in the blue memory bank (see Fig. 3.21E). The videoprocessor also stores an identical copy of this 415-nm image in the green memory bank (see Fig. 3.21D), a second intentional reassignment of color. The red component image now consists of an image of the tissue as it appeared under 540-nm narrow band illumination (green light), and the green and blue component images now consist of images of the tissue as it reflected the 415-nm narrow band illuminating light (blue light). After one complete rotation of the RGB filter wheel and the assignment of images to each of the RGB image storage areas, the three RGB component images are sent simultaneously to the video monitor, where the three component images (see Fig. 3.21C-E) are superimposed as a final full-color NBI image (see Fig. 3.21F). This final NBI image is quite different from the image of the tissue as it would appear under normal white light illumination (see Fig. 3.21G). The color reassignment has altered the natural coloration of the tissue, and the selective illumination of the tissue using only the wavelengths that are highly absorbed by oxyhemoglobin has greatly increased the surface pattern of the mucosal lesion.
Narrow Band Imaging with a Color-Chip Videoscope
NBI can also be implemented on color-chip video platforms. Fig. 3.22 illustrates the insertion of an NBI filter in the light source of a color-chip endoscope. The NBI filter filters the broad-spectrum white light emitted by the xenon lamp (Spectrum 1 in Fig. 3.22) to the same NBI spectrum used in the RGB sequential system. Color-chip NBI illumination consists of continuous, simultaneous illumination of the tissue by 415-nm and 540-nm narrow band light. The color-chip CCD in the endoscope captures an image of the tissue reflecting under this special NBI illumination. Following image capture, the image information is processed by the videoprocessor before display. Fig. 3.23 summarizes the processing of the color-chip NBI image. The color mosaic filter on the CCD filters the image as explained earlier. However, because there are no red wavelengths in the NBI illumination, there is no red image information entering the color processing circuits in the videoprocessor—only blue and green information is available. Similar to the RGB sequential NBI system, the green color information is intentionally reassigned by the videoprocessor for display as a red component image. Also similar to the RGB sequential system, the blue image information is displayed as a blue component image and is intentionally reassigned as a green component image. When these RGB component images, as defined, are simultaneously displayed on the video monitor, the color-chip videoscope system displays an NBI image that is similar to that of the RGB sequential videoscope system.
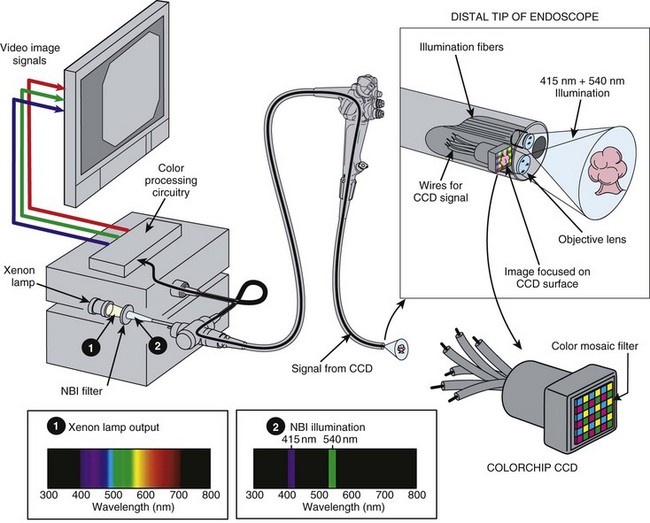
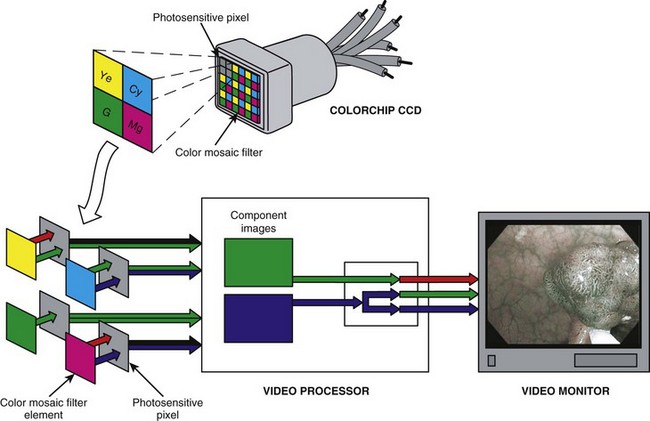
Image Processing
Postprocessing Image Enhancement
Efforts have been made more recently to manipulate the image (postprocessing) to obtain data similar to that obtained with NBI. Fujinon (Saitama, Japan) has introduced a feature called FICE (Fuji Intelligent Color Enhancement), and Pentax (Montvale, NJ) has introduced a feature called i-Scan, which intentionally manipulate the color of the endoscopic image.10–13 These postprocessing features are designed to enhance the display of mucosal blood vessels and surface structure. Olympus’ NBI feature does this through illuminating the tissue at selected wavelengths corresponding to the natural absorption of hemoglobin. FICE and i-Scan use normal white light illumination, capture a normal white light image, and perform digital manipulations on the resulting normal endoscopic image. This process is variously referred to as “optimal band imaging” or “multiband imaging.” When the endoscopic image is in a digital form, it is easy to identify the specific color of each point (pixel) in the captured image and to select only the pixels that fall within a designated color range. These selected colors can be displayed as a new image, manipulated to perform a desired enhancement, or reassigned for display as a different color.
The optimal multiband imaging presets for tissue diagnosis or differentiation are yet to be determined; however, the concept is easily illustrated. Although endoscopic diagnosis typically consists of interpreting subtle changes in the various hues of red seen in endoscopic images, postprocessing is more easily shown using a photograph containing vivid colors; Fig. 3.24A is such an image of a hot-air balloon launch. Once the image is in digital form, it is easy for a software algorithm to select and extract only certain specific hues from the image. In the case of Fig. 3.24B, the software (Adobe Photoshop) has selected a specific range of blues and a specific range of greens as colors of interest. This range of colors could be chosen to be very narrow (e.g., a certain shade of dark blue) or could be chosen to be very broad (e.g., ranging from light blue to dark blue). These selected colors can be displayed as they would normally appear or reassigned to a different color to create added emphasis. In Fig. 3.24C, the selected blue colors were reassigned to be green, and the selected green colors were reassigned to be blue.
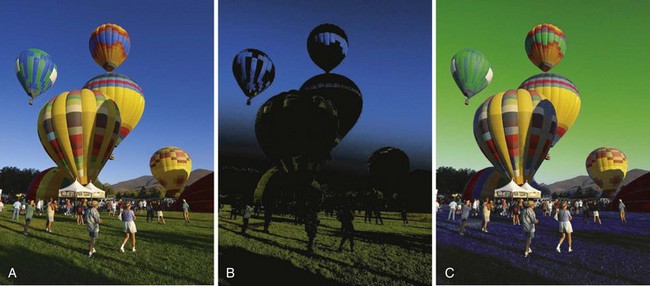
As one can imagine, the ways in which images can be manipulated by digital postprocessing are endless. However, in every case, the colors of the original white light image are being manipulated. NBI manipulates the interaction of the illuminating light with the tissue itself by illuminating the tissue with only specific wavelengths that achieve the desired contrast change in the tissue. In the postprocessing example shown in Fig. 3.24C, although the software effectively exchanged the colors of the sky and the grass, it also changed the colors of other objects in the scene that had similar colors in the white light image (e.g., the blue band on the highest central balloon). If certain endoscopic structures, such as capillaries, glands, and pits, always had a unique characteristic color, it would be possible to design a software algorithm to identify and enhance them. Although no image processing schema has been validated or standardized for routine clinical use, research is ongoing to identify valuable algorithms.
Endoscopic Ultrasound Instrumentation
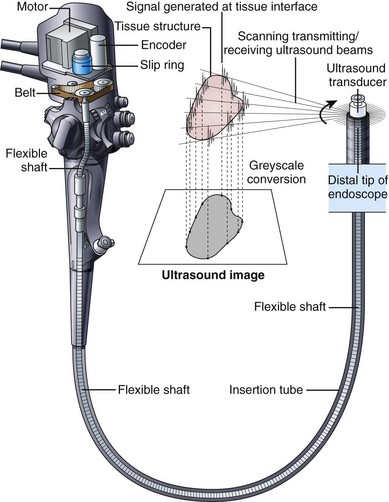
To achieve good acoustic coupling, EUS instruments typically have a water-filled latex balloon at their tip. The injection and removal of water from this balloon requires an additional balloon inflation channel running the length of the insertion tube and additional controls (special valves) to fill and empty the balloon. EUS instruments employ either mechanical scanning or electronic scanning technology to create their ultrasound image. The earliest EUS endoscopes used a single piezoelectric transducer that was mechanically rotated around an axis parallel to the central axis of the endoscope (Fig. 3.25). A 360-degree radial ultrasound image plane was created that was perpendicular to the axis of the endoscope, with the endoscope itself located at the center of the image. Mechanical radial EUS endoscopes typically operate at 7.5 to 20 MHz, and for 2 decades these were the primary diagnostic EUS instruments because of their conveniently oriented image plane and their high-resolution EUS image.
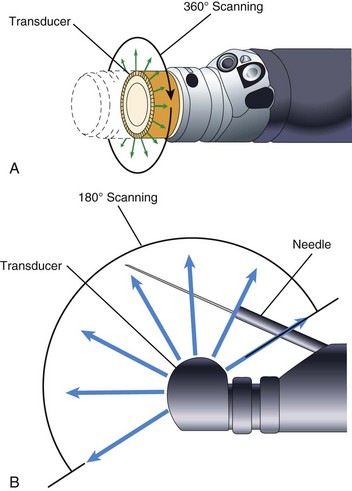
In 2003, Pentax introduced an electronic radial image echoendoscope. This was the first radial scanning instrument to provide complex ultrasound features such as Doppler image capability. The image was limited to a 270-degree sector, however. Subsequently, Olympus introduced a radial scanning EUS endoscope that employed a full 360-degree array of piezoelectric transducers in lieu of the single mechanically rotated crystal (Fig. 3.26A). Electronic radial scanning instruments by Pentax and Olympus have now supplanted the older mechanical scanning design. In the early 1990s, Pentax introduced the first electronic scanning EUS endoscope that employed a curvilinear transducer array. This instrument produced an image plane aligned with the long axis of the endoscope and for the first time allowed practical fine needle aspiration (FNA) because the entire needle tip lay within the EUS image plane. In contrast to mechanical scanning instruments, electronic scanning endoscopes are capable of color Doppler (a function that shows the direction and the average velocity of blood flow) and power Doppler (a function that has increased sensitivity for measuring the velocity of flow but that provides no information on the direction of flow). Curvilinear array endoscopes typically have a 150-degree to 180-degree angle of view (ultrasound image) and operate with a transducer frequency of 5 to 10 MHz. The optical direction of view is in a forward oblique direction and aligned in the general direction of the FNA needle (Fig. 3.26B). An elevator in the distal tip of the endoscope allows up-and-down movement of the needle, with the elevator being similar to the elevator on a duodenoscope but with a more limited range of motion.
Factors to Consider When Evaluating a Video Image Endoscope
A video image endoscope is a technologically advanced and complex clinical tool. When these instruments first entered the market, published comparison reports of various commercially available models were common.14–16 Now that the technology of videoendoscopy has matured, such published technical comparisons are rare, but summaries of the specifications of commercially available models are periodically published.17–19 It is difficult to identify any single design criterion as the deciding factor in selecting the best videoscope for a particular clinical application. When evaluating a videoendoscope, the following criteria should be considered:
Capsule Endoscopy
The past decade has witnessed the remarkably rapid development and clinical acceptance of capsule endoscopy. The first experiments in animals were published in the journal Nature in 2000,20 and clinical trials for GI bleeding of obscure origin were first reported in the literature in 2001.21,22 Capsule endoscopy has been a major development in the trend toward minimally invasive examination of the GI tract. Currently, a capsule endoscopy system comprises three distinct components: (1) the capsule, (2) the data receiving and storage system, and (3) a workstation for image review and analysis.
The first capsule cleared by the U.S. Food and Drug Administration (FDA) (August 2001) for small bowel observation was the M2A capsule by Given Imaging, Inc. (Yoqneam, Israel). The capsule was 11 mm in diameter and 26 mm long. The capsule and its component parts are illustrated in Fig. 3.27. One end of the capsule has a clear optical dome, behind which sits the imaging system. The capsule is symmetric in shape and small enough to tumble in the intestine; it images the mucosa proximally or distally in a random fashion as it traverses the GI tract. Behind the clear dome is an aspheric lens with four light-emitting diodes (LEDs) arranged around it. The lens focuses the image onto a complementary metal oxide semiconductor (CMOS) imager. Behind this are two silver oxide batteries, sufficient to power the LEDs, the imager, and the transmitter for at least 8 hours. A transmitter and antenna are located at the back of the capsule. The capsule is packaged adjacent to a magnet. Removal of the capsule from the magnet trips a switch, activating the LEDs and starting the image transmission. Two images are captured and transmitted each second, synchronized with illumination from the flashing LEDs. The small amount of illumination from the LEDs is adequate because the bowel is collapsed (i.e., no air insufflation is added) and the observed tissue is very close to the optical dome.
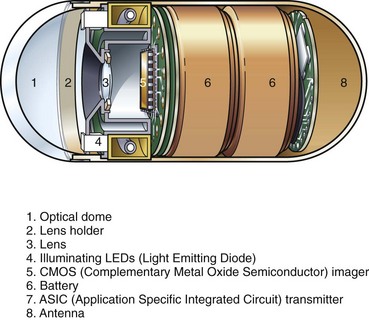
Fig. 3.27 Schematic of Given Imaging M2A capsule.
(Redrawn from Pillcam, Given Imaging, Yoqneam, Israel.)
Given Imaging has launched an updated small bowel capsule called the PillCamSB. Olympus has launched a similar small bowel capsule called the EndoCapsule.23 All three capsules are exactly the same size. The more recent capsules have improved image resolution, a wider angle of view, six LEDs instead of four, and improved workstation software. Some systems also offer a real-time viewer. The Olympus EndoCapsule uses a CCD image sensor in place of the CMOS image sensor in the Given Imaging capsules. During capsule endoscopy, the patient has a series of eight sensors taped to the anterior abdominal wall. These sensors detect the signal transmitted from the capsule. By measuring the relative strength of the signal from different sensors, the approximate location of the capsule within the abdominal cavity can be determined. The workstation software displays the path taken by the capsule alongside the capsule image. The sensor leads connect to a small data recorder worn on a belt. The belt apparatus is relatively light and does not significantly impede normal nonexertional activities. The patient can ambulate and need not remain in the hospital during the recording phase of the examination. After the examination, the sensors and belt are removed from the patient. The recorded data are downloaded to a computer workstation, which converts the approximately 50,000 images of the study into a video file that is stored on the computer’s hard drive. The study is viewed on the workstation screen as a video at speeds determined by the reviewer.
1 Moriyama H. Engineering characteristics and improvement of colonoscope for insertion. Early Colorectal Cancer. 2000;4:57-62.
2 Moriyama H. Variable stiffness colonoscope—structure and handling. Clin Gastroenterol. 2001;16:167-172.
3 Kawahara I, Ichikawa H. Flexible endoscope technology: The fiberoptic endoscope, ed 2. Sivak MVJr, editor. Gastroenterologic endoscopy, vol 1. Philadelphia: WB Saunders. 2000:16-28.
4 Barlow DE. Flexible endoscope technology: The video image endoscope, ed 2. Sivak MVJr, editor. Gastroenterologic endoscopy, vol 1. Philadelphia: WB Saunders. 2000:29-49.
5 Sivak MVJr, Fleischer DE. Colonoscopy with a video endoscope: Preliminary experience. Gastrointest Endosc. 1984;30:1-5.
6 Gono K. An introduction to high-resolution endoscopy and narrowband imaging. In: Cohen J, editor. Advanced digestive endoscopy: Comprehensive atlas of high resolution endoscopy and narrowband imaging. Oxford: Blackwell Publishing; 2007:9-22.
7 Gono K, Obi T, Ohyama N, et al. Appearance of enhanced tissue features in narrow-band endoscopic imaging. J Biomed Opt. 2004;9:568-577.
8 Atkinson RJ, Hurlstone DP. Narrow-band imaging: The next frontier in colonoscopy? Gastrointest Endosc. 2007;66:317-319.
9 Lambert R, Kuznetsov K, Rey JF. Narrow-band imaging in digestive endoscopy. Sci World J. 2007;7:449-465.
10 Togashi K, Osawa H, Koinuma K, et al. A comparison of conventional endoscopy, chromoendoscopy, and the optimal-band imaging system for the differentiation of neoplastic and non-neoplastic colonic polyps. Gastrointest Endosc. 2009;69:734-741.
11 ASGE Technology CommitteeWong Kee Song LM, Adler DG, Conway JD, et al. Narrow band imaging and multiband imaging. Gastrointest Endosc. 2008;67:581-589.
12 Osawa H, Yoshizawa M, Yamamoto H, et al. Optimal band imaging system can facilitate detection of changes in depressed-type early gastric cancer. Gastrointest Endosc. 2008;67:226-234.
13 Kawahara Y, Okada H, Kawano S, et al. New digital imaging technology I-Scan for upper GI endoscopy: A pilot study [abstract]. Gastrointest Endosc. 2009;69:A-377.
14 Knyrim K, Seidlitz H, Vakil N, et al. Optical performance of electronic imaging systems for the colon. Gastroenterology. 1989;96:776-782.
15 Schapiro M. Electronic video endoscopy: A comprehensive review of the newest technology and techniques. Pract Gastroenterol. 1986;10:8-18.
16 Video colonoscope systems. Health Devices. 1994;23:154-205.
17 ASGE Technology CommitteeKwon RS, Adler DG, Chand B, et al. High-resolution and high-magnification endoscopes. Gastrointest Endosc. 2009;69:399-407.
18 ASGE Technology CommitteeDiSario JA, Petersen BT, Tierney WM, et al. Enteroscopes. Gastrointest Endosc. 2007;66:872-880.
19 ASGE Technology CommitteeTierney WM, Adler DG, Chand B, et al. Echoendoscopes. Gastrointest Endosc. 2007;66:435-442.
20 Iddan G, Meron G, Glukhovsky A, et al. Wireless capsule endoscopy. Nature. 2000;405:417.
21 Appleyard M, Fireman Z, Glukhovsky A, et al. A randomized trial comparing wireless capsule endoscopy with push enteroscopy for the detection of small-bowel lesions. Gastroenterology. 2000;119:1431-1438.
22 Appleyard M, Glukhovsky A, Swain P. Wireless-capsule diagnostic endoscopy for recurrent small-bowel bleeding. N Engl J Med. 2001;344:232-233.
23 Cave DR, Fleischer DE, Leighton JA, et al. A multicenter randomized comparison of the Endocapsule and the Pillcam SB. Gastrointest Endosc. 2008;68:487-494.
[/level-membership-for-gastroenterology-and-hepatology-category][not-level-membership-for-gastroenterology-and-hepatology-category]
Chapter 3 How Endoscopes Work
Overview
The flexible videoendoscope embodies more than 3 decades of refinements in solid-state imaging and mechanical design. Many different models are available, each having slightly different features and each optimized for the portion of the gastrointestinal (GI) tract that it is designed to examine. Although alternative designs for the control section of the endoscope have been proposed (e.g., “pistol-grip”), the basic shape and layout of the instrument are relatively unchanged since flexible endoscopes were first introduced. The basic components and controls of all flexible videoendoscopes are quite similar (Fig. 3.1).
Insertion Tube
Endoscope manufacturers have put significant effort into refining the construction of the insertion tube and selecting ideal materials. Fig. 3.2 shows the internal components of a typical colonoscope. The insertion tube usually contains (1) tubes for suction (biopsy), air, and water feeding; (2) often an additional tube for a forward water jet; (3) four angulation control wires; (4) fine electrical wires connecting the charge-coupled device (CCD) image sensor at the distal tip of the endoscope to the videoprocessor; and (5) delicate glass fibers for bringing light from the light source to the distal end of the endoscope. Colonoscopes with adjustable insertion tube flexibility have an additional component—a tensioning wire to control insertion tube stiffness. Duodenoscopes also have an additional wire/coil sheath running the length of the insertion tube for controlling the up-and-down position of the forceps elevator (see later discussion). It is the task of the endoscope designer to pack all of these individual components into the smallest space possible while still providing freedom for the components to move about without damaging the more fragile elements (CCD wires, fiberoptic strands) as the instrument is torqued and flexed during use. A dry powdered lubricant is applied to all internal components to reduce the stress that they place on each other during manipulation of the insertion tube.
Insertion Tube Flexibility
As previously mentioned, the handling characteristics of the insertion tube are extremely important, particularly for colonoscopes. For easy insertion, the instrument must be capable of accurately transmitting all of the subtle movements and torque applied by the endoscopist. Any rotation that the endoscopist applies to the proximal portion of the shaft (torque) must be transferred to the distal tip of the instrument in a 1 : 1 ratio, although this capability is lost when the instrument is looped. The torquing ability of the instrument is facilitated by flat, spiral metal bands that run just under the skin of the insertion tube (see Fig. 3.2). Because these bands are wound in opposite directions, they lock against one another as the tube is torqued, accurately transmitting rotation of one end of the tube to the other. At the same time, gaps between these spiral bands allow the shaft to flex freely. The bands also give the insertion tube its round shape. Their stiffness prevents the internal components of the insertion tube from being crushed by external forces. These spiral bands are covered by fine strands of stainless steel wire, braided into a tubular mesh. A plastic polymer layer, typically black (or dark green on colonoscopes), is extruded over this wire mesh to create the smooth outer surface of the insertion tube. The polymer layer provides an atraumatic, biocompatible, and watertight surface for the insertion tube. It is usually marked with numbers to gauge the depth of insertion.
Obtaining the best combination of flexibility, elasticity, column strength, and torquing ability is the art and science of insertion tube design. Improvements in one of these characteristics often negatively affect one or more of the others. The final design is usually a compromise between these ideal characteristics, confirmed by months of clinical testing. To improve insertion further, the flexibility of both gastroscope and colonoscope insertion tubes typically varies from end to end. As Fig. 3.3 illustrates, the distal 40 cm of a colonoscope insertion tube is significantly more flexible than the proximal portion. This variation in flexibility is achieved by changing the formulation of the tube’s outer polymer layer as it is extruded over the wire mesh during manufacturing. As Fig. 3.4 illustrates, the extruder contains two types of resins, one significantly harder than the other. Initially, as the distal end of the insertion tube passes through the machine, a layer of soft resin is applied to the distal 40 cm of the wire mesh. This soft resin is gradually replaced by the hard resin within a transition zone near the middle of the tube. The proximal portion of the insertion tube (50 to 160 cm) is constructed of only the hard resin.1 The end result is an insertion tube that has a soft distal portion for atraumatically snaking through a tortuous colon, with a stiffer proximal portion that is effective at preventing loop reformation in the portions of the colon that have already been straightened by the colonoscope.
Adjustable Flexibility
Clinical experience has shown that endoscopists often disagree over what constitutes the ideal insertion tube. This disagreement may be due to differences in training, insertion technique, or past experience. In addition, some endoscopists have expressed a desire to change the characteristics of the insertion tube during the procedure, based either on insertion depth or on the patient’s anatomy, which has led to the development of an insertion tube with adjustable stiffness.2
Colonoscopes with adjustable stiffness have a tensioning wire that runs the length of the insertion tube (see Fig. 3.2). The amount of tension in this wire is controlled by rotating a ring at the proximal end of the insertion tube, just below the control section (Fig. 3.5). When the pull wire in this stiffening system is in the “soft” position, the stiffening system provides no additional stiffness to the insertion tube beyond that provided by the wire mesh and polymer coat. As Fig. 3.5 illustrates, when the control ring is rotated to one of the “hard” positions, an angled slot in the control ring pulls on the slide pin at the end of the pull wire, stretching the pull wire and placing it under heavy tension. This tension stiffens the coil wire that surrounds the pull wire and adds significant rigidity to the insertion tube. As Fig. 3.3 illustrates, although the base stiffness of the insertion tube is established by varying the mixture of hard and soft resins in the polymer base layer, the insertion tube can be stiffened further at will during the procedure by rotating the stiffness control ring. The variable stiffness mechanism does not run the entire length of the insertion tube so that the distal portion of the endoscope is not affected.
Distal Tip
Fig. 3.6 illustrates the components found in the distal tip of a typical end-viewing endoscope, such as a gastroscope or colonoscope. The larger of the circular glass lenses on the distal tip is the objective lens. This lens focuses a miniature image of the GI mucosa on the surface of a solid-state CCD image sensor. The image sensor sends a continuous stream of images back to the videoprocessor via a collection of very fine electrical wires. The objective lens and CCD unit are tightly sealed to prevent condensation from fogging the image and to protect the imaging system from damage if fluid were to enter the instrument accidentally. Light to illuminate the interior of the body travels through the instrument via fiberoptic illumination fibers. This light is evenly dispersed across the endoscope’s field of view via a light guide lens system.
Some endoscopes have a single illumination system (as shown in Fig. 3.6). Other endoscope models have two fiberoptic bundles and two light guide lenses to improve illumination on both sides of the biopsy forceps (e.g., snare) and to facilitate the packing of components within the insertion tube. The channel used for biopsy and suction exits close to the objective lens on the distal tip. The position of the biopsy channel relative to the objective lens determines how accessories appear in the image as they enter the visual field. On some instruments, the snare or biopsy forceps appears to emanate from the lower right corner of the image; on other instruments, these accessories enter the visual field from the lower left corner, and so forth. When planning difficult procedures, such as piecemeal polypectomy or hemostasis, it is crucial that the endoscopist know where the accessories will enter into his or her field of view.
The insertion tube also contains small tubes that carry air and water through the instrument (see Fig. 3.2). These tubes typically merge into a single tube a few inches from the distal tip (see Fig. 3.9 further on). This combined air/water tube connects to the air/water nozzle on the tip of the instrument. Under control of the endoscopist, water can be fed across the objective lens to clean it, or air can be fed from the nozzle to insufflate the GI tract. Some gastroscopes and colonoscopes have an additional water tube and a water-jet nozzle on the distal tip for washing debris from the mucosa (see Fig. 3.6).
Fig. 3.7 illustrates the components found in the distal end of a typical duodenoscope. Fig. 3.7A is a schematic cross section through the optical and illumination systems found in the distal tip of the duodenoscope. The objective lens for viewing the tissue is now located on the side of the distal end rather than on the very tip of the instrument. A prism is used to deflect the angle of view 90 to 105 degrees and to convert the instrument into a side-viewing endoscope. The illumination fibers are likewise steeply bent at the tip of the instrument, directing the light to emanate from the side. As in end-viewing instruments, an air/water nozzle positioned near the objective lens directs water across the lens to clean it, followed by air to blow away any remaining water droplets. Air from this nozzle is also used to insufflate the patient. All duodenoscopes have a forceps elevator to deflect actively the tip of any accessory passed through the channel. The elevator mechanism is shown in Fig. 3.7B. This elevator normally lies in a recess within the tip of the endoscope (lowered position). When the endoscopist wishes to raise the accessory up into the field of view, he or she operates a thumb control on the control section of the instrument (not shown). This thumb control pulls on the elevator wire, lifting the elevator out of its recess into a raised position, deflecting the tip of the accessory up into the field of view. In some instruments, such as the V-scope (Olympus Corp, Melville, NY), this elevator has a small groove that entraps a 0.035-inch guidewire to aid in wire stabilization during accessory exchanges.
Bending Section and Tip Angulation
The distal tip of the insertion tube of the endoscope can also be manipulated by the endoscopist. The deflectable portion, referred to as the bending section, is constructed differently from the rest of the insertion tube. As Fig. 3.8 illustrates, the bending section is composed of a series of oddly shaped metal rings, each one connected to the ring on either side of it via a freely moving joint. These joints are constructed using a series of pivot pins, each one displaced from its neighbors by 90 degrees. One set of pivots allows the bending section to curl in the up-and-down direction. A second set allows the bending section to curl in the right-and-left direction. Together, they enable the bending section to curl in any direction. The direction of the curl is controlled by four angulation wires that run the length of the insertion tube (see Fig. 3.2). These four wires are firmly attached to the tip of the bending section at the 3 o’clock, 6 o’clock, 9 o’clock, and 12 o’clock positions. Pulling on the wire attached at the 12 o’clock position causes the bending section to curl in the up direction and achieves what endoscopists refer to as “up tip deflection.” Pulling on the wire attached at the 3 o’clock position causes right tip deflection. Pulling the other two wires causes down and left deflection. The endoscopist is able to pull on each of these wires in turn by rotating either the up-and-down or right-and-left angulation knobs. (For simplicity, Fig. 3.8 illustrates only the up-and-down angulation system.) Rotating the up-and-down and right-and-left knobs together produces a combined tip movement (e.g., upward and to the right) and allows the endoscopist to sweep the tip of the endoscope in any direction.
Air, Water, and Suction Systems
A schematic of a typical endoscopic air, water, and suction system is shown in Fig. 3.9. An air pump in the light source provides air under mild pressure to a pipe protruding from the light source connector of the endoscope. This air is carried by an air channel (tube) to the air/water valve on the control section. If this valve is not covered, the air simply exits from a vent hole in the top of the valve (see Fig. 3.1). This vent hole allows the air pump to pump freely when air is not needed, reducing wear and tear on the pump. If the endoscopist wants to insufflate the patient, he or she covers the vent hole with a fingertip; this closes off the vent and forces air down the air channel, exiting the instrument through the nozzle on the distal tip. A one-way valve is incorporated into the shaft of the air/water valve (see Fig. 3.1) to hold air in the patient during examination. During endoscopy, the GI tract is typically insufflated to a pressure slightly above atmospheric pressure. If it were not for this one-way valve in the system, air from the organ under examination would flow back into the nozzle on the distal tip, up the air channel in the insertion tube, and out the hole in the air/water valve whenever the operator removed his or her finger from the valve. The antireflux valve is required to keep the patient insufflated.
Water, used to clean the objective lens during the procedure, is stored in a water bottle attached to the light source or cart (see Fig. 3.9). In addition to feeding air for insufflation, the air pump also pressurizes this water container, forcing water out of the bottle and into the endoscope. This water is carried via a tube on the water bottle cap to the light source connector of the endoscope and then by a water channel up the universal cord to the air/water valve. When the endoscopist depresses the air/water valve, water continues down the water channel in the insertion tube and flows out of the nozzle at the distal tip. The nozzle directs this water across the surface of the objective lens, cleaning it.
There are several inherent safety features in the design of the air, water, and suction system shown in Fig. 3.9. The air supply system has no moving parts and no mechanical valves that could stick in a continuously “on” position, resulting in accidental overinsufflation of the patient. Instead, the air simply exits the vent hole in the valve, unless the physician has his or her finger over this opening, and in the event that the suction system becomes obstructed and the endoscopist has difficulty with possible overinsufflation, he or she simply can quickly remove all valves from the endoscope. This action stops all feeding of air and water and allows the patient’s GI tract to depressurize through the open valve cylinders.
Illumination System
Endoscopes use an incoherent fiberoptic bundle to carry light from the external light source to the distal tip of the endoscope. This fiber bundle is composed of thousands of hairlike glass fibers (30 µm in diameter) that are optically coated to trap light within the fiber and to transmit light from end to end via a phenomenon known as total internal reflection. Light rays entering one end of such a fiber reflect off of the walls of the fiber many thousands of times before exiting the opposite end of the fiber. The types of glass used to make the core and cladding of the fiber and the thickness of the core and cladding all are carefully chosen to enable the fiber bundle to carry as much light as possible (see Kawahara and Ichikawa3 for a more complete discussion of fiberoptics).
Endoscopic light sources typically use 300-W xenon arc lamps to produce the intense, white light needed for videoendoscopy. These lamps also produce considerable heat. Heat sinks, infrared filters, and forced-air cooling systems within the light source prevent the fiber bundle of the endoscope from overheating and burning. A close inspection of the tip of the endoscope’s light guide reveals a burn-resistant quartz lens that serves to collect light from the light source lamp and to direct it into the endoscope (see Fig. 3.1). At the other end of the endoscope, the light guide lens at the distal tip of the instrument spreads this light uniformly over the visual field (see Fig. 3.6). An automatically controlled aperture (iris) in the light source controls the intensity of the light emitted from the endoscope tip.
Solid-State Image Capture
The image sensors used in videoendoscopes are typically referred to as CCDs. These sensors are solid-state imaging devices constructed of silicon semiconductor material. The silicon on the surface of the sensor is responsive to light. When a photon of light strikes the photosensitive surface of the CCD, it displaces an electron from a silicon atom at the surface. A free, negatively charged electron is produced in the silicon material along with a corresponding positively charged “hole” in the crystalline structure of the silicon where the electron was previously bound. This action is referred to as the photoelectric effect and is illustrated in Fig. 3.10. As additional photons hit the surface of the sensor, additional free electrons and additional corresponding holes are created. The charges built up in the sensor are directly proportional to the amount of light falling on the CCD. Also, these charges are created regardless of the color of the light falling on the sensor.
Although a single photosensitive element is useful for measuring the brightness of light falling on a surface (as in a light meter), it cannot reproduce an image. To reproduce an image, the photosensitive surface must be divided up into a matrix of thousands of small, independent photosites. When an image is focused on the surface of such a sensor, the brightness of the image is automatically measured at each individual photosite within the matrix. Knowing the brightness of every point in the image allows a vision system to reproduce the image accurately. The CCD is a common component of such a solid-state vision system. The surface of a CCD image sensor is divided into a rectangular array of discrete photosites, individually referred to as picture elements, or pixels. Fig. 3.11 illustrates a CCD sensor with such an array. In a video image endoscope, the CCD is located in the distal tip of the instrument directly behind the objective lens (as shown in Fig. 3.6). The objective lens focuses a miniature image of the observed mucosa directly on the surface of this sensor. The pattern of light falling on the CCD (i.e., the image) is instantly converted into an array of stored electrical charges because of the photoelectric effect previously described. Because the charges stored in each of the individual pixels are isolated from neighboring pixels, the sensor faithfully transforms the optical image into an electrical replica of the image.
