[level-membership-for-pulmolory-and-respiratory-category]
Chapter 35 Hemodynamic Monitoring in Critical Illness
 is whole-body oxygen delivery, CO is cardiac output, and Ca
Monitoring Devices
Arterial Pressure Monitoring
Noninvasive Arterial Blood Pressure Monitoring
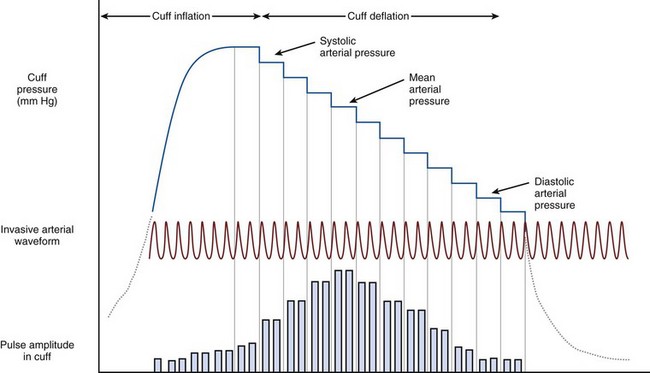
Noninvasive arterial blood pressure (NIBP) measurements in critical care most commonly are taken using an automated oscillometric device. This consists of a circumferential pneumatic cuff applied to the arm or leg. The cuff is inflated to a pressure above systolic arterial pressure, followed by controlled slow deflation of the cuff. As the cuff pressure falls below systolic arterial pressure, turbulent flow occurs in the artery beneath the cuff, causing oscillations in cuff pressure, which become maximal at MAP (Figure 35-1). Processing software allows determination of systolic, mean, and diastolic pressures in accordance with the amplitude of these oscillations.
Central Venous Catheterization
The complications of central venous cannulation are listed in Box 35-2. Despite advances in catheter technology such as antimicrobial coating, risk for microbial contamination is significant. The corresponding risk of catheter-related sepsis may be mitigated by minimizing the time during which the catheter remains in situ. The benefits of changing the catheter must be weighed against the risks associated with catheter reinsertion (Box 35-3).
Pulmonary Artery Catheterization
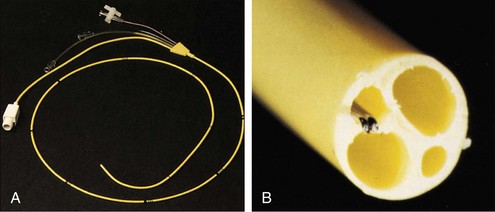
The pulmonary artery flotation catheter (PAFC) is a multilumen central venous catheter that is guided by flow to rest in the pulmonary artery (Figure 35-2). It allows measurement and derivation of a wide variety of hemodynamic variables, which are listed in Box 35-4. Indications for its use include the following:
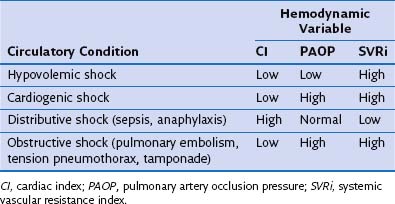
• Determination of the cause of hemodynamic insufficiency
• Discrimination between cardiogenic and noncardiogenic pulmonary edema
• Measurement of cardiac output and pulmonary artery pressures (for example, in pulmonary hypertension or hepatopulmonary syndrome)
• Guidance in use of inotrope, vasopressor, or vasodilator therapy in critical illness or after major surgery
Insertion
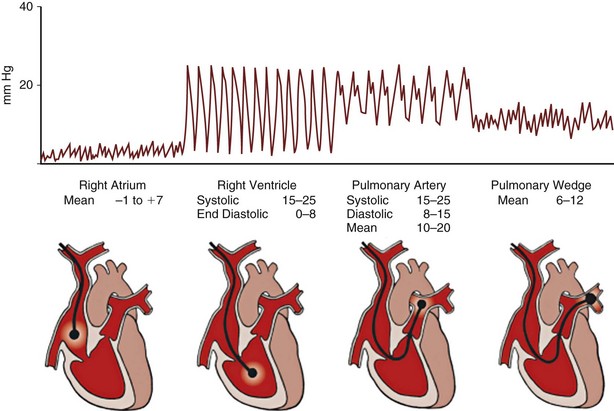
An introducer sheath is placed using a Seldinger technique into a central vein; the internal jugular and subclavian veins are most commonly used. The lumens and balloon of the PAFC should be tested before insertion. The PAFC is passed through the sheath into the right atrium with continuous pressure waveform monitoring from the distal lumen. Once in the right atrium, the balloon is inflated with 1.5 mL of air. This adjustment helps to guide the balloon along the direction of blood flow through the heart and also affords some protection to the myocardium. With careful advancement of the catheter, characteristic pressure waveforms of the right ventricle, pulmonary artery, and pulmonary artery occlusion are sequentially encountered. The waveforms observed during passage of the catheter are shown in Figure 35-3.
Measuring Pulmonary Artery Occlusion Pressure
Accurate measurement of PAOP requires readings to be taken at end expiration and end diastole. Inflation of the balloon at the tip of the PAFC effectively “wedges” the catheter tip in a branch of the pulmonary artery. This creates a continuous column of blood from the catheter tip to the pulmonary venous system. As a consequence of its proximity to the left atrium, the pressures observed can be considered to correlate with left atrial pressure. Left atrial pressure approximates to left ventricular end-diastolic pressure (LVEDP) and therefore may be considered to represent an index of preload. Many factors, including changes in intrathoracic and intraabdominal pressures, catheter position outside West zone 3, mitral valve disease, and changes in left ventricular compliance, may impair the usefulness of PAOP as a predictor of preload (Table 35-1).
Table 35-1 Complications of Pulmonary Artery Flotation Catheter (PAFC) Insertion
| Complication | Risk Factor | Prevention |
|---|---|---|
| Arrhythmia | Catheter coiling in RV Catheter reentry from PA to RV |
Ensure balloon inflation during passage from RA to PA Defibrillator/transcutaneous pacing available Minimize insertion time |
| Complete heart block | LBBB | Avoid insertion in patients with LBBB Consider pacing electrode placement |
| Catheter knotting | Dilated RV, excessive catheter length | Monitor pressure waveform during insertion; withdraw catheter if no change after advancing 15 cm Avoid forceful insertion |
| Valve damage | Knotting of catheter around papillary muscle, balloon inflation during withdrawal | Inflate balloon during forward passage and ensure balloon deflation during catheter withdrawal |
| Pulmonary infarction | Prolonged balloon occlusion, distal catheter migration, pulmonary hypertension, anticoagulation, prolonged duration of insertion | Minimize wedge procedures, <15-second balloon inflation during PAOP measurements Withdraw catheter if spontaneous wedging or wedging achieved with <1.25 mL of air |
| Pulmonary artery rupture | As for pulmonary infarction | As for pulmonary infarction |
| Air embolism | Balloon rupture | Avoid repeat attempts to inflate balloon |
| Infection | Prolonged insertion | Aseptic insertion Remove PAFC when no longer required |
LBBB, left bundle branch block; PA, pulmonary artery; PAOP, pulmonary artery occlusion pressure; RA, right atrium; RV, right ventricle.
Measuring Cardiac Output Using the Pulmonary Artery Flotation Catheter
The decrease in temperature in the pulmonary artery can be plotted against time, as shown in Figure 35-4. As the foregoing equation indicates, cardiac output is inversely proportional to the area under this curve
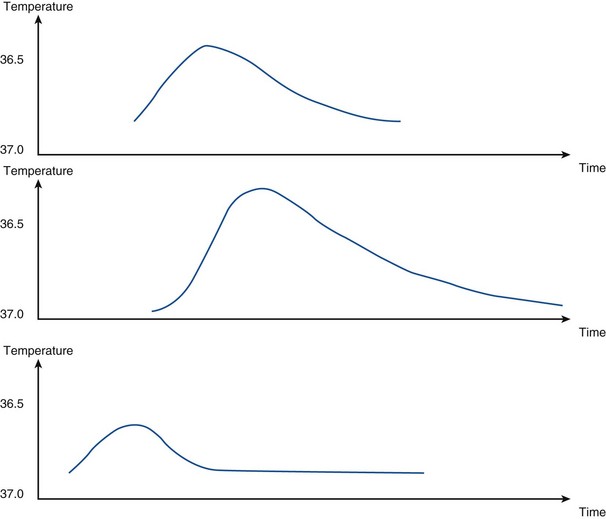
Bolus thermodilution measurements of cardiac output are repeated three times and a mean value is calculated (Box 35-5 and Table 35-2). Using a thermal indicator has several advantages over dye dilution techniques in that the indicator is nontoxic and does not accumulate or recirculate. Cold fluid does, however, cause a transient fall in heart rate, thus reducing cardiac output over the period measured.
Arterial Waveform Analysis
Transpulmonary Indicator Dilution
Transpulmonary Thermodilution With Arterial Waveform Analysis
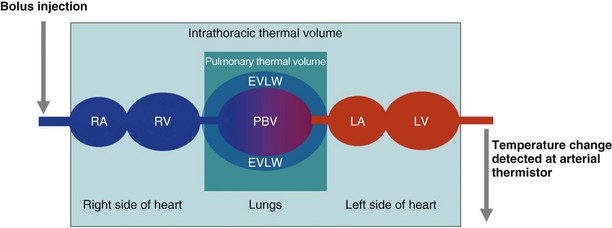
The technique of transpulmonary thermodilution with arterial waveform analysis uses a central venous bolus of cold injectate with the change in blood temperature detected at a thermistor in the femoral, axillary, or brachial artery. A temperature change–versus–time curve is constructed from which cardiac output can be calculated using the Stewart-Hamilton equation. The thermodilution curves are longer and flatter than those seen for the PAFC, which reflects their thermal equilibrium with a larger blood volume. Further analysis of the morphology of a semilogarithmic transformation of the thermodilution waveform allows calculation of intrathoracic thermal volume (ITTV) and pulmonary thermal volume (PTV). A marker of cardiac preload, the global end-diastolic volume (GEDV), is calculated from the difference between ITTV and PTV. This technique also allows calculation of the extravascular lung water, which provides information on the degree of pulmonary edema and is a correlate of the severity of illness (Box 35-6). Cardiac output calculations from the thermodilution curve are used to calibrate continuous cardiac output monitoring by pulse contour analysis (Figure 35-5).


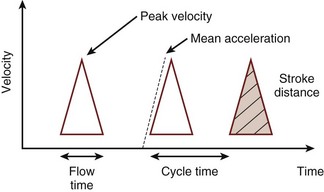
Esophageal Doppler Monitoring and Ultrasound Imaging
A flexible probe containing an ultrasound transceiver is passed into the lower esophagus, where the thoracic aorta and the esophagus are closely apposed. Ultrasound waves are emitted from the probe, which is focused on the aorta by the operator, with the probe positioned to obtain the maximum peak velocity. The change in observed frequency of the reflected ultrasound waves from the red blood cells allows calculation of blood velocity in the descending aorta. The spectrum of red cell velocities is plotted against time and displayed as shown in Figure 35-6. The esophageal Doppler monitor traces the maximum velocity waveform to permit calculating the area under this curve during systole. This area is the stroke distance, or the distance over which a column of blood moves in the aorta during systole. Aortic red blood cell velocity is measured in the descending thoracic aorta distal to the origin of the left subclavian artery. To estimate left ventricular stroke volume from this measurement, two factors must be known or otherwise accounted for: First, the cross-sectional area of the aorta is required for stroke distance to be converted into volume, and probes have been developed with an M-mode echocardiographic transducer to facilitate this step. Second, a proportion of the cardiac output has left the aorta proximal to the transducer; in a resting healthy adult, this is approximately 30% and must be compensated for. One manufacturer (Cardio-Q ODM, Deltex Medical, Chichester, United Kingdom) uses a nomogram based on the patient’s age, height, and weight to directly calibrate descending aorta blood flow velocity to total cardiac output. The process is based on in vivo measurements from an esophageal Doppler monitor and a thermodilution pulmonary artery catheter in an ICU patient population and removes the need to separately account for the fraction of cardiac output distributed into the upper body.
Bland JM, Altman DG. Statistical methods for assessing agreement between two methods of clinical measurement. Lancet. 1986;1:307–310.
Connors AFJr, Speroff T, Dawson NV, et al. The effectiveness of right heart catheterisation in the initial care of critically ill patients. SUPPORT Investigators. JAMA. 1996;276:889–897.
Dellinger RP, Levy MM, Carlet JM, et al. Surviving Sepsis Campaign: International guidelines for management of severe sepsis and septic shock 2008. Crit Care Med. 2008;36:296–327.
Erlanger J, Hooker DR. An experimental study of blood-pressure and of pulse-pressure in man. Bull Johns Hopkins Hosp. 1904;12:145–378.
Gattinoni L, Brazzi L, Pelosi P, et al. A trial of goal-oriented hemodynamic therapy in critically ill patients. N Engl J Med. 1995;333:1025–1032.
Harvey S, Harrison DA, Singer M, et al. Assessment of the clinical effectiveness of pulmonary artery catheters in management of patients in intensive care (PAC-Man): a randomised controlled trial. Lancet. 2005;366:472–477.
Morris CG, Pearse RM. Pro-con debate: we should not measure cardiac output in critical care. JICS. 2009;10:10–12.
Mythen MG, Webb AR. Perioperative plasma volume expansion reduces the incidence of gut mucosal hypoperfusion during cardiac surgery. Arch Surg. 1995;30:423–429.
Pearse RM, Ikram K, Barry J. Equipment review: an appraisal of the LiDCO plus method of measuring cardiac output. Crit Care. 2004;8:190–195.
Remington JW, Noback CR, Hamilton WF, Gold JJ. Volume elasticity characteristics of the human aorta and prediction of the stroke volume from the pressure pulse. Am J Physiol. 1948;153:298–308.
Pearse R, Dawson D, Fawcett J, et al. Early goal-directed therapy after major surgery reduces complications and duration of hospital stay. A randomised, controlled trial. Crit Care. 2005;9:687–693.
Singer M, Clarke J, Bennett ED. Continuous hemodynamic monitoring by esophageal Doppler. Crit Care Med. 1989;17:447–452.
Swan HJ, Ganz W, Forrester J, et al. Catheterisation of the heart in man with use of a flow-directed balloon-tipped catheter. N Engl J Med. 1970;283:447–451.
[/level-membership-for-pulmolory-and-respiratory-category][not-level-membership-for-pulmolory-and-respiratory-category]
Chapter 35 Hemodynamic Monitoring in Critical Illness
Monitoring Devices
Arterial Pressure Monitoring
Noninvasive Arterial Blood Pressure Monitoring
Noninvasive arterial blood pressure (NIBP) measurements in critical care most commonly are taken using an automated oscillometric device. This consists of a circumferential pneumatic cuff applied to the arm or leg. The cuff is inflated to a pressure above systolic arterial pressure, followed by controlled slow deflation of the cuff. As the cuff pressure falls below systolic arterial pressure, turbulent flow occurs in the artery beneath the cuff, causing oscillations in cuff pressure, which become maximal at MAP (Figure 35-1). Processing software allows determination of systolic, mean, and diastolic pressures in accordance with the amplitude of these oscillations.
Central Venous Catheterization
The complications of central venous cannulation are listed in Box 35-2. Despite advances in catheter technology such as antimicrobial coating, risk for microbial contamination is significant. The corresponding risk of catheter-related sepsis may be mitigated by minimizing the time during which the catheter remains in situ. The benefits of changing the catheter must be weighed against the risks associated with catheter reinsertion (Box 35-3).
Pulmonary Artery Catheterization
The pulmonary artery flotation catheter (PAFC) is a multilumen central venous catheter that is guided by flow to rest in the pulmonary artery (Figure 35-2). It allows measurement and derivation of a wide variety of hemodynamic variables, which are listed in Box 35-4. Indications for its use include the following:
• Determination of the cause of hemodynamic insufficiency
• Discrimination between cardiogenic and noncardiogenic pulmonary edema
• Measurement of cardiac output and pulmonary artery pressures (for example, in pulmonary hypertension or hepatopulmonary syndrome)
• Guidance in use of inotrope, vasopressor, or vasodilator therapy in critical illness or after major surgery
