74 Hemodynamic Monitoring
The primary objective of hemodynamic monitoring is to ensure that the patient is achieving an optimal tissue perfusion and oxygen delivery while maintaining adequate mean arterial pressure. Identification and correction of tissue hypoxia remains one of the central tenets of every protocol that aims to resuscitate patients from shock conditions. When monitoring circulation, it is imperative therefore that an estimate is made of the adequacy of circulation with respect to the likelihood of there being underlying tissue hypoxia. The monitors that are currently available in routine clinical practice are unable to assess tissue hypoxia at either a local or a cellular level. An extrapolation is therefore made from a number of globally measured variables that provides an estimate of the likelihood of underlying disturbance. This information can then be used to direct therapeutic decisions to benefit patients.1–11 Ideally, targeting such goals should lead to significant reductions in morbidity and mortality. There is now evidence to show that such interventions can lead to reduced morbidity and mortality in some groups of patients.1–311
The key concepts of invasive monitoring revolve around two main principles: (1) the measurement of the physiologic variable can be achieved accurately and reproducibly, and the information obtained cannot be obtained by a less invasive method of measurement; and (2) the knowledge of this variable when used correctly can improve the outcome for that patient.12,13
 Arterial Pressure Monitoring
Studies in intensive care patients where the focus has been the maintenance of blood pressure have not been particularly fruitful.4 Hypotension is defined as a systolic pressure less than 90 mm Hg or a mean pressure less than 65 mm Hg. Most intensivists accept that pressure needs to be kept at a level that allows adequate tissue perfusion, particularly of the major organs, but that maintenance of blood flow through these organs is paramount.
Interpretation of the changes seen in the arterial waveform in relation to changes in intrathoracic pressure can now also give information about whether the patient is likely to respond to a fluid challenge (Box 74-1).6,14 A greater than 10% or 12% variability of systolic pressure, pulse pressure, and/or stroke volume caused by the regular and consistent positive pressure associated with positive-pressure inspiration indicates that the patient is probably hypovolemic and is likely to respond to fluid resuscitation. It should be stressed, however, that this technique can only be used in sedated and ventilated patients in whom there is no spontaneous breathing. This is an important technological development because occult hypovolemia is probably not uncommon in critically ill patients and if unrecognized is likely to contribute to an increase in both morbidity and mortality.
 Central Venous Pressure
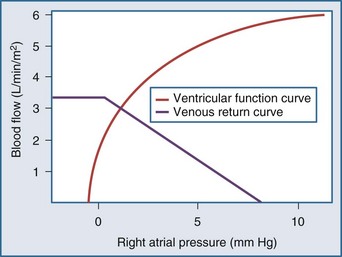
The CVP is influenced by the volume of blood in the central venous compartment and also the compliance of that compartment (Box 74-2). Starling15 demonstrated the relationships between CVP and ventricular contraction and Guyton the relationship between venous return and CVP. By plotting the two relationships on the same set of axes, it can be seen that the “ventricular function curve” and the “venous return curve” intersect at only one point, demonstrating that if all other factors remain constant in an individual patient, a given CVP can, at equilibrium, be associated with only one possible cardiac output (Figure 74-1). Both curves can of course be affected by a number of factors: total blood volume and distribution of that blood volume between the different vascular compartments (determined by vascular tone). The inotropic state of the right ventricle will affect the shape of the ventricular function curve. When any one of these factors is altered, there will be an imbalance between cardiac output and venous return that will persist for a short time until a new equilibrium is reached at a new central venous blood volume and/or an altered central venous vascular tone.
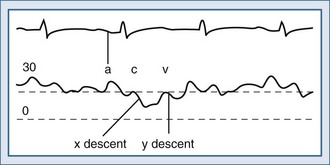
Normal CVP exhibits a complex waveform, illustrated in Figure 74-2. The a wave corresponds to atrial contraction and the x descent to atrial relaxation. The c wave that punctuates the x descent is caused by the closure of the tricuspid valve at the start of ventricular systole and the bulging of its leaflets back into the atrium. The v wave is due to continued venous return in the presence of a closed tricuspid valve. The y descent occurs at the end of ventricular systole when the tricuspid valve opens and blood once again flows from the atrium into the ventricle. This normal CVP waveform may be modified by a number of pathologic processes (Box 74-3).
Box 74-3
Disease States that Modify the Central Venous Pressure Waveform
Taking all these factors into account, it is perhaps not surprising that the CVP will not provide a reliable estimate of preload in critically ill patients. The CVP correlates poorly with overall volemic status, right ventricular end-diastolic volume, stroke index, or an individual patient’s response to a fluid challenge.16 It is perhaps best used in non–critically ill patients when it can provide an estimate of the components to right ventricular filling and venous return because their vasculature is behaving in a normal physiologic manner.
 Pulmonary Artery Catheter
Continuous, reliable, and accurate pressure and flow monitoring of cardiac performance helps in the early initiation of appropriate therapy toward precise hemodynamic goals. The pulmonary artery catheter with its measured and derived parameters (Boxes 74-4 and 74-5) helps direct therapy in the critically ill who balance their physiology precariously. The first double-lumen, balloon-tipped, flow-directed catheter was designed by Swan and Ganz in 1970.17 Thereafter, there have been several modifications to the pulmonary artery catheter, which now enables continuous monitoring of cardiac output from a thermodilution technique, of intravascular pressures, and of mixed venous oxygen saturation (SvO2).
The pulmonary artery catheter is used to gain a comprehensive overview of the circulation. Information can be obtained about the preload, contractility, and afterload of the heart. Modern pulmonary artery catheters also measure the mixed venous oxygen saturation, enabling the clinician to make a judgment about the balance between the oxygen supply and demand. With this information, therapy can be tailored to the individual patient’s requirements. Once correctly positioned, the balloon tip is inflated, temporarily occluding the pulmonary artery. Transducing the catheter port just distal to the balloon provides the pulmonary capillary occlusion pressure. The pressure in the left atrium becomes the main determinant of pressure distal to the inflated balloon because a static column of blood links the two points across the pulmonary capillary bed. This occlusion pressure therefore can provide an estimate of left ventricular preload. Accurate recognition of the waveform indicating the occlusion pressure is vital; however, the ability of clinicians to recognize this waveform is poor.18–20 The catheter must be in the correct position and the point at the end of expiration must be identified to exclude interference from extravascular intrathoracic pressures.
Appropriate use of the pulmonary artery catheter relies on the user achieving an adequate level of cardiac output for any given situation. Cardiac output can be increased by increasing the preload of the heart (Table 74-1) and then by manipulation of either the right ventricular or left ventricular afterload. The adequacy of the cardiac output can be assessed in relationship to the body’s overall energy balance by a coordinated assessment of cardiac output and SvO2.
TABLE 74-1 Normal Values of Cardiac Pressures Obtained from a Pulmonary Artery Catheter in a Spontaneously Breathing Patient
| Mean (mm Hg) | Range (mm Hg) | |
|---|---|---|
| Right atrium | 4 | 3-6 |
| Right ventricle | ||
| Systolic | 25 | 20-30 |
| Diastolic | 4 | 2-8 |
| Pulmonary artery | ||
| Systolic | 25 | 20-30 |
| Diastolic | 10 | 5-15 |
| Mean | 15 | 10-20 |
| Pulmonary artery occlusion pressure | 10 | 5-14 |
The SvO2 is the venous saturation of oxygen in the pulmonary artery. It enables a quantification to be made of the overall oxygen extraction of the blood. The normal value for this is in the region of 70% to 75%. Any decrease in this variable is due to either a decrease in oxygen delivery or an increase in oxygen utilization. A thorough understanding of the factors that derive these variables therefore enables a complete understanding of the circulatory dysfunction for any given patient. In recent years, use of the pulmonary artery catheter has been surrounded by controversy (Table 74-2) after the publication of a large observational study linking it with a poor outcome.21 There have been suggestions22–24 that use of the pulmonary artery catheter may not improve outcome, and there have been studies where use of the pulmonary artery catheter led to a worse outcome despite the fact that its use was restricted to sicker patients.25,26 A further study started to resolve this confusion was stopped early.27 Larger prospective randomized controlled trials have now been performed and have refuted earlier suggestions of harm with this tool.28,29 What is clear from most of these studies is that if the pulmonary artery catheter is used without a clear protocol for treatment, then benefit is never demonstrated. With an appropriate protocol in the correct group of patients, however, improved outcomes can be shown.1,2,30,31
TABLE 74-2 Complications Associated with the Pulmonary Artery Catheter
| Complications Associated with Catheter Insertion | |
| Minor arrhythmias | 48% |
| Sustained arrhythmias | Uncommon |
| Arterial puncture | 1% |
| Pneumothorax | 1% |
| Complications When Catheter Is in Place | |
| Infection of insertion site | 0%-22% |
| Catheter-related sepsis | 2% |
| Mural thrombus | 28%-61% |
| Pulmonary infarction | 0.1%-7% |
| Rupture of pulmonary artery | <0.1% |
| Death | <0.1% |
 Pulse Contour Analysis
Analysis of the arterial pulse pressure wave obtained from an intraarterial line can provide a great deal of information over and above just the value of arterial pressure. This has led to development of technologies for continuous monitoring of cardiac output obtained by analyzing the pulse wave contour obtained from intraarterial catheters placed in either the radial or femoral arteries. Arterial pulse pressure analysis is a technique of measuring and monitoring stroke volume on a beat-to-beat basis from the arterial pulse pressure waveform. The concept is not new. Otto Frank developed the Windkessel model to simulate the heart-vessels interaction in 1899.32 By 1904 Elanger and Hooker had proposed a correlation between stroke volume and change in arterial pressure and suggested there was a correlation between cardiac output and the arterial pulse contour.33 This eventually led to the development of algorithms relating the arterial pressure contour and cardiac output, and with recent advances in computer technology, this has led to the development of the principle to the point where it can be used in clinical practice. These technologies offer the ability to monitor stroke volume (and therefore cardiac output) on a near real-time basis. This has several advantages over existing technologies, because the majority of critically ill patients already have arterial pressure lines in situ, thus allowing the technology to be deemed relatively noninvasive. Fluctuations of blood pressure around a mean value are caused by the volume of blood (the stroke volume) forced into the arterial conduit by each systole. The magnitude of this change in pressure—known as the pulse pressure—is a function of the magnitude of the stroke volume.
The systems require constant reappraisal during use, and the need for recalibration is paramount.35–37 Taking all these problems into consideration, the ideal algorithm for arterial pulse contour analysis should contain the following features:
In recent years, a number of companies have developed systems to measure stroke volume from pulse pressure analysis techniques. Many of the companies developed methods for calibrating the pulse contour changes for individual patients. This compensated for the inability to determine arterial compliance. This has been achieved with either transpulmonary thermodilution (PiCCO),34 lithium dilution (LiDCO),38 or an internal “autocalibration” by the Vigileo system. With an accurate and precise calibration, the data obtained by these devices are as reliable as the pulmonary artery catheter. Many questions remain unanswered, however. For instance, when are the devices likely not to provide robust information, how are the algorithms affected by significant changes in vasomotor tone, and how frequently should the recalibration be performed? Recent data have shown that the devices can be used to titrate therapy in surgical patients, with resulting improvements in outcome.39
 Esophageal Doppler
The 19th-century physicist Christian Doppler described the effect that bears his name, demonstrating that the shift in frequency emitted by, or reflected off, a moving object is proportional to the relative velocity between object and observer. Doppler derived a formula that related frequency shift to velocity, which included the variables that might distort this observation (such as the angulation of the point of observation to the path of the moving object and the speed sound). This observation has been widely used for measuring the speed of moving objects, ranging from stars to cars to red blood cells. Transcutaneous Doppler ultrasound has been in general clinical use for measuring blood velocity in both peripheral and central veins and arteries for a considerable time. In 1969, Light40 demonstrated that it could be used to measure the velocity of blood in the human aorta. This has since been further developed and improved such that blood velocity can now be measured in the descending aorta, from which cardiac output can be calculated. The two most commonly used commercially systems both use a flexible probe which is inserted down into the esophagus to a length of approximately 40 cm from the mouth. One system (Deltex CardioQ41) has a piezoelectric crystal mounted at 45 degrees on the tip of the disposable probe which produces ultrasound at a continuous frequency of 4 MHz. The probe tip is adjusted to lie in the esophagus at a point alongside the descending aorta. The ultrasonic beam is transmitted into the lumen of the aorta, insonating the moving red cells. Some of the ultrasound is reflected back to the crystal at a frequency proportional to the velocity of the moving red cells. This shifted frequency is converted to a velocity using the Doppler equation:
where V = velocity of blood in cm/sec, f = Doppler shifted frequency, Fo = transmitted frequency, C = acoustic velocity in blood, and Q = angle of Doppler beam to blood vessel. The velocity of the red blood cells thus obtained is converted to flow using a propriety algorithm which assumes the cross-sectional diameter of the descending aorta based on a number of factors including age, gender, height, and weight. Because this measurement is made on the descending aorta, it does not take into account flow to head and arms, which is assumed to be a constant 30% of the total cardiac output. Beat-by-beat values for cardiac output and stroke volume are calculated, and these values have been shown to correlate well with cardiac output measured by thermodilution.25 In contrast, the other commercially available product (Arrow Hemosonics42) uses a nondisposable probe over which is placed a disposable sheath; the whole device is then inserted into the esophagus. The pulsed Doppler transducer measures descending aortic red blood cell velocity. This is converted to flow by the continuous measurement of descending aortic diameter, which is obtained from an M-mode echo signal provided by a separate transducer incorporated in the probe. Good correlation with independent measurements of cardiac output have also been obtained with this device. This technique allows cardiac output and stroke volume to be measured rapidly and relatively noninvasively and requires less training than required for use of the pulmonary artery catheter. Most studies find a similar agreement with the values for cardiac output measured with this technique as compared to the pulmonary artery thermodilution catheter.42–46 Operator experience is frequently cited as the cause of any inaccuracy. It can be difficult to ensure that the Doppler probe is correctly positioned in the esophagus to ensure that the probe tip is accurately measuring the maximal blood flow at the center of the aorta.45 This technique has been used to improve the outcome of surgical patients by titrating fluid challenges to achieve a maximal stroke volume in the intraoperative setting.
 Electrical Impedance Cardiography Technology
Electrical impedance cardiography technology measures the basal chest electrical impedance or resistance to flow in ohms.47 The change of impedance across the chest wall is related to the change of flow of blood throughout the chest cavity. The impedance dz/dt (dz = change in impedance, dt = change in time) is produced by change in blood flow and volumes in the ascending aorta. In devices using baseline impedance, large amounts of thoracic fluid such as severe pulmonary edema may interfere with the impedance signal and dampen the waveform. The latest methods are baseline impedance independent. They provide continuous trends of heart rate and stroke volume and give derived cardiac output and index using stroke waveform morphology. Recent models of electrical impedance cardiography use advanced waveform morphology analysis to measure a filling index, the trend of which may be useful in monitoring response to therapy. Unfortunately, in view of its major limitations, its reliability in critically ill patients is very limited. Recent advancements in this technology use the concept of frequency amplification as opposed to amplitude modification (FM rather than AM), which leads to a much more robust signal-to-noise ratio. This is now known as bioreactance. Early data from this technique appear promising, although further validation is required.
 Conclusion
Key Points
Iberti TJ, Fischer EP, Leibowitz AB, et al. Multicenter study of physicians’ knowledge of the pulmonary artery catheter. Pulmonary Artery Catheter Study Group. JAMA. 1990;264:2928-2932.
Connors AFJr, Speroff T, Dawson NV, et al. The effectiveness of right heart catheterization in the initial care of critically ill patients. SUPPORT Investigators. JAMA. 1996;276:889-897.
Wilson J, Woods I, Fawcett J, et al. Reducing the risk of major elective surgery: randomised controlled trial of preoperative optimisation of oxygen delivery. BMJ. 1999;318:1099-1103.
Harvey S, Harrison DA, Singer M, Ashcroft J, et al. Assessment of the clinical effectiveness of pulmonary artery catheters in management of patients in intensive care (PAC-Man): a randomised controlled trial. Lancet. 2005;366:472-477.
Perel A. Assessing fluid responsiveness by the systolic pressure variation in mechanically ventilated patients: systolic pressure variation as a guide to fluid therapy in patients with sepsis-induced hypotension. Anesthesiology. 1998;89:1309-1310.
Pearse R, Dawson D, Fawcet JT, Rhodes A, Grounds RM, Bennett ED. Early goal-directed therapy after major surgery reduces complications and duration of hospital stay. A randomised controlled trial. Crit Care. 2005;9:687-693.
Cecconi M, Rhodes A, Polonieki J, Della Rocca G, Grounds RM. Bench-to-bedside review: the importance of the precision of the reference technique—with specific reference to the measurement of cardiac output. Crit Care. 2009;35:201-206.
1 Boyd O, Grounds RM, Bennett ED. A randomized clinical trial of the effect of deliberate perioperative increase of oxygen delivery on mortality in high-risk surgical patients. JAMA. 1993;270:2699-2707.
2 Wilson J, Woods I, Fawcett J, et al. Reducing the risk of major elective surgery: Randomised controlled trial of preoperative optimisation of oxygen delivery. BMJ. 1999;318:1099-1103.
3 Rivers E, Nguyen B, Havstad S, et al. Early goal-directed therapy in the treatment of severe sepsis and septic shock. N Engl J Med. 2001;345:1368-1377.
4 Partrick DA, Bensard DD, Janik JS, Karrer FM. Is hypotension a reliable indicator of blood loss from traumatic injury in children? Am J Surg. 2002;184:555-559.
5 LeDoux D, Astix ME, Carpati C, Rackow EC. Effects of perfusion pressure on tissue perfusion in septic shock. Crit Care Med. 2000;28:2729-2732.
6 Perel A. Assessing fluid responsiveness by the systolic pressure variation in mechanically ventilated patients: Systolic pressure variation as a guide to fluid therapy in patients with sepsis-induced hypotension. Anesthesiology. 1998;89:1309-1310.
7 Michard F, Boussat S, Chemla D, et al. Relation between respiratory changes in arterial pulse pressure and fluid responsiveness in septic patients with acute circulatory failure. Am J Respir Crit Care Med. 2000;162:134-138.
8 Brock H, Gabriel C, Bibl D, Necek S. Monitoring intravascular volumes for postoperative volume therapy. Eur J Anaesthesiol. 2002;19:288-294.
9 Yassin J, Singer M. Fundamentals of oxygen delivery. Contrib Nephrol. 2007;156:119-132.
10 Squara P. Matching total body oxygen consumption and delivery: a crucial objective? Intensive Care Med. 2004;30:2170-2179.
11 Pearse R, Dawson D, Fawcett F, Rhodes A, Grounds RM, Bennett ED. Changes in central venous saturation after major surgery, and association with outcome. Crit Care. 2005;9:694-699.
12 Bellom R, Pinsky MR. Invasive hemodynamic monitoring. In: Tinker J, Browne D, Sibald WJ, editors. Criticare: Standards, Audit and Ethics. London: Edwards Arnold; 1996:82-105.
13 Hall JB. Mixed venous oxygen saturation (SvO2. In: Pinsky MR, Payen D, editors. Functional Hemodynamic Monitoring. Heidelberg: Springer; 2005:233-240.
14 Fritsch-Yelle JM, Convertino VA, Schlegel TT. Acute manipulations of the plasma volume alter arterial pressure responses during Valsalva maneuvers. J Appl Physiol. 1999;86:1852-1857.
15 Patterson SW, Piper H, Starling EH. The regulation of the heart beat. J Physiol. 1914;48:465-513.
16 Buhre W, Weyland A, Schorn B, et al. Changes in central venous pressure and pulmonary capillary wedge pressure do not indicate changes in changes in right and left heart volume in patients undergoing coronary. Eur J Anaesthesiol. 1999;16:11-17.
17 Swan HJ, Ganz W, Forrster J, et al. Catheterization of the heart in man with the use of a flow-directed balloon-tipped catheter. N Engl J Med. 1970;283:447-451.
18 Iberti TJ, Fischer EP, Leibowitz AB, et al. Multicenter study of physicians’ knowledge of the pulmonary artery catheter. Pulmonary Artery Catheter Study Group. JAMA. 1990;264:2928-2932.
19 Iberti TJ, Daily EK, Leibowitz AB, et al. Assessment of critical care nurses’ knowledge of the pulmonary artery catheter. The Pulmonary Artery Catheter Study Group. Crit Care Med. 1994;22:1674-1678.
20 Trottier SJ, Taylor RW. Physicians’ attitudes toward and knowledge of the pulmonary artery catheter: Society of Critical Care Medicine membership survey. New Horiz. 1997;5:201-206.
21 Connors AFJr, Speroff T, Dawson NV, et al. The effectiveness of right heart catheterization in the initial care of critically ill patients. SUPPORT Investigators. JAMA. 1996;276:889-897.
22 Finfer S, Delaney A. Pulmonary artery catheters. BMJ. 2006;333:930-931.
23 Soni N. Swan song for the Swan-Ganz catheter? BMJ. 1996;313:763-764.
24 Rhodes A, Cusack RJ, Newman PJ, et al. A randomised controlled trial of the pulmonary artery catheter in critically ill patients. Intensive Care Med. 2002;28:256-264.
25 Gore JM, Goldberg RJ, Spodick DH, Alpert JS, Dalen JE. A community-wide assessment of the use of pulmonary artery catheters in patients with acute myocardial infarction. Chest. 1987;92:721-727.
26 Zion MM, Balkin J, Rosenmann D, Goldbourt U, Reicher-Reiss H, Kaplinsky E, et al. Use of pulmonary artery catheters in patients with acute myocardial infarction. Analysis of experience in 5,841 patients in the SPRINT registry. SPRINT Study Group. Chest. 1990;98:1331-1335.
27 Guyatt G. A randomized controlled trial of right-heart catheterisation in critically ill patients. Ontario Intensive Care Study Group. J Intensive Care Med. 1991;6:919-995.
28 Richard C, Warszawski J, Anguel N, et al. Early use of pulmonary artery catheter and outcomes in patients with shock and acute respiratory distress syndrome: a randomized controlled trial. JAMA. 2003;290:2713-2720.
29 Harvey S, Harrison DA, Singer M, Ashcroft J, et al. Assessment of the clinical effectiveness of pulmonary artery catheters in management of patients in intensive care (PAC-Man): a randomised controlled trial. Lancet. 2005;366:472-477.
30 Shoemaker WC, Appel PL, Kram HB, Waxman K, Lee TS. Prospective trial of supranormal values of survivors as therapeutic goal in high-risk surgical patients. Chest. 1988;94:1176-1186.
31 Polonen P, Ruokonen E, Hippelainen M, Takala J. A prospective randomised study of goal-orientated hemodynamic therapy in cardiac surgery patients. Anesth Analg. 2000;90:1052-1059.
32 Frank O. Die Grundform des Arteriellen Pulses. Z Biol. 1899;37:483.
33 Erlanger J, Hooker DR. An experimental study of blood pressure and of pulse pressure in man. John Hopkins Medical Records. 1904;12:145-378.
34 Sakka SG, Reinhart K, Meier-Hellmann A. Comparison of pulmonary artery and arterial thermodilution cardiac output in critically ill patients. Intensive Care Med. 1999;25:843-846.
35 Cecconi M, Fawcett J, Grounds RM, Rhodes A. A prospective study to evaluate the accuracy of pulse power analysis to monitor cardiac output in critically ill patients. BMC Anesthesiology. 2008;8:3-11.
36 Cecconi M, Dawson D, Grounds RM, Rhodes A. lithium dilution cardiac output measurement in the critically ill patient: determination of precision of the technique. Intensive Care Med. 2009;35:498-504.
37 Cecconi M, Rhodes A, Polonieki J, Della Rocca G, Grounds RM. Bench-to-bedside review: the importance of the precision of the reference technique–with specific reference to the measurement of cardiac output. Crit Care. 2009;35:201-206.
38 Linton R, Band D, O’Brien T, et al. Lithium dilution cardiac output measurement: A comparison with thermodilution. Crit Care Med. 1997;25:1796-1800.
39 Pearse R, Dawson D, Fawcett J, Rhodes A, Grounds MR, Bennett ED. Early goal-directed therapy after major surgery reduces complications and duration of hospital stay. A randomised controlled trial. Crit Care. 2005;9:687-693.
40 Light LH. Non-injurious ultrasonic technique for observing the blood flow in the human aorta. Nature. 1969;224:1119-1121.
41 Singer M, Clarke J, Bennett D. Continuous hemodynamic monitoring by esophageal Doppler. Crit Care Med. 1989;17:447-452.
42 Cariou A, Monchi M, Joly LM, et al. Noninvasive cardiac output monitoring by aortic blood flow determination: Evaluation of the Sometec Dynemo-3000 system. Crit Care Med. 1998;26:2066-2072.
43 Penny JA, Anthony J, Shennan AH, De Swiet M, Singer M. A comparison of hemodynamic data derived from pulmonary artery flotation catheter and the esophageal Doppler monitor in preeclampsia. Am J Obstet Gynecol. 2000;183:658-661.
44 Leather HA, Wouters PF. Oesophageal Doppler monitoring overestimates cardiac output during lumbar epidural anaesthesia. Br J Anaesth. 2001;86:794-797.
45 Moxon D, Pinder M, van Heerden PV, Parsons RW. Clinical evaluation of the HemoSonic monitor in cardiac surgical patients in the ICU. Anesth Intensive Care. 2003;31:408-411.
46 Jaeggi P, Hofer CK, Klaghofer R, Fodor P, Genoni M Zollinger A. Measurement of cardiac output after cardiac surgery by a new transesophageal Doppler device. J Cardiothorac Vasc Anesth. 2003;17:217-220.
47 Cotter G, Moshkovitz Y, Kaluski E, et al. Accurate, noninvasive continuous monitoring of cardiac output by whole-body electrical bioimpedance. Chest. 2004;125:1431-1440.
