Hemo-dynamo Doc

Published on 06/02/2015 by admin

Filed under Anesthesiology

Last modified 22/04/2025

Print this page

rate 1 star rate 2 star rate 3 star rate 4 star rate 5 star
Your rating: none, Average: 0 (0 votes)

This article have been viewed 1183 times

Hemo-dynamo Doc

Christopher J. Gallagher

The crew of Apollo 13 solved their problems.

See if you can solve these.

The first time you see the quantitative problems of transesophageal echocardiography, you will defecate a quart jar of tenpenny nails, not to be too indelicate about it. But fear not, all is not lost. The math is no more complex than algebra, and the same concepts come back over and over and over again. The best way to show this is to plow through the problems they showed at the 2003 hemodynamics workshop meeting. The first time through (especially if you haven’t seen this stuff before), it will seem like Greek. But by the end (once you see that the same equations reappear like Jason in a Halloween sequel), you should get it.

Go through these problems, and you, too, can be a Hemodynamo-Doc.

Case 1

77-yo man having CABG surgery has an A-line, CVP, and (surprise) a TEE. On echo, the AV appears sclerosed with restricted leaflet motion and trace AR. His BSA is 2.0 m squared. The following measurements are made:

Your job, should you decide to accept it, is to calculate:

If you saw this problem ice cold, and thought the TEE exam was just a matter of looking at some videos and saying, “Yeah, there’s a dissection”, or “There’s mitral regurg”, then you would no doubt die right here and now. Fortunately, forewarned is forearmed; you KNOW this stuff will be on the test, so let’s grind through it.

N.B. There will be a LOT OF REPETITION here as we go through these problems. That is a good thing for it should POUND THIS STUFF THROUGH YOUR THICK SKULLS. At the echo course in San Diego, they emphasize that the course repeats and reinforces the main ideas.

Redundancy is a good thing.

And you can say that again.

Calculation of Stroke Volume:

image

The stroke volume going through the heart is thought of as a “cylinder of blood,” so you look for a place that has both an area that you can measure (lo and behold, the LVOT fits the bill) and a length that you can measure (the LVOT TVI, which is a “length”). TVI stands for time-velocity integral, and is measured by putting the pulsed-wave Doppler (the one that measures velocity at a specific place) right in the LVOT. Then you trace the outside of the velocity curve. The computer in the TEE machine will give you a time-velocity integral, which is the length that the blood moved.

There is a little leap of faith here, with only engineers and pencil-necked geeks understanding exactly the nature of “integration” turning a velocity in cm/sec into a length of cm. Suffice it to say, TVI gives you the length that the cylinder of blood moved.

Volume of a cylinder of blood moving through the heart (which is the stroke volume) = area at a specific place (here, the LVOT) × length at a specific place (here, the TVI of the LVOT).

Cleaning up a little:

image

Area of a circle, you recall from 8th grade or so, is pi × radius squared. Since pi is 3.14 and since radius = diameter divided by 2, then the area equation can be simplified to area = 3.14 × diameter squared/2 squared, or 3.14 × diameter squared/4. Crank out a little division and you come up with:

image

For some reason, in the TEE review course, they always go with area = 0.785 × diameter squared, they never go with pi × radius squared. Whatever, when in Rome, do as the Romans.

So let’s wander back to the stroke volume thing.

image

As you do these problems, pay attention to two things:

The units should come out properly, just like in chemistry or physics class. We ended up with a stroke volume in units of cm cubed, or in other words, mL. That makes sense. That is how you usually measure stroke volume. If, after your crafty machinations, you had come up with units of, say, hectares per nanosecond per light-year, then you must ask yourself, “When was the last time I measured a stroke volume in hectares per nanosecond per light-year?”. The answer being, “Never”, you should go back and redo the math.

Common sense should also play a part in your answer. This patient, ailing though he was, had a stroke volume of 68 mL. That is not the greatest, but is compatible with life in a human being. If, in blazing contrast, your calculated stroke volume came out to 3 mL, then you would have to ask yourself “Just how long does your average human being live with a stroke volume of 3 mL?”.

I wouldn’t sell such a person life insurance.

The flip side of the coin is, what if you calculate a stroke volume of 8900 mL? Either you are calculating the stroke volume of King Kong, or you made a decimal point mistake in there somewhere.

Do your problem, then step back. Look at the units. Use common sense.

Calculation of Peak Right Ventricular Systolic Pressure

Sorry, the free ride is over, you’ll have to put your thinking cap back on for this one.

For this, you’ll need two things, one mathematical, and one commonsensical/visual.

The Mathematical

The Bernoulli equation will appear a million times in any discussion of TEE. The complicated form of this equation takes Sir Isaac Newton to decipher, but the simplified version comes to us as the digestible.

Delta P (the change in pressure between two chambers in a flowing system) = 4 × velocity squared (where the velocity is measured at a “choke point” or narrowing between the two chambers)

So picture the place we’re interested in measuring, here the right ventricle. Where is there a “choke point” or narrowing that leads into or out of the right ventricle, we can measure a velocity. (Remember, the TEE can measure a velocity for you, but it cannot measure a pressure.)

Aha! The patient has tricuspid regurgitation, and there is a measurement of the tricuspid regurg velocity that we can measure:

image

(Note well, the units for the Bernoulli equation work out as follows—use the velocity in m/sec and your gradient will come out in mmHg.)

So let’s convert that TR velocity into a gradient:

image

Now on to the second thing you need to solve this problem.

The Commonsensical/Visual

So we want to know the pressure in one place, we have a gradient, and we have a pressure in a second place. Here’s where the common sense comes in.

There is a higher pressure place, the right ventricle (that’s what contracts, after all). There is a lower pressure place, the atrium (the pressure in that thin-walled chamber better be lower than the thicker walled ventricle).

Common sense tells you that you could set up an equation like this:

image

image

image

image

image

In the TEE review course, they said:

image

This may work for you, but I found it more useful to think through the problem from the vantage of “here’s the high-pressure area, here’s the low-pressure area, and here’s the loss of pressure between them”. That way you’ll understand the way the pressure works, and you’ll be less likely to, say, subtract the CVP from the gradient rather than add the CVP to the gradient. Once you’re done, you can then draw your picture and see if common sense holds up.

Calculation of Peak Aortic Valve Area

Here the continuity equation comes home to roost. At first baffling, the continuity equation makes sense: it’s just a question of cross multiplying and dividing, and shouldn’t make you lose much sleep.

Why bother? Why not just draw a line around the open aortic valve and let the TEE machine do the area for you by planimetry?

Ah, grasshopper, things are not so simple as they seem.

Planimetry, as so many things in life, only works when you don’t need it! (Kind of like the umbrella that never leaks unless it rains, or the life preserver that doesn’t let you drown unless you happen to fall into the ocean.) When the aortic valve is crunchy and stenotic, planimetry (a two-dimensional exercise), just cannot get a good handle on the exact orifice area. You outline up here, but there is more stenosis below your outline, or there is more stenosis above your planimetry, so the planimetry is just no good.

Continuity Equation Idea: flow through one area of the heart equals flow through another area of the heart.

Fluids are not compressible, so you can’t “squish” the blood. Also, blood cannot just “disappear”, which brings up the BIG EXCEPTION to the continuity equation:

If a patient has noncontinuous flow (septal defect somewhere), then you can’t use the continuity equation. To use continuity, have continuity!

So, if you can measure flow through one area, then that should equal flow in another area.

Flow here = flow there. The essence of the continuity equation.

Recall from earlier that we “create” measurable flow by assuming a cylindrical amount of blood flow. (We did that in the original part of this problem, the stroke volume problem. Go back now and nail that down, because that is the heart of the continuity equation.) We measure this cylindrical flow by getting one area and multiplying it by the length (the time-velocity integral), thus getting flow.

image

We know we want to know the aortic valve area, so where can we find another place to measure stuff?

The left ventricular outflow tract, of course! (The LVOT is forever bailing our mathematical asses out of trouble.)

So flow through the LVOT should equal flow through the aortic valve. So plug in the respective three things that we DO have, and solve for the one thing we don’t have:

image

image

You have the diameter of the LVOT, 2.2 cm, so use the area formula:

image

So, plodding along,

image

Cross multiply and divide, solving for the area of the aortic valve, and, voila!

image

Does this pass the units test? Yes. Aortic valve areas are measured in cm squared.

Does this pass the common sense test? Yes, this fits the general size you would expect of a stenotic aortic valve. You didn’t get an aortic valve area the size of an electron, nor did you get an area the size of Comiskey Park.

Now hold on to your slide rulers and cyclotrons—there is, it turns out, another way to get the aortic valve area.

Go back to the cylinder of blood idea (the gist of all these equations). If you look just at the aortic valve, you could say:

image

So, if you were of a mind to, you could calculate the aortic valve area that way, could you not? (The first time you see this, you’ll go, “Huh? Aren’t they cheating?”.) But it’s actually not cheating, because, in order to get the stroke volume, you had to use the concept of the “cylinder of blood going through the LVOT” (see above, where we calculated the very first part of this problem, the stroke volume).

Take a second to digest this.

No, really, look back up there, don’t take this on faith.

Satisfied? Good.

So, here we go with the second way to calculate the area of the aortic valve.

image

Cross multiply and divide, and gee whiz golly, the aortic valve area is still 1.1 cm squared.

That shouldn’t surprise you, as this patient hasn’t aged much during this problem.

What should surprise you is a second answer different from your first. Since you were just grinding the same numbers through in different ways, you should get a second answer the same as the first. If you don’t, go back and rework it.

Calculation of Peak Left Ventricular Pressure

At the TEE course, they didn’t ask for this, but it’s worth doing just to get that “high-pressure area, gradient loss, low-pressure area” idea down.

First, draw a picture of what you’re trying to find. (To repeat, getting the concept down of where the high pressure should be, as well as where the low pressure should be, is important. A good picture will make sure you add where you should add and subtract where you should subtract.)

The high-pressure area should be the left ventricle in systole, because the left ventricle has to overcome the “choke point” of the aortic valve, and still have enough oomph left over to provide systolic pressure.

High pressure in the left ventricle (unknown) − pressure lost in the stenotic aortic valve (the previously calculated gradient of 46 mmHg) = pressure left over in the aorta (the systolic pressure of 105 mmHg)

image

image

Now, redraw the picture and see if it makes sense.

Case 2

48-yo man having CABG. Monitoring includes a finger on the pulse and an anesthesiologist on the phone to Merrill-Lynch. OK, OK, sorry. Monitoring includes an A-line, CVP, and TEE. LV appears dilated and hypocontractile. There is a central jet of MR judged to be 2+ to 3+ in severity. The following measurements are made:

Calculate the following:

Before you regurgitate yourself at all this stuff, a few pointers.

On this, the math part of the test, they will just give you the various measures. They’ll lay LVOT diameter on a silver platter and hand it to you. In other parts of the test, you will visually have to show exactly where you would take this measurement yourself. And on the test the various places are damned close to one another, so make sure you know where to take these measurements.

Second, PISA makes the whole auditorium groan, it seems so esoteric at first. But once you gird your loins and throw yourself into this stuff, you’ll see that PISA is just the continuity equation in another form.

image

PISA’s area is a hemisphere, so that’s a little different.

PISA’s area is affected by its angle to the valve, so that’s a little different.

PISA implies you know what the hell aliasing is, so that’s a little different.

Alright, so PISA is a pain in the ass, what can I tell you? I didn’t make up the exam!

Let’s take a little breather from the PISA monster, get as far along as we can in the calculations, get a little confidence, then jump into the snake pit of PISA-ness.

Calculation of MV Stroke Volume

Danger! Danger, Will Robinson! Remember, when you measure these, to measure both the diameter and the TVI at the same place. In this problem, be sure to measure both the diameter of the mitral valve and the TVI of the mitral valve at the annulus. If you measure the diameter at the annulus and the TVI at, say, the tips of the mitral valve, then you would get an inaccurate result.

image

So once again, we are invoking a “cylinder of blood flow”.

Though the mitral valve is more like an oval, for purposes of this problem, we will consider it a circle:

image

Or, bowing to TEE convention:

image

Units check? Yes. Common sense check? Wait a minute! Didn’t we just calculate an LVOT stroke volume of 64 mL? Now where did this stroke volume of 106 mL come from? What about the Holiest of Holies, the continuity equation?

Confused? Pause for a moment and think about what’s happening.

This patient has mitral regurgitation, so it makes sense that more should go through the mitral valve than goes out the LVOT. Some of that mitral volume is lost by going backward (as we’ll see below). Recall, too, that the continuity equation doesn’t apply here, because the LVOT measurement applies to blood flowing out to the aorta during systole. The blood flow going forward through the mitral valve occurs during diastole.

Systole and diastole do not occur at the same time. They are DIScontinuous so the continuity equation does not apply to them.

So, in review, the units check and the common sense also checks, once you think about what is happening and when it is happening.

Calculation of Regurgitant Orifice Area

This is a little hypothetical, as the regurgitant orifice area is not a fixed thing that instantly appears, then instantly disappears. In reality, it’s more like a door that is closed, opens at a certain speed, stays open for a length of time, and then closes at a certain speed. This calculation looks at the “door all the way open” and ignores the reality of the “opening period” and the “closing period”.

But you’re not here to think. Just do the calculation and keep your trap shut.

Go back to our cylinder of blood and start calculating.

image

image

Cross multiply and divide, you busy little hemodynamic beavers.
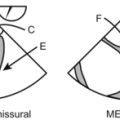
image

Units check? Yep. Common sense check? U-u-uh.

That makes sense. The mitral valve isn’t a complete waste case; it is regurgitant, but not wide, wide open, so it makes sense that a portion, not all, of the valve effectively “stays open” during systole, allowing for the 40% regurgitation.

PISA Calculations

Hunker down, cowboys and cowgirls, it’s not so bad as you think. Before we go into the actual calculations in this case, let’s go over the main aspects of PISAtology.

Look at the words that make up PISA, and draw pictures to illustrate the point.

Proximal. That means the colorful and troublesome PISA radius will appear on the upstream part of the “choke point”. So draw a few pictures. If the patient has mitral regurg, and the flow is pouring from the high-pressure left ventricle into the low-pressure left atrium, the PISA will appear where?

Proximal! That is, the PISA will appear in the left ventricle, the “near” side of the “choke point”. The proximal area of the choke hold, not the far side. That would be “distal isovelocity surface area”, and if you think of the chaotic flow on the far side of a “choke point”, that doesn’t make sense.

How about a case of mitral stenosis? Flow is trying to “squeeze” through a tight mitral valve. Where would the PISA radius appear then?

Proximal! On the near side of the choke point, that is, in the left atrium.

Again, a radius on the far side of the choke point doesn’t make sense.

Isovelocity. All the flow at that area is the same. Recall that flow Doppler is a pulsed-wave, not a continuous-wave, phenomenon. At a certain velocity, the color of the wave will change. Conveniently for us, the aliasing velocity (the velocity where color change occurs) is listed on the machine.

Well, why should the isovelocity thing line up so perfectly for us. Why isn’t the isovelocity thing scattered all over the map?

Think of water going toward a narrow sluice gate. The velocities are all over the map, until you get real close; then the pressure bearing down on the water is all the same. The velocities “organize” as the water gets closer to the sluice gate, and you get a hemisphere of water all going the same speed toward that narrow opening. That is why you get a hemisphere of “isovelocity-ness” that appears on the TEE screen.

Surface Area. Unlike earlier equations, which used the area of a circle (pi × radius squared), this area is that of a hemisphere (2 × pi × radius squared). Why? Look at the PISA thing. It is a hemisphere, not a circle.

So that’s where you get the 2 × pi × radius squared. In calculations done at the conference, they give you the radius and you go with 6.28 (that is, 2 × 3.14) × radius squared.

So, once you believe in PISA, have the formula for area of a hemisphere down, and recall the continuity equation, you are in business.

Calculation of Regurgitant Flow Rate by PISA

Just as in other valve calculations, invent the idea of a cylinder of blood flowing along with a certain area and a certain length. This requires a little mind bending, as you are used to looking at the area of a circle and multiplying it by the length. Here, with PISA calling the shots, you make an area of a hemisphere and multiply it by the length.

Try not to think about it too much, you might pop an aneurysm. Just go with the flow.

image

Wait, wait! Where did that aliasing velocity come from again?

That line, where the flow changes color, must all be going at the same velocity—remember the water flowing towards the sluice gate? So read the aliasing velocity right off your TEE screen (it’s listed right next to a colored bar), measure the radius to that line change, and you know that right there, the blood has to be going that fast, the aliasing velocity. And you measured the radius right there, where the color change occurs, so you are satisfying the demand that the area and the velocity be measured at the same place. So,

image

image

Wait, wait! In all the other stuff, we used TVI and got a length in cm. Now we’ve got this aliasing velocity that has cm/second. Doesn’t that screw everything up?

Don’t panic. Take a deep breath. The question asked for a regurgitant flow rate (which implies a flow per unit time), so the aliasing velocity is-not-the-same-as-TVI will not screw us up. But it’s good to see you fretting about the units.

image

Units OK? Check. (Again, you get Brownie points if you got nervous about the aliasing velocity not being the same as the TVI.) Common sense? Yes.

Calculation of Regurgitant Orifice Area by PISA

Here we’ll keep an especially close eye on the units.

As before, area times velocity will equal flow. (Remember how we did the same thing with other valves and other flows. It always goes back to the same thing: area × velocity = flow. In earlier calculations, we didn’t have the confounding variable of aliasing velocity, with its pesky cm/second. Before, we always had a TVI with just cm. Watch closely.)

Effective regurgitant orifice area (of regurgitant mitral valve) × velocity (through the mitral valve [recall, we can measure velocities directly, but not pressures]) = flow (through mitral valve).

In shorter form,

image

Note, the velocity MR peak is in cm/second, and our flow by PISA is in cm cubed/second, so that pesky second will cancel out:

image

Cross multiply and divide and you get ERO = 0.24 cm squared.

Units OK? Yes. Common sense OK? Well now, I will be dipped in hot fudge, stuck on a stick, and served up at the County Fair—the ERO turned out to be the same thing! 0.24 cm squared. And this time we really did calculate it a different way.

Who’d a thunk it.

Damnation.

Case 3

60-yo obese female s/p cardiac arrest following total hip replacement. Patient is brought to the operating room based upon a preliminary TEE that suggests pulmonary embolus.

CONFERENCE NOTE: There was an entire lecture on TEE in the evaluation of hypoxemia, and it focused on how TEEs help diagnose pulmonary emboli. Though the embolus itself is rarely seen, the secondary signs—RV dilatation, tricuspid regurg, all the signs of a right heart struggling to push blood past an obstruction—are most helpful in making this slippery diagnosis of pulmonary embolus.

They did show one unbelievable clip of an enormous embolus that actually was in transit through the right heart. On screen, in real time, it came unglued, shot up into the pulmonary artery, and the patient went on to die soon after. Scary as hell. About as impressive a TEE as you’d ever care to see. Or not see.

Calculation of Stroke Volume

Find an area, find a TVI, and create your cylinder of blood flow to give you your volume. No problem, we’ve done it before.

OK, roll up the sleeves, find that LVOT diameter, find that LVOT TVI, and plug them into the equation:

image

So,

image

SCREEEEEEEEEEEEEEEEEEEEEEEEEEEEEEEECH!

What the hell? Where are my old favorites? How can this be? Has the world turned upside down? It was so EASY to see it that way. You’re looking right down the pipe of the left ventricular escape hatch. Out goes the blood through the LVOT into the aorta and you’re there! What am I supposed to do with the information I do have?

Here’s where you really need to understand the continuity equation. The information you get is the pulmonary artery diameter and the pulmonary artery TVI. If you really believe, I mean believe, brothers and sisters, in the sanctity of the continuity equation, then you must convince yourself that flow through the pulmonary artery will equal flow through the aorta.

That is, if the forward flow has no weird places the blood could disappear to (ventricular septal defect, atrial septal defect, some weird AV malformation in the lung).

But! But! What about the tricuspid regurg? Doesn’t that “undo” the continuity equation?

No. The TVI you measure through the pulmonary artery is real-live, forward flow. That flow has made it past the right ventricle. Whatever went backward went backward, and we’ll measure that in our own sweet time. But the TVI of the forward flow through the PA will rock right on straight through to the lungs, the left atrium, and the left ventricle, and out into the body.

If no flow goes backward from the pulmonary artery on out (that is, the pulmonary artery itself is not regurgitant), then the continuity equation says, “the flow will flow”.

So, now that we’ve settled that, then we can calculate our stroke volume:

image

Units check? Yes. Common sense check? That forward flow seems pretty small. In earlier patients we were getting stroke volumes of 68 mL and the like. Only 31 mL? Pretty punky. But then, what does common sense tell you? This patient has a big PE, a big blockage to flow out of her right ventricle. It’s conceivable and understandable that a monster plug to the RV could cut the “usual” stroke volume in half. So, yes, this passes the common sense test.

While you’re at it, turn the logic around. What if you calculate a stroke volume greater than normal, say, 90 mL? That wouldn’t jibe with the picture of a pulmonary embolus and blocked forward flow.

Always check your numbers against common sense and what is really happening to the patient. You will be less likely to make a mistake. If you just plug in numbers and hope against hope that you’re right, you’ll stumble.

Calculation of Peak Right Ventricular Systolic Pressure

Here again a picture will keep your signs straight. Whether on the right side or the left side of the heart, think of what’s going on (here, systolic flow from the right ventricle into the right atrium through the “choke point” of the regurgitant tricuspid valve), think of where the highest pressure should be (here, the right ventricle), the place where the gradient will occur (the tricuspid valve), and the low-pressure place (the right atrium). So, the equation will say:

Right ventricle (a high-pressure unknown) – gradient at the choke point (the tricuspid valve) = pressure in the low-pressure place (the right atrium)

How to measure the “choke point”? We have a velocity (which TEE can measure). Plug in Bernoulli:

image

image

image

image

image

image

Units check? Yes. Common sense? Yes.

Now, apply your common sense to the clinical scene. Here’s a patient with a PE big enough to give her cardiac arrest. She has little forward flow (bad stroke volume, bad cardiac output). Her right ventricle, which in a normal patient generates peak pressures of, say 25 or 30 mmHg, is now generating a whopping 80 mmHg. And with that high a right ventricular pressure, is it any wonder that the tricuspid valve (with a whiff of regurg in the best of times) is pouring blood backward?

It all fits. The numbers match the clinical reality. Isn’t science wonderful?

Calculation of Aortic Valve Area

Back to the continuity equation (didn’t I tell you you just keep doing the same stuff over and over again?).

In days of yore, we did this with the LVOT, remember?

image

Then you just cross multiply and divide. Well, as noted above, we ain’t got no LVOT. We got the PA. There is tricuspid regurg, but that doesn’t concern us now. We’re past that level of the regurg, and if, from the PA forward, there is no stop to forward, continuous flow, we should be able to use the continuity equation.

Plug in: Area PA × TVI PA = area AV (the unknown) × TVI AV

image

Cross multiply and divide, you get AV area = 2 cm squared.

Units check? Yes. Areas are in cm squared. Common sense check? Yes, 2 cm squared puts this woman’s aortic valve area in the normal range. And nowhere was there mention of aortic stenosis. She’s got enough trouble already, what with a PE and cardiac arrest. Let’s not give her more worries.

Go back to Case 1. Remember how we worked out the AV area another way?

image

We can do that here, also:

image

As before, this shouldn’t come across as some miracle, as you are just regrinding the numbers in a different path to get to the same result. Of course, if you regrind and come out with a different number, perhaps you need to look things over and mend the error of your ways.

Case 4

60-yo male with acute aortic dissection and aortic insufficiency.

Calculation of LVOT Stroke Volume

Some things never change, ain’t it grand.

Make your cylinder of blood flow. Get the area of the LVOT − pi × radius squared, or, 0.785 × diameter squared. Then get your length of your cylinder of blood, the TVI −30 cm.

image

It’s worth reminding yourself where you get all these numbers from. You measure the LVOT about 5 to 10 mm proximal to the annulus of the aortic valve. You measure the LVOT velocity (around which you draw your cursor to get the TVI) at the EXACT SAME PLACE, using… well, you tell me. Do you use continuous-wave Doppler or pulsed-wave Doppler?

(Play the theme from Jeopardy here.)

Right, pulsed-wave Doppler. Pulsed wave gives you a specific velocity at a specific place, unlike continuous wave, which gives you ALL velocities along a line. (If this is still a mystery to you, review the difference between continuous wave and pulsed wave in Chapter 2; you need to know this ice cold.)

Calculation of Aortic Regurgitant Volume

Note well, young budding TEE’ogists. To calculate the aortic regurgitant volume, you must assume there is no mitral regurgitation going on either. Again, you need one equation, one unknown. Put in one equation and two unknowns, it won’t work.

So, to the numbers:

image

The ventricle is “loaded” with two volumes during regurgitation, the blood pouring backward from the incompetent aortic valve, and the blood flowing forward through the mitral valve. Then WHOOSH, both these volumes go blasting out the aortic valve.

image

image

Still not convinced the mitral valve has to be competent? Let’s load up the ventricle then WHOOSH it out both valves.

image

image

No way, Jose. Too many unknowns.

Think about what’s really happening in these problems. On the exam, they are sure to throw some kind of curve at you, so if you understand the physical reality of what’s flowing where, you should handle it. If you think you can just “plug and forget”, you’ll get tripped up.

Calculation of Aortic Regurgitant Orifice Area

Back to the cylinder of blood moving around. Get an area, multiply it by a length, and that gives you the volume of your cylinder of blood. Make sure the area and the velocity (recall that the velocity, when outlined, yields your TVI, or, length), are measured at the same place.

image

Think it through: you have an area (of regurg), a length (of regurg), and a volume (of regurg). It all makes sense, so now grind the numbers:

image

Units? Good. Common sense? Um. That’s pretty tiny for an aortic valve, but wait, this is the area where regurgitation is occurring, not the entire valve area. You can picture that this patient has an aortic dissection, so the aortic root is stretched, making the aortic valves not able to completely reach each other, and leaving a small area “uncovered” in the middle. Through that, 23 mL of blood per beat flows back into the heart. Then, yes, the aortic regurgitant orifice area of 0.14 cm squared makes sense.

Say you had come up with an aortic regurgitation orifice area of 1.2 cm squared. That would leave a gigantic gap. Blood would go like a house afire into the ventricle, giving an enormous regurgitant volume and, in all likelihood, a moribund patient.

Calculation of Cardiac Output

You are interested in what goes forward here. Regurgitant flow is not really output, it’s “backward-put”. So to calculate cardiac output, you need a real, live stroke volume that actually gets “out there,” and as well you need a heart rate.

image

Whoa! You say, wait just a darn tootin’ minute here, partner, who said anything about the mitral valve? I thought, well, I thought we wanted cardiac output, like as in from the left ventricle out to the body. Who gives a damn about the “cardiac output” from the left atrium to the left ventricle?

Back to the continuity equation. We are talking about uninterrupted forward flow. The amount of blood that leaves the left atrium and doesn’t come back (recall the mitral valve is OK), must be the amount that leaves the ventricle. As long as the forward flow is not diverted in its forward movement.

Look at flow in a different way to convince yourself that the continuity equation holds.

Pretend 71 mL of blood enters the left ventricle from the left atrium; then 71 mL do NOT go forward and out of the heart. Say only 50 mL goes out of the heart with each beat, and then 71 mL keeps entering the left ventricle through the mitral valve.

With each beat of the heart, the left ventricle gets 21 mL bigger. At the end of a minute, the heart will have 1600 mL of blood just hanging around, looking for a good time. At the end of the hour, your heart will be 96,000 mL bigger, or 96 L big. Echo findings in such a case would be remarkable, to say the least. Even the most vigorous patient might find handling such a volume load to be beyond his or her capacity.

Let’s say you were given this problem and I said the patient had a VSD. Could the continuity equation come to the rescue? No. Do a sample problem to satisfy yourself of this.

Pretend that you magically know that 71 mL of blood enters through the mitral valve and 23 mL enters through regurgitation. That is, 71 mL of blood enters the left ventricle from the mitral valve, and 23 mL enters the left ventricle from regurgitant flow, so now the total ventricular volume of 94 mL goes WHOOSH! But how much goes out the aortic valve, and how much goes out the VSD? No way of knowing.

Calculation of Left Ventricular End-Diastolic Pressure

You’ll have a high-pressure chamber, a choke point where a certain amount of pressure is lost, and a low-pressure area with the “leftover” pressure.

We’re in diastole, so the ventricle is relaxing; that’s the low-pressure area. The aorta just got a blast of blood, so there’s high pressure there. The choke point is the regurgitant valve. We can get the pressure from the measured velocity (using our old buddy, Bernoulli).

Aortic pressure in diastole (the high-pressure area) − the pressure lost in the choke point (the velocity of aortic regurg, which we’ll use to get a pressure gradient by delta P = 4 × [velocity] squared; remember, velocity in m/sec to get pressure in mmHg) = left ventricular end-diastolic pressure (the low-pressure area, and our unknown).

Now, to make it more mathematical and less wordy:

image

image

image

image

Units check? Check. Common sense check? Yes. Blood flowing into the left ventricle through regurgitation should create some pressure there. Nothing ridiculous. (Say you came up with an LV EDP of 130 mmHg; that’s higher than systolic pressure, and during diastole? No way.) So, this value satisfies the common sense test.

Case 5

70-yo male with worsening dyspnea on exertion.

Calculation of Mitral Valve Area by Pressure Half-time

image

Where the hell did pressure half-time come from?

The rate of pressure (not velocity, but pressure) decline across the stenotic mitral valve orifice is determined by the cross-sectional area of the orifice. A tiny pinhole of a mitral valve would take a long time to empty. A totally normal, enormous mitral valve would allow the blood to fall through in no time flat. The picture tells the quantitative story.

The quantitative equation has been empirically worked out:

image

How? Doppler half-times were compared to cath lab studies, and this magic number appeared.

Draw a line down the E wave of mitral flow; make that line go right to 0. Ignore the A wave. Find the halfway point down the slope that corresponds to the pressure (recall, delta pressure = 4 × [velocity] squared); that is the halfway point. Do not go to the halfway point as far as velocity is concerned. As luck is with us, the computer on the TEE can do this.

So, back to the problem, what is the mitral valve area by PHT?

image

Units check? Yes. If you use this equation, and use milliseconds, you get cm squared. Common sense? Yep. That’s a tight mitral valve, and that goes along with the clinical picture of worsening dyspnea on exertion.

Calculation of Pulmonary Artery Diastolic Pressure

Remember, we’re in diastole. Know where the high-pressure area, the choke point (where we’ll get a gradient), and the low-pressure area with its “leftover” pressure are.

In diastole, the high pressure is in the pulmonary artery. It just received a blast of blood from the right ventricle. The right ventricle, in contrast, is relaxing after a hard day at the systole office. The choke point is the pulmonary artery, where blood is pouring back into the right ventricle.

image

image

Uh, er…Where is the RV EDP? Have we got one equation, two unknowns? I cry foul!

Hold on, professor. Let’s find a good approximation of the RV EDP. How about the CVP? Well, think about it.

If there is no big pressure gradient between the right atrium and the right ventricle (there is no mention made of tricuspid stenosis), then, yes, in diastole, with the tricuspid valve open, the prevailing pressure in the right atrium should reflect the pressure in the right ventricle. So put 12 mmHg into the right ventricle:

image

image

Satisfy yourself that the units and the common sense hold true.

Case 6

54-yo man is having MV surgery. A-line, Swan, TEE. TEE shows thickened MV leaflets with diastolic doming and restricted opening. There is 2+ MR and no AI. You get the following:

Calculation of Mitral Valve Area Using PISA

Um. Wait a minute here. Time and again, we’ve used the cylinder idea. You have an area; multiply it by a length (the TVI), and you get your stroke volume. The units work out right, common sense usually prevails, Ford’s in his flivver, and all’s right with the world.

But, er, we don’t have a length measured in handy units of cm. Now we have an aliasing velocity in cm/second and a velocity of the mitral valve flow in cm/second. Well, wait, that will work out.

Area PISA × velocity (aliasing) will give us the volume/second going through the mitral valve. Well and good.

Area MV × velocity (MV peak) will give us the volume/second going through the mitral valve. By the grace of continuity, these amounts have to be the same. So we can set them equal to each other.

In earlier problems, we had set two cylinders of blood equal to each other (LVOT area × LVOT length = mitral valve area × mitral valve length). Now we have just taken it a step further by setting two cylinders/second equal to each other (PISA area × PISA velocity = mitral valve area × mitral valve velocity).

To review, then, this problem yields:

image

Cross multiply and divide and you get:

image

Holy consistency, Batman, the area turns out the same, even after all that work!

Calculation of Mitral Valve Regurgitant Volume

Hubbada bubbada, what do we need to get this one? This does not jump off the page and drip obviousness.

OK, think about what’s going on. Way back a hundred years ago you read that the patient has mitral regurg but no aortic insufficiency. So we load the left ventricle; where does the blood go?

There are only two “doors” into the left ventricle, the mitral valve pouring blood in during diastole, and, what else, how else could blood get in there? Blood could roll back into the left ventricle through the aortic valve. But no, look:

“There is 2+ MR but no AI.”

“…no AI.”

So, forget that. The only blood going into the left ventricle is the stroke volume passing the mitral valve, that is, the SV MV. That amount is 55 mL.

Now, what paths do we have OUT of the ventricle?

We still have the same two doors, the aortic and the mitral. Unlike during diastole, though, this time BOTH of the doors are open. The aortic valve functions its normal way, and pumps out a certain stroke volume, and the mitral valve is incompetent, so blood flows out that way too.

A ventricle filled with 55 mL divides its two exit pathways into two:

image

But how much goes out the aorta? Where is our “usual” LVOT diameter and LVOT TVI? The bastards, they’ve left us high and dry.

Hold back your despair. It’s time to go back, long ago, to a galaxy far, far away, where you used to figure stuff out without a TEE. Call this retro-cardio-technology.

You have a cardiac output, right, remember, from that Swan thing that they must have ordered from the Smithsonian? And you have a heart beat. (God, they probably actually felt a PULSE! How’s that for a blast from the past? Why don’t we all put on polyester leisure suits and head out to Studio 54?)

image

image

image

So now we go back to what we were looking for:

image

image

image

image

So, figuring this problem out was like the things every bride should wear, “Something old, something new, something borrowed, something blue, and a penny in her shoe”.

Only without the blue and penny stuff.

Case 7

56-yo man presents for AV surgery.

Calculation of Pulmonary Artery Systolic Pressure

Go with the concept of finding the high-pressure area, finding the choke point where you lose pressure across a gradient, and the leftover low-pressure area.

In systole, the right ventricle is the high-pressure area, and the right ventricle is squeezing into the pulmonary artery. So, hmm, but they gave us tricuspid valve regurg values and velocities.

Damn.

That’s, sort of, going the wrong way. Hmm. Think, think, think, like Winnie the Pooh does.

We want to find the pulmonary artery pressure, darn the luck, but we seem “at a remove” from what we want to find out. So we’ll have to approach this from a more intellectual point of view.

The pulmonic valve, so we are given to understand, is OK, no stenosis there. So, whatever pressure the right ventricle generates should go right into the pulmonary artery. There is no “choke point” causing a gradient loss.

That’s a start. The pulmonary artery systolic pressure will be the right ventricular systolic pressure. Can we figure that out?

Yes! We are no longer “at a remove” from useful information. We have our high-pressure area, our “choke point” where we lose pressure across a gradient, and our low-pressure area.

image

image

image

image

Right units, makes sense that a right ventricle might have to generate a lot of pressure in the face of a diseased heart. (He has a tight aortic valve plus tricuspid regurg. Ay caramba! You think you’ve got problems.)

And, to answer the question, since the RV generates 66 mmHg, and the pulmonic valve has no stenosis, then it makes sense that the pulmonary artery “sees” all that pressure and thus the PA systolic pressure is 66 mmHg.

You CAN figure these things out, even when it’s not super obvious!

Case 8

78-yo man undergoing AAA surgery becomes hypoxic and hypotensive with cross-clamping of the abdominal aorta. TEE reveals 1+ to 2+ MR, 1+ TR without AS or AI.

Calculation of Aortic Valve Area

What’s with the side schtick? I got the cylinder thing down like nuthin’, and now we got, what, Euclidean geometry, come on!

Chill. Like Avril Lavigne says in her song, “It’s all been done before”.

We have to turn ourselves in knots and avoid planimetry when the aortic valve is diseased. Plain old (pardon the pun) planimetry can’t nail the aortic valve area when the valve is all calcified, bumpy, irregular, and grotty mundo. But hark, the case states the patient is “without AS or AI,” so it turns out we can use planimetry.

Just when you had it all figured out, they throw in a normal one to screw you up.

Call the aortic valve area an equilateral triangle, solve for the area of said triangle, and you come up with:

image

image

Units make sense, and, wonder of wonders, the common sense works too, because 2.3 cm squared is within the normal range. That jibes with “without AS or AI”.

Case 9

81-yo woman develops severe dyspnea and a harsh systolic murmur 8 days after an acute MI. She gets intubated and rolls into an ICU near you. Stat TEE shows a VSD with left-to-right shunting. Aortic and mitral valves are normal.