Look at reticulocyte count and MCV.
 The reticulocyte count can help distinguish excess RBC destruction or blood loss (↑ reticulocyte count) from ↓ production (↓ reticulocyte count).
 The mean MCV classifies anemia as normocytic, microcytic, or macrocytic.
1. Anemia Secondary to Maturation Defects or Underproduction
a. Iron Deficiency Anemia
Etiology
 Blood loss from GI or menstrual bleeding (GU blood loss less often the cause)
 Dietary iron deficiency (rare in adults)
 Poor iron absorption in pts w/gastric or small bowel surgery
 Repeated phlebotomy
 ↑ Requirements (e.g., pregnancy)
 Other: traumatic hemolysis (abnlly functioning cardiac valves), idiopathic pulmonary hemosiderosis (iron sequestration in pulmonary macrophages), PNH (intravascular hemolysis)
Diagnosis
H&P
 Fatigue, dizziness, exertional dyspnea, pagophagia (ice eating), pica. Pt’s hx may also suggest GI blood loss (melena, hematochezia, hemoptysis).
Labs
 Vary w/the stage of deficiency: absent iron marrow stores and ↓ serum ferritin → ↓ serum iron, ↑ TIBC → ↓ MCV
 Peripheral smear: microcytic hypochromic RBCs w/a wide area of central pallor, anisocytosis, poikilocytosis
 ↑ RDW (usually <15), ↓ MCV, ↓ serum ferritin level, ↑ TIBC, ↓ serum iron
Treatment
 Ferrous sulfate 325 mg PO qd, parenteral iron, transfusion of PRBCs depending on severity
b. Cobalamin (Vitamin B12) Deficiency
Etiology
 Pernicious anemia (PA): gastric anti–parietal cell Abs in 90% of pts, anti–intrinsic factor Abs in >70% of pts
 Malabsorption, atrophic gastric mucosa, bacterial overgrowth, IBD, meds (PPIs, metformin)
Diagnosis
H&P
 Impaired memory, gait disturbances, paresthesias, and complaints of generalized weakness in advanced stages
Labs
 CBC: macrocytic anemia and leukopenia w/hypersegmented neutrophils
 ↑ MCV, ↓/nl reticulocyte count
 Plasma MMA (P-MMA) (↑) and urinary MMA (↑), total homocysteine level (↑): used for detecting cobalamin deficiency in pts w/nl vitamin B12 levels
Treatment
 Traditional Rx of severe cobalamin deficiency consists of IM injections of vitamin B12 1000 μg/wk for 4 wk followed by 1000 μg/mo IM indefinitely.
 PO cobalamin (1000-2000 μg/day) is effective for dietary deficiency and in mild cases of PA because about 1% of PO dose is absorbed by passive diffusion, a pathway that does not require intrinsic factor.
Clinical Pearl
 Anemia is absent in 20% of pts w/cobalamin deficiency, and macrocytosis is absent in >30% of pts at the time of dx.
c. Folate Deficiency
Etiology
 Malnutrition (alcoholism), ↑ needs (pregnancy), ↑ cell turnover (sickle cell, psoriasis)
Diagnosis
 RBC folate more accurate (serum folate may be nl after just 1 folate-containing meal)

FIGURE 7-1 Algorithm for diagnosis of anemia. (From Goldman L, Schafer AI [eds]: Goldman’s Cecil Medicine, 24th ed. Philadelphia, Saunders, 2012.)
Treatment
 Folate 1 to 5 mg/day PO
 R/o vitamin B12 deficiency before Rx as folate Rx can improve anemia but not B12 neuro sx
 If folate deficiency or pregnancy
d. Inflammatory Anemia (Anemia of Chronic Disease [ACD])
Etiology
 Chronic infections (TB, SBE)
 Chronic inflammation (connective tissue disorders, burns)
 Malignant disease (carcinomas, lymphomas)
 Endocrine (hypothyroidism, hypogonadism, hypopituitarism)
 CKD, Chronic liver disease, IBD
 Mechanism: ↓ erythrocyte survival, ↑ uptake and retention of iron within cells of the RES, limited availability of iron for erythroid progenitor cells, iron-restricted erythropoiesis
Diagnosis
Labs
 Normochromic, normocytic, or microcytic anemia
 ↓ Iron and transferrin saturation, ↓ TIBC, and N/↑ ferritin level
TABLE 7-1
Lab Differentiation of Microcytic Anemias
| Abnormality | Ferritin | Serum iron | TIBC | RDW |
| Iron deficiency | ↓ | ↓ | ↑ | ↑ |
| Inflammatory anemia | N/↑ | ↓ | ↓ | N |
| Sideroblastic anemia | N/↑ | ↑ | N | N |
| Thalassemia | N/↑ | N/↑ | N/↓ | N/↑ |

Treatment
 Rx is aimed at identification and Rx of underlying disease.
 Erythropoiesis-stimulating agents (ESAs) (epoetin alfa, epoetin β, and darbepoetin) can be used in pts w/CKD (to ↑ Hgb to max of 11-12 g/dL), in HIV pts undergoing myelosuppressive Rx, and in pts w/cancer who are undergoing chemoRx.
e. Sideroblastic Anemia
Etiology
 Primary hereditary sideroblastic anemia: inherited as a sex-linked recessive disease
 Secondary acquired sideroblastic anemia: caused by alcohol, isoniazid, pyrazinamide, cycloserine, chloramphenicol, copper deficiency, lead poisoning
Diagnosis
Labs
 Hypochromic anemia (↓ MCV, ↑ RDW)
 Peripheral smear: dimorphic large and small cells revealing “Pappenheimer bodies” or siderocytes when stained for iron
 Bone marrow: ringed sideroblasts, which represent iron storage in the mitochondria of normoblasts
Treatment
 ESAs
ESAs Avoid alcohol
 Sideroblastic anemia secondary to isoniazid, pyrazinamide, and cycloserine: vitamin B6 (50-200 mg/day)
2. Acquired Hemolytic Anemia
a. Autoimmune Hemolytic Anemia (AIHA)
Etiology
 Warm AIHA (WAIHA): IgG (often idiopathic or associated w/leukemia, lymphoma, thymoma, myeloma, viral infections, and collagen-vascular disease)
 Cold agglutinin disease (CAD): IgM and complement in majority of cases (often idiopathic, at times associated w/infections [EBV], lymphoma)
 Drug-induced: three major mechanisms:
Diagnosis
H&P
 Pallor, jaundice
 Tachycardia w/flow murmur if anemia is pronounced
 Dyspnea and fatigue: most common presentation
 Pts w/intravascular hemolysis may present w/dark urine and back pain.
 Presence of hepatomegaly or lymphadenopathy suggests an underlying lymphoproliferative disorder or malignant neoplasm.
 Splenomegaly may indicate hypersplenism as a cause of hemolysis.
Labs
 Initial labs: ↑ reticulocyte count, ↑ LFTs (indirect bili, LDH), Coombs’ test (+ direct Coombs’ = Abs or complement on the surface of RBC; + indirect Coombs’ = anti-RBC Abs freely circulating in the pt’s serum), ↓ haptoglobin level
 RBC clumping in CAD, falsely ↑ MCV
Imaging
 CXR
CXR CT of chest and abd: r/o lymphoma
Treatment
 WAIHA: Prednisone 1 mg/kg/day. Consider rituximab, splenectomy, danazol, cyclophosphamide in resistant cases.
 CAD: Avoid cold exposure in pts w/cold Ab.
 Drug-induced AHA: Remove drug, and consider fludarabine.
b. Microangiopathic Hemolytic Anemia
Differential Diagnosis
 TTP
TTP HUS
HUS DIC
DIC Intravascular foreign devices
Labs
 ↓ Haptoglobin, ↑ LDH
 Hemoglobinuria
Treatment
 Rx varies depending on etiology.
 Plasma exchange may be lifesaving in pts with TTP or HUS.
c. Paroxysmal Nocturnal Hemoglobinuria (PNH)
Diagnosis
 CBC (anemia, leukopenia, thrombocytopenia, reticulocytosis)
 ↓ Serum iron saturation, ↓ ferritin
 RBC smear: spherocytes
 (−) Coombs test, (+) Ham test
 ↓ LAP, ↓ haptoglobin, ↑ LDH
 ↑ Urine hemoglobin, urobilinogen, hemosiderin
 Flow cytometry for detection of CD55 and CD59 deficiency on surface of peripheral erythrocytes/leukocytes
 Normoblastic hyperplasia on marrow aspirate or bx
H&P
 First morning urinary void reveals hemoglobinuria with progressive clearing throughout day (25%), bleeding/anemia (30%), and thrombosis (40%).
Treatment
 Anticoagulation in acute thrombotic event: Consider prophylaxis if >50% CD55− or CD59−deficient.
 Eculizumab has shown ↓ transfusion requirements, ↑ quality of life.
d. Hemolytic Transfusion Reaction
Acute Hemolytic Transfusion Reaction (AHTR)
Physical Exam and Clinical Findings
 Hypotension, fever, kidney failure, pain at transfusion site, DIC
Treatment
 Stop transfusion immediately, recheck specimen for incompatibility, and provide supportive care (fluid resuscitation, vasopressor support, mannitol).
Delayed Hemolytic Transfusion Reaction (DHTR)
Physical Exam and Clinical Findings
 5-10 days s/p transfusion: anemia, jaundice, fever
Treatment
 Supportive care
3. Congenital Hemolytic Anemias
a. Sickle Cell Syndrome
Diagnosis
H&P
 PE is variable, depending on the degree of anemia and presence of acute vaso-occlusive syndromes or neurologic, CV, GU, and musculoskeletal complications.
 Bones are the most common site of pain. Dactylitis, or hand-foot syndrome (acute, painful swelling of the hands and feet), is the first manifestation of sickle cell disease in many infants.
 Pneumonia develops during the course of 20% of painful events and can manifest as chest and abd pain. In adults, chest pain may be a result of vaso-occlusion in the ribs and often precedes a pulmonary event. The lower back is also a frequent site of painful crisis in adults.
 The acute chest syndrome manifests w/chest pain, fever, wheezing, tachypnea, and cough. CXR reveals pulmonary infiltrates. Common causes include infection (mycoplasma, chlamydia, viruses), infarction, and fat embolism.
 Musculoskeletal and skin abnlities: leg ulcers (particularly on the malleoli) and limb-girdle deformities caused by avascular necrosis of the femoral and humeral heads
 Endocrine abnlities: delayed sexual maturation and late physical maturation, especially evident in boys
 Neurologic abnlities: seizures and MS changes
 Infections: Salmonella, Mycoplasma, and Streptococcus are common.
 Severe splenomegaly secondary to sequestration often occurs in children before splenic atrophy.
Labs
 Hgb electrophoresis confirms the dx and can identify Hgb variants, such as fetal Hgb and Hgb A2.
 ↑ Bili and LDH ↓ haptoglobin
 Peripheral blood smear: sickle cells, target cells, poikilocytosis, hypochromia
 ↑ BUN and Cr: in pts w/progressive renal insufficiency
 U/A: hematuria, proteinuria
Imaging
 CXR
CXR Bone scan or MRI scan in suspected osteomyelitis
 CT or MRI of brain: in pts w/TIA, CVA, seizures, or MS changes
 Transcranial Doppler study: in pts at risk for stroke
 Doppler echocardiography: r/o pulmonary HTN
Treatment
 Avoidance of conditions that may precipitate sickling crisis, such as hypoxia, infections, acidosis, and dehydration
 Maintain adequate hydration (PO or IV).
 Correct hypoxia.
 Pain relief during the vaso-occlusive crisis
 Indications for transfusion include aplastic crises, severe hemolytic crises (particularly during third trimester of pregnancy), acute chest syndrome, and high risk of stroke.
 Hydroxyurea is indicated for severe disease, typically in pts w/> 3 acute painful crises or episodes of the acute chest syndrome in the previous year.
 Replace folic acid (1 mg PO qd).
 Exchange transfusions: Consider for pts w/acute neurologic signs, in aplastic crisis, or undergoing surgery.
 Allogeneic SCT can be curative in young pts w/symptomatic sickle cell disease; however, the death rate from the procedure is nearly 10%.
 PCN V 125 mg PO bid should be administered by age 2 mo and to 250 mg bid by age 3 yr. PCN prophylaxis can be discontinued after age 5 yr except in children who have had splenectomy.
b. Thalassemia
β-Thalassemia
 β (+)-Thalassemia (suboptimal β-globin synthesis)
 β (0)-Thalassemia (total absence of β-globin synthesis)
 δ-β-Thalassemia (total absence of both δ-globin and β-globin synthesis)
 Lepore hemoglobin (synthesis of small amounts of fused δ-β-globin and total absence of δ- and β-globin)
 Hereditary persistence of fetal hemoglobin (HPHF) (increased hemoglobin F synthesis and reduced or absence of δ- and β-globin)
α-Thalassemia
 Silent carrier (three α-globin genes present)
 α-Thalassemia trait (two α-globin genes present)
 Hemoglobin H disease (one α-globin gene present)
 Hydrops fetalis (no α-globin gene)
 Hemoglobin constant sprint (elongated α-globin chain)
H&P
β-Thalassemia
 Heterozygous β-thalassemia (thalassemia minor): no or mild anemia, microcytosis and hypochromia, mild hemolysis manifested by slight reticulocytosis and splenomegaly
 Homozygous β-thalassemia (thalassemia major): intense hemolytic anemia; transfusion dependency; bone deformities (skull and long bones); hepatomegaly; splenomegaly; iron overload leading to cardiomyopathy, diabetes mellitus, and hypogonadism; growth retardation; pigment gallstones; susceptibility to infection
 Thalassemia intermedia caused by combination of β- and α-thalassemia or β-thalassemia and Hgb Lepore: resembles thalassemia major but is milder
α-Thalassemia
 Silent carrier: no symptoms
 α-Thalassemia trait: microcytosis only
 Hemoglobin H disease: moderately severe hemolysis with microcytosis and splenomegaly
 The loss of all four α-globin genes is incompatible with life (stillbirth of hydropic fetus).
Diagnosis
Labs: β-Thalassemia
 Microcytosis (MCV: 55 to 80 fL)
 Smear: nucleated RBCs, anisocytosis, poikilocytosis, polychromatophilia, Pappenheimer and Howell-Jolly bodies
 Hemoglobin electrophoresis: ↓ hemoglobin A, increased fetal hemoglobin, variable increase in the amount of hemoglobin A2
 Markers of hemolysis: elevated indirect bilirubin and lactate dehydrogenase, decreased haptoglobin
Labs: α-Thalassemia


Treatment
 Thalassemia minor: No treatment is indicated, but avoid iron administration for incorrect diagnosis of iron deficiency.
 β-Thalassemia major (and hemoglobin H disease)
c. Glucose-6 Phosphate Dehydrogenase (G6PD) Deficiency
Etiology
 Mutation on X chromosome
 Most common RBC enzyme defect → inability to generate NADPH = hemolysis when exposed to oxidant stress
Diagnosis
H&P
 Episodic hemolysis following exposure to fava beans (Mediterranean G6PD variant) or drugs (nitrofurantoin, dapsone, trimethoprim-sulfamethoxazole) in African variant form
Labs
 Peripheral smear: “bite” cells, denturated oxidized hemoglobin (Heinz bodies)
 G6PD levels not helpful during acute hemolysis (may be falsely normal because of ↑ G6PD in young reticulocytes)
Treatment
 Removal of offending agent, supportive care
d. Hereditary Spherocytosis
Etiology
 Autosomal dominant
 Most common RBC membrane disorder → spectrin deficiency = loss of erythrocyte surface area → spherocytic shape → trapping and destruction in spleen
Diagnosis
H&P
 Neonatal jaundice, hx anemia, gallstones, splenomegaly
Labs
 Osmotic fragility test with 24-hr incubation = ↑ fragility
 Direct Coombs (−)
 Peripheral smear: spherocytes
Treatment
 Vaccination against meningococcus, pneumococcus, Hib followed by splenectomy in symptomatic pts
B. Bone Marrow Failure Syndromes
1. Aplastic Anemia
Diagnosis
Labs
 CBC: pancytopenia. Macrocytosis and toxic granulation of neutrophils may also be present. Isolated cytopenias may occur in the early stages, ↓ reticulocyte count.
 Additional initial labs: vitamin B12 level, RBC folate, HIV, Ham test (r/o PNH) hepatitis serology
 Bone marrow examination: paucity or absence of erythropoietic and myelopoietic precursor cells. Pts w/pure red cell aplasia demonstrate only absence of RBC precursors in the marrow.
 Chromosomal breakpoint analysis to r/o Fanconi anemia in pts <50 yr old
Treatment
 Transplantation of allogeneic marrow (HSCT) or peripheral blood SCT from a histocompatible sibling is preferred initial Rx (cure rate >80%) in pts <40 yr old.
 Immunosuppressive Rx with ATG and cyclophosphamide is indicated in pts who are not candidates for allogeneic bone marrow (long-term survival >60%).
2. Pure Red Cell Aplasia (PRCA)
Etiology
 Idiopathic or secondary (thymoma, parvovirus B19, meds [chloramphenicol, phenytoin, INH]), collagen vascular and lymphoproliferative disorders, pregnancy)
 PE: splenomegaly, signs of RA (33% of pts)
Diagnosis
 Flow cytometry: CD57+ T-cells, clonality T-cell receptor gene rearrangement
 Normocytic anemia
 Presence of large granular lymphocytes when PRCA results from large granular lymphocytosis
Treatment
 Removal of offending drugs/Rx secondary condition (IV Ig if parvovirus B19 infection)
 Refractory cases: prednisone, ATG, cyclosporine, cyclophosphamide (first-line agents with response 3-12 wk)
 If sx anemia: erythrocyte transfusion
3. Thrombocytopenia
Etiology
 ↑ Destruction
 ↓ Production
 Splenic sequestration
 Hypersplenism
 Dilutional (massive transfusion)
Diagnosis
Diagnostic Approach (Fig. 7-2)
 Thorough hx (particularly drug hx)
 PE: Evaluate for presence of splenomegaly (hypersplenism, leukemia, lymphoma).
Labs
 CBC, Coombs, LDH, INR, PTT, Plt Ab, D-dimer, fibrinogen level
 Peripheral blood smear; note Plt size and other abnlities (e.g., fragmented RBCs may indicate TTP or DIC; ↑ Plt size suggests accelerated destruction and release of large young Plt into the circulation, normal smear and ↑ platelet size = ITP).
 Bone marrow: ↑ megakaryocytes suggest accelerated Plt destruction.
4. Neutropenia
Etiology
 Congenital: mild forms not associated with ↑ infection risk; Rx not necessary
FIGURE 7-2 Evaluation of thrombocytopenia. (From Goldman L, Schafer AI [eds]: Goldman’s Cecil Medicine, 24th ed. Philadelphia, Saunders, 2012.)
 Acquired: drugs (chemotherapeutic agents, antibiotics [trimethoprim/sulfamethoxazole, cephs, chloramphenicol], anticonvulsants [phenytoin, carbamazepine], NSAIDs, antiarrhythmics [procainamide, amiodarone]), SLE, RA (Felty syndrome if splenomegaly present), viral infections (CMV, EBV, HIV), bacterial infections (S. pneumoniae, N. meningitidis), rickettsia, vitamin B12 and folate deficiencies, myelodysplasia, large granular lymphocytosis, and other malignant disorders
 PE: splenomegaly, signs of RA (Felty syndrome)
Diagnosis
 Antineutrophil Ab (if test available)
 Bone marrow exam if suspecting stem cell disorder

C. Myelodysplastic Syndromes
Classification

 The WHO classification includes the following disease subtypes: refractory anemia, refractory anemia w/ringed sideroblasts, refractory cytopenia w/multilineage dysplasia, refractory cytopenia w/multilineage dysplasia and ringed sideroblasts, refractory anemia w/excessive blasts (1, 2), unclassified myelodysplastic syndrome, and myelodysplastic syndrome associated w/isolated deletion (5q).
TABLE 7-2
French-American-British Classification Chart
| Subtype | Abbreviation | Peripheral Blood | Bone Marrow |
| Refractory anemia | RA | Blasts <1% | Blasts <5% |
| Refractory anemia with ringed sideroblasts | RARS | Blasts <1% | Blasts <5%, and >15% ringed sideroblasts |
| Refractory anemia with excess blasts | RAEB | Blasts <5% | Blasts 5%-20% |
| Refractory anemia with excess blasts in transformation | RAEB-T | Blasts >5% | Blasts 20%-30% or Auer rods |
| Chronic myelomonocytic leukemia | CMML | Monocytes >1 × 10⁹/L | Any of the above |
| Acute myelogenous leukemia | AML | Blasts >30% |

From Hoffman R et al: Hematology, basic principles and practice, ed 5, Philadelphia 2009, Churchill Livingston.
Diagnosis
H&P
 Splenomegaly, skin pallor, mucosal bleeding, and ecchymosis may be present.
 Fatigue, fever, dyspnea
Labs
 CBC w/diff, HIV, RBC folate, vitamin B12 level, bone marrow exam, cytogenetic analysis
Treatment
Prognosis
 Risk of transformation to AML varies w/% of blasts in bone marrow.
 Advanced age, male sex, and deletion of chromosomes 5 and 7 are associated w/poor prognosis.
 The most important variables in disease outcome are the specific cytogenetic abnlities, the % of blasts in bone marrow, and the number of hematopoietic lineages involved in the cytopenias.
D. Myeloproliferative Disorders
1. Polycythemia Vera
Diagnosis (Fig. 7-3)
Clinical Presentation
 Sx associated w/ ↑ blood volume and viscosity or impaired Plt function
FIGURE 7-3 Diagnostic algorithm for polycythemia vera (P. vera). (From Goldberger E: Treatment of Cardiac Emergencies, 5th ed. St. Louis, Mosby, 1990.)
 Abd discomfort secondary to splenomegaly, hepatomegaly
 Nephrolithiasis and gouty arthritis from hyperuricemia
PE
 Facial plethora, congestion of oral mucosa, ruddy complexion
 Enlargement and tortuosity of retinal vein
 Splenomegaly (>75% of pts)
Labs
 ↑ RBC count, ↑ Hgb/Hct
 ↑ WBC (often w/basophilia), ↑ Plts (majority of pts)
 ↑ LAP, serum vitamin B12, and uric acid levels
 ↓ Serum erythropoietin level
 + JAK2 V617F mutation (>95% of pts)
 Nl O2 sat
 Bone marrow exam: RBC hyperplasia and absent iron stores
Treatment
 ASA 81 mg/day
 Phlebotomy to keep Hct <45%
 Additional options: hydroxyurea, interferon alfa-2b
Prognosis
 The median survival time w/o Rx is 6 to 18 mo after dx; phlebotomy extends the average survival time to 12 yr.
 Prognosis worse in pts >60 yr of age and those who have h/o thrombosis.
2. Essential Thrombocythemia
Epidemiology and Presentation
 <1% of pts progress to AML.
 20%-30% arterial/venous thrombosis. Leukocytosis predicts severity.
 If + JAK2 V617F mutation (50% pts) is present, then the course is more aggressive.
 Hemorrhagic sx (40%)
Diagnosis
 Plt count >600,000/μL on 2 separate occasions 1 mo apart
Treatment
 Plt-lowering agents in pt >65 yr old w/hx/↑ risk thrombosis
 Hydroxyurea + low-dose ASA = ↓ risk thrombosis
 Interferon alfa (pregnant pt) or 32P in refractory cases
3. Chronic Myeloid Leukemia
Three Major Phases
Chronic Phase (Months to Years)
 Asymptomatic after Rx
 No features of accelerated phase or blast crisis
Accelerated Phase
 Leukocyte count increasingly difficult to control w/standard Rx
 ↑ Blast %
 Progressive anemia or thrombocytopenia
 New cytogenetic abnlities, especially a second Ph chromosome or trisomy 8
 Worsening constitutional sx
 Progressive splenomegaly
 Development of myeloblastomas or myelofibrosis
Blast Crisis
 >30% blasts plus promyelocytes in blood or bone marrow
Diagnosis
H&P
 40% of pts are asymptomatic, and dx is based solely on an abnl blood count. Common complaints at the time of dx are weakness and discomfort secondary to an enlarged spleen (abd discomfort or pain). Splenomegaly is present in up to 40% of pts at time of dx.
Labs
 WBC count (generally >100,000/mm3) w/broad spectrum of granulocytic forms, ↓ Hgb/Hct, ↑ Plt
 Bone marrow: hypercellularity w/granulocytic hyperplasia, ratio of myeloid cells to erythroid cells, and number of megakaryocytes. Blasts and promyelocytes constitute <10% of all cells.
 ↑↑ LAP (can distinguish CML from other myeloproliferative disorders)
Treatment
 BCR-ABL inhibitors: imatinib. Nilotinib or dasatinib can be used in pts resistant to or intolerant of imatinib.
 Allogeneic HSCT in pts resistant to BCR-ABL inhibitors
4. Primary Myelofibrosis
Epidemiology and Presentation
 Fatigue, night sweats, wt loss, abd pain, early satiety, gout, bone pain, pulmonary HTN
 Hepatomegaly
 Extramedullary hematopoiesis (vertebrae, lymph nodes)
Diagnosis
 +JAK2 mutation (50% pts)
 ↑ LDH, uric acid, alk phos
 Peripheral smear: leukoerythroblastic (L-shifted granulopoiesis, nucleated teardrop RBCs)
Treatment


5. Acute Myeloid Leukemia (AML)
Diagnosis
H&P
 Pts come to medical attention because of the effects of the cytopenias:
 PE: skin pallor, bruises, petechiae, hepatosplenomegaly, peripheral lymphadenopathy
Labs
 CBC: anemia, thrombocytopenia. Peripheral WBC count varies from <5000 to >100,000/mm3.
 Dx requires >20% blast cells in blood or bone marrow.
 Flow cytometry and (+) myeloperoxidase stains distinguish AML from ALL.
Treatment
 Induction chemo: cytarabine + daunorubicin
 Consolidation Rx: high-dose cytarabine in younger pts with favorable risk, intermediate-dose cytarabine in older pts; allogeneic HSCT in pts with high-risk disease
 Sx hyperleukocytosis: leukapheresis, hydroxyurea
Clinical Pearl
 Acute promyelocytic leukemia (APL) is a variant of AML (+ 15;17 gene translocation). APL is associated with DIC. Rx by adding all trans-retinoic acid (ATRA) to standard chemo = >75% cure. ATRA Rx may result in differentiation syndrome (fever, +/- pulmonary infiltrate, dyspnea hypotension, edema) which is treated with dexamethasone
6. Acute Lymphoblastic Leukemia (ALL)
 Malignancy of B or T lymphoblasts
Diagnosis
H&P
 Skin pallor, purpura, or easy bruising
 Lymphadenopathy or hepatosplenomegaly
 Fever, bone pain, oliguria, weakness, weight loss, change in MS, headaches, cranial nerve palsy
Labs
 CBC: normochromic, normocytic anemia; thrombocytopenia
 Peripheral smear: lymphoblasts
 Dx requires >25% blast cells in bone marrow.
 Flow cytometry and (−) myeloperoxidase stains distinguish ALL from AML.
Treatment
 Intrathecal chemoprophylaxis w/w/o cranial irradiation (because of ↑ risk CNS involvement)
 Prevention of urate nephropathy by vigorous hydration, rasburicase
 Induction Rx: anthracycline, vincristine, L-asparaginase + corticosteroid
 Maintenance chemoRx with multiple agents for 2 to 3 yr to maintain a state of remission
 Allogeneic HSCT in first remission in pts with high-risk disease
 Prognosis is generally poorer in adult disease compared w/childhood disease (30%-40% adult cure rate vs. 80% cure rate in children).
E. Multiple Myeloma and Related Disorders
1. Multiple Myeloma (MM)
Diagnosis
 Diagnostic criteria:
 “Asymptomatic myeloma”: M protein ≥3 g/dL or ≥10% plasma cells on bone marrow but absence of myeloma-related end-organ damage
 “Nonsecretory myeloma”: MM w/o detectable monoclonal protein
 Staging (International Staging System)
H&P
 Bone pain (58%) (back, thorax) or pathologic Fxs (30%) resulting from osteolytic lesions
 Fatigue (32%) or weakness from anemia secondary to bone marrow infiltration w/plasma cells
 Recurrent infections from impaired neutrophil function and deficiency of nl immunoglobulins
 N/V related to constipation and uremia
 Delirium resulting from hypercalcemia
 Neurologic complications: spinal cord or nerve root compression, blurred vision from hyperviscosity
 Purpura, epistaxis: from thrombocytopenia
 Peripheral neuropathy: uncommon, seen with coexisting AL amyloidosis (POEMS syndrome [Polyneuropathy, organomegaly, Endocrinopathy, Monoclonal protein, Skin changes])
Labs
 Normochromic, normocytic anemia; rouleaux formation on peripheral smear
 Hypercalcemia (15% of pts at dx)
 ↑ BUN, Cr, uric acid, and total protein
 Proteinuria secondary to overproduction and secretion of free monoclonal κ or λ chains (Bence Jones protein).
 Tall homogeneous monoclonal spike (M spike) on protein IEP (75% of pts). ↑ immunoglobulins are generally IgG (75%) or IgA (15%).
 <20% of pts have flat level of immunoglobulins but light chains in the urine by electrophoresis.
 <3% of pts have nonsecreting myeloma (no ↑ in immunoglobulins and no light chains in the urine) but have other evidence of the disease (e.g., bone marrow exam).
 ↓ AG from the + charge of the M proteins and the frequent presence of hyponatremia in pts w/myeloma
 Hyponatremia, serum hyperviscosity
Imaging
 X-ray films of painful areas: punched-out lytic lesions
 MRI: for suspected spinal compression or soft tissue plasmacytomas
 Bone scans not useful because lesions are not blastic
Treatment
 Treatment strategy is mainly related to age and comorbidities.
 Initiation of induction Rx with thalidomide, lenalidomide, or bortezomib plus HSCT is indicated for pts <65 yr old who do not have substantial heart, lung, renal, or liver dysfunction.
 Autologous stem-cell transplantation with a reduced-intensity conditioning regimen should be considered in older pts or those with coexisting conditions.
 Rx of pts who are not candidates for HSCT (because of age or comorbidities) is with melphalan + prednisone + thalidomide or bortezomib.
 Prompt dx and Rx of infections. Common bacterial agents are Streptococcus pneumoniae and Haemophilus influenzae. Prophylaxis against Pneumocystis w/TMP-SMZ is indicated in pts receiving chemoRx and high-dose corticosteroid regimens.
 Vaccinate against S. pneumoniae, influenza, and H. influenzae.
 Rx hypercalcemia w/IV fluids, corticosteroids, bisphosphonates (pamidronate, zoledronate).
 Pain management w/analgesics. RT for painful bone lesions or spinal cord compression. Surgical stabilization of pathologic Fx. Consider vertebroplasty or kyphoplasty for selected vertebral lesions.
2. Monoclonal Gammopathy of Undetermined Significance (MGUS)
Diagnostic Criteria
 Serum M protein concentration <3 g/dL
 <10% plasma cells in the bone marrow
 Absence of anemia/renal insufficiency/hypercalcemia/bone lesions
Treatment
 Rx not indicated. Risk of progression of MGUS to MM is 1%/yr and is related to the level of M protein values and to the type of protein (↑ risk w/higher M protein values and in pts w/IgM and IgA M proteins).
 Monitor serum M protein. If serum M protein is >2 g/dL, repeat electrophoresis every 6 mo.
3. Waldenstrom’s Macroglobulinemia
Diagnosis
H&P
 Weakness, fatigue, weight loss, fever, night sweats
 Mucosal bleeding, bruising
 Headache, dizziness, vertigo, deafness, and seizures (hyperviscosity syndrome)
 Fever, night sweats
 Exam: ecchymoses, purpura, hepatomegaly, splenomegaly, lymphadenopathy, symmetric peripheral neuropathy
Diagnostic Criteria
 Presence of lymphoplasmacytic lymphoma ≥10% of bone marrow cellularity + presence of an IgM M protein
Labs
 CBC w/diff: anemia; WBC count usually nl. Thrombocytopenia may occur.
 Peripheral smear may reveal “stacked coin” rouleaux formations.
 SPEP: homogeneous M spike (monoclonal gammopathy). IEP confirms IgM responsible for the M spike.
 Urine IEP: Monoclonal light chains are usually κ chains.
 Serum viscosity: Sx usually occur when the serum viscosity is 4× nl; this is a classic feature, although present in only 15% of cases.
Treatment
 Plasmapheresis if sx of hyperviscosity
 Rx rituximab ± nucleoside analogues (fludarabine, cladribine) or alkylating agent (chlorambucil, cyclophosphamide)
4. AL Amyloidosis
Diagnosis
 Histologic confirmation is necessary with a fat pad and bone marrow bx with Congo red staining to establish a diagnosis.
 If a noninvasive fat pad bx does not establish a diagnosis, then bx of the affected organ may be needed.
H&P
 Findings depend on organ system involvement: edema, fatigue, dyspnea, abd pain, dizziness, bleeding.
 Macroglossia, periorbital ecchymoses (raccoon eyes), peripheral neuropathy, tendinopathy
Treatment
 Melphalan and prednisone
F. Lymphoid Malignancies
1. Non-Hodgkin’s Lymphoma
Diagnosis
H&P
 Asymptomatic lymphadenopathy
 Hepatomegaly and splenomegaly
 One third of NHL originates extranodally. Involvement of extranodal sites can result in unusual presentations (e.g., GI tract involvement can simulate PUD).
 NHL cases associated w/HIV infection occur predominantly in the brain.
Labs
 Labs: CBC, ESR, U/A, LDH, BUN, Cr, serum Ca, uric acid, LFTs, SPEP, HIV, Hep C and Hep B screen. β2-microglobulin levels should be obtained initially (prognostic value) and serially in pts w/low-grade lymphomas (useful to monitor therapeutic response of the tumor).
 Bone marrow (aspirate and full bone core bx)
Imaging
 CXR (PA and lateral)
 CT scan of abd and pelvis; CT scan of chest if CXR abnl
 PET scan
 Bone scan (particularly in pts w/histiocytic lymphoma)
 Classification and staging
 The WHO classification is described in Table 7-3. NHLs are also subdivided in 3 major groups: low grade (indolent), intermediate (aggressive), and high grade (highly aggressive).
 Staging: The Ann Arbor classification is used to stage NHLs (Table 7-4). Histopathology has greater therapeutic implications in NHL than in Hodgkin’s disease.
TABLE 7-3
WHO Classification of Non-Hodgkin’s Lymphoma
| B-Cell Lymphomas | |
| Precursor B-cell lymphoma | Precursor B lymphoblastic lymphoma/leukemia |
| Mature B-cell lymphoma | Chronic lymphocytic leukemia/small lymphocytic lymphoma Lymphoplasmacytic lymphoma Splenic marginal zone lymphoma Extranodal marginal zone B-cell lymphoma of mucosa-associated lymphoid tissue (MALT lymphoma) Nodal marginal zone B-cell lymphoma Follicular lymphoma Mantle cell lymphoma Diffuse large B-cell lymphoma Mediastinal (thymic) large B-cell lymphoma Intravascular large B-cell lymphoma Primary effusion lymphoma Burkitt’s lymphoma/leukemia |
| T/NK-Cell Lymphomas | |
| Precursor T-cell lymphoma | Precursor T-cell lymphoblastic leukemia/lymphoma Blastic NK-cell lymphoma |
| Mature T/NK-cell lymphoma | Adult T-cell leukemia/lymphoma Extranodal NK/T-cell lymphoma, nasal type Enteropathy-type T-cell lymphoma Hepatosplenic T-cell lymphoma Subcutaneous panniculitis-like T-cell lymphoma Mycosis fungoides Sézary’s syndrome Primary cutaneous anaplastic large-cell lymphoma Peripheral T-cell lymphoma, unspecified Angioimmunoblastic T-cell lymphoma Anaplastic large-cell lymphoma |
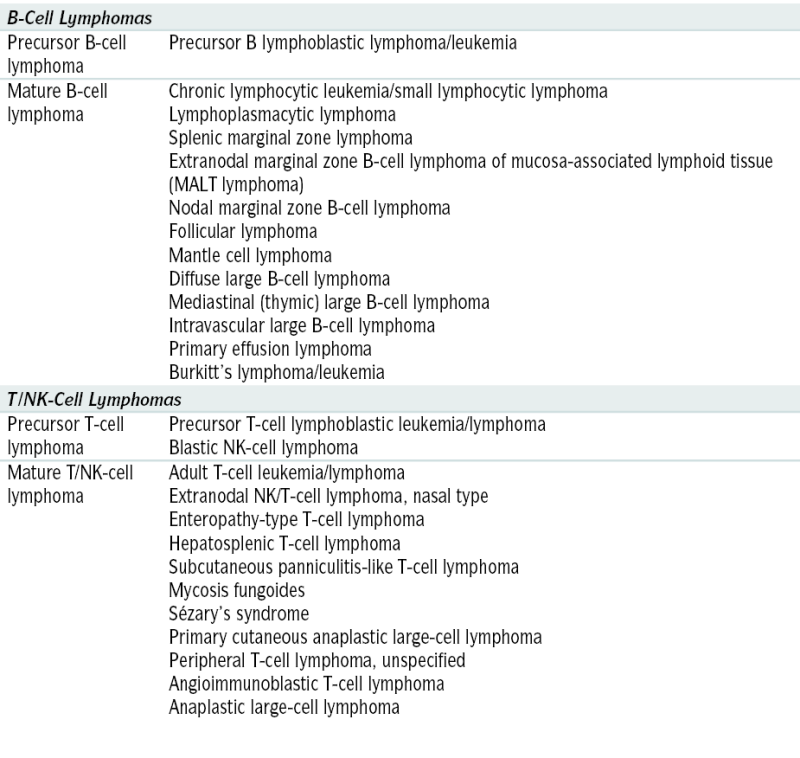
Adapted from Jaffe ES, Harris NL, Stein H, Vardiman JW (eds): World Health Organization Classification of Tumors: Pathology and Genetics. Tumors of Hematopoietic and Lymphoid Tissues. Lyons, France, IARC Press, 2001.
Treatment and Prognosis

2. Chronic Lymphocytic Leukemia (CLL)
Definition
 Lymphoproliferative disorder characterized by proliferation and accumulation of mature-appearing neoplastic lymphocytes
TABLE 7-4
Ann Arbor Staging System for Lymphomas
| Stage∗ | Cotswold Modification of Ann Arbor Classification |
| I | Involvement of a single lymph node region or lymphoid structure |
| II | Involvement of two or more lymph node regions on the same side of the diaphragm (the mediastinum is considered a single site, whereas the hilar lymph nodes are considered bilaterally); the number of anatomic sites should be indicated by a subscript (e.g., II3) |
| III | Involvement of lymph node regions on both sides of the diaphragm: III1 (with or without involvement of splenic hilar, celiac, or portal nodes) and III2 (with involvement of para-aortic, iliac, and mesenteric nodes) |
| IV | Involvement of one or more extranodal sites in addition to a site for which the designation E has been used |
∗ All cases are subclassified to indicate the absence (A) or presence (B) of the systemic symptoms of significant fever (>38.0° C [100.4° F]), night sweats, and unexplained weight loss exceeding 10% of normal body weight within the previous 6 mo. The clinical stage (CS) denotes the stage as determined by all diagnostic examinations and a single diagnostic bx only. In the Ann Arbor classification, the term pathologic stage (PS) is used if a second bx of any kind has been obtained, whether negative or positive. In the Cotswold modification, the PS is determined by laparotomy; X designates bulky disease (widening of the mediastinum by more than one third or the presence of a nodal mass >10 cm), and E designates involvement of a single extranodal site that is contiguous or proximal to the known nodal site.
From Hoffman R, Benz EJ, Shattil SJ, et al (eds): Hematology: Basic Principles and Practice, 5th ed. New York, Churchill Livingstone, 2009.
TABLE 7-5
Combination Chemotherapy Regimens for Non-Hodgkin’s Lymphoma
| Regimen | Dose | Days of Administration | Frequency |
| CHOP-R | Every 21 days | ||
| Cyclophosphamide | 750 mg/m2 IV | 1 | |
| Doxorubicin | 50 mg/m2 IV | 1 | |
| Vincristine | 1.4 mg/m2 IV∗ | 1 | |
| Prednisone, fixed dose | 100 mg PO | 1-5 | |
| Rituximab | 375 mg/m2 IV | 1 | |
| CVP-R | Every 21 days | ||
| Cyclophosphamide | 1,000 mg/m2 IV | 1 | |
| Vincristine | 1.4 mg/m2 IV∗ | 1 | |
| Prednisone, fixed dose | 100 mg PO | 1-5 | |
| Rituximab | 375 mg/m2 IV | 1 | |
| FCR | Every 28 days | ||
| Fludarabine | 25 mg/m2 IV | 1-3 | |
| Cyclophosphamide | 250 mg/m2 IV | 1-3 | |
| Rituximab | 375 mg/m2 | 1 |
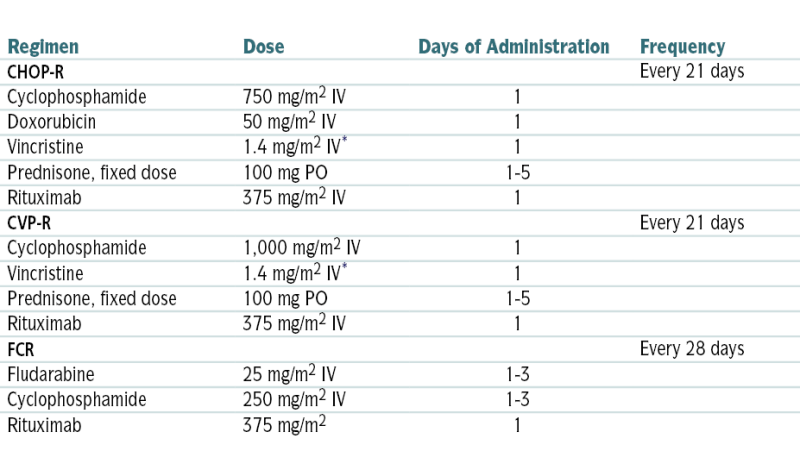
∗ Vincristine dose often capped at 2 mg total.
From Goldman L, Schafer AI (eds): Goldman’s Cecil Medicine, 24th ed. Philadelphia, Saunders, 2012.
TABLE 7-6
International Prognostic Index for Aggressive Lymphomas∗
| Risk Group | IPI Score | CR Rate (%) | 5-Yr Overall Survival (%) |
| Low | 0, 1 | 87 | 73 |
| Low intermediate | 2 | 67 | 51 |
| High intermediate | 3 | 55 | 43 |
| High | 4, 5 | 44 | 26 |
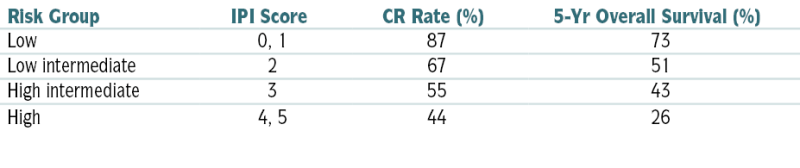
CR, Complete response; ECOG, Eastern Cooperative Oncology Group; IPI, International Prognostic Index.
∗ One point is given for the presence of each of the following characteristics: age >60 yr, elevated serum LDH level, ECOG performance status ≥2, Ann Arbor stage III or IV, and >2 extranodal sites.
From Hoffman R, Benz EJ, Shattil SJ, et al (eds): Hematology: Basic Principles and Practice, 5th ed. New York, Churchill Livingstone, 2009.
Diagnosis
H&P
 Clinical presentation varies according to stage of the disease. Some pts come to medical attention because of weakness and fatigue (secondary to anemia) or lymphadenopathy. Many cases are diagnosed on the basis of lab results obtained after routine PE.
Labs


Staging (Table 7-7)
 The pt’s prognosis is related to the clinical stage (e.g., the average survival in pts in Rai stage 0 is >120 mo; whereas for Rai stage 4 it is approx 30 mo) and several other adverse factors such as high serum β2-microglobulin levels (>3.5 mg/L),+ ZAP 70, cytogenetic studies unmutated heavy gene), lymphocyte doubling time (<12 mo), and mutational gene assessment (presence del [17p13][p53]). Overall 5-yr survival is 60%.
TABLE 7-7
Rai Staging Systems in Chronic Lymphocytic Leukemia
| Lymphocytosis | Lymphadenopathy | Hepatomegaly or Splenomegaly | Hemoglobin (g/dL) | Platelets × 103/μL | |
| Rai Stage | |||||
| 0 | + | − | − | ≥11 | ≥100 |
| I | + | + | − | ≥11 | ≥100 |
| II | + | ± | + | ≥11 | ≥100 |
| III | + | ± | ± | <11 | ≥100 |
| IV | + | ± | ± | Any | <100 |
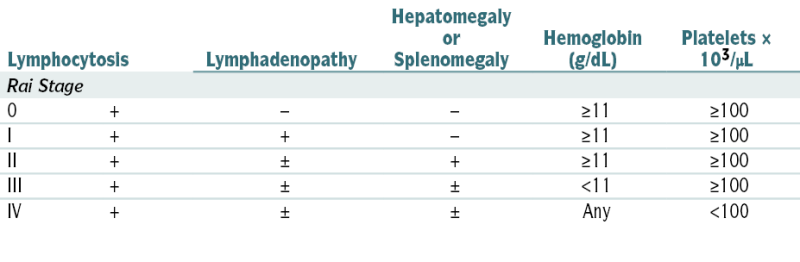
From Goldman L, Bennett JC (eds): Cecil Textbook of Medicine, 21st ed. Philadelphia, Saunders, 2000.
Treatment
 Rai stage 0: observation
 Symptomatic pts in Rai stages I and II: fludarabine; local irradiation for isolated symptomatic lymphadenopathy and lymph nodes that interfere w/vital organs
 Rai stages III and IV: rituximab + combination chemo
3. Hairy Cell Leukemia
Definition
 Lymphoid neoplasm characterized by the proliferation of mature B cells w/prominent cytoplasmic projections (hairs)
Diagnosis
H&P
 PE: splenomegaly (>90% of cases) secondary to tumor cell infiltration
Labs
 CBC: pancytopenia involving erythrocytes, neutrophils, and Plts
 Peripheral smear: hairy cells (5%-80% of cells in the peripheral blood). The cytoplasmic projections on the cells are redundant plasma membranes.
 Leukemic cells stain + for tartrate-resistant acid phosphatase (TRAP)
 Bone marrow may result in a “dry tap” (because of marrow reticulin).
Treatment
 Cladribine
4. Hodgkin’s Lymphoma
Diagnosis
H&P
 Palpable lymphadenopathy, generally painless, is the most common presenting sx.
 The most common site of involvement is the neck region.
 Fever and night sweats: Fever in a cyclical pattern (days or weeks of fever alternating w/afebrile periods) is known as Pel-Epstein fever.
 Wt loss, generalized malaise
 Persistent, nonproductive cough
 Pruritus
Labs
 Dx is confirmed w/lymph node bx.
Staging and Prognostic Risk Factors
 Detailed H&P (w/documentation of “B sx”)
 Surgical bx
 Labs (CBC, ESR, BUN, Cr, alk phos, LFTs, alb, LDH, uric acid)
 CT scan of chest, abd, pelvis, neck
 18-FDG PET scan
 Staging for Hodgkin’s disease follows the Ann Arbor staging classification (see Table 7-4).
 Prognostic risk factors are male sex, age >45 yr, leukocyte count >15,000/μL, serum albumin <4 g/dL, Hgb <10.5 g/dL.
Treatment
 Rx is determined by disease stage and not histology (same Rx for all cell types).
 Stage I and II: radiation Rx alone unless a large mediastinal mass is present (mediastinal-to-thoracic ratio ≥1.3); in the latter case, a combination of chemoRx (doxorubicin + bleomycin + vincristine + dacarbazine [ABVD]) and RT may be used.
 Stage IB or IIB: RT is often used, although ABVD chemo is performed in many centers.
 Stage IIIA: Rx is controversial. It varies w/the anatomic substage after splenectomy.
 III1A and minimum splenic involvement: RT alone may be adequate.
 III2 or III1A w/extensive splenic involvement: There is disagreement whether ABVD chemo alone or a combination of chemo and RT is the preferred Rx modality.
 IIIB and IVB: chemoRx w/ or w/o adjuvant RT
 BEACOPP, an intensified regimen consisting of bleomycin, etoposide, doxorubicin, cyclophosphamide, vincristine, procarbazine, and prednisone, has been advocated by some as the new standard for treatment of advanced Hodgkin’s lymphoma in place of ABVD, but the long-term clinical outcome did not differ significantly between the two regimens. In addition, with the use of the escalated BEACOPP regimen, the rate of complications is higher (3% treatment-related death, 20% rate of hospitalization, and 3% rate of secondary leukemia). Thus, if the goal is cure with the least overall toxic effects, it is best to favor ABVD Rx, reserving rescue Rx with high-dose chemoRx and autologous HSCT for pts in whom the primary treatment fails.
 Monoclonal Ab Rx: SGN-30 and MDX-060 and rituximab have shown promising results.
G. Bleeding Disorders
1. Evaluation of Suspected Bleeding Disorder
2. Hemophilia
Diagnosis
 ↑ PTT
↑ PTT ↓ Factor VIII: C level distinguishes hemophilia A from other causes of ↑ PTT.
 Nl factor VIII antigen, PT, fibrinogen level, and bleeding time
 ↓ Factor IX coagulant activity levels in pts w/hemophilia B
 Coagulation factor activity measurement is useful to correlate w/disease severity: The nl range is 50 to 150 U/dL; 5 to 20 U/dL indicates mild disease, 2 to 5 U/dL indicates moderate disease, and <2 U/dL indicates severe disease w/spontaneous bleeding episodes.
Treatment
Hemophilia A
 Plasma derived and recombinant factor VIII concentrates are effective in controlling spontaneous and traumatic hemorrhage in severe hemophilia. Recombinant factor VIII is w/o added human serum alb (↑ risk of transmission of infectious agents).
 Desmopressin (causes release of factor VIII:C) may be used in preparation for minor surgical procedures in pts w/mild hemophilia.
 Aminocaproic acid is used for persistent bleeding that is unresponsive to factor VIII concentrate or desmopressin.
Hemophilia B
 Factor IX concentrates
3. Von Willebrand’s Disease (vWD)
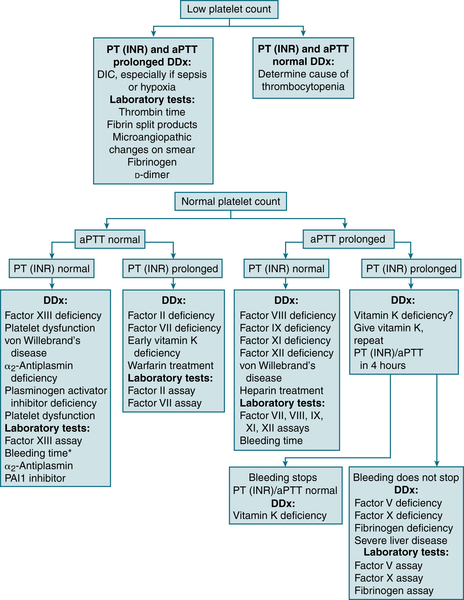
FIGURE 7-4 Differential diagnosis of bleeding disorders. ∗In many labs, “bleeding time” is no longer available and has been replaced with PFA-100. (From Cluster JW, Rau, RE: The Harriet Lane Handbook, 18th ed. St. Louis, Mosby, 2009.)
Diagnosis
H&P
 Hx mucocutaneous bleeding
 Women (menorrhagia, postpartum hemorrhage)
Labs
 ↑ Bleeding time, PFA-100 assay
 ↓ vWF Ag <30 IU/dL (“low” vWF 30-50 IU/dL), ↓ vWF activity (measured by ristocetin cofactor assay)
 ↓ Factor VIII:C
 vWF Type II A (absent ristocetin cofactor)
 vWF Type II B (↑ ristocetin agglutination)
Treatment
 Type 1 (mild) vWD: DDAVP
 Types 2, 3 vWD: infusion vWF-containing factor VIII concentrate
4. Coagulopathy of Liver Disease
 Liver disease = ↑ PT, APTT (TCT may also ↑) → coagulopathy, hypofibrinogenemia, dysfibrinogenemia, thrombocytopenia
 D-dimer clearance impaired, ↑ Plt consumption (analogous to DIC)
 ↑ INR but pt not autocoagulated and has ↑ risk of DVT
 Rx: FFP + vitamin K (correct coagulopathy)
5. Disseminated Intravascular Coagulation (DIC)
Etiology
 Infections (e.g., gram(−) sepsis, RMSF, malaria, viral or fungal infection)
 Obstetric complications (e.g., dead fetus, amniotic fluid embolism, toxemia, abruptio placentae, septic abortion, eclampsia)
 Tissue trauma (e.g., burns, hypothermia-rewarming)
 Neoplasms (e.g., adenocarcinomas [GI, prostate, lung, breast], acute promyelocytic leukemia)
 Quinine, cocaine-induced rhabdo
 Liver failure
 Acute pancreatitis
 Transfusion reactions
 Respiratory distress syndrome
 Other: SLE, vasculitis, aneurysms, polyarteritis, cavernous hemangiomas
Diagnosis
 Peripheral blood smear generally shows RBC fragments (schistocytes) and ↓ Plt count.
 Coagulation factors are consumed at a rate in excess of the capacity of the liver to synthesize them, and Plts are consumed in excess of the capacity of the bone marrow megakaryocytes to release them.
 Diagnostic characteristics of DIC are ↑ PT, PTT, TT, fibrin split products, D-dimer; ↓ fibrinogen level, thrombocytopenia.
 Coagulopathy secondary to DIC must be differentiated from that secondary to liver disease or vitamin K deficiency.
 Vitamin K deficiency: ↑ PT and nl PTT, TT, Plt count, and fibrinogen level; PTT may be ↑ in severe cases.
 Liver disease: ↑ PT and PTT; TT and fibrinogen are usually nl unless severe disease is present; Plts are usually nl unless splenomegaly is present.
 Factors V and VIII are ↓ in DIC, but they are nl in liver disease w/coagulopathy.
Treatment
 Correct and eliminate underlying cause (e.g., antimicrobial Rx for infection).
 Replacement Rx w/FFP and Plt in pts w/significant hemorrhage:
 Cryoprecipitate 1 U/5 kg is reserved for hypofibrinogen states.
 Antithrombin III Rx may be considered as a supportive therapeutic option in pts w/severe DIC. Its modest results and substantial cost are limiting factors.
 Heparin Rx at a dose lower than that used in venous thrombosis (300-500 U/hr) may be useful in selected cases to neutralize thrombin (e.g., DIC associated w/acute promyelocytic leukemia, purpura fulminans, acral ischemia).
6. Vitamin K Deficiency
Etiology
 Malabsorption syndromes, liver disease, poor dietary intake, and hereditary combined deficiencies of the vitamin K–dependent proteins, including prothrombin, factor VII, factor IX, and factor X
Lab
 ↑ PT (INR) that corrects after a 1:1 mix w/nl pooled plasma
Treatment
 Mild deficiency: PO vitamin K1 100 to 150 mg qd. INR begins to normalize after 12 hr and should normalize completely in 48 hr. Vitamin K can also be given SC (poorly absorbed in edematous pts) and IV (risk of anaphylaxis).
H. Platelet Disorders
1. Immune (Idiopathic) Thrombocytopenic Purpura (ITP)
Etiology
 Drugs commonly implicated: quinidine, heparin, abx (linezolid, vancomycin, sulfonamides, rifampin), Plt inhibitors (tirofiban, abciximab, eptifibatide), cimetidine, NSAIDs, thiazide diuretics, antirheumatic agents (gold salts, penicillamine), acetaminophen, and chemotherapeutic agents (cyclosporine, fludarabine, oxaliplatin)
Diagnosis
H&P
 Children: generally present w/sudden onset of bruising and petechiae from severe thrombocytopenia
 Adults: insidious presentation; dx often made on incidental routine labs
 Petechiae, purpura, epistaxis, or heme(+) stool from GI bleeding in pts w/severe thrombocytopenia
Labs
 CBC, Plt count, and peripheral smear: Plts are ↓ but nl or larger in size.
 Direct assay for Plt-bound Ab (+ predictive value 80%-83%)
 Additional labs: HIV, ANA, TSH, LFTs, bone marrow exam
Imaging
 CT of abd in pts w/splenomegaly (r/o lymphoma)
Treatment
 Asymptomatic pts w/Plts >30,000/mm3: observation
 Pts w/neurologic sx, internal bleeding, or those undergoing emergency surgery: methylprednisolone 30 mg/kg/day IV plus IVIG (1 g/kg/day for 2-3 days) and infusion of Plts
 Adults w/Plts <20,000/mm3 and those who have counts <50,000/mm3 and significant mucous membrane bleeding: prednisone 1 to 2 mg/kg qd, continued until the Plt count is normalized, then slowly tapered off
 Adults w/severe thrombocytopenia or bleeding: high-dose Ig (IgG 0.4 g/kg/day IV, infused on 3-5 consecutive days) or high-dose parenteral glucocorticoids (methylprednisolone 30 mg/kg/day)
 Rituximab: useful in ITP resistant to conventional Rx
 Splenectomy: Consider in adults w/Plts <30,000/mm3 after 6 wk of medical Rx or after 6 mo if >20 mg of prednisone/day is required to maintain Plts >30,000/mm3.
 Plt transfusion: only in case of life-threatening hemorrhage
 Eltrombopag and romiplostim: Rx of chronic ITP refractory to corticosteroids, immunoglobulins, or splenectomy
2. Heparin-Induced Thrombocytopenia (HIT)
Diagnosis and Treatment
 HIT usually develops within 5 to 10 days after heparin exposure. It may develop earlier (within 2 days) in pts w/previous exposure. It may also occur up to 3 wk after exposure to heparin secondary to high titers of Plt-activating IgG induced by heparin (delayed-onset HIT). Risk of HIT > with UFH then LMWH.
 This dx should be differentiated from early, benign, transient thrombocytopenia that can occur w/heparin Rx. Factors favoring immune thrombocytopenia are as follows:
TABLE 7-8
A Diagnostic and Treatment Approach to Heparin-Induced Thrombocytopenia
| Suspicion of HIT Based upon the “4 Ts” | Score | Pretest Probability Score Criteria | ||
| 2 | 1 | 0 | ||
| Thrombocytopenia |  |
Nadir 20-100, or >50% platelet fall | Nadir 10-19, or 30%-50% platelet fall | Nadir <10, or <30% platelet fall |
| Timing of onset of platelet fall |  |
Day 5-10, or ≤ day 1 with recent heparin∗ | > Day 10 or timing unclear (but fits with HIT) | ≤ Day 1 (no recent heparin) |
| Thrombosis or other sequelae |  |
Proven thrombosis, skin necrosis, or ASR† | Progressive, recurrent, or silent thrombosis; erythematous skin lesions | None |
| OTher cause of platelet fall |  |
None evident | Possible | Definite |
| Total Pretest Probability Score |  |
Periodic reassessment as new information can change pretest probability (e.g., positive blood cultures) | ||
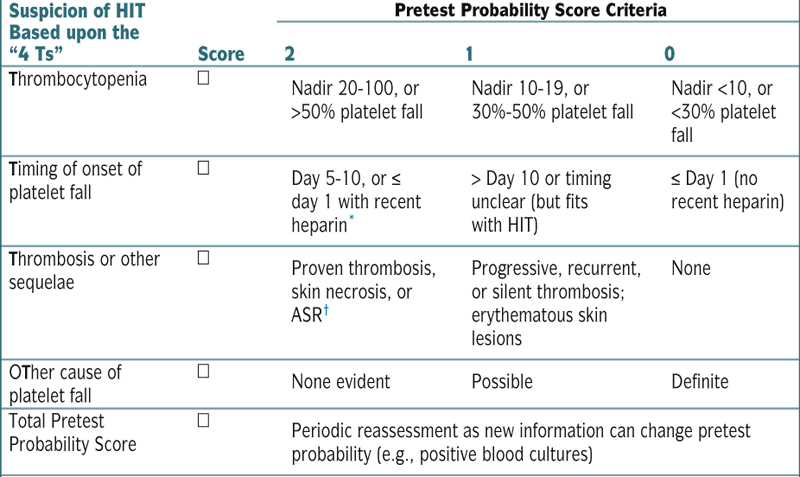
| Total Pretest Probability Score | ||
| High | Moderate | Low |
| 8 | 7 | 6 | 5 |4 | 3 | 2 | 1 | 0 |
| Stop heparin‡, give alternative nonheparin anticoagulant argatroban¶ or lepirudin# or danaparoid∗∗ (or bivalirudin†† or fondaparinux‡‡) | Physician judgment | Continue (LMW) heparin |
| Positive test for HIT antibodies: continue nonheparin anticoagulant until platelet count recovery |  HIT test HIT test  |
Negative test for HIT antibodies: consider continuing or switching back to (LMW) heparin## |
| Thrombosis∗∗∗ If HIT, continue nonheparin anticoagulant until platelet count recovery, then cautious coumarin overlap¶¶ |
 Imaging studies for lower limb DVT††† Imaging studies for lower limb DVT††† |
No thrombosis If HIT, consider anticoagulating until platelet count recovery, even if no thrombosis apparent (± coumarin¶¶) |
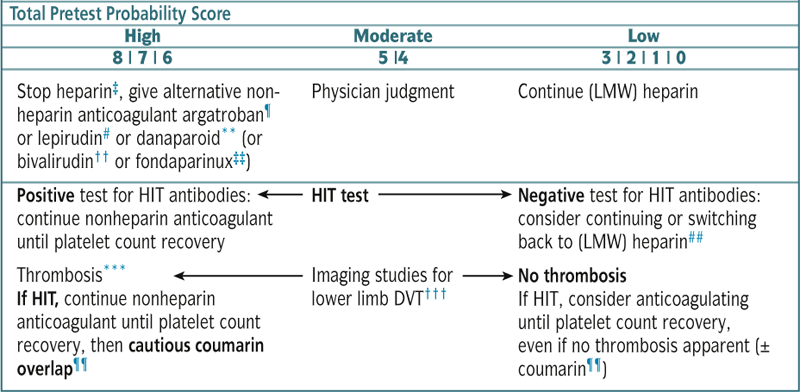
∗ Recent heparin indicates exposure within the past 30 days (2 points) or past 30-100 days (1 point).
† ASR, acute systemic reaction following IV heparin bolus (see Table 7-4).
‡ Stop all heparin, including catheter “flushes” and possibly heparin-coated catheters.
¶ Argatroban: approved (U.S., Canada) for isolated HIT and HIT complicated by thrombosis (2 μg/kg/min IV, adjusted to 1.5-3.0× patient’s baseline APTT or the mean of the laboratory normal range); reduce dose for hepatobiliary compromise: may increase INR more than the other direct thrombin inhibitors, thus requiring care in managing coumarin overlap (see footnote ¶¶).
# Lepirudin: approved (United States, Canada, European Union, elsewhere) for treatment of thrombosis complicating HIT (±0.4 mg/kg IV bolus, then 0.15 mg/kg/hr adjusted to 1.5-2.5× patient’s baseline APTT or mean of the laboratory normal range); used (off-label) also to treat isolated HIT (0.1 mg/kg/hr, adjusted by APTT); to avoid overdosing and anaphylaxis, it may be preferable to omit the bolus, and begin as IV infusion (except when facing life- or limb-threatening thrombosis); reduce dose for renal insufficiency.
∗∗ Danaparoid: usual IV bolus, 2250 U (body weight 60-75 kg) followed by infusion (400 U/hr for 4 hr, then 300 U/hr for 4 hr, then 200 U/hr, adjusted by anti–factor Xa levels); this therapeutic-dose regimen is appropriate both for isolated HIT and for HIT complicated by thrombosis (although the dose is higher than approved in some jurisdictions); withdrawn from U.S. market (2002).
†† Bivalirudin: no bolus, IV infusion 0.15 mg/kg/hr adjusted by APTT; limited experience (off-label).
‡‡ Fondaparinux: dosing for HIT not established; limited experience (off-label).
¶¶ Delay coumarin pending substantial platelet count recovery (at least >100, preferably >150); begin coumarin in low doses, with at least 4-5 day overlap, stopping alternative anticoagulant when INR therapeutic for 2 days and platelets recovered.
## Depending on physician confidence in the laboratory’s ability to rule out HIT antibodies (usually, negative PF4-dependent enzyme immunoassay and/or washed platelet activation assay performed by an experienced laboratory).
∗∗∗ Some thrombi may require special treatment (e.g., thrombectomy for large limb artery thrombosis).
††† Routine ultrasound of lower limb veins recommended because many pts w/HIT have subclinical DVT.
Adapted from Warkentin TE, Aird WC, Rand JH: Platelet-endothelial interactions: sepsis, HIT, and antiphospholipid syndrome. Hematology Am Soc Hematol Educ Program 497-519, 2003.
3. Thrombotic Thrombocytopenic Purpura (TTP)
Etiology
 It is caused in some pts by an acquired deficiency of a circulating metalloproteinase and can also be caused in very rare cases by a hereditary deficiency of ADAMTS13.
 Many drugs, including clopidogrel, PCN, antineoplastic agents, OCPs, quinine, and ticlopidine, have been associated w/TTP.
 Other precipitating causes include infectious agents, pregnancy, malignant neoplasms, allogeneic bone marrow transplantation, and neurologic disorders.
Diagnosis
H&P
 Most pts present w/nonspecific constitutional sx (weakness, nausea, abd pain, vomiting).
 Purpura (secondary to thrombocytopenia), jaundice, pallor (secondary to hemolysis), mucosal bleeding, fever
 Fluctuating levels of consciousness (secondary to thrombotic occlusion of the cerebral vessels)
 Renal failure and neurologic events are usually end-stage features.
Labs
 Severe anemia and thrombocytopenia (Plt count <50,000 or >50% ↓ from previous count)
 ↑ BUN and Cr, ↑ reticulocyte count, indirect bili, LDH, ↓ haptoglobin
 U/A: hematuria (red cells and red cell casts in urine sediment), proteinuria
 Peripheral smear: severely fragmented RBCs (schistocytes); >4% RBC fragments in the peripheral blood
 No laboratory evidence of DIC (nl FDP, fibrinogen)
 The ADAMTS13 level is not necessary, and metalloproteinase deficiency need not be proved for dx of TTP.
Treatment
 Discontinue potential offending agents.
 Daily plasma exchange w/replacement of 1.0 to 1.5× the predicted plasma volume of the pt continued for ≥2 days after the Plt count returns to >150,000/cm3.
4. Hemolytic-Uremic Syndrome (HUS)
Definition
Diagnosis
H&P
 Usually preceded by bloody diarrhea (90% of cases)
Labs
 Anemia, thrombocytopenia, ↑ BUN, and creat
 Peripheral smear: schistocytes, burr cells, and helmet cells
 Stool cultures for E. coli O157:H7 + in >90% of cases
Treatment
 Plasma exchange or infusion started within 24 hr after dx
 Abx should be avoided
5. HELLP Syndrome
 Class 1: Plt 50,000/mm3
 Class 2: Plt >50,000 to 100,000/mm3
 Class 3: Plt >100,000/mm3
Diagnosis
H&P
 RUQ pain, edema

Treatment
 Mg sulfate, BP control (hydralazine, labetalol)
 Pregnancies 34 wk or class 1 HELLP → delivery, either vaginal or abd, within 24 hr is the goal.
 Preterm fetus → corticosteroid Rx to enhance fetal lung maturation
I. Thrombotic Disorders
1. Hypercoagulable State
Etiology (Table 7-9)
Inherited
 Factor V Leiden (FVL) mutation
 Prothrombin G20210A mutation (PGM)
 Protein C, protein S, antithrombin deficiency
 Protein C and protein S
 Antithrombin deficiency (ATD)
TABLE 7-9
Hypercoagulable Conditions
| Prevalence in General Population (%) | Prevalence in Population with Thrombosis (%) | A/V Events | Relative Risk of Thrombosis | |
| FVL mutation | 5% of whites; rare in nonwhites | 12%-40% | V | Heterozygous: 3-7 Homozygous: 80 |
| Prothrombin G20210A mutation | 3% of whites; rare in nonwhites | 6%-18% | V | 3 |
| AT deficiency | 0.02% | 1%-3% | V | 20-50 |
| PC deficiency | 0.2%-0.4% | 3%-5% | V | 7-15 |
| PS deficiency | 0.03%-0.1% | 1%-5% | V | 5-11 |
| Antiphospholipid antibody syndrome | 1%-2% | 5%-21% | V + A | 2-11 |
| Hyperhomocysteinemia | 5%-7% | 10% | V + A | 3 |
| Elevated factor VIII level | 11% | 25% | 5 |
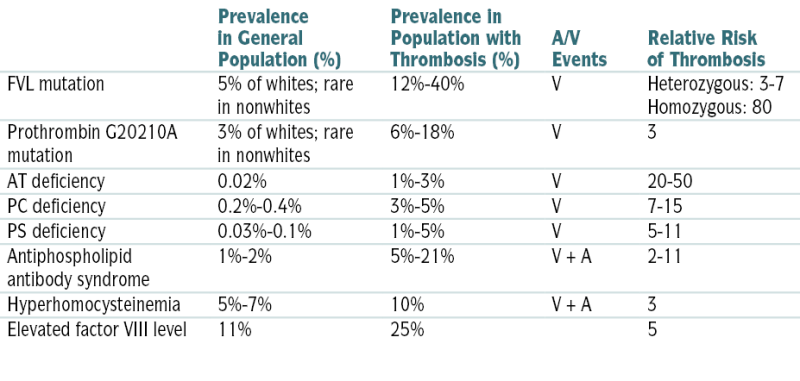
A, Arterial; AT, antithrombin; FVL, factor V Leiden; PC, protein C; PS, protein; V, venous.
From Ferri F: Ferri’s Clinical Advisor 2010. Philadelphia, Mosby, 2010.
 ↑ Factor VIII level
 Other possible causes: dysfibrinogenemias, thrombin activatable fibrinolysis inhibitor, plasminogen deficiency, factor IX and factor XI levels
Acquired
 APS
APS Hyperhomocysteinemia
 Conditions associated w/ risk of thrombosis
 Thrombophilia testing
2. Antiphospholipid Syndrome
Diagnosis
 APS Abs can be detected transiently in up to 5% of asymptomatic adults. Diagnostic criteria of APS include at least one of the following clinical criteria and at least one of the following lab criteria:
Clinical Features
 Venous, arterial, or small-vessel thrombosis or
 Morbidity w/pregnancy (fetal death at >10 wk gestation; or premature births before 34 wk gestation secondary to eclampsia, preeclampsia, or severe placental insufficiency; or three or more unexplained consecutive spontaneous abortions <10 wk gestation)
Labs
 Anticardiolipin Ab (IgG or IgM ACL in medium or high titers) or
 β2-glycoprotein I Ab (IgG or IgM ACL in high titers) or lupus anticoagulant found on >2 occasions, at least 12 wk apart
Treatment
 + APL w/ venous thrombosis: initial anticoagulation w/heparin, then lifelong warfarin Rx, INR 2.0 to 3.0. Consider higher target INR (3-4) in pts with recurrent thromboembolism on warfarin.
 + APL w/arterial thrombosis
 Catastrophic APS: Combination of anticoagulation, corticosteroids, and IVIG or plasma exchange
 Prophylaxis for asymptomatic pts w/+ APL w/o previous thrombosis:
 Note on warfarin or UFH monitoring:
3. Venous Thromboembolism (DVT)
Diagnosis
H&P
 Pain and swelling of the affected extremity
 In LE DVT: leg pain on dorsiflexion of the foot (Homans’ sign)
 Exam may be unremarkable in early DVT.
 Clinical prediction rules can be used to establish pretest probability of DVT. The Wells’ prediction rules for DVT are described in Table 7-10. These rules perform better in younger pts w/o h/o DVT and in those w/o comorbidities. In younger pts w/o associated comorbidities and a low pretest probability by Wells’ criteria and a (−) high-sensitivity D-dimer test result, the dx of DVT can be reasonably excluded.
Labs
 Baseline PT (INR), APTT, and Plt count should be obtained on all pts before anticoagulation is started.
 D-dimer assay by ELISA: DVT can be ruled out in pts who are clinically unlikely to have DVT and have a (−) D-dimer test result. D-dimer can also be combined w/U/S. The combination of a nl D-dimer w/a nl compression venous U/S is useful to exclude DVT and to eliminate the need for repeated U/S at 5 to 7 days. Figure 7-5 describes an algorithm for the Dx of DVT.
TABLE 7-10
Wells’ Clinical Assessment Model for the Pretest Probability of Lower Extremity DVT
| Score | |
| Active cancer (treatment ongoing or within previous 6 mo or palliative) | 1 |
| Paralysis, paresis, or recent plaster immobilization of the lower extremities | 1 |
| Recently bedridden >3 days or major surgery within 4 wk | 1 |
| Localized tenderness along the distribution of the deep venous system | 1 |
| Entire leg swollen | 1 |
| Calf swelling >3 cm asymptomatic side (measured 10 cm below tibial tuberosity) | 1 |
| Pitting edema confined to the symptomatic leg | 1 |
| Collateral superficial veins (nonvaricose) | 1 |
| Alternative diagnosis as likely as or greater than that of DVT | −2 |
In patients with symptoms in both legs, the more symptomatic leg is used. Pretest probability is calculated as the total score: high, >3; moderate, 1-2; low, <0.
From Crawford MH, DiMarco JP, Paulus WJ (eds): Cardiology, 2nd ed. St. Louis, Mosby, 2004.
Imaging
 Compression U/S (see Figure 7-5)
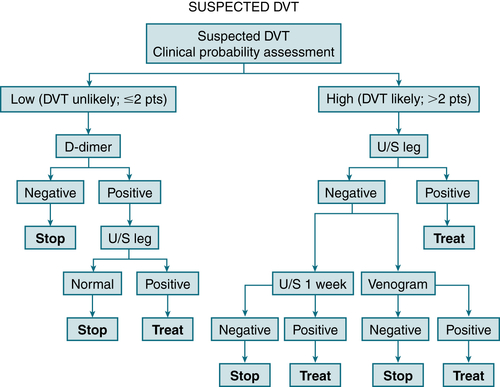
FIGURE 7-5 Integrated strategy for diagnosis of DVT by using clinical probability assessment, measurement of D-dimer, and ultrasonography of legs as primary diagnostic tests. If clinical probability is low (i.e., DVT unlikely and D-dimer negative), no further investigations are required. If D-dimer is positive, proceed to ultrasonography of legs; then either treat or stop investigations. If clinical probability is high (i.e., DVT likely), D-dimer measurement need not be carried out; proceed directly to ultrasonography of legs. If negative, options are to repeat ultrasound in 1 week or in some cased to perform an ascending venogram. (From Vincent JL, Abraham E, Moore FA, et al [eds]: Textbook of Critical Care, 6th ed. Philadelphia, Saunders, 2011.)
Treatment
 Rapidly acting anticoagulants (LMWH, fondaparinux, or UFH) followed by warfarin Rx ≥5 days and until therapeutic INR (2-3) has been achieved with warfarin. Discontinue parenteral Rx after INR ≥2 has been achieved for at least 24 hr. Alternatives to warfarin may include dabigatran (direct oral thrombin inhibitor) and rivaroxaban (oral factor Xa inhibitor).
 Outpt treatment of DVT is appropriate for pts without prior DVT, thrombophilic conditions, or substantial comorbidity, but not for those who are pregnant or are likely not to adhere to Rx.
 Exclusions from outpt treatment of DVT include pts with potential high complication risk (e.g., hemoglobin <7, Plt count <75,000, guaiac(+) stool, recent CVA or noncutaneous surgery, noncompliance).
 Insertion of an IVC filter to prevent PE is recommended in pts with contraindications to anticoagulation (e.g., hemorrhagic stroke, active internal bleeding, pregnancy), HIT in a pt with an active VTT/PE, recurrent PE despite adequate anticoagulant Rx, emergency surgery in a pt with DVT, presence of free-floating ileofemoral, lower IVC thrombosis (incipient embolization), and chronic pulmonary (thromboembolic) HTN with limited pulmonary reserve.
 Thrombolytic Rx (streptokinase) can be used in rare cases in pts with extensive iliofemoral venous thrombosis and a low risk of bleeding. There are concerns about hemorrhagic complications related to the large doses of thrombolytics required in systemic thrombolysis for DVT (2%-10% risk of major hemorrhagic complications).
 Other treatment modalities for DVT include surgical thrombectomy and catheter-directed thrombolysis (CDT). Thromboreduction by surgical thrombectomy is effective but invasive and expensive. CDT is also invasive, carries a bleeding risk, and requires ICU admission.
Duration of Anticoagulant Rx
 Rx for 3 mo: pts w/reversible risk factors (low-risk group). ↑ D-dimer level measured after 3 mo of anticoagulation in pts w/unprovoked DVT or persistent thrombosis on duplex imaging should favor a longer duration of Rx.
 Anticoagulation for 3 to 6 mo: pts w/idiopathic venous thrombosis or medical risk factors for DVT (intermediate-risk group)
 Indefinite anticoagulation: pts w/DVT associated w/active cancer; pts w/inherited thrombophilia (e.g., deficiency of protein C or S Ab), APS, and recurrent episodes of idiopathic DVT (high-risk group)
Anticoagulation Monitoring
 Warfarin: INR should be obtained daily when warfarin is initially administered concomitantly with rapidly acting anticoagulants. Its mean half-life is 32 to 40 hr; therefore, full impact of a dose change will take several days. Metabolism is also influenced by meds that affect cytochrome P-450 and dietary vitamin K content.
| Measured Value | Adjustment |
| PTT <35 sec (<1.2 × control value) | 80 U/kg as bolus, then infusion rate by 4 U/kg/hr |
| APTT 35-45 sec (1.2-1.5 × control value) | 40 U/kg as bolus, then infusion rate by 2 U/kg/hr |
| APTT 46-70 sec (>1.5-2.3 × control value) | No change |
| APTT 71-90 sec (>2.3-3 × control value) | ↓ Infusion rate by 2 U/kg/hr |
| APTT >90 sec (>3 × control value) | Stop infusion for 1 hr, then ↓ infusion rate by 3 U/kg/hr |
| APTT (sec) | Bolus (U) | Stop Infusion (min) | Rate of Change (mL/hr) | Repeat APTT |
| <50∗ | 5,000 | 0 | +3 | In 6 hr |
| 50-59 | 0 | 0 | +3 | In 6 hr |
| 60-85 | 0 | 0 | 0 | Next morning |
| 85-95 | 0 | 0 | −2 | Next morning |
| 96-120 | 0 | 30 | −2 | In 6 hr |
| >120 | 0 | 60 | −4 | In 6 hr |
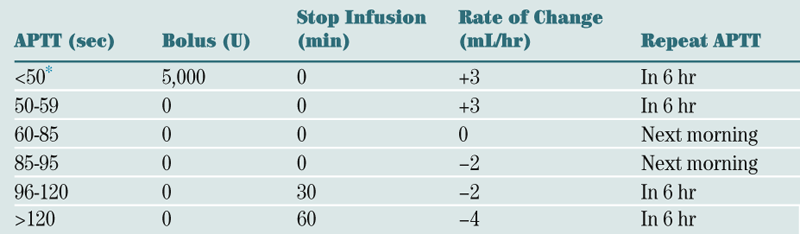
∗ If the APTT is subtherapeutic despite a heparin dose of at least 1,440 U/hr (36 mL/hr) at any time during the first 48 hours of therapy, the response to an APTT of <50 sec is a bolus of 5,000 U and a rate increase of 5 mL/hr.
| APTT (sec) | Intravenous Infusion† | Additional Action | |
| Rate of Change (mL/hr) | Change in Dose (U/24 hr) | ||
| ≤45 | +6 | +5,760 | Repeat APTT in 4-6 hr |
| 46-54 | +3 | +2,880 | Repeat APTT in 4-6 hr |
| 55-85 | 0 | 0 | None‡ |
| 86-110 | −3 | −2,880 | Stop heparin for 1 hr; repeat APTT 4-6 hr after restarting heparin Rx |
| >110 | −6 | −5,760 | Stop heparin for 1 hr; repeat APTT 4-6 hr after restarting heparin Rx |
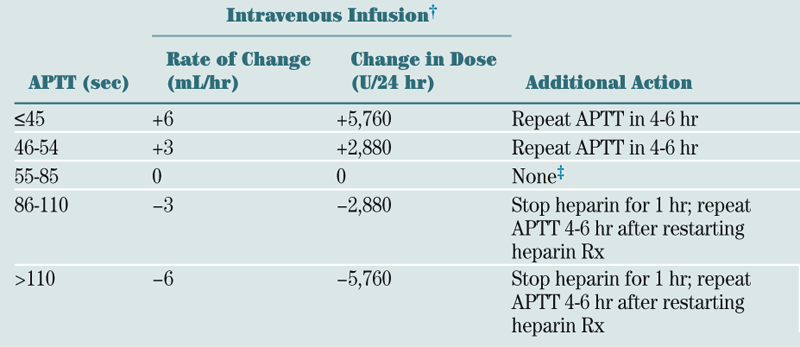
† A heparin sodium concentration of 20,000 U in 500 mL is equal to 40 U/mL.
‡ During the first 24 hours, repeat the APTT in 4 to 6 hr. Thereafter, the APTT is determined once daily, unless the value is in the therapeutic range.
 LMWH/fondaparinux: No monitoring is needed but it is renally excreted; therefore, ↓ dose in renal insufficiency.
 Dabigatran, rivaroxaban: No monitoring is necessary.
Anticoagulation Reversal
 Warfarin: vitamin K, 10 mg IV over 1 hour
 UFH: protamine 1 mg/100 U UFH, infused slowly (<5 mg/min)
 LMWH: protamine 0.5 to 1 mg/1 mg enoxaparin or 100 IU dalteparin
Direct Thrombin Inhibitors
 Activated prothrombin complex concentrates, 50 to 100 U/kg IV
 Oral activated charcoal or hemodialysis for dabigatran
J. Oncologic Urgencies and Emergencies
1. Tumor Lysis Syndrome
Treatment
2. Superior Vena Cava Syndrome
Definition
Diagnosis
H&P
 Clinical presentation: dyspnea, chest pain, cough, dysphagia, syncope
 PE: chest wall vein distention, neck vein distention, facial edema, UE swelling, cyanosis
Imaging
 CXR
CXR Chest CT scan or MRI
 Venography: warranted only when an intervention (e.g., stent or surgery) is planned
Treatment
 Management is guided by severity of sx and the underlying etiology.
 Emergency RT is indicated in critical situations, such as respiratory failure or CNS signs associated w/ICP.
 Rx of the underlying malignant disease: RadioRx, systemic/chemoRx
 Percutaneous self-expandable stents can be placed under local anesthesia w/radiologic manipulation in selected pts to bypass the obstruction.
3. Brain Metastases
Epidemiology and Physical Findings
 >50% of adult intracranial tumors
 Headache 40%-50% (if posterior fossa mets, may result in obstructive hydrocephalus)
 20% brain mets dx synchronously or before primary tumor found
Imaging and Labs
 LP contraindicated because of ↑ ICP
 MRI with/without contrast = imaging study of choice
 MRI spectroscopy and PET used to delineate tumor, nontumor, radiation necrosis
Treatment
 Steroids used to ↓ peritumoral edema and ↑ ICP
 Pts with no hx seizure, prophylaxis not necessary
 Anticoagulants to prevent venous thromboembolic disease
 Whole brain radiation and stereotactic radiosurgery (SRS) for chronic cases