Chapter 7
Haemodialysis Access
Arteriovenous Fistulas and Synthetic Arteriovenous Grafts
At the end of 2009, there were 571,414 patients being treated for end-stage renal disease in the United States with 116,395 new cases in that year1; approximately 65% of these patients received haemodialysis.1 Complications associated with vascular access procedures are a major cause of morbidity and increasing healthcare costs in patients undergoing haemodialysis.2 For patients with end-stage real disease (ESRD) requiring haemodialysis, there are two options for vascular access, either the surgical creation of an arteriovenous fistula (AVF) or implantation of a synthetic arteriovenous graft (graft). Due to the lower rates of infection and thrombosis, mature AVFs are the preferred access when possible.3,4 Preoperative ultrasound evaluation of the upper extremity arteries and veins has been shown by several studies to increase the success rate of AVF creation by influencing surgical planning.5–7 While sonographic postoperative haemodialysis access evaluation may be beneficial in assessing AVF maturation,8,9 the role of postoperative ultrasound monitoring for early detection of access pathology allowing prompt intervention to increase the longevity of an access is still evolving.10–15
When clinically feasible and anatomically possible, the surgical creation of an AVF is preferred over a graft. Access placement in the non-dominant arm allows activities of daily living to continue as the non-dominant arm recovers; however, it is preferential to place a dominant arm AVF as opposed to a non-dominant arm graft in most patients. Potential haemodialysis access sites in decreasing order of preference are as follows: (1) forearm AVF (radiocephalic AVF or transposed forearm basilic vein to radial artery AVF); (2) upper arm brachiocephalic AVF or transposed brachiobasilic AVF; (3) forearm loop graft; (4) upper arm straight graft (brachial artery to upper basilic/axillary vein); (5) upper arm axillary artery to axillary vein loop graft; and (6) thigh graft. Other less common access configurations may also be utilised based on surgical experience.16 Cephalic vein use is preferred over a basilic vein transposition for fistula formation because the cephalic vein procedure involves less dissection and venous handling.
Preoperative Evaluation
Ultrasound exam optimisation has been previously reported.9,17–19 For evaluation of upper extremity arteries and veins, the patient should preferably be sitting upright. Following arterial assessment, a tourniquet is placed for evaluation of the veins20 (Fig. 7-1). The tourniquet should be repositioned on the arm above each level of examination, so those veins are maximally distended. Assessment of the internal jugular and subclavian veins should be performed with the patient supine for improved distension.
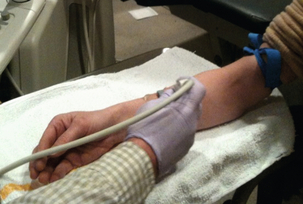
FIGURE 7-1 Photograph shows optimal patient positioning for preoperative upper extremity sonographic evaluation and tourniquet placement for evaluation of forearm veins. Sonographer is using a high-frequency 17 MHz transducer for best vascular visualisation.
The vascular structures are generally superficial and a high-frequency linear array transducer, at 12–15 MHz or higher, can provide good spatial resolution with adequate penetration. A light touch and plenty of coupling gel are recommended, so as to not deform the circular shape of the vessels. Preoperative criteria suggested by the literature include a minimum intraluminal arterial diameter of 2.0 mm (Fig. 7-2) and a minimal intraluminal venous diameter of 2.5 mm (Fig. 7-3) to allow successful AVF creation.5,9 Suggested criteria for graft creation include a minimum intraluminal venous diameter of 4.0 mm and a minimum arterial diameter threshold of 2.0 mm.5 In addition to diameter measurements, the caudal third of the brachial and radial arteries are evaluated for intimal thickening, calcification, stenosis or occlusion. Severity of arterial calcification may be categorised, depending on surgeon preference (Fig. 7-4). Evaluation for a normal triphasic or biphasic arterial waveform is performed, and peak systolic velocity (PSV) is measured in the region of artery planned for use (Fig. 7-5). If two arteries with paired veins are seen in the upper arm, a high radial artery take-off from the brachial artery should be suspected (Fig. 7-6). These arteries should be followed into the forearm to confirm high radial artery take-off and to exclude a prominent arterial branch supplying the elbow.
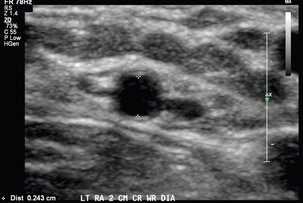
FIGURE 7-2 Greyscale transverse image of the left radial artery at the wrist demonstrates with caliper placement an intraluminal diameter of 2.4 mm satisfactory for access placement. Note use of high-frequency transducer and optimised technique.
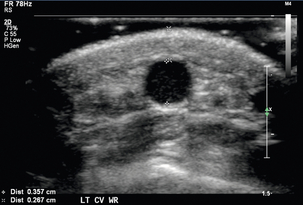
FIGURE 7-3 Greyscale transverse image of the forearm cephalic vein at the wrist demonstrates with (+) caliper placement an intraluminal diameter of 3.6 mm and with (×) caliper placement a distance of 2.7 mm from skin surface to anterior venous wall.
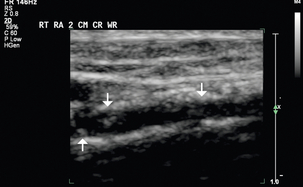
FIGURE 7-4 Greyscale longitudinal image shows calcifications in the caudal third of this right radial artery (arrows).
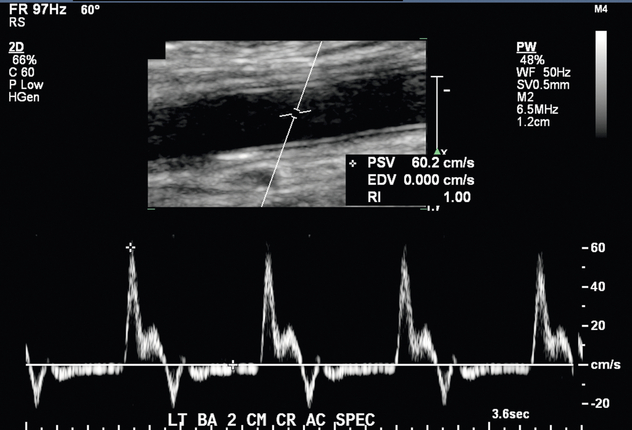
FIGURE 7-5 Spectral Doppler image shows a normal biphasic arterial waveform of this left brachial artery just above the antecubital fossa. PSV 60.2 cm/s.
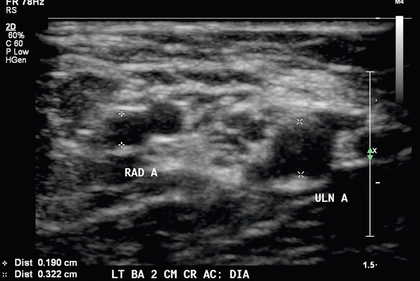
FIGURE 7-6 High bifurcation of the brachial artery should be suspected when two arteries are present near the antecubital fossa. Calipers (+) denote the radial artery (RAD A) and calipers (×) denote the ulnar artery (ULN A).
Venous assessment is performed with a tourniquet in place, and each vein should be visually inspected and compressed along the entire venous length to exclude thrombus. Internal transverse diameters of the cephalic vein are measured in the forearm at multiple levels. Internal diameters of the cephalic and basilic veins are measured in the upper arm at multiple levels in a similar fashion. The axillary vein, subclavian vein, and internal jugular vein should be assessed for compressibility and/or normal waveforms (Fig. 7-7).
Postoperative Ultrasound Evaluation
A surgically created dialysis access can have a variety of complications, and most of these can be identified and evaluated by ultrasound. Prior to the sonographic evaluation of a haemodialysis access, pertinent patient history and surgical notes are reviewed. An initial cursory ultrasound scan is performed to obtain an overview of the haemodialysis access. Once the general layout is understood, sonographic assessment is performed with greyscale and Doppler. The caudal third of the feeding artery is assessed for possible stenosis, and the intraluminal diameter is measured in the transverse plane. Colour and spectral Doppler assessment of the feeding artery is performed in the longitudinal plane to confirm the presence of normal low-resistance flow (Fig. 7-8). The anastomosis(es) are evaluated with both colour and spectral Doppler to assess for stenosis. The draining vein of the AVF or graft is inspected for wall thickening, stenosis, and thrombosis along its entire length. For a fistula, the intraluminal draining vein diameter and the vein depth from skin surface are measured at several points cranial to the arteriovenous anastomosis. A depth greater than 5 mm may suggest the need for superficialisation to improve accessibility. The draining vein is evaluated for accessory vein branches (Fig. 7-9). Internal diameter and distance from anastomosis are recorded for each identified accessory vein branch within 10–15 cm of the anastomosis. Flow volume measurements are obtained within the mid draining vein of an AVF or within the graft. This measurement is obtained in an area with parallel vessel walls, minimal vessel tortuosity and no stenosis (Fig. 7-10).
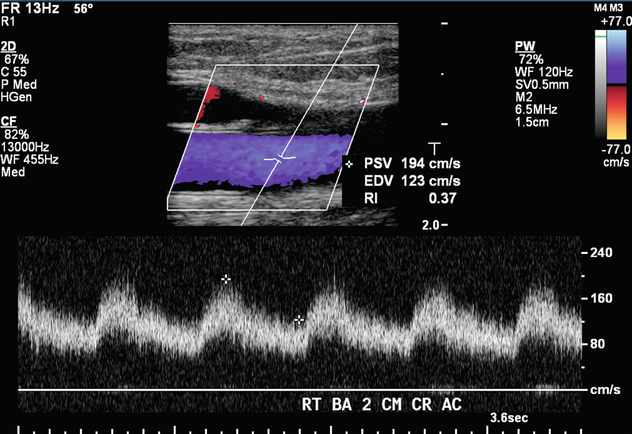
FIGURE 7-8 Spectral Doppler waveform in the right brachial artery 2 cm cranial to the antecubital fossa shows a normal low-resistance waveform seen in an AVF feeding artery. PSV 194 cm/s. EDV 123 cm/s.
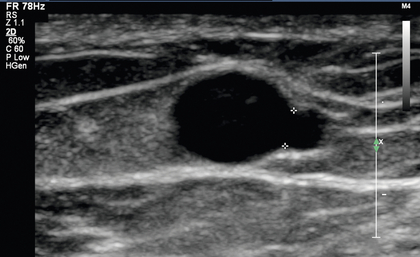
FIGURE 7-9 Greyscale image shows a venous branch from a left upper arm fistula draining vein measuring 2.0 mm located 10 cm cranial to the anastomosis.
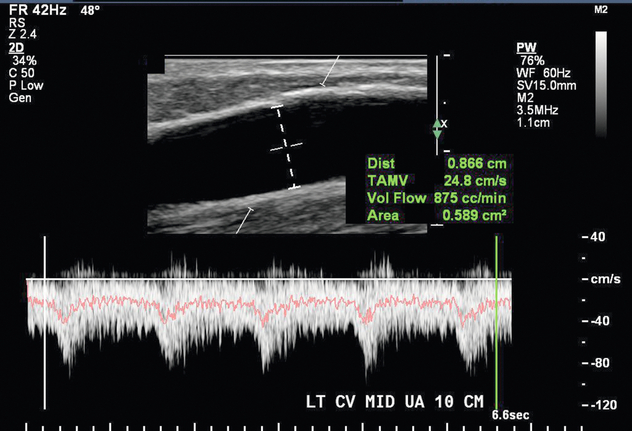
FIGURE 7-10 Volume flow measurement in the draining vein of an AVF 10 cm cranial to the anastomosis is 875 cc/min.
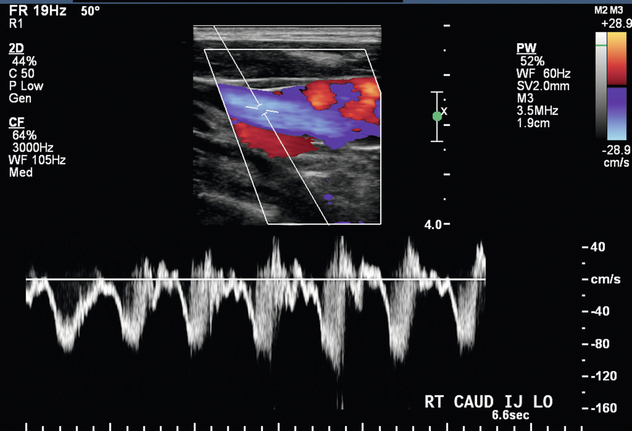
In the setting of upper extremity swelling, the subclavian and internal jugular veins should be included in the postoperative sonographic evaluation. Doppler imaging of the internal jugular and subclavian veins provides indirect assessment of the brachiocephalic veins. In a patient with an AVF, spectral Doppler evaluation of normal central veins shows respiratory phasicity and/or transmitted cardiac periodicity (Fig. 7-7). Monophasic subclavian and internal jugular venous waveforms are suggestive of central venous stenosis or occlusion, especially if these veins are distended (Fig. 7-11). MR venography may be useful to exclude critical stenosis in this setting.
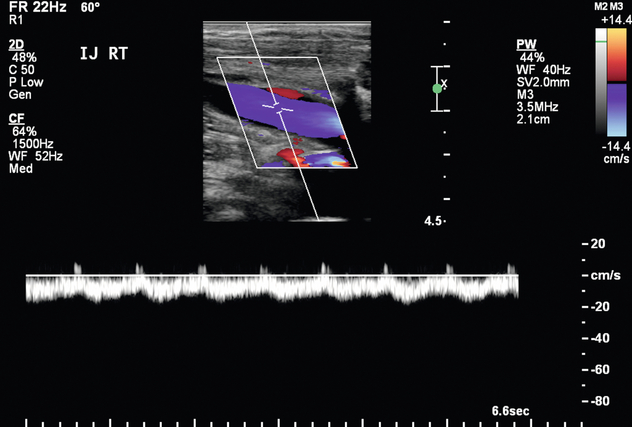
FIGURE 7-11 Spectral Doppler image of the right internal jugular vein shows relatively monophasic flow suggestive of central obstruction such as thrombosis or stenosis.
A normal AVF has antegrade flow through both the arterial and venous limbs without visible narrowing, thrombus, or flow disturbance. Potential signs of stenosis include areas of visible narrowing, aliasing, or focal increased velocity, and are further described in the following pathology section. A functioning AVF has flow volume of at least 300 to 800 mL/min (Fig. 7-10).8,21 When an AVF has a minimum draining vein diameter of > 4 mm or a blood flow rate of > 500 mL/min, approximately 70% can be successfully used for haemodialysis.8 When both criteria are present, the likelihood of fistula maturation is 95%.8 If neither of these are met, only 33% of fistulas are adequate for haemodialysis.8 The National Kidney Foundation Kidney Disease Outcomes Quality Initiative published sonographic criteria suggestive of maturation that included the following: draining vein greater than 6 mm diameter, blood flow rate greater than 600 cc/min, and less than 6 mm skin depth.3 However, these criteria exclude many fistulas that can still be successfully used for haemodialysis.
Diagnosis of Pathology
Pathology associated with AVFs includes stenosis, thrombosis/occlusion, pseudoaneurysm, peri-fistula fluid collections, and arterial steal. Two features characterise AVF stenosis; visual narrowing as assessed on greyscale imaging and an increased ratio of the PSV at the stenosis as compared to the PSV measured 2 cm upstream from the stenosis. The diagnostic criteria vary in accordance with the location of the stenosis. A juxta-anastomotic stenosis is defined by the following criteria: (1) location within 2 cm of the anastomosis, encompassing the feeding artery and the draining vein;22–23 (2) visible narrowing; and (3) a PSV ratio of greater than or equal to 3:1 (Fig. 7-12). A draining vein stenosis is defined by visible narrowing and by a PSV ratio of 2:1. Stenoses of the feeding artery are rare but can occur and are characterised by visible narrowing and a PSV ratio of 2:1. Poststenotic waveforms with a delayed systolic upstroke (tardus parvus) may suggest proximal arterial stenosis and prompt further direct evaluation.
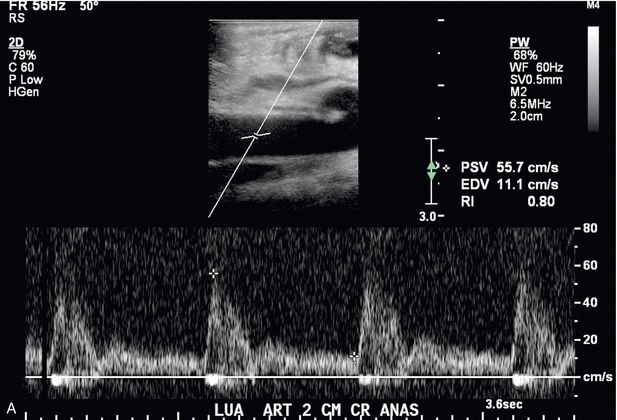
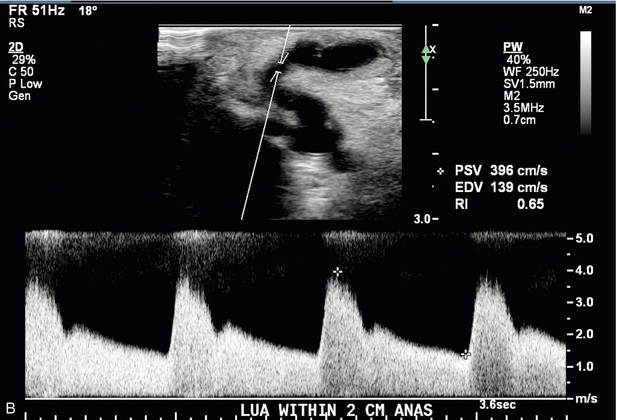
FIGURE 7-12 Spectral Doppler of AVF juxta-anastomotic stenosis. (A) Spectral Doppler of feeding artery with PSV of 55.7 cm/s. (B) Spectral Doppler of juxta-anastomotic area of narrowing 1 cm downstream to the anastomosis with PSV of 396 cm/s. Given PSV in (A) this yields a PSV ratio of 7.1:1.
Stenoses associated with an AVF are listed in order of decreasing frequency by location as follows: the juxta-anastomotic region, the draining vein, the feeding artery, and central veins. Stenoses are clinically relevant since they can be associated with subsequent thrombosis. If thrombosis occurs, it is usually visualised within the vessel lumen on greyscale imaging (Fig. 7-13) and confirmed when no colour or spectral Doppler flow is identified within the affected portion of the AVF or draining vein. If the thrombus is nonocclusive, slow flow or a trickle of flow may be identified with power Doppler.
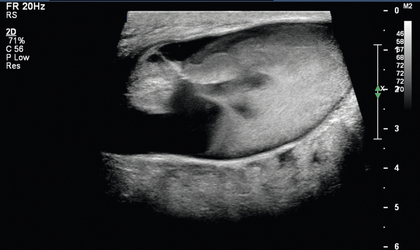
FIGURE 7-13 Occluded AVF. Greyscale longitudinal image of the draining vein of a left upper arm AVF 4 cm cranial to the anastomosis reveals occlusive echogenic thrombus filling a dilated vein lumen.
Pseudoaneurysms may develop anywhere along the course of a fistula secondary to suboptimal compression after cannulation. Colour Doppler of a pseudoaneurysm shows a typical ‘yin/yang’ circular flow pattern (Fig. 7-14). There may be ‘to-and-fro’ flow in the pseudoaneurysm neck. If the pseudoaneurysm thromboses, there may be clot partially filling the space or total lack of flow on Doppler. Avascular, hypoechoic lesions usually represent post access or post procedure haematomas and can be seen associated with fistulas or grafts (Fig. 7-15). Fluid collections complicated by echogenic foci with ‘dirty’ shadowing suspicious for gas may represent abscess in the appropriate clinical setting.
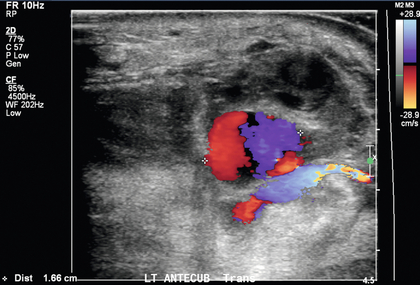
FIGURE 7-14 Colour Doppler image of a pseudoaneurysm reveals the typical bidirectional blue and red ‘yin-yang’ flow.
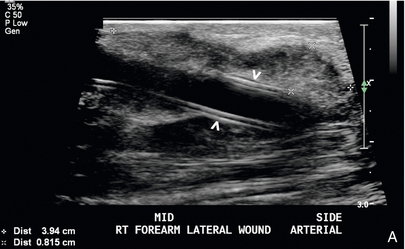
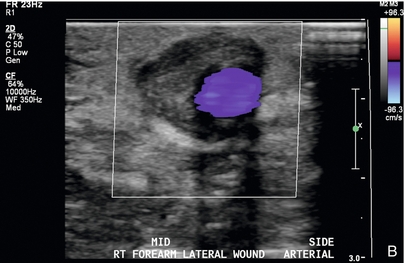
FIGURE 7-15 Peri-access haematoma. (A) Greyscale longitudinal image reveals a 39 × 8 mm complex collection denoted by calipers adjacent to the arterial end of a graft (arrowheads). (B) Colour Doppler image shows patent graft with avascular surrounding material consistent with peri-access haematoma.
Graft abnormalities are similar to those described above for AVFs, with slight variations and differences in the diagnostic thresholds and criteria. Studies have shown that grafts with decreased blood flow are at increased risk for thrombosis.24–26 The four sonographic criteria utilised to characterise graft stenosis are as follows: (1) visual luminal narrowing on greyscale imaging; (2) a high-velocity jet on colour Doppler; (3) a PSV ratio greater than 2:1 for the venous anastomosis17 or draining vein; and (4) a PSV ratio greater than 3:1 for the arterial anastomosis. The most common sites of graft stenosis are in decreasing order of frequency as follows: the venous anastomosis, draining vein, intragraft, arterial anastomosis, and the central veins.27 Graft thrombosis is characterised by echogenic material identified within the graft lumen and by lack of flow within the graft (Fig. 7-16); power Doppler should be utilised to exclude slow flow.
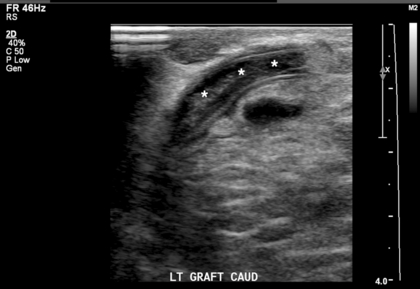
FIGURE 7-16 Occluded graft. Greyscale longitudinal image through the caudal aspect of a graft reveals luminal echogenic material (***). Colour and spectral Doppler (not shown) confirm the occlusion.
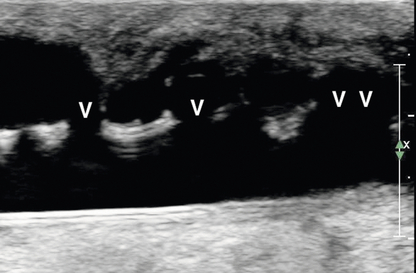
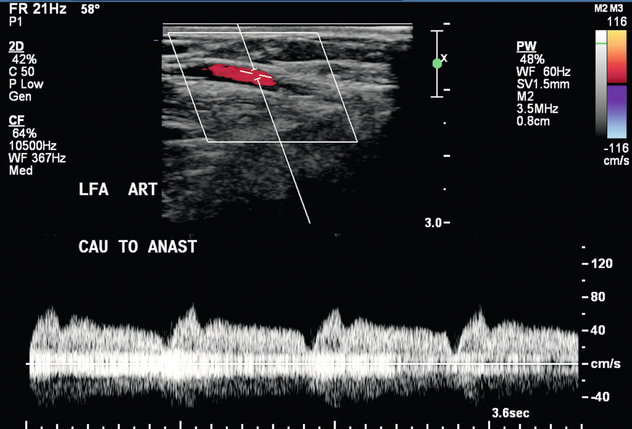
The formation of pseudoaneurysms along grafts is relatively common with typical ‘yin/yang’ flow pattern seen with colour Doppler within the cavity or ‘to-and-fro’ flow at the neck. Degeneration of graft synthetic material is unique to grafts. At ultrasound, irregularity of the graft wall can be seen and may be associated with numerous pseudoaneurysms along the length of the graft wall (Fig. 7-17). Arterial steal is defined as flow reversal in the native artery caudal to the anastomosis and may be associated with hand pain and paraesthesias that may worsen during dialysis. If severe, ischaemia or tissue necrosis of the fingers can occur. However, not all flow reversal is symptomatic. Sonographic evaluation demonstrates reversal of flow in the distal artery and rarely shows an arterial occlusion (Fig. 7-18). Brief manual compression of the graft will usually demonstrate a change in the reversed arterial flow, yielding an antegrade high-resistance flow pattern toward the hand.28
REFERENCES
1. U. S. Renal Data System, USRDS 2011Annual Data Report: Atlas of Chronic Kidney Disease and End-Stage Renal Disease in the United States. Bethesda, MD: National Institutes of Health, National Institute of Diabetes and Digestive and Kidney Diseases, 2011.
2. Feldman, H. I., Kobrin, S., Wasserstein, A. Hemodialysis vascular access morbidity. J Am Soc Nephrol. 1996; 7:523–535.
3. KDOQI clinical practice guidelines and clinical practice recommendations for vascular access 2006. Am J Kidney Dis. 2006; 48(Suppl. 1):S176–S322.
4. Hodges, T. C., Fillinger, M. F., Zwolak, R. M., et al. Longitudinal comparison of dialysis access methods: risk factors for failure. J Vasc Surg. 1997; 26:1009–1019.
5. Silva, M. B., Jr., Hobson, R. W., 2nd., Pappas, P. J., et al. A strategy for increasing use of autogenous hemodialysis access procedures: impact of preoperative noninvasive evaluation. J Vasc Surg. 1998; 27:302–307.
6. Gibson, K. D., Caps, M. T., Kohler, T. R., et al. Assessment of a policy to reduce placement of prosthetic hemodialysis access. Kidney Int. 2001; 59:2335–2345.
7. Allon, M., Lockhart, M. E., Lilly, R. Z., et al. Effect of preoperative sonographic mapping on vascular access outcomes in hemodialysis patients. Kidney Int. 2001; 60:2013–2020.
8. Robbin, M. L., Chamberlain, N. E., Lockhart, M. E., et al. Hemodialysis arteriovenous fistula maturity: US evaluation. Radiology. 2002; 225:59–64.
9. Robbin, M. L., Gallichio, M. H., Deierhoi, M. H., et al. US vascular mapping before hemodialysis access placement. Radiology. 2000; 217:83–88.
10. Allon, M., Bailey, R., Ballard, R., et al. A multidisciplinary approach to hemodialysis access: Prospective evaluation. Kidney Int. 1998; 53:473–479.
11. Robbin, M. L., Oser, R. F., Lee, J. Y., et al. Randomized comparison of ultrasound surveillance and clinical monitoring on arteriovenous graft outcomes. Kidney Int. 2006; 69:730–735.
12. Lumsden, A. B., MacDonald, M. J., Kikeri, D., et al. Prophylactic balloon angioplasty fails to prolong the patency of expanded polytetrafluoroethylene arteriovenous grafts: Results of a prospective randomized study. J Vasc Surg. 1997; 26:382–392.
13. Ram, S. J., Work, J., Caldito, G. C., et al. A randomized controlled trial of blood flow and stenosis surveillance of hemodialysis grafts. Kidney Int. 2003; 64:272–280.
14. Malik, J., Slavikova, M., Svobodova, J., et al. Regular ultrasound screening significantly prolongs patency of grafts. Kidney Int. 2005; 67:1554–1558.
15. Dember, L. M., Holmberg, E. F., Kaufman, J. S. Randomized controlled trial of prophylactic repair of hemodialysis arteriovenous graft stenosis. Kidney Int. 2004; 66:390–398.
16. Jennings, W. C., Sideman, M. J., Taubman, K. E., et al. Brachial vein transposition arteriovenous fistulas for hemodialysis access. J Vasc Surg. 2009; 50:1121–1125.
17. Robbin, M. L., Osler, R. F., Allon, M., et al. Hemodialysis access graft stenosis: US detection. Radiology. 1998; 208:655–661.
18. Lockhart, M. E., Robbin, M. L. Hemodialysis ultrasound. Ultrasound Q. 2001; 17:157–167.
19. Umphrey, H. R., Lockhart, M. E., Abts, C. A., et al. Dialysis grafts and fistulae: planning and assessment. Ultrasound Clin. 2011; 6:477–489.
20. Lockhart, M. E., Robbin, M. L., Fineberg, N. S., et al. Cephalic vein measurement before forearm fistula creation: does use of a tourniquet to meet venous diameter threshold increase the number of useable fistulas? J Ultrasound Med. 2006; 25:1541–1545.
21. Falk, A. Maintenance and salvage of arteriovenous fistulas. J Vasc Interv Radiol. 2006; 17:807–813.
22. Clark, T. W., Hirsch, D. A., Jindal, K. J., et al. Outcome and prognostic factors of restenosis after percutaneous treatment of native hemodialysis fistulas. J Vasc Interv Radiol. 2002; 13:51–59.
23. Beathard, G. A., Arnold, P., Jackson, J., et al. Aggressive treatment of early fistula failure. Physician Operators Forum of RMS Lifeline. Kidney Int. 2003; 64:1487–1494.
24. May, R. E., Himmelfarb, J., Yenicesu, M., et al. Predictive measures of vascular access thrombosis: a prospective study. Kidney Int. 1997; 52:1656–1662.
25. Shackleton, C. R., Taylor, D. C., Buckely, A. R., et al. Predicting failure in polytetrafluoroethylene vascular access grafts for hemodialysis: a pilot study. Can J Surg. 1987; 30:442–444.
26. Robbin, M. L., Oser, R. F., Allon, M., et al. Hemodialysis access graft stenosis: US detection. Radiology. 1998; 205:655–661.
27. Beuter, J. J. G., Lezana, A. H., Calvo, J. H., et al. Early detection and treatment of hemodialysis access dysfunction. Cardiovasc Intervent Radiol. 2000; 23:40–46.
28. Valji, K., Hye, R. J., Roberts, Ac., et al. Hand ischemia in patients with hemodialysis access grafts: angiographic diagnosis and treatment. Radiology. 1995; 196:697–701.

