[level-membership-for-anesthesiology-category]
2 Growth and Development
Normal and Abnormal Growth and Maturation
Growth is the quantitative development of the body and maturation is the acquisition of new functionalities; both phenomena occur during pregnancy and after birth. Prenatal growth is the most important phase in development, comprising organogenesis in the first 8 weeks (embryonic growth), followed by the functional development of organ systems and maturation of the fetus to full term (fetal growth). Rapid growth occurs particularly in the second trimester; a major increase in weight from subcutaneous tissue and muscle mass occurs in the third trimester. Environmental agents may affect the human embryo in a negative way. The duration of gestation and the weight of an infant have an important relationship (Table 2-1).
| Gestation (weeks) | Mean Weight (grams) |
|---|---|
| 28 | 1165 ± 109 |
| 32 | 1760 ± 128 |
| 36 | 2621 ± 274 |
| 40 (full term) | 3351 ± 448 |
Data from Naeye RL, Dixon JB. Distortions in fetal growth. Pediatr Res 1978;12:987-91.
Preterm infants are further classified according to their actual birth weight. A low–birth-weight (LBW) infant is one weighing less than 2500 g regardless of the duration of the pregnancy. A very low–birth-weight (VLBW) infant weighs less than 1500 g, and an extremely low–birth-weight infant weighs less than 1000 g. In addition, infants weighing less than 750 g are now being called “micropremies”; there is very little published information regarding the anesthetic management of this vulnerable subpopulation of neonates (see Chapter 35). Common neonatal problems as they relate to age and birth weight are presented in Table 2-2.
TABLE 2-2 Common Neonatal Problems with Respect to Weight and Gestation
| Gestation | Relative Weight | Neonatal Problems at Increased Incidence |
|---|---|---|
| Preterm (<37 weeks) | SGA | Respiratory distress syndrome |
| Apnea | ||
| Perinatal depression | ||
| Hypoglycemia | ||
| Polycythemia | ||
| Hypocalcemia | ||
| Hypomagnesemia | ||
| Hyperbilirubinemia | ||
| Viral infection | ||
| Thrombocytopenia | ||
| Congenital anomalies | ||
| Maternal drug addiction | ||
| Fetal alcohol syndrome | ||
| AGA | Respiratory distress syndrome | |
| Apnea | ||
| Hypoglycemia | ||
| Hypocalcemia | ||
| Hypomagnesemia | ||
| Hyperbilirubinemia | ||
| LGA | Respiratory distress syndrome | |
| Hypoglycemia: infant of a diabetic mother | ||
| Apnea | ||
| Hypocalcemia | ||
| Hypomagnesemia | ||
| Hyperbilirubinemia | ||
| Normal (37-42 weeks) | SGA | Congenital anomalies |
| Viral infection | ||
| Thrombocytopenia | ||
| Maternal drug addiction | ||
| Perinatal depression | ||
| Hypoglycemia | ||
| AGA | — | |
| LGA | Birth trauma | |
| Hyperbilirubinemia | ||
| Hypoglycemia: infant of a diabetic mother | ||
| Postmature (>42 weeks) | SGA | Meconium aspiration syndrome |
| Congenital anomalies | ||
| Viral infection | ||
| Thrombocytopenia | ||
| Maternal drug addiction | ||
| Perinatal depression | ||
| Aspiration pneumonia | ||
| Hypoglycemia | ||
| AGA | — | |
| LGA | Birth trauma | |
| Hyperbilirubinemia | ||
| Hypoglycemia: infant of a diabetic mother |
AGA, Appropriate for gestational age; LGA, large for gestational age; SGA, small for gestational age.
Gestational Age Assessment
The gestational age of an infant may be assessed in one of three ways. The most accurate means of assessing gestational age is by measuring the crown-rump length of the fetus during a first-trimester ultrasonographic examination. Another method involves calculating gestational age from the first day of the mother’s last menstrual period, but this is commonly inaccurate, leading to errors in estimation. Finally, the Dubowitz scoring system is a well-accepted method combining neurologic and physical criteria of the infant to provide an accurate assessment of gestational age.1,2 A summary of the more significant neurologic and physical signs of maturity is presented in Table 2-3.
TABLE 2-3 Neurologic and External Physical Criteria to Assess Gestational Age
| Physical Examination | Preterm (<37 weeks) | Term (≥37 weeks) |
|---|---|---|
| Ear | Shapeless, pliable | Firm, well formed |
| Skin | Edematous, thin skin | Thick skin |
| Sole of foot | Creases on anterior third | Whole foot creased |
| Breast tissue | Less than 1 mm diameter | More than 5 mm diameter |
| Genitalia | ||
| Male | Scrotum poorly developed Testes undescended |
Scrotum rugated Testes descended |
| Female | Large clitoris, gaping labia majora | Labia majora developed |
| Limbs | Hypotonic | Tonic (flexed) |
| Grasp reflex | Weak grasp | Can be lifted by reflex grasp |
| Moro reflex | Complete but exhaustible (>32 weeks) | Complete |
| Sucking reflex | Weak | Strong, synchronous with swallowing |
Weight and Length
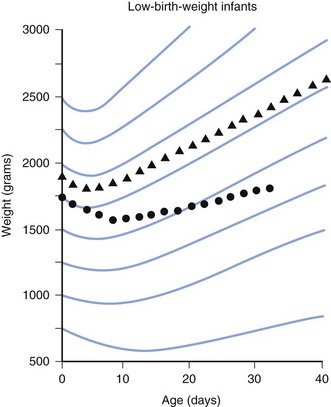
Assessment of growth is measured by changes in weight, length, and head circumference. Percentile charts are valuable for monitoring the child’s growth and development. Deviation from growth within the same percentile for a child of any age is of greater significance than any single measurement (Figs. 2-1 and 2-2). Weight is a more sensitive index of well-being, illness, or poor nutrition than length or head circumference and is the most commonly used measurement of growth. Change in weight reflects changes in muscle mass, adipose tissue, skeleton, and body water and thus is a nonspecific measure of growth. Measurement of length provides the best indicator of skeletal growth because it is not affected by changes in adipose tissue or water content.
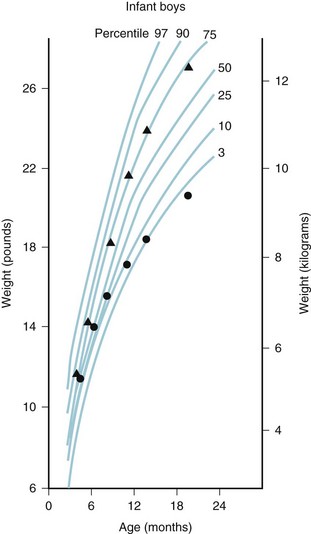
Term infants may lose 5% to 10% of their body weight during the first 24 to 72 hours of life from loss of body water. Birth weight is usually regained in 7 to 10 days. A daily increase of 30 g (210 g/week) is satisfactory for the first 3 months. Thereafter, weight gain slows so that at 10 to 12 months of age it is 70 g each week (Table 2-4).
| Age (years) | Weight (kg) |
|---|---|
| 1 | 10 |
| 3 | 15 |
| 5 | 19 |
| 7 | 23 |
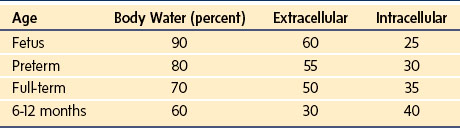
Weight and length are important but changes affect the composition of the body itself, especially total body water, which decreases at the expense of the extracellular compartment, with adult levels attained at 1 year of age.3,4 This finding has implications for drug dosing and distribution in the infant. Males have a greater percentage of water, whereas females have a slightly greater percentage of fat. The percentage decrease in extracellular water is greater than the decrease in total body water because of the simultaneous increase in intracellular water (Table 2-5).5
Another, more precise way to assess development is to calculate the body surface area (BSA).6

BSA can also be described using an allometric equation with an exponent of  (see Chapter 6):
Head Circumference
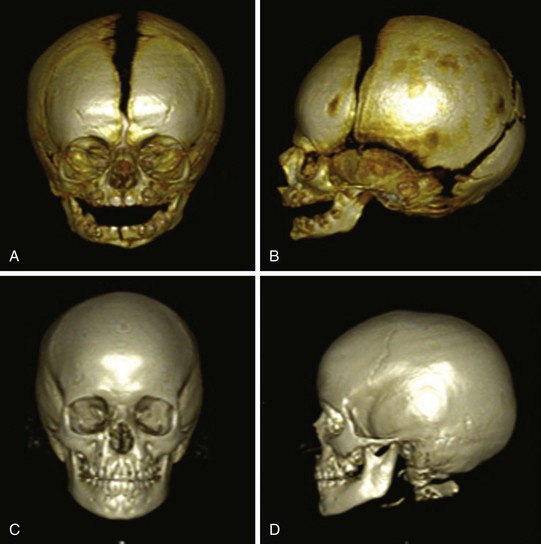
The anterior fontanel should be palpated to assess whether it is sunken (dehydration) or bulging abnormally (suggesting increased intracranial pressure as in hydrocephalus, infection, hemorrhage, or increased partial pressure of carbon dioxide in the arterial blood [PaCO2]). If it is bulging, the sutures should be palpated for abnormal separation as a result of increased intracranial pressure. The anterior fontanel closes between 9 and 18 months of age; the posterior fontanel closes by 2 to 4 months of age (Fig. 2-3). Cranial molding occurs particularly in LBW infants and is usually of no clinical importance.
Teeth
The first tooth, usually a lower incisor, erupts at approximately 6 months after birth (deciduous dentition). Eruption of all deciduous teeth is usually complete by 28 months of age. Permanent teeth appear at 6 years, with the shedding of the deciduous teeth; this process takes place during the next 6 to 8 years. Abnormally developed teeth occur with hereditary disorders, Down syndrome, cerebral palsy, medications (eg., tetracycline) and nutritional defects. Preterm infants may show severe enamel hypoplasia in their primary dentition.7,8
Airway and Respiratory System
Upper Airway Development
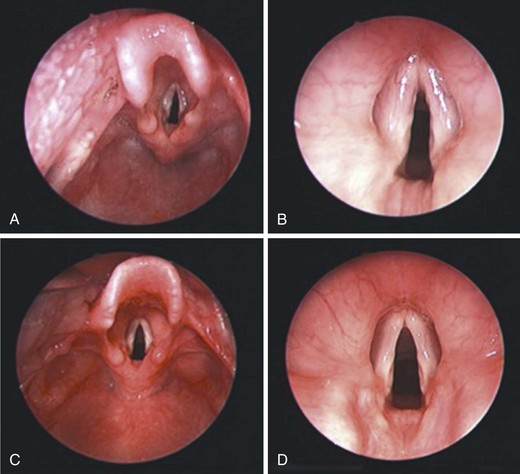
The larynx is developed embryologically from ectodermal, endodermal, and mesodermal tissues that are derived from the third, fourth, and sixth branchial arch and pouch apparatus. The development of the larynx and airway in the neonate is outlined in detail in Chapter 12. The laryngeal opening (epiglottis and vocal cords) in a neonate and 2-year-old boy are shown in Figure 2-4. Note the omega-shaped long epiglottis and the pearly white vocal cords in the neonate.
The depth of the nasopharynx increases due to remodeling of the palate as well as changes in the angulation of the skull base. During childhood, the soft tissues of the pharyngeal structures surrounding the upper airway grow proportionally to the skeletal structures. After birth, the dimensions of the nasal cavity increase very rapidly. During the first year of life, the total minimal cross-sectional area is increased by 67%, and the volume of the anterior 4 cm of the nasal airways by 36%.9
Compared with the adult, the tongue in the neonate contains considerably less fat and soft tissue, but overall is large in size relative to the dimensions of the mouth, with relatively larger extrinsic musculature and a less developed superior longitudinal muscle resulting in a flat dorsal surface with poor lateral mobility (see also Chapter 12).
Respiratory System Development
Airways: The bronchial tree down to and including the terminal bronchioles forms by week 16 of gestation. The acinus, consisting of all the airway structures distal to the terminal bronchiole and the entire gas-exchanging apparatus, develops throughout the remainder of gestation.
Alveoli: Alveoli develop mainly after birth, increasing in number until approximately 8 years of life and in size until growth of the chest wall ceases.
Pulmonary vessels: Arteries and veins accompanying the bronchial tree form by week 16 of gestation. Those vessels lying within the acinus follow the development of the alveoli. The appearance and growth of arterial smooth muscle lags behind the sprouting of new vessels and is not completed until late adolescence.
Transition to Air Breathing
Fetal breathing movements have been detected as early as 11 weeks of gestational age; they are interspersed with long periods of apnea and produce little tidal movement of lung fluid.10,11 The critical event in the change from placental to pulmonary gas exchange is the first inspiration, which initiates pulmonary ventilation, promotes the clearance of lung fluid, and triggers the change from the fetal to the neonatal pattern of circulation.
The first breath is a gasp that generates a transpulmonary distending pressure of 40 to 80 cm H2O.12 This moves the tracheal fluid (100 times more viscous than air), overcomes surface forces that develop as the air−fluid interface reaches the small airways, and overcomes tissue resistance. In some children, the removal of lung fluid may be delayed, producing the syndrome called transient tachypnea of the newborn.13 Tachypnea lasts for 24 to 72 hours and is associated with a characteristic chest radiographic appearance consisting of increased perihilar markings, fluid in the interlobar fissures, and streaky linear opacities in the parenchyma.
In the first few minutes of life, a state of “normal” asphyxia exists as a result of impairment of placental blood flow during labor. The partial pressure of oxygen in arterial blood (PaO2) and pH are low, whereas the PaCO2 is increased immediately after birth, but these parameters change rapidly in the first hour of life. Extrapulmonary shunting through fetal channels and intrapulmonary shunting, probably through unexpanded regions of the lung, persist for some time after birth, so that in neonates the physiologic right-to-left shunt is about three times that in adults.14
Mechanics of Breathing
Chest Wall and Respiratory Muscles
The accessory muscles of inspiration are relatively ineffective in infants because of an unfavorable anatomic rib configuration. In infancy, the ribs extend horizontally from the vertebral column, moving little with inspiration.15 These factors increase the workload on the diaphragm. Consequently, and in contrast to an adult, thoracic cross-sectional area is fairly constant throughout the breathing cycle, and inspiration occurs almost entirely as a result of diaphragmatic descent.
The chest wall of a neonate is floppy because it comprises noncalcified cartilage, its musculature is poorly developed, and the ribs are incompletely calcified.16,17 As the work of breathing increases, diaphragmatic displacement must also increase to maintain the tidal volume. The increased workload may lead to diaphragmatic fatigue and respiratory failure or apnea, especially in preterm infants.18,19
The tendency to respiratory muscle fatigue is the result of the metabolic characteristics of the diaphragm, which has very little type I (slow twitch, high oxidative capacity) muscle fibers (see Fig. 12-11).
Elastic Properties of the Lung
Changes in the static pressure−volume relationship of the lungs during growth are caused by increases in volume and changes in the elastic properties of lung tissue. Volume is the principal factor that determines lung compliance, which increases throughout childhood. Specific lung compliance remains relatively constant throughout childhood.20 In contrast, specific compliance of the chest wall declines throughout childhood and adolescence, reflecting the progressive calcification of the ribs and the increasing bulk of the thoracic muscles.
Static Lung Volumes
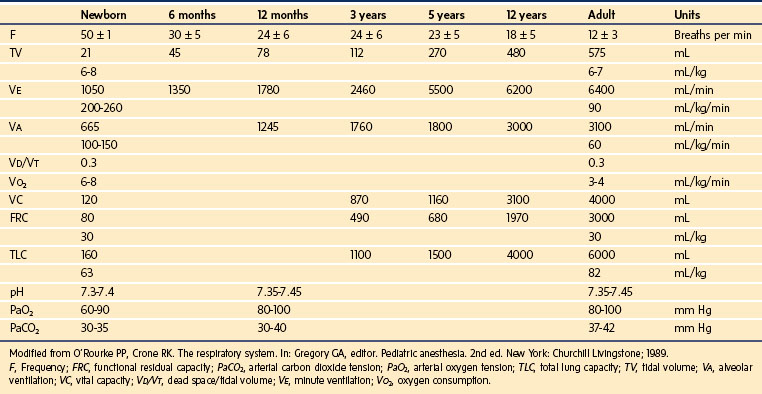
Detailed information expressing static lung volumes on the basis of body weight are detailed in Table 2-6.
Total Lung Capacity
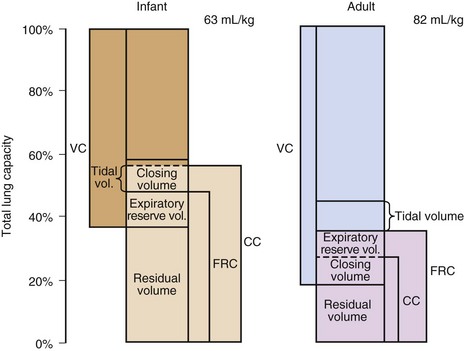
Adults have a markedly greater total lung capacity (TLC) than infants (Fig. 2-5). This difference reflects the fact that TLC is an effort-dependent parameter, depending on the strength and efficiency of the inspiratory muscles, which can be estimated by the maximum inspiratory pressure at functional residual capacity (FRC). An adult can generate negative pressures in excess of 100 cm H2O; negative inspiratory pressures as high as 70 cm H2O have been recorded for neonates, a surprisingly high value in view of their underdeveloped musculature and highly compliant chest wall. This may be a consequence of the small radius of curvature of an infant’s rib cage, which by the Laplace relationship converts a small tension into a large pressure difference.21
Functional Residual Capacity
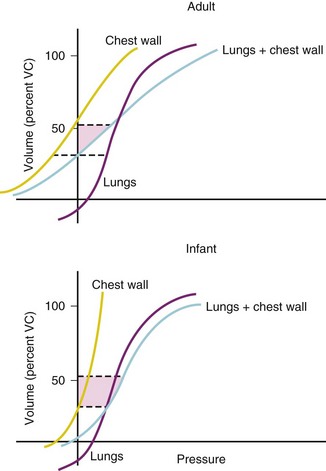
FRC is similar on a per-kilogram basis at all ages, but the mechanical factors on which it is based are different in infants and adults.22 In adults, FRC is the same as the volume at which the elastic forces generated by the passive recoil of the chest wall are balanced by the recoil of the lung (Fig. 2-6); this is the volume attained at end-expiration with an open glottis.
Closing Capacity
As exhalation proceeds to completion, small airways in dependent regions of the lung close, leading to air trapping in the affected areas. Closing capacity is closely related to age, declining throughout childhood and adolescence and increasing thereafter throughout adult life (see Fig. 2-5). This pattern of change has been related to the development and deterioration of lung elastic tissue and its effect on recoil pressure. The latter is the principal determinant of transmural pressure and therefore patency of the smallest airways, which lack intrinsic stability because they contain no cartilage.
Closing volume is within the range of tidal breathing in some adults older than 40 years and some children younger than 10 years (see Fig. 2-5). It is not possible to measure closing volume in children younger than 5 years, but because elastic recoil pressure decreases to very low levels in infancy (see Fig. 2-6); it is likely that some airways remain closed throughout tidal breathing. This conclusion is supported by the finding that infants have a large “trapped gas volume” that is not in free communication with the conducting airways. Age-related changes in PaO2, which parallel the changes in the difference between FRC and closing volume, may also be related to airway closure.21
Airway Dynamics
Resistance and Conductance
Airway resistance declines markedly with growth from 19 to 28 cm H2O/L/sec in neonates to less than 2 cm H2O/L/sec in adults.22,23 Airway resistance is greater in preterm than in full-term infants. On the other hand, specific airway conductance (reciprocal of resistance) is greater in preterm infants, and it continues to decline throughout the first 5 years of life.24,25
Inspiratory and Expiratory Flow Limitation
Tracheal compliance in neonates is twice that of adults; it is even greater in preterm infants and appears to be a consequence of cartilaginous immaturity. The functional importance of this finding is that dynamic collapse of the trachea may occur with inspiration and expiration (see Fig. 12-10).
Regulation of Breathing
In neonates as in adults, PaO2, PaCO2, and pH control pulmonary ventilation, with PaO2 acting mainly through peripheral chemoreceptors in the carotid and aortic bodies and PaCO2 and pH acting on central chemoreceptors in the medulla. Unlike an adult, an infant’s response to hypercapnia is not potentiated by hypoxia. In fact, hypoxia may depress the hypercapnic ventilatory response in term and preterm infants.26
High concentrations of oxygen depress the neonate’s respirations, whereas low concentrations stimulate it. The hypoxic response is not sustained. However, sustained hypoxia leads first to a return to baseline ventilation and then to ventilatory depression. This pattern of response persists in normal term infants for the first week of life, after which the response to sustained hypoxia is replaced by a sustained increase in ventilation.27 This pattern persists longer in preterm infants.
Prematurity is an important risk factor for life-threatening apnea in infants undergoing general anesthesia.28 The risk of postanesthetic respiratory depression is inversely related to gestational age and postconceptual age at the time of anesthesia.29 It has been stated that infants may be at risk up to 60 weeks after conception.29–31
The reduced PaO2 of neonates is compensated by a greater oxygen-carrying capacity due to increased hemoglobin concentrations, which decline during the first several weeks of life. At birth, the hemoglobin content of the blood is made up of 50% fetal hemoglobin, which has an in vivo oxygen-dissociation curve that is shifted to the left in comparison with normal adult hemoglobin. The shift in position of the oxygen-dissociation curve depends on the ratio of adult to fetal hemoglobin. It shifts to the right during the course of the first week of life, reflecting a switch from fetal to adult hemoglobin formation.20 Normal PaCO2 and pH are somewhat lower in the neonatal period than in later infancy (see Table 2-6).
Cardiovascular System
An understanding of cardiovascular development is important for anesthesiologists. This section briefly considers developmental changes in heart rate, blood pressure, cardiac output, and the electrocardiogram; more detailed descriptions are found in Chapters 14 and 16.
Heart Rate
In older children, a significant number of arrhythmias and conduction abnormalities are also encountered, with marked fluctuations in heart rate due to variations in autonomic tone. The mean heart rate in neonates in the first 24 hours of life is 120 beats per minute. It increases to a mean of 160 beats per minute at 1 month, after which it gradually decreases to 75 beats per minute at adolescence (Table 2-7).32
| Age | Mean Heart Rate in Beats per Minute (range) |
|---|---|
| Premature | 120-170 |
| 0-3 months | 100-150 |
| 3-6 months | 90-120 |
| 6-12 months | 80-120 |
| 1-3 years | 70-110 |
| 3-6 years | 65-110 |
| 6-12 years | 60-95 |
| >12 years | 55-85 |
*Note that the heart rate will be lower during sleep.
Data from Hartman ME, Cheifetz IM. Pediatric Emergencies and Resuscitation. In: Kliegman RM, Stanton ST BF, Geme III JW, Schor NF, Behrman RE, editors. Nelson Textbook of Pediatrics. 19th ed. Philadelphia: Elsevier; 2011. p. 280.
Blood Pressure
Mean systolic blood pressure in neonates and infants increases from 65 mm Hg in the first 12 hours of life to 75 mm Hg at 4 days and 95 mm Hg at 6 weeks. There is little change in mean systolic pressure between 6 weeks and 1 year of age; between 1 year and 6 years, there is only a slight change, followed by a gradual increase.33,34 These measurements apply to infants and children who are awake and quiet. The blood pressure in preterm infants in the first 12 hours is less than that in full-term infants; a gradual increase in blood pressure occurs after birth—68/43 mm Hg on day 1 of life compared with 90/55 mm Hg on day 90 of life (Table 2-8).35,36 It has also been noted that infants with birth asphyxia and those who require mechanical ventilation have reduced blood pressures.37 Blood pressure measured in the lower leg is less than in the upper arm.38
| Age | Normal Blood Pressure (mm Hg) | |
|---|---|---|
| Mean Systolic | Mean Diastolic | |
| Premature | 55-75 | 35-45 |
| 0-3 months | 65-85 | 45-55 |
| 3-6 months | 70-90 | 50-65 |
| 6-12 months | 80-100 | 55-65 |
| 1-3 years | 90-105 | 55-70 |
| 3-6 years | 95-110 | 60-75 |
| 6-12 years | 100-120 | 60-75 |
| >12 years | 110-135 | 65-85 |
*Note that the blood pressure will be lower during sleep or during anesthesia.
Data from Hartman ME, Cheifetz IM. Pediatric Emergencies and Resuscitation. In: Kliegman RM, Stanton ST BF, Geme III JW, Schor NF, Behrman RE, editors. Nelson Textbook of Pediatrics. 19th ed. Philadelphia: Elsevier; 2011. p. 280.
Blood pressure in adolescents and adults who were born preterm is greater than in those who were born full-term. However, the slower fetal growth in preterm, LBW infants was not identified as an independent predictor of this greater blood pressure later in life.39
Cardiac Output
Pulsed Doppler determinations of cardiac output provide reasonable noninvasive estimates of cardiac output for clinical application in neonates. Cardiac output, normalized for body weight, in neonates between 780 and 4740 g at birth, remains fairly constant, changing approximately 10% over the weight range.40 The range of cardiac output in both full-term and preterm neonates is 220 to 350 mL/kg/min, two- to threefold greater than in adults.40,41 Between birth and the end of the first year, mean cardiac output normalized for body weight (or surface area), remains fairly constant at 204 ± 45 mL/kg/min.42 The relatively large cardiac output (mL/min/kg) in neonates reflects their greater metabolic rate (expressed per kilogram) and oxygen consumption compared with adults. Basal metabolic rate has been shown to increase as size decreases in all species43 (see Chapter 6).
Pulsed Doppler estimation of cardiac output has also been found useful in assessing left ventricular myocardial dysfunction in neonates after perinatal asphyxia and acidosis, as well as its response to therapy.35,44,45 In older children, measurements of cardiac output are necessary in circulatory shock.46 New noninvasive techniques using changes in impedance may be useful in the future (see Chapter 51).
Normal Electrocardiographic Findings From Infancy to Adolescence
The P wave reflects atrial depolarization and varies little with age. The PR interval increases with age (mean value for the first year is 0.10 second, increasing to 0.14 second at 12 to 16 years).47 The duration of the QRS complex increases with age, but prolongation greater than 0.10 second is abnormal at any age.
In addition, T waves are upright in all chest leads. Within hours, they become isoelectric or inverted over the left chest; by the seventh day, the T waves are inverted in V4R (V4 position under the right clavicle), V1, and across to V4; from then on, the T waves remain inverted over the right chest until adolescence, when they become upright over the right side of the chest again. Failure of T waves to become inverted in V4R and V1 to V4 by 7 days may be the earliest electrocardiographic evidence of right ventricular hypertrophy.48,49
Renal System
Urine production begins in utero at 10 to 12 weeks of gestation and is excreted into the amniotic cavity, helping to maintain amniotic fluid volume. The fetus maintains its metabolic homeostasis through the placenta. It is only after birth that the kidney assumes this responsibility. More than 90% of neonates will have voided urine within the first 24 hours after birth. All normal infants should have voided by 48 hours after birth.50
Tubular function begins to develop after 34 weeks of gestation and increases during the first two years of life.51 The number and function of the Na+/K+-ATPase transporters, are reduced at birth (activity increases 5- to 10-fold during the postnatal period). All transporters reliant on the Na+ gradient are also reduced in function. The renal tubular threshold is decreased for sodium (identifying the risk for hyponatremia), for glucose (increased risk for osmotic polyuria), and for bicarbonates (increased risk for metabolic acidosis).
Nephrogenesis is complete by 36 weeks of gestation. Renal blood flow and glomerular filtration rate (GFR) are reduced and correlate with gestational age. GFR is 20% to 25% of adult levels at term. They increase rapidly in the postnatal period due to an increase in cardiac output and a decrease in renal vascular resistance.52 Adult rates are achieved by approximately two years of age53 (see Fig. 6-11). A reduced GFR significantly affects the neonate’s ability to excrete saline and water loads, as well as drugs. At birth, the serum creatinine concentration reflects the maternal concentration, but decreases during the first days of life. Over the course of early childhood, creatinine clearance slowly increases, reaching adult values between 2 and 3 years of age. Due to the rapid growth and increase in muscular mass, normal serum creatinine values increase with age and are greater in males.
Digestive and Endocrine System
Hepatic System
The liver is the site for the synthesis of proteins; this process is active in fetal and neonatal life. In fetal life, the main serum protein is alpha-fetoprotein. This protein first appears at 6 weeks of gestation and reaches a peak at 13 weeks. Albumin synthesis starts at 3 to 4 months of gestation and approaches adult values at birth; in preterm infants, the level is reduced. Proteins involved in clotting are also formed in the liver but their concentrations in preterm and full-term neonates are less than normal for the first few days after birth. Hematopoiesis occurs in the fetal liver, with peak activity at 7 months of gestation. After 6 weeks of age, hematopoiesis is confined to the bone marrow except under pathologic conditions, such as hemolytic anemia (see Chapter 28).
The capacity to enzymatically break down proteins is reduced at birth. This is particularly important in preterm infants, when the intake of a large protein load can result in dangerous levels of serum amino acid concentrations. In the first weeks of life, drug metabolism is less efficient than in later life. In addition to less effective hepatic metabolism, altered drug binding by serum proteins and immature renal function contribute to the problem (see Chapter 6).
Physiologic Jaundice
Hyperbilirubinemia (defined as a total serum bilirubin level >5 mg/dL) is an especially important problem in neonates. About 60% of term and 80% of preterm neonates develop jaundice in the first week of life, with a total bilirubin concentration greater than 5 mg/dL.54 The mechanisms for producing jaundice are outlined in Table 2-9.55,56 In term neonates, the normal total bilirubin concentration is usually less than 5 mg/dL (86 µmol/L), rarely >12 mg/dL without a risk factor and peaks at 3 to 4 days. In preterm infants, the bilirubin concentration peaks at 10 to 12 mg/dL on the fifth to seventh postnatal day. After this period, the concentration gradually decreases reaching adult values (less than 2 mg/dL) by 1 to 2 months in both term and preterm infants. The concentration of indirect bilirubin is also increased in the first few days after birth. The cause of nonhemolytic physiologic hyperbilirubinemia is excessive bilirubin production from breakdown of red blood cells and increased enterohepatic circulation of bilirubin with deficient hepatic conjugation due to depressed glucuronyl transferase activity. The relationship between breast feeding and hyperbilirubinemia has been well documented. It is usually delayed in onset (after the third day of life), its cause remains unclear, and it occurs in about 1% of breastfeeding infants. An earlier hypothesis ascribing it to inhibition of glucuronyl transferase by 3α, 20β-pregnanediol activity has not been substantiated.
TABLE 2-9 Causes of Jaundice in Neonates
Important pathologic causes of jaundice in neonates are presented in Table 2-10. The relative rarity of cholestasis is in sharp contrast with the very common finding of jaundice during the first weeks of life, and therefore, a false diagnosis of physiologic or breast milk jaundice is easily made. Symptoms indicative of cholestasis such as dark urine and pale stools are often unrecognized.57
TABLE 2-10 Pathologic Causes of Jaundice in Neonates
Antibody-induced hemolysis (Rh and ABO)
Hereditary red blood cell disorders (e.g., glucose-6-phosphate dehydrogenase deficiency, which gives rise to hemolysis from drugs or infection)
Infections (e.g., neonatal hepatitis, sepsis, severe urinary tract infections)
Once the distinction between physiologic and hemolytic hyperbilirubinemia has been made, the underlying cause can then be treated and efforts can be directed at preventing bilirubin encephalopathy (kernicterus) by the use of phototherapy and, in selected cases, exchange transfusions. Phototherapy reduces serum bilirubin concentrations by converting bilirubin through structural photoisomerization and photooxidation into excretable products.58 A possible relationship between neonatal blue-light phototherapy and the development of benign or malignant melanocyte lesions has been suggested59; further studies are required to clarify this concern.
Sick preterm infants are especially at risk for kernicterus and are more aggressively treated at reduced bilirubin concentrations than full-term infants. Increasingly common is a form of cholestatic jaundice in LBW infants receiving prolonged hyperalimentation. Its mechanism is unclear, but it may be due to inhibition of bile flow by amino acids.60–63 Future therapy for hyperbilirubinemia in LBW infants may include the use of tin-mesoporphyrin, which inhibits the production of bilirubin.64,65
Gastrointestinal Tract
Enzyme levels of enterokinase and lipase increase with gestational age but are lower at birth compared with older children. Full-term neonates and preterm infants handle protein loads reasonably well, although preterm infants may have difficulty with large loads. Fat digestion is limited, particularly in preterm infants, who absorb only 65% of adult levels. Neonatal duodenal motility undergoes marked maturational changes between 29 and 32 weeks of gestation. This is one factor limiting tolerance of enteral feeding before 29 to 30 weeks of gestation. Central nervous system abnormalities will delay these maturational changes.66
Lower esophageal pressures are reduced at birth but increase steadily reaching adult values 3 to 6 weeks postnatally. Daily vomiting or “spitting up” may be seen in half of all infants between 0 and 3 months of age and up to two-thirds of 4- to 6-month-old infants.67 Most of these infants suffer no ill effect (“happy spitters”) and grow well.68 This condition usually begins in the first weeks of life and resolves spontaneously by 9 to 24 months of age as solid food is introduced and the child assumes the upright position. Between 1 : 300 and 1 : 1000 infants have reflux that is significant enough to warrant treatment to prevent complications.69
The gastrointestinal transit time in the infant is less than that of an adult and increases with age. The normal physiologic range of stool frequency varies greatly (from 10 times a day to 1-2 times a week70 and more often in breastfed infants. The frequency of bowel movements gradually declines over the first years of life, reaching adult habits at about 4 years of age.
Necrotizing enterocolitis is an acquired gastrointestinal disease associated with significant morbidity and mortality in prematurely born neonates. The disease affects about 10% of preterm neonates weighing less than 1500 g or 1% to 5% of all neonatal intensive care unit admissions (see also Chapters 35 and 36). Combined with enteral feeds and bacterial colonization, inflammatory mediators are released, leading to a propagated inflammatory response with both pro- and antiinflammatory influences.71
Pancreas
Full-term neonates undergo a metabolic adjustment postnatally with regard to glucose. Studies have defined values for glucose levels that should be cause for concern: plasma glucose levels less than 35 mg/dL in the first 3 hours of life; less than 40 mg/dL between 3 and 24 hours; and less than 45 mg/dL after 24 hours.72 Others have defined hypoglycemia in full-term infants as a plasma glucose concentration of less than 30 mg/dL in the first day of life or less than 40 mg/dL in the second day of life.73 It is important to recognize that infants may develop serious hypoglycemia that could lead to irreversible central nervous system damage, even though they demonstrate no symptoms. Other infants may present with convulsions, but signs may also be subtle (e.g., lethargy, somnolence, and jitteriness).
Hyperglycemia (plasma glucose 150 mg/dL or greater) occurs in stressed neonates, particularly LBW infants infused with glucose-containing solutions. Hyperglycemia commonly occurs in infants undergoing elective surgery under general anesthesia; infusion of glucose-containing solutions may increase the risk of hyperglycemia. Thus it is advisable that intraoperative glucose levels be monitored. A study in infants undergoing surgery under general anesthesia showed that postsurgical plasma glucose values were significantly greater than postinduction values; insulin changes were minimal.74 The risk of hyperglycemia is considerably greater in infants weighing less than 1000 g compared with infants of 2000 g or more.73 Hyperglycemia may also lead to osmotic diuresis and dehydration and has been associated with an increased incidence of intraventricular hemorrhage and a neurologic handicap.
Hematopoietic and Immunologic System
The blood volume of a full-term neonate depends on the time of cord clamping, which modifies the volume of placental transfusion. The blood volume is 93 mL/kg when cord clamping is delayed after delivery, compared with 82 mL/kg with immediate cord clamping.75,76 Within the first 4 hours after delivery, however, fluid is lost from the blood and the plasma volume contracts by as much as 25%. The larger the placental transfusion, the larger this loss of fluid in the first few hours after birth, with resultant hemoconcentration. The blood volume in preterm infants is greater (90 to 105 mL/kg) than it is in full-term infants because of increased plasma volume.
Hemoglobin
In term infants, the hemoglobin concentration decreases during the 9th to 12th week to reach a nadir of 10 to 11 g/dL (hematocrit 30% to 33%) and then increases. This decrease in hemoglobin concentration is due to a decrease in erythropoiesis and to some extent due to a shortened life span of the red blood cells. In preterm infants, the decrease in the hemoglobin level is greater and is directly related to the degree of prematurity; also, the nadir is reached earlier (4 to 8 weeks).77 In infants weighing 800 to 1000 g, the decrement may reach a very small concentration, 8 g/dL. This “anemia” (physiologic anemia of the newborn) is a normal physiologic adjustment to extrauterine life. Despite the reduction in hemoglobin, the oxygen delivery to the tissues may not be compromised because of a shift of the oxygen-hemoglobin dissociation curve (to the right), secondary to an increase of 2,3-diphosphoglycerate.78 In addition, fetal hemoglobin is replaced by adult-type hemoglobin, which also results in a shift in the same direction. In neonates, especially preterm infants, reduced hemoglobin concentrations may be associated with apnea and tachycardia.79 Vitamin E administration does not prevent anemia of prematurity; no significant difference was noted between vitamin E–supplemented and unsupplemented groups in terms of hemoglobin concentration, reticulocyte and platelet counts, or erythrocyte morphology in infants at 6 weeks of age.80 Infants with anemia of prematurity have been found to have an inadequate production of erythropoietin (the primary regulator in erythropoiesis). Some centers are now using recombinant human erythropoietin in VLBW infants to stimulate erythropoiesis and decrease the need for transfusions.81,82
Leukocyte and Immunology
The white blood cell count may normally reach 21,000/mm3 in the first 24 hours of life and 12,000/mm3 at the end of the first week, with the number of neutrophils equaling the number of lymphocytes. It then decreases gradually, reaching adult values at puberty. At birth, neutrophil granulocytes predominate but rapidly decrease in number so that during the first week of life and through 4 years of age the lymphocyte is the predominant cell. After the fourth year, the values approximate an adult’s. Neonates have an increased susceptibility to bacterial infection, which is related in part to immaturity of leukocyte function. Sepsis may be associated with a minimal leukocyte response or even with leukopenia. Spurious increases in the white blood cell content may be due to drugs (e.g., epinephrine). The incidence of neonatal sepsis correlates inversely with gestational age and may be as great as 58% in VLBW infants.83
Platelets
Thrombocytopenia is a common hematologic finding in neonates, occurring in 1% to 2% of healthy term neonates.84 Mechanical ventilation has been associated with a significant decrease in the platelet count in neonates.85 There appears to be an inverse correlation between gestational age or birth weight and the severity of platelet reduction. A study of neonatal thrombocytopenia and its impact on hemostatic integrity showed that thrombocytopenic infants are at greater risk for bleeding than equally sick nonthrombocytopenic infants (see Chapter 18).
Coagulation
At birth, vitamin K–dependent factors (i.e., II, VII, IX, and X) are 20% to 60% of adult values; in preterm infants, the values are even less. The result is prolonged prothrombin times, normally encountered in full-term and preterm infants. Synthesis of vitamin K–dependent factors occurs in the liver, which, being immature, leads to relatively lower levels of the coagulation factors, even with the administration of vitamin K. It takes several weeks for the levels of coagulation factors to reach adult values; the deficit is even more pronounced in preterm infants. Vitamin K prophylaxis has been evaluated,86 and the findings show that the majority of cases of neonatal vitamin K deficiency occur in normal neonates. Thus, all neonates should receive prophylactic vitamin K soon after birth to prevent hemorrhagic disease of the neonate. Its omission could lead to serious and life-threatening consequences, especially if surgery is undertaken. However, in theory, the increasing risk of bleeding is balanced by the protective effects of physiologic deficiencies of coagulation inhibitors, as well as by the decreased fibrinolytic capacity. Developmental hemostasis should be considered, as well as laboratory variations of coagulation tests that may render any diagnosis of bleeding disorder in infants difficult to establish.87
Infants of mothers who have received anticonvulsant drugs during pregnancy may develop a serious coagulopathy similar to that encountered with vitamin K deficiency.88 Vitamin K1 administered to neonates usually reverses this bleeding tendency, but deaths have occurred despite therapy. Other risk factors include maternal use of drugs such as warfarin, rifampin, and isoniazid. Breastfeeding may also be associated with severe vitamin K deficiency.
Polycythemia
Neonatal polycythemia (central hematocrit greater than 65%) occurs in 3% to 5% of full-term neonates.89 Using M-mode echocardiography, a study of neonates demonstrated an increase in PVR with hyperviscosity.90 Partial exchange transfusion to reduce the hematocrit and decrease the blood viscosity improves systemic and pulmonary blood flow and oxygen transport, although one review questioned the efficacy when the exchange transfusion was conducted after 6 hours of life in asymptomatic infants.91 The increased organ blood flow should prevent the cardiovascular and neurologic symptoms associated with the hyperviscosity syndrome.
Neurologic Development and Cognitive Development Issues
Neurologic Development
Reduction of perinatal mortality during the past decade has not resulted in the expected reduction in the prevalence of cerebral palsy (1 : 500 live births). The most common etiologies of cerebral palsy are perinatal ischemic stroke, white matter disorder, and intrauterine inflammation.92 Less than 5% of cerebral palsy results from perinatal asphyxia. The strongest predictors of cerebral palsy appear to be congenital anomaly, low birth weight, low placental weight, multiple fetuses, or abnormal fetal position before labor and delivery.93
The nervous system is anatomically complete at birth; functionally it remains immature with the continuation of myelination and synaptogenesis. Myelination is usually complete by 7 years of age. An infant’s normal mental development depends on the maturation of the central nervous system. This development may be affected by physical illness, inadequate psychosocial support, or bad nutrition conditions in preterm babies. In a randomized trial of diet in preterm babies, a suboptimal diet resulted in reduced intelligence quotients 7 to 8 years later.94
Recent controversies concerning the potential adverse effects of anesthesia on the developing brain show how delicate this organ is and how its development may be affected by environmental agents95,96 (see Chapter 23).
Plasma membrane transport selectively promotes the passage of essential substrates such as glucose, organic acids, and amino acids across the blood-brain barrier. Hypoxemia and ischemia may lead to a breakdown in this barrier, with resulting edema and increased intracranial pressure. Injury to the blood-brain barrier may result from abnormal entry of calcium or formation of free radicals. Further studies of the mechanism of this breakdown will lead to rational approaches to therapy. In preterm infants stressed by hypoxia, the blood-brain barrier may become particularly permeable to the water-soluble unbound bilirubin, with possible damage to the brain.97
Normal neonates show various primitive reflexes, which include the Moro response and grasp reflex. Milestones of development are useful indicators of mental development and possible deviations from normal. It should be appreciated, however, that these milestones represent the average, and infants can vary in their rates of maturation of different body functions and still be within the normal range.98 The Denver Developmental Screening Test is useful for assessing these milestones. The test focuses on four areas: (1) gross motor function, (2) fine motor and adaptive skills, (3) language, and (4) personal and social skills. Developing infants rapidly acquire motor skills. For effective movement, an infant needs postural control, which develops in a cephalocaudal direction. It starts with head control and progresses to sitting, standing, walking, and finally running (Table 2-11).
| Motor Milestone | Age |
|---|---|
| Supports head | 3 months |
| Sits alone | 6 months |
| Stands alone | 12 months |
| Balances on one foot | 3 years |
Adaptive skills are performed through well-coordinated fine motor movements (Table 2-12). Abnormal development may be reflected in a delay in appearance of a particular milestone or in its pathologic persistence with maturation in a child. For example, at 20 weeks, a child reaches and retrieves objects, frequently placing them in his or her mouth. As an infant matures, however, this behavior pattern usually ceases at 12 to 13 months of age; in infants with a developmental delay, this practice may continue much longer.
TABLE 2-12 Relationship of Fine Motor/Adaptive Milestones to Age
| Fine Motor/Adaptive Milestones | Age |
|---|---|
| Grasps rattle | 3 months |
| Passes cube hand to hand | 6 months |
| Pincer grip | 1 year |
| Imitates vertical line | 2 years |
| Copies circle | 3 years |
Language development correlates closely with cognitive skills (Table 2-13). Personal and social skills are modified by environmental factors and cultural patterns (Table 2-14). Development of walking, speech, and sphincter control are most important. For appropriate evaluation consider familial patterns, level of intelligence, and physical illness. Deafness may cause delayed speech.
TABLE 2-13 Relationship of Language Milestones to Age
| Language Milestones | Age |
|---|---|
| Squeals | 1.5-3 months |
| Turns to voice | 6 months |
| Combines two words | 1.5 years |
| Composes short sentences | 2 years |
| Gives entire name | 3 years |
TABLE 2-14 Relationship of Personal-Social Milestones to Age
| Personal-Social Milestones | Age |
|---|---|
| Smiles spontaneously | 3 months |
| Feeds self crackers | 6 months |
| Drinks from cup | 1 year |
| Plays interactive games | 2 years |
1 Dubowitz LM, Dubowitz V, Goldberg C. Clinical assessment of gestational age in the newborn infant. J Pediatr. 1970;77:1–10.
2 Narayanan I, Dua K, Gujral VV, et al. A simple method of assessment of gestational age in newborn infants. Pediatrics. 1982;69:27–32.
3 Friis-Hansen B. Body composition during growth: in vivo measurements and biochemical data correlated to differential anatomical growth. Pediatrics. 1971;47:169–181.
4 Reid L. 1976 Edward B.D. Neuhauser lecture. The lung: growth and remodeling in health and disease. AJR Am J Roentgenol. 1977;129:777–788.
5 Hochman HI, Grodin MA, Crone R. Dehydration, diabetic ketoacidosis, and shock in the pediatric patient. Pediatr Clin North Am. 1979;26:803–826.
6 Mosteller RD. Simplified calculation of body-surface area. N Engl J Med. 1987;317:1098.
7 Moylan FM, Seldin EB, Shannon DC, et al. Defective primary dentition in survivors of neonatal mechanical ventilation. J Pediatr. 1980;96:106–108.
8 Nelson S, Albert JM, Lombardi G, et al. Dental caries and enamel defects in very low birth weight adolescents. Caries Res. 2010;44:509–518.
9 Djupesland PG, Lyholm B. Changes in nasal airway dimensions in infancy. Acta Otolaryngol. 1998;118:852–858.
10 Boddy K, Dawes GS. Fetal breathing. Br Med Bull. 1975;31:3–7.
11 Maloney JE, Alcorn D, Bowes G, et al. Development of the future respiratory system before birth. Semin Perinatol. 1980;4:251–260.
12 Karlberg P, Adams FH, Geubelle F, et al. Alteration of the infant’s thorax during vaginal delivery. Acta Obstet Gynecol Scand. 1962;41:223–229.
13 Avery ME, Gatewood OB, Brumley G. Transient tachypnea of newborn: possible delayed resorption of fluid at birth. Am J Dis Child. 1966;111:380–385.
14 Hodson WA, Alden ER. Gas exchange in the developing lung. In: Hodson WA, ed. Development of the lung. New York: Marcel Dekker; 1977:469–496.
15 Takahashi E, Atsumi H. Age differences in thoracic form as indicated by thoracic index. Hum Biol. 1955;27:65–74.
16 Gerhardt T, Bancalari E. Chest wall compliance in full-term and premature infants. Acta Paediatr Scand. 1980;69:359–364.
17 Knill R, Andrews W, Bryan AC, et al. Respiratory load compensation in infants. J Appl Physiol. 1976;40:357–361.
18 Heldt GP, McIlroy MB. Distortion of chest wall and work of diaphragm in preterm infants. J Appl Physiol. 1987;62:164–169.
19 Heldt GP. Development of stability of the respiratory system in preterm infants. J Appl Physiol. 1988;65:441–444.
20 Godfrey S. Growth and development of the respiratory system. In: Davies JA, Dobbing J, eds. Functional development, scientific foundations of paediatrics. Baltimore: University Press; 1982:432–450.
21 Bryan AC, Mansell AL, Levison H. Development of the mechanical properties of the respiratory system. In: Hodson WA, ed. Development of the lung. New York: Marcel Dekker; 1977:445–468.
22 Taussig LM, Harris TR, Lebowitz MD. Lung function in infants and young children: functional residual capacity, tidal volume, and respiratory rates. Am Rev Respir Dis. 1977;116:233–239.
23 Karlberg P, Koch G. Development of mechanics of breathing during the first week of life: a longitudinal study. Acta Paediatr Scand. 1962;51:121–129.
24 Stocks J, Godfrey S. Specific airway conductance in relation to postconceptional age during infancy. J Appl Physiol. 1977;43:144–154.
25 Doershuk CF, Downs TD, Matthews LW, et al. A method for ventilatory measurements in subjects 1 month–5 years of age: normal results and observations in disease. Pediatr Res. 1970;4:165–174.
26 Rigatto H, De La Torre Verduzco R, Gates DB. Effects of O2 on the ventilatory response to CO2 in preterm infants. J Appl Physiol. 1975;39:896–899.
27 Rigatto H, Brady JP, De La Torre Verduzco R. Chemoreceptor reflexes in preterm infants: I. The effect of gestational and postnatal age on the ventilatory response to inhalation of 100% and 15% oxygen. Pediatrics. 1975;55:604–613.
28 Steward DJ. Preterm infants are more prone to complications following minor surgery than are term infants. Anesthesiology. 1982;56:304–306.
29 Coté CJ, Zaslavsky A, Downes JJ, et al. Postoperative apnea in former preterm infants after inguinal herniorrhaphy: a combined analysis. Anesthesiology. 1995;82:809–822.
30 Liu LM, Coté CJ, Goudsouzian NG, et al. Life-threatening apnea in infants recovering from anesthesia. Anesthesiology. 1983;59:506–510.
31 Kurth CD, Spitzer AR, Broennle AM, et al. Postoperative apnea in preterm infants. Anesthesiology. 1987;66:483–488.
32 Southall DP, Richards JM, Johnstone PGB, et al. Study of cardiac rhythm in healthy newborn infants. Br Heart J. 1980;43:14–20.
33 de Swiet M, Fayers P, Shinebourne EA. Systolic blood pressure in a population of infants in the first year of life: the Brompton study. Pediatrics. 1980;65:1028–1035.
34 Southall DP, Johnston F, Shinebourne EA, et al. 24-Hour electrocardiographic study of heart rate and rhythm patterns in population of healthy children. Br Heart J. 1981;45:281–291.
35 Tan KL. Blood pressure in very low birth weight infants in the first 70 days of life. J Pediatr. 1988;112:266–270.
36 Osborn D, Evans N, Kluckow M. Diagnosis and treatment of low systemic blood flow in preterm infants. NeoReviews. 2004;5:e109–e121.
37 Hegyi T, Anwar M, Carbone MT, et al. Blood pressure ranges in premature infants: II. The first week of life. Pediatrics. 1996;97:336–342.
38 Short JA. Noninvasive blood pressure measurement in the upper and lower limbs of anaesthetized children. Paediatr Anaesth. 2000;10:591–593.
39 Belfort MB, Gillman NW, McCormick MC. Prenatal and perinatal predictors of blood pressure at school age in former preterm, low birth weight infants. J Perinatol. 2012;32:265–269.
40 Walther FJ, Siassi B, Ramadan NA, Ananda AK, Wu PY. Pulsed Doppler determinations of cardiac output in neonates: normal standards for clinical use. Pediatrics. 1985;76:829–833.
41 Alverson DC, Eldridge M, Dillon T, et al. Noninvasive pulsed Doppler determination of cardiac output in neonates and children. J Pediatr. 1982;101:46–50.
42 Alverson DC, Aldrich M, Angelus P, Backstrom C, Werner S. Longitudinal trends in left ventricular cardiac output in healthy infants in the first year of life. J Ultrasound Med. 1987;6:519–524.
43 West GB, Brown JH. The origin of allometric scaling laws in biology from genomes to ecosystems: towards a quantitative unifying theory of biological structure and organization. J Exp Biol. 2005;208:1575–1592.
44 Walther FJ, Siassi B, Ramadan NA, et al. Cardiac output in newborn infants with transient myocardial dysfunction. J Pediatr. 1985;107:781–785.
45 Rice MJ, McDonald RW, Reller MD, et al. Pediatric echocardiography: current role and a review of technical advances. J Pediatr. 1996;128:1–14.
46 Lemson J, Nusmeier A, van der Hoeven JG. Advanced hemodynamic monitoring in critically ill children. Pediatrics. 2011;128:560–571.
47 Dickinson DF. The normal ECG in childhood and adolescence. Heart. 2005;91:1626–1630.
48 Southall DP, Vulliamy DG, Davies MJ, et al. A new look at the neonatal electrocardiogram. BMJ. 1976;2:615–618.
49 Rautaharju PM, Davignon A, Soumis F, et al. Evolution of QRS-T relationship from birth to adolescence in Frank-lead orthogonal electrocardiograms of 1492 normal children. Circulation. 1979;60:196–204.
50 Clark DA. Times of first void and first stool in 500 newborns. Pediatrics. 1977;60:457–459.
51 Arant BSJ. Developmental patterns of renal functional maturation compared in the human neonate. J Pediatr. 1978;92:705–712.
52 Leake RD, Trygstad CW, Oh W. Inulin clearance in the newborn infant: relationship to gestational and postnatal age. Pediatr Res. 1976;10:759–762.
53 Rhodin MM, Anderson BJ, Peters AM, et al. Human renal function maturation: a quantitative description using weight and postmenstrual age. Pediatr Nephrol. 2009;24:67–76.
54 Rennie J, Burman-Roy S, Murphy MS. Neonatal jaundice: summary of NICE guidance. BMJ. 2010;340:c2409.
55 Stevenson DK, Wong RJ, DeSandre GH, et al. A primer on neonatal jaundice. Adv Pediatr. 2004;51:263–288.
56 Sarici SU, Serdar MA, Korkmaz A, et al. Incidence, course and prediction of hyperbilirubinemia in near-term and term newborns. Pediatrics. 2004;113:775–780.
57 De Bruyne R, Van Biervliet S, Vande Velde S, et al. Neonatal cholestasis. Eur J Pediatr. 2011;170:279–284.
58 Hansen TWR. Phototherapy for neonatal jaundice—therapeutic effects on more than one level? Semin Perinatol. 2011;34:231–234.
59 Morris BH, Oh W, Tyson JE, et al. Aggressive vs. conservative phototherapy for infants with extremely low birth weight. N Engl J Med. 2008;359:1885–1896.
60 Touloukian RJ, Downing SE. Cholestasis associated with long-term parenteral hyperalimentation. Arch Surg. 1973;106:58–62.
61 Venigalla S, Gourley GR. Neonatal cholestasis. Semin Perinatol. 2004;28:348–355.
62 Karpen SJ. Update on the etiologies and management of neonatal cholestasis. Clin Perinatol. 2002;29:159–180.
63 Bezerra JA, Balistreri WF. Cholestatic syndromes of infancy and childhood. Semin Gastrointest Dis. 2001;12:54–65.
64 Valaes T, Petmezaki S, Henschke C, et al. Control of jaundice in preterm newborns by an inhibitor of bilirubin production: studies with tin-mesoporphyrin. Pediatrics. 1994;93:1–11.
65 Dennery PA. Metalloporphyrins for the treatment of neonatal jaundice. Curr Opin Pediatr. 2005;17:167–169.
66 Morriss FHJ, Moore M, Weisbrodt NW, et al. Ontogenic development of gastrointestinal motility: IV. Duodenal contractions in preterm infants. Pediatrics. 1986;78:1106–1113.
67 Rudolph C. Disorders of esophageal motility. In: Rudolph C, Rudolph A, Hostetter M, et al, eds. Rudolph’s pediatrics. New York: McGraw-Hill; 2002:1388–1394.
68 Wilkinson A, Charlton V, Phibbs R, et al. Examination of the newborn infant. In: Rudolph C, Rudolph A, Hostetter M, et al, eds. Rudolph’s pediatrics. New York: McGraw-Hill; 2002:83–91.
69 Orenstein S, Peters J, Kahn S, et al. Embryology, anatomy & function of the esophagus. In: Kliegman R, Behrman R, Jenson H, et al, eds. Nelson textbook of pediatrics. Philadelphia: Saunders; 2007:1547–1549.
70 Klish W. Functional constipation and encopresis. In: McMillan J, Feigin R, De Angelis C, et al, eds. Oski’s pediatrics: principles and practice. Philadelphia: Lippincott Williams & Wilkins; 2006:1920–1923.
71 Lahmiti S, Aboussad A. Neonatal necrotizing enterocolitis. Sci World J. 2011;11:655–656.
72 Srinivasan G, Pildes RS, Cattamanchi G, et al. Plasma glucose values in normal neonates: a new look. J Pediatr. 1986;109:114–117.
73 Srinivasan G, Jain R, Pildes RS, et al. Glucose homeostasis during anesthesia and surgery in infants. J Pediatr Surg. 1986;21:718–721.
74 Kennealy JA, McLennan JE, Loudon RG, et al. Hyperventilation-induced cerebral hypoxia. Am Rev Respir Dis. 1980;122:407–412.
75 Usher R, Lind J. Blood volume of the newborn premature infant. Acta Paediatr Scand. 1965;54:419–431.
76 Usher R, Shephard M, Lind J. The blood volume of the newborn infant and placental transfusion. Acta Paediatr Scand. 1963;52:497–512.
77 O’Brien RT, Pearson HA. Physiologic anemia of the newborn infant. J Pediatr. 1971;79:132–138.
78 Delavoria-Papadolpulos M, Roncevic N, Oski FA. Postnatal changes in oxygen transport of term, premature and sick infants: the role of red cell, 2,3-diphosphoglycerate and adult hemoglobin. Pediatr Res. 1971;5:235–245.
79 Ross MP, Christensen RD, Rothstein G, et al. A randomized trial to develop criteria for administering erythrocyte transfusions to anemic preterm infants 1 to 3 months of age. J Perinatol. 1989;9:246–253.
80 Zipursky A, Brown EJ, Watts J, et al. Oral vitamin E supplementation for the prevention of anemia in premature infants: a controlled trial. Pediatrics. 1987;79:61–68.
81 Shannon KM, Keith JF, III., Mentzer WC, et al. Recombinant human erythropoietin stimulates erythropoiesis and reduces erythrocyte transfusions in very low birth weight preterm infants see comments. Pediatrics. 1995;95:1–8.
82 Aher S, Malwatkar, Kadam S. Neonatal Anemia. Semin Fetal Neonatal Med. 2008;13:239–247.
83 Stoll BJ, Hansen NI, Bell EF, et al. Neonatal outcomes of extremely preterm infants from the NICHD Neonatal Research Network. Pediatrics. 2010;126:443–456.
84 Holzhauer S, Zieger B. Diagnosis and management of neonatal thrombocytopenia. Semin Fetal Neonatal Med. 2011;16:305–310.
85 Andrew M, Castle V, Saigal S, et al. Clinical impact of neonatal thrombocytopenia. J Pediatr. 1987;110:457–464.
86 Shapiro AD, Jacobson LJ, Armon ME, et al. Vitamin K deficiency in the newborn infant: prevalence and perinatal risk factors. J Pediatr. 1986;109:675–680.
87 Kenet G, Chan AKC, Soucie JM, et al. Bleeding disorders in neonates. Haemophilia. 2010;16:168–174.
88 Mountain KR, Hirsh J, Gallus AS. Neonatal coagulation defect due to anticonvulsant drug treatment in pregnancy. Lancet. 1970;1:265–268.
89 Luchtman-Jones L, Schwartz AL, Wilson DB. Polycythemia. In: Martin RJ, Fanaroff AA, Walsh MC, eds. Neonatal-perinatal medicine. 8th ed. St. Louis: Mosby; 2006:1309.
90 Swetnam SM, Yabek SM, Alverson DC. Hemodynamic consequences of neonatal polycythemia. J Pediatr. 1987;110:443–447.
91 Mimouni FB, Merlob P, Dollberg S, et al. Neonatal polycythaemia: critical review and a consensus statement of the Israeli neonatology association. Acta Paediatrica. 2011;100:1290–1296.
92 Nelson KB. Causative factors in cerebral palsy. Clin Obstet Gynecol. 2008;51:749–762.
93 Torfs CP, van den Berg B, Oechsli FW, et al. Prenatal and perinatal factors in the etiology of cerebral palsy. J Pediatr. 1990;116:615–619.
94 Lucas A, Morley R, Cole TJ. Randomised trial of early diet in preterm babies and later intelligence quotient. BMJ. 1998;317:1481–1487.
95 Anand KJ, Soriano SG. Anesthetic agents and the immature brain: are these toxic or therapeutic? Anesthesiology. 2004;101:527–530.
96 Olney JW, Young C, Wozniak DF, et al. Anesthesia-induced developmental neuroapoptosis. Does it happen in humans? Anesthesiology. 2004;101:273–275.
97 Goldstein GW, Robertson P, Betz AL. Update on the role of the blood-brain barrier in damage to immature brain. Pediatrics. 1988;81:732–734.
98 Levine RL, Fredericks WR, Rapoport SI. Entry of bilirubin into the brain due to opening of the blood-brain barrier. Pediatrics. 1982;69:255–259.
[/level-membership-for-anesthesiology-category][not-level-membership-for-anesthesiology-category]
2 Growth and Development
Normal and Abnormal Growth and Maturation
Growth is the quantitative development of the body and maturation is the acquisition of new functionalities; both phenomena occur during pregnancy and after birth. Prenatal growth is the most important phase in development, comprising organogenesis in the first 8 weeks (embryonic growth), followed by the functional development of organ systems and maturation of the fetus to full term (fetal growth). Rapid growth occurs particularly in the second trimester; a major increase in weight from subcutaneous tissue and muscle mass occurs in the third trimester. Environmental agents may affect the human embryo in a negative way. The duration of gestation and the weight of an infant have an important relationship (Table 2-1).
| Gestation (weeks) | Mean Weight (grams) |
|---|---|
| 28 | 1165 ± 109 |
| 32 | 1760 ± 128 |
| 36 | 2621 ± 274 |
| 40 (full term) | 3351 ± 448 |
Data from Naeye RL, Dixon JB. Distortions in fetal growth. Pediatr Res 1978;12:987-91.
Preterm infants are further classified according to their actual birth weight. A low–birth-weight (LBW) infant is one weighing less than 2500 g regardless of the duration of the pregnancy. A very low–birth-weight (VLBW) infant weighs less than 1500 g, and an extremely low–birth-weight infant weighs less than 1000 g. In addition, infants weighing less than 750 g are now being called “micropremies”; there is very little published information regarding the anesthetic management of this vulnerable subpopulation of neonates (see Chapter 35). Common neonatal problems as they relate to age and birth weight are presented in Table 2-2.
TABLE 2-2 Common Neonatal Problems with Respect to Weight and Gestation
| Gestation | Relative Weight | Neonatal Problems at Increased Incidence |
|---|---|---|
| Preterm (<37 weeks) | SGA | Respiratory distress syndrome |
| Apnea | ||
| Perinatal depression | ||
| Hypoglycemia | ||
| Polycythemia | ||
| Hypocalcemia | ||
| Hypomagnesemia | ||
| Hyperbilirubinemia | ||
| Viral infection | ||
| Thrombocytopenia | ||
| Congenital anomalies | ||
| Maternal drug addiction | ||
| Fetal alcohol syndrome | ||
| AGA | Respiratory distress syndrome | |
| Apnea | ||
| Hypoglycemia | ||
| Hypocalcemia | ||
| Hypomagnesemia | ||
| Hyperbilirubinemia | ||
| LGA | Respiratory distress syndrome | |
| Hypoglycemia: infant of a diabetic mother | ||
| Apnea | ||
| Hypocalcemia | ||
| Hypomagnesemia | ||
| Hyperbilirubinemia | ||
| Normal (37-42 weeks) | SGA | Congenital anomalies |
| Viral infection | ||
| Thrombocytopenia | ||
| Maternal drug addiction | ||
| Perinatal depression | ||
| Hypoglycemia | ||
| AGA | — | |
| LGA | Birth trauma | |
| Hyperbilirubinemia | ||
| Hypoglycemia: infant of a diabetic mother | ||
| Postmature (>42 weeks) | SGA | Meconium aspiration syndrome |
| Congenital anomalies | ||
| Viral infection | ||
| Thrombocytopenia | ||
| Maternal drug addiction | ||
| Perinatal depression | ||
| Aspiration pneumonia | ||
| Hypoglycemia | ||
| AGA | — | |
| LGA | Birth trauma | |
| Hyperbilirubinemia | ||
| Hypoglycemia: infant of a diabetic mother |
AGA, Appropriate for gestational age; LGA, large for gestational age; SGA, small for gestational age.
Gestational Age Assessment
The gestational age of an infant may be assessed in one of three ways. The most accurate means of assessing gestational age is by measuring the crown-rump length of the fetus during a first-trimester ultrasonographic examination. Another method involves calculating gestational age from the first day of the mother’s last menstrual period, but this is commonly inaccurate, leading to errors in estimation. Finally, the Dubowitz scoring system is a well-accepted method combining neurologic and physical criteria of the infant to provide an accurate assessment of gestational age.1,2 A summary of the more significant neurologic and physical signs of maturity is presented in Table 2-3.
TABLE 2-3 Neurologic and External Physical Criteria to Assess Gestational Age
| Physical Examination | Preterm (<37 weeks) | Term (≥37 weeks) |
|---|---|---|
| Ear | Shapeless, pliable | Firm, well formed |
| Skin | Edematous, thin skin | Thick skin |
| Sole of foot | Creases on anterior third | Whole foot creased |
| Breast tissue | Less than 1 mm diameter | More than 5 mm diameter |
| Genitalia | ||
| Male | Scrotum poorly developed Testes undescended |
Scrotum rugated Testes descended |
| Female | Large clitoris, gaping labia majora | Labia majora developed |
| Limbs | Hypotonic | Tonic (flexed) |
| Grasp reflex | Weak grasp | Can be lifted by reflex grasp |
| Moro reflex | Complete but exhaustible (>32 weeks) | Complete |
| Sucking reflex | Weak | Strong, synchronous with swallowing |
Weight and Length
Assessment of growth is measured by changes in weight, length, and head circumference. Percentile charts are valuable for monitoring the child’s growth and development. Deviation from growth within the same percentile for a child of any age is of greater significance than any single measurement (Figs. 2-1 and 2-2). Weight is a more sensitive index of well-being, illness, or poor nutrition than length or head circumference and is the most commonly used measurement of growth. Change in weight reflects changes in muscle mass, adipose tissue, skeleton, and body water and thus is a nonspecific measure of growth. Measurement of length provides the best indicator of skeletal growth because it is not affected by changes in adipose tissue or water content.
Term infants may lose 5% to 10% of their body weight during the first 24 to 72 hours of life from loss of body water. Birth weight is usually regained in 7 to 10 days. A daily increase of 30 g (210 g/week) is satisfactory for the first 3 months. Thereafter, weight gain slows so that at 10 to 12 months of age it is 70 g each week (Table 2-4).
| Age (years) | Weight (kg) |
|---|---|
| 1 | 10 |
| 3 | 15 |
| 5 | 19 |
| 7 | 23 |
Weight and length are important but changes affect the composition of the body itself, especially total body water, which decreases at the expense of the extracellular compartment, with adult levels attained at 1 year of age.3,4 This finding has implications for drug dosing and distribution in the infant. Males have a greater percentage of water, whereas females have a slightly greater percentage of fat. The percentage decrease in extracellular water is greater than the decrease in total body water because of the simultaneous increase in intracellular water (Table 2-5).5
Another, more precise way to assess development is to calculate the body surface area (BSA).6
BSA can also be described using an allometric equation with an exponent of (see Chapter 6):
Head Circumference
The anterior fontanel should be palpated to assess whether it is sunken (dehydration) or bulging abnormally (suggesting increased intracranial pressure as in hydrocephalus, infection, hemorrhage, or increased partial pressure of carbon dioxide in the arterial blood [PaCO2]). If it is bulging, the sutures should be palpated for abnormal separation as a result of increased intracranial pressure. The anterior fontanel closes between 9 and 18 months of age; the posterior fontanel closes by 2 to 4 months of age (Fig. 2-3). Cranial molding occurs particularly in LBW infants and is usually of no clinical importance.
Teeth
The first tooth, usually a lower incisor, erupts at approximately 6 months after birth (deciduous dentition). Eruption of all deciduous teeth is usually complete by 28 months of age. Permanent teeth appear at 6 years, with the shedding of the deciduous teeth; this process takes place during the next 6 to 8 years. Abnormally developed teeth occur with hereditary disorders, Down syndrome, cerebral palsy, medications (eg., tetracycline) and nutritional defects. Preterm infants may show severe enamel hypoplasia in their primary dentition.7,8
Airway and Respiratory System
Upper Airway Development
The larynx is developed embryologically from ectodermal, endodermal, and mesodermal tissues that are derived from the third, fourth, and sixth branchial arch and pouch apparatus. The development of the larynx and airway in the neonate is outlined in detail in Chapter 12. The laryngeal opening (epiglottis and vocal cords) in a neonate and 2-year-old boy are shown in Figure 2-4. Note the omega-shaped long epiglottis and the pearly white vocal cords in the neonate.
The depth of the nasopharynx increases due to remodeling of the palate as well as changes in the angulation of the skull base. During childhood, the soft tissues of the pharyngeal structures surrounding the upper airway grow proportionally to the skeletal structures. After birth, the dimensions of the nasal cavity increase very rapidly. During the first year of life, the total minimal cross-sectional area is increased by 67%, and the volume of the anterior 4 cm of the nasal airways by 36%.9
Compared with the adult, the tongue in the neonate contains considerably less fat and soft tissue, but overall is large in size relative to the dimensions of the mouth, with relatively larger extrinsic musculature and a less developed superior longitudinal muscle resulting in a flat dorsal surface with poor lateral mobility (see also Chapter 12).
Respiratory System Development
Airways: The bronchial tree down to and including the terminal bronchioles forms by week 16 of gestation. The acinus, consisting of all the airway structures distal to the terminal bronchiole and the entire gas-exchanging apparatus, develops throughout the remainder of gestation.
Alveoli: Alveoli develop mainly after birth, increasing in number until approximately 8 years of life and in size until growth of the chest wall ceases.
Pulmonary vessels: Arteries and veins accompanying the bronchial tree form by week 16 of gestation. Those vessels lying within the acinus follow the development of the alveoli. The appearance and growth of arterial smooth muscle lags behind the sprouting of new vessels and is not completed until late adolescence.
Transition to Air Breathing
Fetal breathing movements have been detected as early as 11 weeks of gestational age; they are interspersed with long periods of apnea and produce little tidal movement of lung fluid.10,11 The critical event in the change from placental to pulmonary gas exchange is the first inspiration, which initiates pulmonary ventilation, promotes the clearance of lung fluid, and triggers the change from the fetal to the neonatal pattern of circulation.
The first breath is a gasp that generates a transpulmonary distending pressure of 40 to 80 cm H2O.12 This moves the tracheal fluid (100 times more viscous than air), overcomes surface forces that develop as the air−fluid interface reaches the small airways, and overcomes tissue resistance. In some children, the removal of lung fluid may be delayed, producing the syndrome called transient tachypnea of the newborn.13 Tachypnea lasts for 24 to 72 hours and is associated with a characteristic chest radiographic appearance consisting of increased perihilar markings, fluid in the interlobar fissures, and streaky linear opacities in the parenchyma.
In the first few minutes of life, a state of “normal” asphyxia exists as a result of impairment of placental blood flow during labor. The partial pressure of oxygen in arterial blood (PaO2) and pH are low, whereas the PaCO2 is increased immediately after birth, but these parameters change rapidly in the first hour of life. Extrapulmonary shunting through fetal channels and intrapulmonary shunting, probably through unexpanded regions of the lung, persist for some time after birth, so that in neonates the physiologic right-to-left shunt is about three times that in adults.14
Mechanics of Breathing
Chest Wall and Respiratory Muscles
The accessory muscles of inspiration are relatively ineffective in infants because of an unfavorable anatomic rib configuration. In infancy, the ribs extend horizontally from the vertebral column, moving little with inspiration.15 These factors increase the workload on the diaphragm. Consequently, and in contrast to an adult, thoracic cross-sectional area is fairly constant throughout the breathing cycle, and inspiration occurs almost entirely as a result of diaphragmatic descent.
The chest wall of a neonate is floppy because it comprises noncalcified cartilage, its musculature is poorly developed, and the ribs are incompletely calcified.16,17 As the work of breathing increases, diaphragmatic displacement must also increase to maintain the tidal volume. The increased workload may lead to diaphragmatic fatigue and respiratory failure or apnea, especially in preterm infants.18,19
The tendency to respiratory muscle fatigue is the result of the metabolic characteristics of the diaphragm, which has very little type I (slow twitch, high oxidative capacity) muscle fibers (see Fig. 12-11).
Elastic Properties of the Lung
Changes in the static pressure−volume relationship of the lungs during growth are caused by increases in volume and changes in the elastic properties of lung tissue. Volume is the principal factor that determines lung compliance, which increases throughout childhood. Specific lung compliance remains relatively constant throughout childhood.20 In contrast, specific compliance of the chest wall declines throughout childhood and adolescence, reflecting the progressive calcification of the ribs and the increasing bulk of the thoracic muscles.
Static Lung Volumes
Detailed information expressing static lung volumes on the basis of body weight are detailed in Table 2-6.
Total Lung Capacity
Adults have a markedly greater total lung capacity (TLC) than infants (Fig. 2-5). This difference reflects the fact that TLC is an effort-dependent parameter, depending on the strength and efficiency of the inspiratory muscles, which can be estimated by the maximum inspiratory pressure at functional residual capacity (FRC). An adult can generate negative pressures in excess of 100 cm H2O; negative inspiratory pressures as high as 70 cm H2O have been recorded for neonates, a surprisingly high value in view of their underdeveloped musculature and highly compliant chest wall. This may be a consequence of the small radius of curvature of an infant’s rib cage, which by the Laplace relationship converts a small tension into a large pressure difference.21
Functional Residual Capacity
FRC is similar on a per-kilogram basis at all ages, but the mechanical factors on which it is based are different in infants and adults.22 In adults, FRC is the same as the volume at which the elastic forces generated by the passive recoil of the chest wall are balanced by the recoil of the lung (Fig. 2-6); this is the volume attained at end-expiration with an open glottis.
