Chapter 77 Genetics of Common Disorders
77.1 Major Genetic Approaches to the Study of Common Pediatric Disorders
John W. Belmont and Brendan Lee
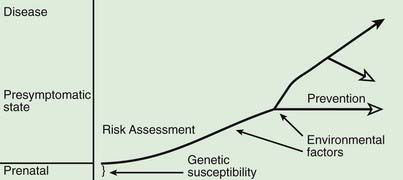
A model for the genetic contribution to health is shown in Figure 77-1. Genetic variation that can have an impact on disease susceptibility is present in every person. Sometimes single gene mutations cause a condition such as cystic fibrosis or sickle cell anemia. But other genetic variations can contribute much less strongly to the emergence of specific medical conditions, and the effect can depend upon exposure to certain environmental factors. One goal in medical genetics is to identify genes that contribute to disease in the hope of preventing the occurrence of disease, either by avoiding inciting environmental factors or by instituting interventions that reduce risk. For persons who cross the threshold of disease, the goal is to better understand the pathogenesis in the hope that this will suggest better approaches to treatment. Common genetic variation can also influence response to medications and the risk of toxicities of various medications and environmental toxins.
Complex traits may be inherently difficult to study if there are problems with the precision of clinical diagnosis. This is particularly true of neurobehavioral traits. A starting point in the genetic analysis of a complex trait is to obtain evidence in support of a genetic contribution and to estimate the relative strength of genetic and environmental factors. Complex traits typically exhibit familial clustering but are not transmitted in a regular pattern like autosomal dominant or recessive inheritance. Complex traits often show variation among different ethnic or racial groups, possibly reflecting the differences in gene variants among these groups.
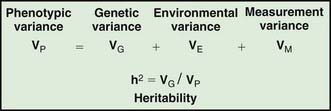
Assessing the potential genetic contribution begins by determining whether the trait is seen among related individuals more often than in the general population. A common measure of familiality is the first-degree relative risk (usually designated by the symbol λs), which is equal to the ratio of the prevalence rate in siblings and/or parents to the prevalence rate in the general population. For example, the λs for type 1 diabetes is about 15. Collection of family data also allows the analysis of possible inheritance models using a method called segregation analysis. The relative strength of genetic and nongenetic risk factors can be estimated by variance components analysis, and the heritability of a trait is the estimate of the fraction of the total variance contributed by genetic factors (Fig. 77-2).
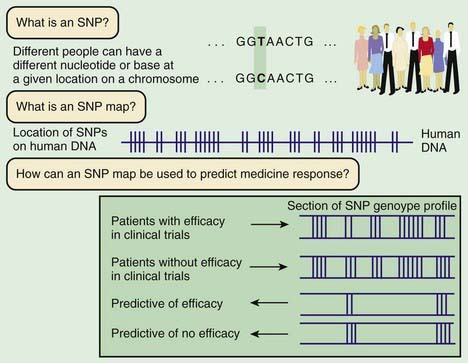
Linkage mapping and association studies require markers along the DNA that can be ascertained, or genotyped, with large-scale, high-throughput laboratory techniques. Markers that are typically used are in the form of microsatellites and single-nucleotide polymorphisms (SNPs; Fig. 77-3). Although humans all have the same genetic material, every person’s genome is slightly different. A sample of the same region of genome from about 50 people will reveal that about one in every 200 bases varies from the more common form. Although most SNPs lack any obvious function, a few alter the amino acid sequence of the protein or affect regulation of gene expression. Some of these functional alterations directly affect susceptibility to disease. A complex clinical phenotype can be defined by the presence or absence of a disease as a dichotomous trait, or by selection of a clinically meaningful variable such as body mass index in obesity, which is a continuous or quantitative trait.
Bracken MB, Belanger K, Cookson WO, et al. Genetic and perinatal risk factors for asthma onset and severity: a review and theoretical analysis. Epidemiol Rev. 2002;24:176-189.
Carroll W. Asthma genetics: pitfalls and triumphs. Paediatr Respir Rev. 2005;6:68-74.
Hirschhorn JN. Genetic epidemiology of type 1 diabetes. Pediatr Diabetes. 2003;4:87-100.
International HapMap Consortium. A haplotype map of the human genome. Nature. 2005;437:1299-1320.
Lyon HN, Hirschhorn JN. Genetics of common forms of obesity: a brief overview. Am J Clin Nutr. 2005;82:215S-217S.
Onengut-Gumuscu S, Concannon P. The genetics of type 1 diabetes: lessons learned and future challenges. J Autoimmun. 2005;25:S34-S39.
Weiss ST, Raby BA. Asthma genetics 2003. Hum Mol Genet. 2004;13(Spec No 1):R83-R89.


