[level-membership-for-critical-care-medicine-category]
CHAPTER 1 General concepts in caring for the critically ill
Acid-base imbalances
Pathophysiology of acid-base regulation
• Acidosis: Extra acids are present or base is lost, with a pH less than 7.35.
• Buffering of acid or compensation for an acid state, occurs in three primary ways:
• Alkalosis: Extra base is present or there is loss of acid, with a pH greater than 7.45.
• Alkalosis: Compensating for an alkaline state occurs in two ways:
Example of compensation (ph regulation):
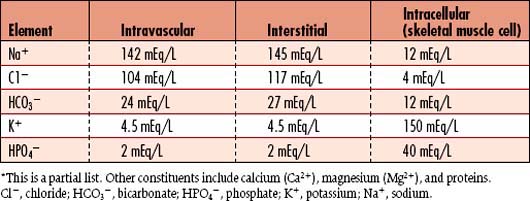
It is essential to understand that unless the patient has ingested acid (aspirin, ethanol, etc.), all acid in the bloodstream was produced at the cellular level (Table 1-1). When evaluating patients, care providers must have a basic understanding of the acid-base balancing system. The main formula for maintenance of acid-base balance is the following:
| Acid Pathways | Cause | Measure |
| Cells produce acid (acid production increases). | Hypermetabolic states, such as pain, hyperthermia, or inflammation. The respiratory and heart rates increase, and bicarbonate is initially consumed by buffering. | HCO3 ↓ |
| Tissues are hypoxic; anaerobic metabolism ensues resulting in lactic acidosis. | Lactate level ↑ | |
| Absolute insulin deficiency results in failure of glucose to be transported into cells. | Blood glucose level ↑ Ketoacids ↑ |
|
| Cells regulate acids. | When acid production (H+) increases, pH decreases, bicarbonate is initially consumed by buffering, and CO2 is exhaled in larger amounts, and H+ exchanges for K+ as cells buffer acid. | pH ↓ HCO3 ↓ K+ ↑ Total serum CO2 ↓ |
| Lungs regulate acid. | When acid increases due to hypermetabolic states such as pain, hyperthermia, or inflammation, carbonic acid (H2CO3) increases and rapidly converts to CO2 and H2O. The respiratory rate increases to blow off CO2. | Paco2 ↓ |
| Kidneys regulate acid. | When acid increases, tubules are affected by low blood pH, and work to neutralize increased carbonic acid (H2CO3) by separating it into H+ and bicarbonate HCO3. Kidneys excrete what is necessary to sustain normal pH if renal function is normal. If abnormal, kidneys may not perform this task. | HCO3 ↑ Kidney function is assessed by serum BUN and creatinine; elevated BUN and creatinine indicate abnormal kidney function. |

Understanding the arterial blood gas
Abg values
| Normal Arterial Values | Normal Venous Values |
|---|---|
| pH: 7.35–7.45 | pH: 7.32–7.38 |
| PaCO2: 35–45 mm Hg | PvCO2: 42–50 mm Hg |
| PaO2: 80–100 mm Hg | PvO2: 40 mm Hg |
| SaO2: 95%–100% | SvO2: 60%–80% |
| Base excess (BE): −2 to +2 | BE: −2 to +2 (only calculated on ABG analyzer) |
| HCO3−: 22–26 mEq/L | total Serum CO2−: 23–27 mEq/L |
• Hypoxemia (PaO2 less than 80 mm Hg): Low partial pressure of O2 affects the cellular levels of oxygen available and may result in cellular metabolic dysfunction reflected by lactic acid production and metabolic acidosis.
• Fio2: Fraction of inspired O2 or the percentage of the atmospheric pressure which is oxygenated. Room air is 21% or 0.21 O2. O2 delivery devices can increase the FIO2 to 100% or 1.00.
• Pulse oximetry (SpO2): This can be used to noninvasively trend the arterial O2 saturation and determine ventilation status using a probe fastened to the patient’s finger, earlobe, or forehead. This monitoring technique is frequently used in critical care areas for patients at high risk of ventilation problems, in operating rooms, and in emergency departments. SpO2 should be correlated with SaO2 (or oxyhemoglobin) via blood gas analysis when pulse oximetry is initiated, to assess accuracy of SpO2 readings. Pulse oximetry is a close correlate to SaO2 under normal physiologic conditions, but if perfusion decreases, the pulse needed for accurate measurement by the SpO2 probe is decreased, prompting inaccurate readings. Anemic patients should have consistently high readings, so what is usually considered a normal SpO2 reading may be too low in an anemic patient. The measure of true oxyhemoglobin (Hgb saturated with O2) requires an ABG analysis. Many centers do not perform a correlation analysis when oximetry is initiated.
• All buffers: Absorb acids (H+), but do so with a varying affinity. Buffers are present in all body fluids and cells and act within 1 second after acid accumulation begins. They combine with excess acid to form substances that may not greatly affect pH. Some buffers have a strong affinity to acid; others are weak. The three primary plasma buffers are bicarbonate (HCO3−), intracellular proteins, and chloride (Cl−). All are negatively charged to facilitate attraction to positively charged hydrogen ions (H+). Combining positively charged with negatively charged ions yields a neutral substance.
• Proteins: Serum and intracellular proteins offer a significant contribution to buffering acids. Hgb not only transports O2 but also provides a very strong buffer for hydrogen ions (H+). Albumin is also a significant buffer, and hypoalbuminemia must be considered when performing anion gap calculations.
• HCO3− (perfect 24, normal range 22 to 26 mEq/L): Serum bicarbonate (HCO3−) is one of the major components of acid-base regulation by the kidney. Bicarbonate is generated and/or excreted by normally functioning kidneys in direct proportion to the amount of circulating acid to maintain acid-base balance. Because bicarbonate is affected by both the respiratory and metabolic components of the acid-base system, the relationship between metabolic acidosis and bicarbonate is not particularly linear or predictable. When the bicarbonate level changes, the acid level changes in the opposite direction. To determine the cause of bicarbonate changes (as the source of a pH problem versus compensation), the relationship to pH must be evaluated. The pH changes in the presence or absence of acid, and the directional relationship reflects what caused the pH alteration. The kidney is responsible for the regeneration of bicarbonate ions, as well as excretion of the hydrogen ions. Although serum bicarbonate is a buffer, it is usually reported in the standard electrolyte panel from a venous blood sample as “CO2 content” or “total CO2” rather than as bicarbonate (HCO3−). The serum HCO3− concentration is usually calculated and reported separately with ABG analysis. Either value may be used as part of the assessment of acid-base balance (Table 1-2).
• Chloride (Cl−): The number of positive and negative ions in the plasma must balance at all times. Aside from the plasma proteins, bicarbonate and chloride are the two most abundant negative ions (anions) in the plasma. To maintain electrical neutrality, any change in chloride must be accompanied by the opposite change in bicarbonate concentration. If chloride increases, bicarbonate decreases (hyperchloremic acidosis) and vice versa. However the combination of H+ and chloride actually exerts an acid effect (HCl). Chloride concentration may influence acid-base balance (see anion gap). Chloride concentration should be observed closely when large amounts of normal saline are administered to patients.
• Other buffers: Other buffers, including phosphate and ammonium, are present in very limited quantities and have a lesser impact on the regulation of acid.
• Cellular electrolytes: The cells also offer protection in the metabolic acid environment. H+ may exchange across the cell wall, attracted by negatively charged intracellular proteins in a cellular buffering process. When this happens, K+ is released from the proteins and shifts out of the cell, causing an excess of K+ in the blood.
• Anion gap: Anion gap is an estimate of the differences between measured and unmeasured cations (positively charged particles, such as Na and H+ respectively) and measured and unmeasured anions (negatively charged particles such as HCO3− and Cl−. Normally, cations and anions are equally balanced in live humans (in vivo), but when measured in the laboratory (in vitro), the difference may be between 10 to 12 mmol/L. This difference is termed a normal gap (between + and – ions). Particles that possess charges tend to have high affinity to bind to other particles that possess charges that are opposite their own (hence the term, “opposites attract”). Anion gap is used to determine if a metabolic acidosis is due to an accumulation of nonvolatile acids such as lactic acid or ketoacids. Both contribute a positive charge due to excess H+ or from net loss of bicarbonate (e.g., diarrhea). The gap is not affected when a patient has metabolic acidosis purely from kidney failure. The formula for calculation of anion gap is
Table 1-2 DIAGNOSTIC TESTS FOR ACID-BASE BALANCE
| Role of the ABG | Measures | Normals |
| Evaluation of arterial oxygen (dissolved oxygen and oxygen bound to hemoglobin) | Arterial oxygen saturation (oxygen bound to hemoglobin) |
Sao2: 0.95–1.0 or 95%–100% |
| Partial pressure of arterial oxygen (dissolved oxygen) | Pao2: 80–100 mm Hg (decreased over the age of 70) | |
| Calculation of alveolar-arterial (A-a) oxygen gradient | Alveolar-arterial gradient | A-a Do2: <20 mm Hg |
| Pao2/Fio2 ratio | PF ratio: .300 | |
| Evaluation of cellular environment | pH (reflects H2CO3) i.e., ↑↑ H2CO3 then pH ↓↓ |
pH Perfect: 7.40 Normal range: 7.35–7.45 |
| Evaluation of ventilation | Paco2 | Paco2 Normal range: 35–45 mm Hg |
| Evaluation of tissue metabolism | H+ inversely (indirectly) reflected by buffers: Bicarbonate (HCO3−) Base measures (+ or −) Total CO2 i.e., ↑↑ H+ then buffers ↓↓ |
pH Perfect: 7.40 Normal range: 7.35–7.45 |
| HCO3−: 22–26 mEq/L | ||
| Total CO2: 20–26 | ||
| Base Normal range: −2 to +2 |
||
| Anion gap: 12 + or −2 | ||
| Additional measures of tissue metabolism | Both contribute H+ to blood lactic acid Ketoacids |
Lactic acid: 1–2 mmol/L |
| Ketoacids Blood: 0.27–0.5 mmol/L Urine levels Small: <20 mg/dl Moderate: 30–40 mg/dl Large: >80 mg/dl |
||
| Evaluation of renal clearance | Appropriate clearance of excessive components: H+ or HCO3− Appropriate clearance of excessive components: BUN and creatinine |
pH Perfect: 7.40 Range: 7.35–7.45 BUN: 0–20 mg/dl Creatinine: <2.0 mEq/L |
Step-by-step guide to abg analysis
A systematic analysis is critical to the accurate interpretation of ABG values to determine the origin of acid-base imbalance, and level of compensation (see Table 1-2).
Step 1: check the ph: determine if ph is perfect (7.40)
• Acidosis: Extra acids are present or base is lost, with a pH less than 7.35
Ph greater than 7.45, alkalosis:
• Alkalosis: Extra base is present or there is loss of acid, with a pH greater than 7.45.
Respiratory acidosis
Pathophysiology
Step 1: ph is 7.28, not perfect or neutral (7.40) and outside the normal range of 7.35 to 7.45.
1. pH 7.28: Acid side, outside of range of normal
2. Question: Is there a problem? YES, acidosis (identified by the pH)
3. Where is the acid being generated? Are the acids respiratory or metabolic?
4. PaCO2: 55 (elevated outside the normal range) → respiratory acid is accumulating
5. HCO3−: 24 (perfect) → metabolic acid is not present, perfect HCO3
Step 2: paCO2 is 55 mm hg, not perfect (40 mm hg) and above the normal range of 35 to 45 mm hg indicating an excess of respiratory acid.
1. Hypercapnia/elevated Paco2 (Paco2 greater than 45 mm Hg): Signals alveolar hypoventilation. This problem occurs when alveoli are not recruited, there is poor blood flow, the respiratory rate or tidal volume is inadequate, or there is fluid or an increase in the space between alveoli and blood vessel. These conditions may be chronic or acute.
2. If this is the causative problem, the pH has to be below 7.40, reflecting excess acid (CO2) or an increase in carbonic acid (H2CO3), which is a primary acidosis. So now one must investigate what caused the increase in carbonic acid (H2CO3). For every 10 mm Hg increase in CO2, the pH will acutely decrease 0.08 (on the acid side).
Step 3: the hco3− in the example is perfect at 24 meq/l. the normal range of bicarbonate is 22 to 26 meq/l.
Is there compensation for the respiratory acidosis?
1. Only the CO2 is elevated, without a change in the HCO3−.
2. pH is down and outside range reflecting the presence of acid in the blood.
3. Problem: The patient has acute respiratory failure, causing an accumulation of respiratory acid (CO2). There is no compensation, but no evidence is available at this time.
Step 5: paO2 92 mm hg (not perfect 98 to 100 mm hg but within normal range 80 to 100 mm hg), saO2 91% (not perfect 100% and below normal range of 95% to 100%).
Investigation begins: slight decrease is apparent in paO2 and saO2
1. Use of O2: If O2 is not in use on a patient with reduced PaO2 and SaO2, applying O2 often corrects the readings. If O2 is in use, changing to a device that delivers a higher concentration of O2, such as changing from a nasal cannula to a face mask, may be sufficient to correct the alveolar levels of O2. If the PaO2 and SaO2 do not respond to the first device change or values further deteriorate, a 100% nonrebreather mask may be applied to provide close to 100% O2. Note: All ABG readings must be recorded with consideration of the mode of O2 delivery recorded, as well as the FIO2 or concentration of O2. Otherwise, evaluation of the PaO2 and SaO2 values is meaningless. If the values are NOT recorded, the assumption is made the readings are done on room air, without O2 in place.
2. Evaluating risk for poor tissue oxygenation: Thus far, ventilation has been evaluated using the ABG, but both ventilation AND perfusion must be evaluated as part of O2 delivery to the cell level. To objectively and proactively identify the patient at risk for tissue hypoxia, early signs of the perfusion changes that precede increases in serum lactate and the widening anion gap associated with lactic acidosis may be noted. Changes in heart rate (HR), blood pressure (BP), respiratory rate, urine output, saturation of continuous central or mixed venous Hgb, and serum creatinine are common. In the shock setting, normal or near normal PaO2 and SaO2 readings are possible on an ABG while capillary bed dysfunction ensues. Normal readings indicate O2 is being provided in adequate amounts to saturate Hgb effectively; but the ABG is unable to assess whether all tissue beds are receiving O2 or whether the cells are able to use the O2. Until metabolic acidosis ensues due to accumulation of lactic acid byproducts of anaerobic metabolism due to hypoperfusion, the ABG and SpO2 readings may be misleading.
Collaborative management: acute respiratory acidosis
Care priorities
1. Restore effective alveolar ventilation.
• Symmetrical lung expansion: Always check for symmetrical lung expansion, particularly if the patient was recently admitted for trauma, has recently had central line placement, or been recently intubated or extubated. A pneumothorax may be present, which may cause ineffective ventilation.
• Support ventilation: If PaCO2 is greater than 50 to 60 mm Hg, there may be a need to intubate and place the patient on mechanical ventilation, or if already ventilated, there may be a need to reevaluate the ventilation settings. The primary mechanism to treat respiratory acidosis is to increase the tidal volume (VT) and/or the respiratory rate (F), to increase minute ventilation (VT × F). Care must be taken to ensure the adequate minute ventilation; therefore, if low tidal volumes are applied, the respiratory rate may need to be increased. If the lung compliance allows, the flow rate (how rapidly the volume is delivered) may also be increased. This will prolong exhalation time and allow adequate time for CO2 excretion.
• Bronchodilation: Consider the use of inhaled beta-agonists to maintain open airways.
• Although a life-threatening pH must be corrected to an acceptable level promptly, a normal pH is not the immediate goal. Generally, the use of bicarbonate is avoided because of the risk of alkalosis when the respiratory disturbance has been corrected and the secondary effect of blocking the signal to the hemoglobin to release the oxygen (shift to the left). Note: If lactic acidosis is present, the patient has metabolic acidosis, which has resulted from ineffective tissue oxygenation. Supporting ventilation will not resolve lactic acidosis. And bicarbonate may temporarily neutralize the pH, but may actually worsen tissue hypoxia.
3. Evaluate compensation (occurs in the presence of normal renal function).
• Although the kidneys’ response to an abnormal pH level is slow (4 to 48 hours), they are able to facilitate a nearly normal pH level by excreting or retaining large quantities of HCO3− or H+ from the body. Remember that the level of available HCO3− is always opposite the level of H+ present in the plasma. HCO3 is partnered as it buffers H+, which yields carbonic acid.
Compensatory response for acute respiratory acidosis
When the respiratory acid level (CO2) increases, carbonic acid increases and the pH decreases. The increased H2CO3 (carbonic acid) is presented to the kidney, where the H+ is separated from the bond, yielding HCO3−. The “free” bicarbonate (HCO3−) provides additional buffer. In addition, the kidneys excrete the “free” H+ (hydrogen ions) in the urine to reduce the acid level. When the kidneys are functional, the pH decrease seen from increased respiratory acid is less dramatic. The decrease in pH is modified to a small degree by intracellular buffering. To compensate for the acidosis created by increased CO2, K+ ions are released from cellular proteins and H+ ions take their place, bound to the proteins. The result is frequently serum hyperkalemia (reflective of intracellular hypokalemia). This is much more common and dangerous in the presence of metabolic acidosis (particularly diabetic ketoacidosis [DKA]).

pH 7.35: Acid side but in range of normal
PaCO2 55 mm Hg: Acid and outside of range of normal
Problem: Respiratory acidosis, but pH is in range of normal
HCO3− 32 mEq/L: The kidneys took the H2CO3, separated it into HCO3− and H+; then, excreted the H+ and retained the end product, the bicarbonate (made from the CO2).
Chronic respiratory acidosis
Physical assessment
Patients have decreased depth of respirations with an initially increased rate or decreased rate and depth of respirations in severe respiratory acidosis. With obstructive lung disease or acute asthma exacerbation, audible wheezing may be present. With severe asthma, the chest can become silent, indicative gas exchange is extremely impaired, and the patient is close to respiratory arrest.
Monitoring parameters
CARE PLAN: RESPIRATORY ACIDOSIS
related to alveolar-capillary membrane changes secondary to pulmonary tissue destruction
1. Monitor serial ABG results to assess patient’s response to therapy. Consult physician for significant findings: increasing PaCO2 with decreasing pH, PaO2, and SaO2 values.
2. Monitor O2 saturation via pulse oximetry (SpO2). Compare SpO2 with SaO2 values to assess reliability. Watch SpO2 closely, especially when changing FIO2 or to evaluate patient’s response to treatment (e.g., repositioning, chest physiotherapy).
3. Assess and document patient’s respiratory status: respiratory rate and rhythm, exertional effort, and breath sounds. Compare pretreatment findings with posttreatment findings (e.g., O2 therapy, physiotherapy, medications) for evidence of improvement.
4. Assess and document patient’s level of consciousness (LOC). If PaCO2 increases, be alert to subtle, progressive changes in mental status. A common progression is agitation → insomnia → somnolence → coma. To avoid a comatose state caused by rising CO2 levels, always evaluate the arousability of a patient with elevated PaCO2 who appears to be sleeping. Consult physician if the patient is difficult to arouse.
1. Ensure appropriate delivery of prescribed O2 therapy. Assess the patient’s respiratory status after every change in FIO2. Patients with chronic CO2 retention may be very sensitive to increases in FIO2, resulting in depressed ventilatory drive. If the patient requires mechanical ventilation, be aware of the importance of maintaining the compensated acid-base status. If the PaCO2 is rapidly decreased by excessive mechanical ventilation (dropping PaCO2, but a remaining excess of bicarbonate), a severe metabolic alkalosis (posthypercapnic metabolic alkalosis) could develop. The sudden onset of metabolic alkalosis may lead to hypocalcemia or hypokalemia, which can result in tetany (see Hypocalcemia, 57). Severe alkalosis also can precipitate cardiac dysrhythmias.
1. Assess for presence of bowel sounds, and monitor for gastrointestinal (GI) distention, which can impede movement of the diaphragm and further restrict ventilatory effort.
2. Assess for presence of symmetric lung expansion and normal resonance of lung fields. Hyperresonance and asymmetry indicate pneumothorax; dullness and asymmetry indicate solid tissue or fluid occupation of lung or pleural space (e.g., hemothorax, pleural effusion, hyperplasia).
3. In patients who have obstructive lung disease and are not intubated, encourage use of pursed-lip breathing (inhalation through nose, with slow exhalation through pursed lips), which helps airways to remain open and allows for better air excursion. Optimally, this technique will diminish air entrapment in the lungs and make respiratory effort more efficient.
![]() Cough Enhancement, Acid-Base Management, Respiratory Acidosis, Mechanical Ventilation, Artificial Airway Management, Oral Health Maintenance
Cough Enhancement, Acid-Base Management, Respiratory Acidosis, Mechanical Ventilation, Artificial Airway Management, Oral Health Maintenance
Additional nursing diagnoses and interventions:
Nursing diagnoses and interventions are specific to the pathophysiologic process. See Acute Pneumonia, (p. 373), Acute Lung Injury and Acute Respiratory Distress Syndrome, (p. 365) and Acute Respiratory Failure, (p. 383), along with Mechanical Ventilation, (p. 99).
Respiratory alkalosis
Pathophysiology
The problem is alveolar hyperventilation, which results in an increased pH

Acute respiratory alkalosis
Compensatory response to respiratory alkalosis:
• Acute respiratory alkalosis: First 4 to 48 hours HCO3− (and therefore the increase in H+) will decrease 2 mEq/L for every 10 mm Hg decrease in PCO2.
• Chronic respiratory alkalosis: After about 48 hours, the amount of bicarbonate should decrease 4 mEq/L of HCO3 for every 10 mm Hg decrease in PCO2.
 HCO3− + H+
Chronic respiratory alkalosis
![]()
• Sodium and potassium: May be decreased slightly to profoundly (potassium will shift from the extra cellular space to the intracellular space in exchange for H+).
• Serum calcium: May be decreased because of increased calcium and bicarbonate binding. Signs of hypocalcemia include muscle cramps, hyperactive reflexes, carpal spasm, tetany, and convulsions.
• Serum phosphorus: May decrease (less than 2.5 mg/dl), especially with salicylate intoxication and sepsis, because the alkalosis causes increased uptake of phosphorus by the cells. No symptoms occur, and treatment usually is not required unless a preexisting phosphorus deficit is present.
Monitoring parameters
Cardiac dysrhythmias are present.
CARE PLAN: RESPIRATORY ALKALOSIS
Related to anxiety, tissue hypoxia, or work of breathing
Metabolic acidosis
Pathophysiology
Step 1: the ph is not perfect.
• Increased acid production: Excessive lactate and ketones cause acidosis and contribute more unmeasured positives (H+) into circulation. When an increase in H+ occurs, HCO3− goes down as the role of bicarbonate is to buffer H+. The conjugation of H+ and HCO3− yields an increase in carbonic acid. As carbonic acid (H2CO3) goes up, the pH goes down.
• Decreased renal tubular function (acute tubular necrosis [ATN] or chronic failure): If the kidney is unable to excrete H+, or if the load is beyond tubular transport capabilities, an increase in H+ occurs. HCO3− decreases as the role of bicarbonate is to buffer H+ and the kidney has lost the capability to regulate and create appropriate bicarbonate. The conjugation of H+ and available HCO3− yields an increase in carbonic acid. As carbonic acid (H2CO3) increases (goes up), the pH decreases (goes down).
• Ingestion of exogenous acids: Certain medications can cause an increase in circulating acids. Alcohols and other ingested acids can facilitate a wide anion gap.
Step 3: the hco3− is 16, which is less than perfect and below the normal range.
Step 6 : performed only in metabolic acidosis: evaluate glucose, ketones, lactate and tissue oxygenation (if necessary).
One must investigate why H+ is increased and bicarbonate is down.
• Is it a compensatory response? If so the H2CO3↓ (H+↑) and the patient would have a pH on the alkaline side, indicating compensatory response for respiratory alkalosis.
• Is it a kidney problem? In this case, BUN and/or Creatinine would be elevated.
• Is it a high chloride (inadequate buffer) problem? If so, the chloride would have to be high.
• Did the patient ingest acids?
• Is it a tissue metabolism issue? In this case, the patient will have high ketones and/or lactic acidosis.
Evaluation of glucose and ketones may be reviewed (Diabetic Ketoacidosis [DKA], p. 713).
Evaluation of tissue perfusion and oxygenation requires more testing.
1. Lactic acidosis may be caused by an oxygenation-related, metabolic acidosis, which results from a significant increase in lactate production during anaerobic metabolism. This excess lactate production also yields H+.
2. Lactic acidosis IS NOT respiratory acidosis! Respiratory acidosis is primarily a ventilation problem, while lactic acidosis is primarily a perfusion-, metabolic stress–, or cellular O2 consumption or extraction–related problem. Lactic acidosis will be discussed further as part of the section on metabolic acidosis.
3. Additional measures are sometimes used in critically ill patients for evaluation of tissue hypoxia. Mixed venous and/or central venous saturation of Hgb evaluates the tissue use of O2. The comparison of arterial (precellular) saturation to central or mixed venous (postcellular) is most commonly used to evaluate the tissue O2 consumption compared to O2 delivery.
4. Mixed venous (SVO2) or central venous oxygen saturation (ScVO2): This value is measured by an indwelling O2 probe/sensor on the tip of a catheter placed in the central vein (CVP catheter) or PA (PA catheter). Measurement may provide an early indication of perfusion failure or increased tissue demands for O2, reflected by a decreased mixed venous saturation of Hgb. If this saturation is normal or high but the patient has an increased lactate level, the cells may be unable to extract or use the O2, which frequently occurs in the later stages of severe sepsis.
5. Mixed venous saturation values (Svo2): This value should always be correlated with other tissue indicators of hypoxia, base deficit, widening anion gap, serum bicarbonate, and lactate levels. The difference between arterial and venous blood gases is reflective of global O2 consumption. The following standard parameters are based on mixed venous blood gas and have not yet been standardized for central venous gases; however, the basic principles are the same.
6. SaO2 reflects reservoir bound O2 and very indirectly reflects delivery.
7. SvO2 or ScVO2 reflects unused O2 or remaining reservoir after release of needed O2 has occurred.
8. SaO2 minus ScVO2 reflects O2 consumption.
9. SaO2 minus SvO2 divided by SaO2 reflects O2 extraction ratio, valued at around 20% to 30%.
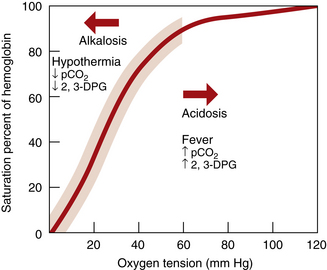
10. Normal oxygen extraction ratio is 20% to 30%: In other words, the patient should use normally between 20% and 30% of their total available O2. O2 extraction is a mathematical formula that assists in evaluating the compensatory mechanisms: First line of compensation is to increase the delivery of O2 (increase the cardiac output [CO], amount of Hgb, and O2 saturation), and the second line is to release O2 from Hgb to provide more dissolved O2 at the cell level, resulting in a shift to the right in the dissociation curve (Figure 1-1).
11. Patients presenting with a normal Svo2 and persistent lactic acidosis are NOT normal. They are not using O2 appropriately. Patients who are using more than 20% to 30% are signaling inadequate O2 delivery, dipping into second-line compensation, which is very risky, because the cells may undergo acute hypoxia.
Lactic acidosis (lactate level greater than 4 mmol/l)
Assessing perfusion and oxygen consumption at the cellular level
Arterial lactate concentration is dependent on the balance between its production and consumption. In the critically ill septic population, increased glucose metabolism, increased energy expenditures, and profound catabolism are the norm. The corresponding lactic acidosis signals physiologic stress but may not necessarily be evidence of tissue hypoxia. The concomitant energy expenditures—along with metabolic dysfunction—will increase lactate production, but high levels of clearance may mask this disturbing trend.
Measuring lactic acids
1. Lactate level: All patients who run the risk of cellular hypoxia must have a sample drawn for a lactate level to evaluate for lactic acidosis. An arterial lactate sample should be placed on ice and taken as soon as possible to the lab. Any lactate greater than 4 mmol/dL needs to be investigated for severe tissue hypoxia and hypoperfusion. Lactates > 2 mmol/dL should be observed along with the clinical conditions of the patient. Serial lactates should be performed to evaluate therapy effectiveness and follow the clearance level. A lactate clearance greater than 10%/24 hr is considered a successful measure of therapeutic intervention for severe sepsis.
Acute metabolic acidosis
Glucose 120, Ketones -, Lactate 6.8
This then points to acute metabolic (lactic) acidosis!
Compensatory response to acute metabolic acidosis
When H+ (acid) increases, pH decreases in the plasma. The central respiratory center in the brain responds by increasing the rate and depth of ventilation to 4 to 5 times the normal level to exhale significant amounts of CO2 and returning the carbonic acid; therefore, the pH is back to normal (but never perfect if there is a problem). The decrease in pH (high presence of H+) stimulates respirations. Attempts to compensate occur rapidly, as manifested by lowering of the PaCO2, which may be reduced to as little as 10 to 15 mm Hg. The most important mechanism for ridding the body of excess H+ is the increase in acid excretion through ventilation. In addition, if the kidney is functional, acid will be excreted and bicarbonate reabsorbed. Nonvolatile acids, however, may accumulate more rapidly than the body’s buffers can neutralize them, compensated for by the respiratory system, or excreted by the kidneys.
1. Original problem: Acute metabolic acidosis: pH 7.28, PaCO2 39, HCO3− 16
2. With compensation: pH 7.36, PaCO2 30, HCO3− 16, SaO2 99%, PaO2 100%
 ↑↑ H2CO3←↓↓HCO3− + H+↑↑
Collaborative management: acute metabolic acidosis
Care priorities
1. It is most important to treat the underlying disorder if possible.
• Diabetic ketoacidosis: Insulin and fluids. If acidosis is severe (with a pH of less than 7.15 or HCO3− 6 to 8 mEq/L), judicious administration of NaHCO3 may be necessary.
• Alcoholism-related ketoacidosis: Glucose and saline.
• Diarrhea: Usually occurs in association with other fluid and electrolyte disturbances; correction addresses concurrent imbalances.
• Acute renal failure: Hemodialysis or peritoneal dialysis to maintain an adequate level of plasma HCO3−.
• Renal tubular acidosis: May require modest amounts (less than 100 mEq/day) of bicarbonate.
• Poisoning and drug toxicity: Treatment depends on drug ingested or infused. Hemodialysis or peritoneal dialysis may be necessary.
• Lactic acidosis: Correction of underlying disorder related to hypoxia and/or hypoperfusion. Mortality associated with lactic acidosis is high. Unless pH is life-threatening, treatment with NaHCO3 is generally not indicated and may actually be harmful.
Anion gap is an estimate of the differences between measured and unmeasured cations (positively charged particles, such as Na and H+ respectively) and measured and unmeasured anions (negatively charged particles such as HCO3− and Cl−). Normally, cations and anions are equally balanced in live humans (in vivo), but when measured in the laboratory (in vitro), the difference may be between 10 to 12 mmol/L. This difference is termed a normal gap (between + and – ions). Particles that possess charges tend to have high affinity to bind to other particles that possess charges that are opposite their own (hence the term, “opposites attract”). Anion gap is used to determine if a metabolic acidosis is due to an accumulation of nonvolatile acids such as lactic acid or ketoacids. Both contribute a positive charge due to excess H+ or from net loss of bicarbonate (e.g., diarrhea). The gap is not affected when a patient has metabolic acidosis purely from kidney failure. The formula for calculation of anion gap is:

Usually, serum hyperkalemia is present, but an intracellular potassium deficit may be present. If a potassium deficit exists (K+ less than 3.5), it must be corrected before NaHCO3 is administered, because when the acidosis is corrected, the potassium shifts back to intracellular spaces. This shift in K+ could result in a profound serum hypokalemia with serious consequences, such as cardiac irritability with fatal dysrhythmias and generalized muscle weakness. See Hypokalemia, p. 52, for more information.
Nursing diagnoses and interventions
Nursing diagnoses and interventions are specific to the pathophysiologic process. See nursing diagnoses and interventions in Mechanical Ventilation (p. 99), Acute Respiratory Failure (p. 383), Emotional and Spiritual Support of the Patient and Significant Others (p. 200), Acute Renal Failure/Acute Kidney Injury (p. 584), and Diabetic Ketoacidosis (p. 713).
Chronic metabolic acidosis
Assessment
Physical assessment
Tachycardia (until pH less than 7, then bradycardia), decreased BP, tachypnea leading to alveolar hyperventilation (may be Kussmaul respirations), dysrhythmias, and shock state. Depending on the type of shock and the vascular response, skin temperature and color will be affected. Mild metabolic acidosis (HCO3− 15 to 18 mEq/L) may result in no symptoms, whereas symptoms will develop with a pH less than 7.2.
Collaborative management: chronic metabolic acidosis
Care priorities
1. Normalize the ph with alkalizing agents:
• For serum HCO3− levels less than 15 mEq/L, oral alkalis may be administered (NaHCO3 tablets or sodium citrate and citric acid oral solution [Shohl solution]). They are used cautiously to prevent fluid overload and tetany caused by hypocalcemia.
• Caution: Be alert to the possibility of pulmonary edema, if bicarbonate is administered parenterally to patients with renal insufficiency or cardiovascular disorders.
Metabolic alkalosis
Pathophysiology
• Excessive loss of hydrogen ions: Loss of gastric acid from vomiting or gastric suction, diuretic therapy
• Excessive resorption of bicarbonate: Post hypercapnic alkalosis (which occurs when chronic CO2 retention is corrected rapidly)
• Ingestion or administration of alkaline: Excessive NaHCO3 administration (i.e., overcorrection of a metabolic acidosis) or ingestion of over-the-counter antacids
 H2CO3↓↓
 ↑↑HCO3− + H+↓↓
Step 3: hco3− has increased to 35 meq/l, indicating the kidneys are retaining bicarbonate (h+ is decreased).
HERE is the cause of the problem: ACUTE metabolic alkalosis.
HCO3− is 35 (up and out of range), which means the metabolic acid, and H+ is decreased.
Step 4: the paco2 has not increased in an attempt to help correct or compensate for the increased hco3−.
Step 5: the pao2 and sao2 are normal, as the patient is breathing normally. the patient has a normal oxygenation.

Collaborative management: acute metabolic alkalosis
Chronic metabolic alkalosis
Pathophysiology
1. Abnormalities in the kidneys’ excretion of HCO3− related to a mineralocorticoid effect
2. Loss of H+ through the GI tract
3. Long-term diuretic therapy, especially with the thiazides and furosemide. A compensatory increase in Paco2 (up to 50 to 60 mm Hg) may be seen. Respiratory compensation is very limited because of the hypoxemia, which develops as a result of decreased alveolar ventilation.
Physical assessment
Monitoring parameters
Atrioventricular dysrhythmias as a result of cardiac irritability secondary to hypokalemia; prolonged QT intervals are present. See Hypokalemia, p. 52.
• Urinalysis: Urine chloride levels can help identify the cause of the metabolic alkalosis. Urine chloride level will be less than 15 mEq/L if hypovolemia and hypochloremia are present, and greater than 20 mEq/L with excess retained HCO3−. This test is not reliable if diuretics have been used within the previous 12 hours.
• ECG findings: To assess for dysrhythmias, especially if profound hypokalemia or alkalosis is present.
Collaborative management: chronic metabolic alkalosis
The goal is to correct the underlying acid-base disorder via the following interventions.
Care priorities
• IV potassium: If the patient is undergoing cardiac monitoring, up to 20 mEq/hr of KCl is given for serious hypokalemia. Concentrated doses of KCl (greater than 40 mEq/L) require administration through a central venous line because of blood vessel irritation.
• Oral potassium: This tastes very unpleasant; 15 mEq/glass is all most patients can tolerate, with a maximum daily dose of 60 to 80 mEq. Slow-release potassium tablets are an acceptable form of KCl. All forms of KCl may be irritating to gastric mucosa.
Alterations in consciousness
Pathophysiology
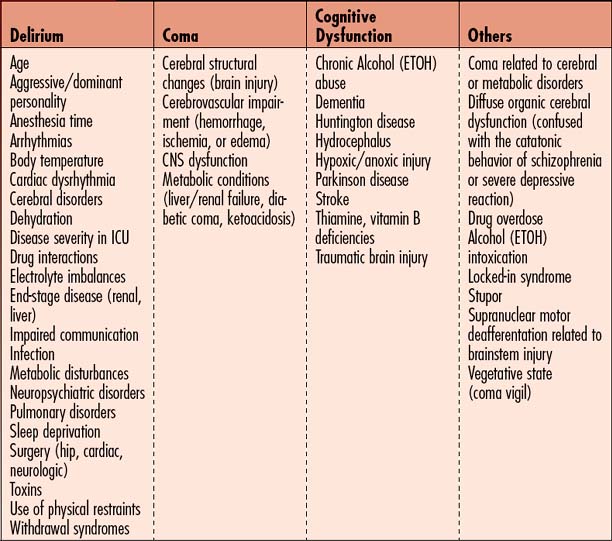
Consciousness is a state of awareness of the self and environment composed of three aspects: arousal (ability to awaken), ability to perceive internal and external stimuli, and ability to perform goal-directed behavior. Alterations in these aspects of consciousness result in a broad spectrum of syndromes including coma, delirium, and cognitive dysfunction. Factors precipitating various alterations in consciousness are listed in Table 1-3. These precipitating factors arise from intrinsic causes (medical condition and associated problems) and extrinsic causes (environmentally produced). Impaired consciousness, regardless of etiology, results in higher complication rates, puts the patient’s safety at risk, causes longer hospital stays, and is linked to higher morbidity and mortality. Three states of impaired consciousness can be recognized in hospitalized patients—coma, delirium, and cognitive dysfunction. While each of these conditions may arise from distinct medical problems, the clinical features often are similar and may be superimposed on each other, making diagnosis and treatment more complex. Change in mental status is often the early warning sign of a medical emergency. The differential diagnosis is critical to the proper treatment of these mental status changes. The following are descriptions of normal mental status variants that require further evaluation.
Delirium
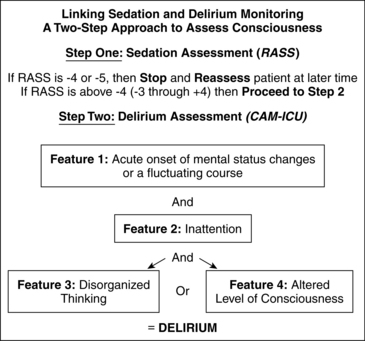
This is a state of disordered attention that reflects an underlying acute or subacute process. It is usually a transient condition (may be prolonged) that develops along a continuum including a clouding of consciousness, confusion, attention deficit, global cognitive impairment, and psychosis. Symptoms include disorientation to time, place, and person; disorganized thinking; fear; irritability; misinterpretation of sensory stimuli (e.g., pulling at tubes and dressings); appearance of being distracted; altered psychomotor activity; altered sleep-wake cycles; memory impairment; hallucinations; inappropriate communication (e.g., yelling, swearing, nonsensical speech); and dreamlike delusions. Lucid intervals alternate with episodes of delirium. Patients may have difficulty following commands. Daytime drowsiness is contrasted with nighttime agitation. Clinical variants of delirium include the hyperactive-hyperalert form, the quiet form, and a combination form that combines the hyperactive-hyperalert and quiet forms to produce both lethargy and agitation (Figure 1-2).
Coma
• Stupor—Deep sleep with responsiveness only to vigorous and repeated stimuli with return to unresponsiveness when the stimulus is removed. Stupor usually is related to diffuse organic cerebral dysfunction but may be confused with the catatonic behavior of schizophrenia or the behavior associated with a severe depressive reaction.
• Minimally conscious state (MCS)—Describes patients who demonstrate inconsistent but reproducible behavior indicating awareness of self and environment. Generally they cannot reliably follow commands or communicate but show visual fixation and tracking and have emotional and/or behavioral responses to external stimuli. Once the patient consistently follows commands, can reliably communicate, and uses objects in a functional way, the minimal conscious state ends. Although the etiology is uncertain, MCS seems to be related to diffuse, bilateral, subcortical, and hemispheric damage.
• Akinetic mutism (AM)—Subcategory of MCS in which a decrease in spontaneity and initiation of actions, thoughts, speech, or emotion is present. Sensory motor function is normal. Visual tracking and eye movements are intact, and there is occasional speech and movement to commands. However, internally guided behavior is absent because cortical activation is inadequate. AM is associated with orbitomesial frontal cortex, limbic system, and reticular formation lesions.
• Vegetative state (VS)—Vegetative state is a subacute or chronic condition that may follow the coma of brain injury or occur independently of coma (e.g., dementia). Transition from coma to VS occurs if coma without detectable awareness of environment persists for longer than 4 weeks. Onset of VS is signaled by a return of wakefulness (eyes are open and sleep patterns may be observed) with return of spontaneous control of autonomic function but without observable signs of cognitive function. The patient cannot follow commands, offers no comprehensible sounds, and displays no localization to stimuli. There is complete loss of meaningful interaction with the environment. When the VS continues for weeks or months, it is considered persistent vegetative state (PVS). PVS may exist for many years because the autonomic and vegetative functions necessary for life have been preserved. PVS generally resolves more quickly in traumatic brain–injured patients than in nontrauma patients.
• Locked-in syndrome (LIS) —Characterized by paralysis of all four extremities and the lower cranial nerves but with preservation of cognition. Associated with deafferentation (disruption of the pathways of the brainstem motor neurons), this condition prevents the patient from communicating with a full range of language and body movement. Generally, consciousness, vertical eye movement, and eyelid blinking are intact and provide a mechanism for communication. LIS is classified by the degree of voluntary speech and motor function preservation. In complete LIS, there is total immobility and anarthria (inability to speak). In incomplete LIS, there is vertical eye movement and blinking function. LIS can be distinguished from a vegetative state because patients give appropriate signs of being aware of themselves and their environment. Often, sleep patterns are disrupted (see Spinal cord injury)
Cognitive dysfunction
This is an alteration in thought process involving many of the following brain functions: memory, learning, language, attention, judgment, reasoning, reading, and writing. Aphasia, or difficulty understanding language or with responding with the proper words, may also be present. Dysphagia, or difficulty swallowing, occurs because of attention deficits or muscle weakness. These cognitive impairments, whether permanent or transitory, are overlooked and therefore underdiagnosed or incorrectly diagnosed. See Table 1-3 for factors contributing to cognitive dysfunction during critical illness.
Assessment: alterations in consciousness
Goal of assessment
• Evaluate for changes in behavior, including ability to both understand and comply with directions.
• Determine if altered behaviors have occurred in the past or occur regularly; new-onset changes in mental status should be very closely evaluated. Considerations of cause may include withdrawal from abused substances, a reaction to a new medication, hypoxia, and hypoglycemia.
• Determine the severity of the change in behavior from baseline; acute changes require prompt action.
• An acute or unexpected change in mental status that occurs should be investigated immediately and requires an extensive medical evaluation with labs, physical examination, and neuroimaging. These patients may need immediate transfer to a higher level of care. Change in mental status is often the earliest warning sign of a medical emergency!
• Resist the temptation to sedate an agitated patient prior to completing a full assessment, to ensure the patient is not hypoxic or hypoglycemic. Assessment for hypoxia should include both a ventilation and a perfusion assessment. The ABG includes an estimated Hgb level, which can prove to be invaluable to determine if patient may have internal bleeding.
History and risk factors
![]() • Age—Older adults (age 60 years and older) more prone to alterations in consciousness, especially with changes in the environment
• Age—Older adults (age 60 years and older) more prone to alterations in consciousness, especially with changes in the environment
• Brain injury—Lesions of the cortex, subcortex, and brainstem caused by global or focal ischemia, stroke, or traumatic brain injury (see Traumatic Brain Injury, p. 331)
• Cerebral disorders—Deteriorating brain conditions, such as expanding lesions, hydrocephalus, Parkinson disease, dementia, or mental health disorders (bipolar, depression, schizophrenia)
• Cardiovascular status—Disorders that lower CO (heart failure, myocardial infarction, shock states), procedures that cause post cardiotomy delirium, intra-aortic balloon pump sequelae, hypoperfusion states (altered cerebral perfusion pressure [CPP] and dysrhythmias)
• Pulmonary disorders—Those causing hypoxia and hypoxemia such as pneumonia, ARDS, pulmonary emboli
• Drug therapy—Sedation, analgesia, drug toxicity, drug interactions, drug withdrawal, or drug sensitivity
• Surgical factors—Nature (hip, cardiac, neurosurgery patients at increased risk) and extent of surgery and anesthesia time
• Infection—Bacteremia, urinary tract infections, pneumonia, or sepsis
• Perceptual/sensory factors—Sleep deprivation, sensory overload, sensory deprivation, impaired sensation (hypesthesia, decreased hearing or vision), impaired perception (inability to identify environmental stimuli), and impaired integration (inability to integrate environmental stimuli)
• Metabolic factors—Changes in glucose level, hypermetabolism, hypometabolism, and endocrine crises (diabetic coma, ketoacidosis, pituitary dysfunction or injury)
• Fluid and electrolyte disturbances—Sodium and potassium imbalances, hypovolemia, or dehydration
Vital signs
All of the following vital sign changes may be associated with an alteration in consciousness:
• Fever may indicate possible sepsis and/or bacteremia.
• Tachycardia may indicate hypovolemia, resulting from dehydration or bleeding. If patient has undergone a recent invasive procedure, evaluation for internal bleeding is warranted. Tachycardia is also present with fever and hypoglycemia.
• Tachypnea, if coinciding with tachycardia, may reflect the same findings but is also a compensatory mechanism to help control acidosis. Tachypnea is also present during a panic attack, as well as hypoxia.
• Bradypnea may be associated with high doses of narcotics used for pain control.
• Head-injured patients may exhibit signs of increased intracranial pressure (ICP), which vary depending on the degree of pressure elevation (see Traumatic Brain Injury, p. 331)
• Hypotension may indicate a later sign of shock or may be associated with higher doses of antihypertensive medications, narcotics, or other medications that can slow the HR or reduce the BP.
Observation and neurologic evaluation
• The patient’s normal baseline neurologic status must be documented and used for comparison.
• Baseline neurologic findings elicited from each component of the examination must be documented.
• Requires a thorough evaluation of mental/emotional status, cranial nerve function, motor function, sensory function, and reflex activity. When alterations in consciousness are manifested, the mental/emotional component of the examination is of particular importance.
• In patients who are unconscious or demonstrate low-level function, assessment techniques are used that do not require patient participation, such as coma and cognitive functioning scales. The purpose of assessment is to determine the extent of wakefulness and cognition through observed responses, such as eye opening, movement of the head and body, verbalization, and ability to follow commands. These observations alone will not fully discriminate the subtle differences in altered states of arousal.
• Assessment should be accompanied by an in-depth history focusing on the possible etiology of the change in mental status. Extensive cognitive testing including attention, concentration, memory, and learning assessments is performed when the patient is arousable and aware.
Neurologic evaluation
• Mental status testing—Subjective assessment requiring patient cooperation for best results (Box 1-1).
• Mini-Mental Status Examination—Objective neuropsychologic tool used to measure orientation, recall, attention, calculation, and language. Scores less than 23 (total 25) indicate cognitive dysfunction. Patient participation is necessary for this examination (Box 1-2).
• Glasgow Coma Scale—Quantitative, three-part scale that assesses the patient’s ability to open his or her eyes, to move, and to speak/communicate. Scores range from 3 to 15, with 3 being unresponsive to all stimuli and 15 being awake, alert, and oriented. Patients who are unable to cooperate can be evaluated using this scale. See Appendix 1.
• Coma Recovery Scale—Quantitative 35-item scale used to assess brain function at four levels (generalized, localized, emergent, cognitively mediated). Seven responses are evaluated: arousal and attention, auditory perception, visual perception, motor function, oromotor ability, communication, and initiative. Patients who are unable to cooperate can be evaluated using this scale.
• Confusion Assessment Method (CAM, CAM-intensive care unit)—Four-part scale used to evaluate confusion. Onset and course, inattention, disorganized thinking, and level of consciousness are assessed (Box 1-3).
• Intensive Care Delirium Screening Checklist (ICDSC)—Eight-item scale that rates behavioral responses exhibited by patients in intensive care; delirium is indicated with scores greater than 4 to 8 (Table 1-4).
• Richmond Agitation-Sedation Scale (RASS)—Scores sedation and agitation with a 10-point scale using verbal and physical stimulation to determine patient’s response; used to titrate medications (Table 1-5).
• Rancho Los Amigos (RLA) Cognitive Functioning Scale—Seven-level scale that describes levels of cognitive functioning. Levels range from unresponsive to sensory stimuli to purposeful/appropriate actions. Patients who cannot cooperate can be evaluated using this scale (Table 1-6).
Box 1-1 MENTAL STATUS COMPONENT OF THE NEUROLOGIC EXAMINATION
Box 1-2 MINI-MENTAL STATUS EXAMINATION
1. What is the year, season, date, day, month? (5 points)
2. Where are we: state, county, town, hospital, room? (5 points)
3. Name three objects. (3 points)
4. Count backward by sevens (e.g., 100, 93, 86, 79, 72). (5 points)
5. Repeat same three objects from item number 3 above. (3 points)
6. Name a pencil and watch. (2 points)
7. Follow a three-step command. (3 points)
8. Write a sentence. (1 point)
Box 1-3 CAM-ICU WORKSHEET
Feature 1: acute onset or fluctuating course
Positive if you answer ‘yes’ to either 1A or 1B.
1A: Is the patient different than his/her baseline mental status?
Score ___ (Patient earns 1 point for each correct answer out of 4)
Feature 4: altered level of consciousness
Positive if the Actual RASS score is anything other than “0” (zero)
Overall CAM-ICU (Features 1 and 2 and either Feature 3 or 4): Positive Negative
Copyright © 2002, E. Wesley Ely, MD, MPH and Vanderbilt University, all rights reserved.
Table 1-4 INTENSIVE CARE DELIRIUM SCREENING CHECKLIST
| Symptom Checklist (total 0–8) | Level of Consciousness Scoring |
| Level of Consciousness | Level of Consciousness |
| Inattentiveness | |
| Disorientation | A = no response: none |
| Hallucination, delusion, psychosis | B = response to intense, repeated stimuli (loud voice or pain): none |
| Agitation | C = response to mild or moderate stimulation: 1 |
| Inappropriate speech or mood | D = normal wakefulness: 0 |
| Sleep/wake cycle disturbance | E = exaggerated response to normal stimulation: 1 |
| Symptom fluctuation | (if A or B above do not complete evaluation for the day) |
Adapted from Bergeron N, Dubois M-J, Dumont M, Dial S, Skrobik Y: Intensive care delirium screening checklist: evaluation of a new screening tool. Intens Care Med 27(5):859–864, 2001.
Table 1-5 RICHMOND AGITATION-SEDATION SCALE (RASS)*
| +4 Combative | Overtly combative or violent, immediate danger to staff |
| +3 Very agitated | Pulls on or removes tubes or catheters, aggressive behavior toward staff |
| +2 Agitated | Frequent nonpurposeful movement or patient-ventilator dyssynchrony |
| +1 Restless | Anxious or apprehensive but movements not aggressive or vigorous |
| 0 Alert and calm | |
| −1 Drowsy | Not fully alert, sustained (>10 seconds) awakening, eye contact to voice |
| −2 Light sedation | Briefly (<10 seconds) awakens with eye contact to voice |
| −3 Moderate sedation | Any movement (but no eye contact) to voice |
| −4 Deep sedation | No response to voice, any movement to physical stimulation |
| −5 Unarousable | No response to voice or physical stimulation |
| Procedure | |
| Score Term Description | |
| +4 Combative | Overtly combative, violent, immediate danger to staff |
| +3 Very agitated | Pulls or removes tube(s) or catheter(s); aggressive |
| +2 Agitated | Frequent non purposeful movement, fights ventilator |
| +1 Restless | Anxious but movements not aggressive or vigorous |
| 0 Alert and calm | |
| −1 Drowsy | Not fully alert, but has sustained awakening (eye-opening/eye contact) to voice (>10 seconds) |
| −2 Light sedation | Briefly awakens with eye contact to voice (<10 seconds) |
| −3 Moderate sedation | Movement or eye opening to voice (but no eye contact) |
| −4 Deep sedation | No response to voice, but movement or eye opening to physical stimulation |
| −5 Unarousable | No response to voice or physical stimulation |
| Procedure for RASS Assessment | |
* From Sessler CN, Gosnell M, Grap MJ, et al: The Richmond Agitation-Sedation Scale: validity and reliability in adult intensive care patients. Am J Respir Crit Care Med 2002; 166:1338–1344, 2002; and Ely EW, Truman B, Shintani A, et al: Monitoring sedation status over time in ICU patients: the reliability and validity of the Richmond Agitation-Sedation Scale (RASS). JAMA 2003; 289:2983–2991, 2003.
Reproduced with permission from Sessler CN, Gosnell M, Grap MJ, et al: The Richmond Agitation-Sedation scale: Validity and reliability in adult intensive care unit patients. Am J Respir Crit Care Med 166:1338, 2002. Copyright © 2002 American Thoracic Society.
Table 1-6 COGNITIVE REHABILITATION GOALS
| Level | Response | Goal/intervention |
| I | None | Goal: Provide sensory input to elicit responses of increased quality, frequency, duration, and variety. |
| II | Generalized | |
| III | Localized | Intervention: Give brief but frequent stimulation sessions, and present stimuli in an organized manner, focusing on one sensory channel at a time; for example:
Visual: Intermittent television, family pictures, bright objects Auditory: Tape recordings of family or favorite song, talking to patient, intermittent TV or radio Olfactory: Favorite perfume, shaving lotion, coffee, lemon, orange Cutaneous: Touch or rub skin with different textures such as velvet, ice bag, warm cloth Movement: Turn, ROM exercises, up in chair Oral: Oral care, lemon swabs, ice, sugar on tongue, peppermint, chocolate |
| IV | Confused, agitated | Goal: Decrease agitation, and increase awareness of environment. This stage usually lasts 2–4 weeks. Intervention: Remove offending devices (e.g., NG tube, restraints), if possible. |
| V | Confused, inappropriate | Goal: Decrease confusion and incorporate improved cognitive abilities into functional activity. |
| VI | Confused, appropriate | Intervention: Begin each interaction with introduction, orientation, and interaction purpose. |
| VII | Automatic, appropriate | Goal: Integrate increased cognitive function into functional community activities with minimal structuring. |
ADLs, activities of daily living; NG, nasogastric; ROM, range of motion.
Modified from Rancho Los Amigos Hospital, Inc. Levels of Cognitive Functioning (scale based on behavioral descriptions or responses to stimuli). From Swift CM: Neurologic disorders. In Swearingen PL, editor: Manual of medical-surgical nursing care, ed 4, St. Louis, 1999, Mosby.
Diagnostic tests
Neuropsychological testing
Although not a routine part of critical care, neuropsychological testing should be planned and implemented for patients with brain injury or altered consciousness when they enter the recovery phase. This testing provides a comprehensive baseline for rehabilitation by evaluating higher cortical functions, such as memory, learning, and language.
Collaborative management
Care priorities
• Determine and correct physiologic imbalances and drug interactions.
• Correct sensory/perceptual deficits (e.g., provide hearing aid, eyeglasses).
• Reorient patient to the self and environment.
• Perform neuropsychologic testing.
• Implement appropriate medications to help control behavior.
 •
• • Manage pain and assess effectiveness.
• Minimize sedative medications; benzodiazepines are not recommended.
• Check bowel and bladder function.
• Assess cognitive function using the RLA score or Coma Recovery Scale.
• Initiate a sensory stimulation program for patients with low-level cognition.
• Minimize stimulation for confused or agitated patients.
• Consult with rehabilitation services including physical, occupational, and speech therapy.
• Plan care to prevent or minimize problems related to the injury (e.g., spasticity, swallowing disorders) and complications of immobility (e.g., disuse syndrome, contractures, pressure ulcers).
• Perform neurodiagnostic and neuropsychological testing to confirm the diagnosis.
• Provide essential supportive care to minimize complications such as pressure ulcers and aspiration.
• Initiate a sensory stimulation program for low-level cognitive function, including visual, auditory, tactile, gustatory, and vestibular stimuli (Figure 1-3).
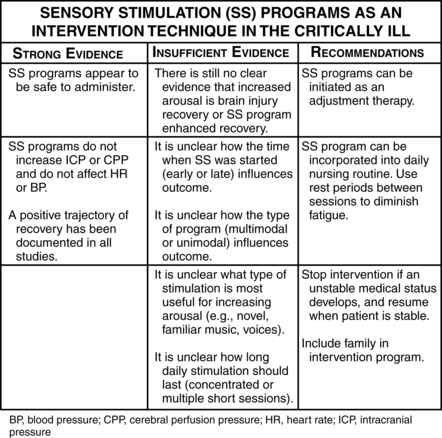
Figure 1-3 Sensory stimulation (SS) programs as an intervention technique in the critically ill.
(From Kater K: Response of head-injured patients to sensory stimulation. West J Nurs Res 11[1]:20–33, 1989; Lewinn E, Dimancescu M: Environmental deprivation and enrichment in coma. Lancet 2:156–157, 1978; Mackay L, et al: Early intervention in severe head injury: long-term benefits of a formalized program. Arch Phys Med Rehabil 73:635–641, 1992; Mitchell S, et al: Coma arousal procedure: a therapeutic intervention in the treatment of head injury. Brain Inj 4:273–279, 1990; Schinner K, et al: Effects of auditory stimuli on intracranial pressure and cerebral perfusion pressure in traumatic brain injury. J Neurosci Nurs 27[6]:336–341, 1994; and Wilson S, et al: Vegetative state and response to sensory stimulation: an analysis of 24 cases. Brain Inj 10(11):807–818, 1996.)
CARE PLANS: ALTERATION IN CONSCIOUSNESS
 related to physiologic changes; psychological changes; environmental changes; sensory deprivation; sensory overload; drug interactions
![]() Cognitive Restructuring; Cognitive Stimulation; Environmental Management; Reality Orientation; Dementia Management; Electrolyte Management; Delirium Management
Cognitive Restructuring; Cognitive Stimulation; Environmental Management; Reality Orientation; Dementia Management; Electrolyte Management; Delirium Management
related to neurologic deficits
![]() Communication: Expressive; Communication; Communication: Receptive
Communication: Expressive; Communication; Communication: Receptive
![]() Communication Enhancement: Speech Deficit; Support System Enhancement
Communication Enhancement: Speech Deficit; Support System Enhancement
related to perceptual or cognitive impairment; imposed restrictions of movement
Exercise therapy: joint mobility
![]() Bed Rest Care; Positioning; Exercise Promotion; Self-Care Assistance
Bed Rest Care; Positioning; Exercise Promotion; Self-Care Assistance
Additional nursing diagnoses
Also see nursing diagnoses and interventions under Nutritional Support (p. 117), Sedation and neuromuscular blockade (p. 158), Prolonged Immobility (p. 149), and Risk for Disuse Syndrome, in Traumatic Brain Injury (p. 331), Acute Spinal Cord Injury (p. 264), and SIRS, Sepsis, and MODS (p. 924).
Fluid and electrolyte disturbances
In addition to water, body fluids contain two types of dissolved substances: electrolytes and nonelectrolytes. Electrolytes are substances that carry an electrical current and can dissociate into ions, which have either a positive or a negative charge. They are measured by their capacity to combine (milliequivalents/liter [mEq/L]) or by the molecular weight in milligrams (millimoles/liter [mmol/L]). Nonelectrolytes are substances such as glucose and urea that do not dissociate in solution and are measured by weight (milligrams per 100 milliliters, or mg/dl). The body fluid compartments are separated by a semipermeable membrane, which allows movement of dissolved substances/particles between compartments, while maintaining the unique composition of each compartment (Table 1-7).

Hormonal influence
Antidiuretic hormone (ADH), or vasopressin, is a hormone released by the posterior pituitary in response to a reduction in intravascular volume (hypovolemia) or an increase in extracellular osmolality. It acts on the kidney at both the glomerulus and the tubules to conserve water by increasing urine concentration. The hormone regulates the electrolyte and fluid balance to keep serum in “perfect” concentration (osmolality). Thirst is stimulated by hypovolemia and increased osmolality.
Hypovolemia
Hypovolemia assessment
History and risk factors
• Abnormal GI losses: Vomiting, nasogastric suctioning, diarrhea, intestinal drainage
• Abnormal skin losses: Excessive diaphoresis secondary to fever or exercise, burns
• Abnormal renal losses: Diuretic therapy, polyuria/osmotic diuresis seen with DKA, hyperglycemic hyperosmolar nonketotic syndrome (HHNS), nephrotoxicity, rhabdomyolysis, diabetes insipidus, diuretic phase of acute renal failure/acute kidney injury, adrenal insufficiency
• Third-spacing or plasma to interstitial fluid shift: Peritonitis, intestinal obstruction, burns, ascites, severe sepsis
• Hemorrhage: Major trauma, GI bleeding, obstetric complications, postoperative bleeding, high dosage of anticoagulants or antiplatelet medications
Vital signs
• Check BP lying, sitting, and standing to determine presence of orthostasis.
• HR will be increased (tachycardia).
• Low PAWP (less than 3 mm Hg)
• Urine output decreased and may be less than 0.5 ml/kg/hour
• Acute weight loss unless third spacing is occurring (Table 1-8)
Table 1-8 WEIGHT LOSS AS AN INDICATOR OF EXTRACELLULAR FLUID DEFICIT IN THE ADULT
| Acute Weight Loss | Severity of Deficit |
| 2%–5% | Mild |
| 5%–10% | Moderate |
| 10%–15% | Severe |
| 15%–20% | Fatal |
Screening labwork
• Hematocrit levels are elevated with dehydration and decreased with bleeding.
• BUN values may be elevated, with a BUN/creatinine ratio of greater than 20:1 suggesting hypovolemia.
• Electrolyte levels will vary depending on the type of fluid lost.
• ABG values depend on the type of fluid lost.
• Serum and urine osmolality depend on the type of fluid lost, and comparison assists in the diagnosis of renal insufficiency.
| Test | Purpose | Abnormal Findings |
| Blood urea nitrogen (BUN) | Evaluates the renal response to decreased perfusion. Renal clearance of urea is reduced when renal blood supply is compromised. | Elevated with dehydration, decreased renal perfusion or decreased renal function. BUN/creatinine ratio greater than 20:1 suggests hypovolemia. |
| Hematocrit | Evaluates for hemoconcentration resulting from loss of fluid in the blood, or blood itself. | Elevated: with dehydration Decreased: with bleeding If both blood and fluid are lost, blood loss may be underestimated due to hemoconcentration. |
| Serum electrolytes | Assesses abnormalities that may increase morbidity. Changes are dependent on the type of fluid lost. | Hypokalemia: May occur with abnormal GI or renal loss. Hyperkalemia: Associated with adrenal insufficiency. Hypernatremia: Seen with increased insensible loss, and diabetes insipidus. Hyponatremia: Associated with increased thirst and ADH release; may lead to increased water intake, retention and dilution of serum sodium. |
| Serum total CO2 (CO2 content) | Evaluates for metabolic acidosis or alkalosis | Decreased with metabolic acidosis and increased with metabolic alkalosis. |
| ABG values | Assesses the body’s chemical environment. Acidosis and alkalosis can have a profound effect on electrolyte balance. | Metabolic acidosis may occur with lower GI loses, shock, or diabetic ketoacidosis. Metabolic alkalosis may occur with upper GI losses and diuretic therapy. |
| Urine specific gravity | Assesses the ability of the kidneys to concentrate urine. With hypovolemia, urine should be more concentrated. | Increased with kidneys’ attempt to conserve water. May be fixed at approximately 1.010 in the presence of renal disease. |
| Urine sodium | Assesses the ability of the kidneys to conserve sodium in response to increased aldosterone levels | In the absence of renal disease, osmotic diuresis or diuretic therapy, the value should be less than 20 mEq/L. |
| Serum osmolality | Assess compensation | Variable, depending on the type of fluid lost and the body’s ability to compensate with thirst and ADH |
| Urine osmolality | Assess concentrating ability of the kidneys. The role of urine production and concentration is to keep serum osmolality perfect. | Level should be increased greater than 450 mOsm/kg as the kidneys attempt to conserve water. If serum is concentrated, urine should be more concentrated. Comparing urine osmolality to serum osmolality assists in the diagnosis of renal insufficiency. |
Collaborative management
Care priorities
1. Restore tissue perfusion with fluid volume replacement and correct electrolyte disturbances: Administer and monitor fluid replacement with crystalloids, colloids, or blood.
2. Document response to fluid administration.
3. Maintain a safe environment for patients with neurologic symptoms.
4. Monitor for the signs and symptoms of dehydration.
5. Protect skin with lotions and egg crate or alternating pressure mattress.
| Management of Hypovolemia |
CARE PLANS FOR HYPOVOLEMIA
related to loss of body fluid or blood
Within 24 hours of starting fluid therapy, patient becomes normovolemic as evidenced by urine output ≥0.5 ml/kg/hr, specific gravity 1.010 to 1.030, stable weight, no clinical evidence of hypovolemia (e.g., furrowed tongue), BP within patient’s normal range, HR and pulse pressure normalized, CVP 2 to 6 mm Hg, PAP 20 to 30/8 to 15 mm Hg, CO 4 to 7 L/min, MAP 70 to 105 mm Hg, HR 60 to 100 beats per minute (bpm), and systemic vascular resistance (SVR) 900 to 1200 dynes•sec•cm−5.
Ineffective peripheral tissue perfusion
related to lack of blood volume
Circulatory care: arterial insufficiency
Hypervolemia
Hypervolemia assessment
History and risk factors
• Retention of sodium and/or water: Heart failure, hepatic failure, nephrotic syndrome, excessive administration of glucocorticosteroids, syndrome of inappropriate antidiuretic hormone (SIADH)
• Abnormal renal function: Acute or chronic renal failure, oliguria, anuria, excessive administration of IV fluids
• Interstitial-to-plasma fluid shifting: Remobilization of fluid after burn treatment, excessive administration of hypertonic solutions (i.e., mannitol, hypertonic saline), excessive administration of colloid oncotic solutions (i.e., albumin)
Radiology
| Test | Purpose | Abnormal Findings |
| Hematocrit | Assesses for anemia | Decreased: Due to hemodilution by excess fluids in the vasculature |
| Blood urea nitrogen | Evaluates for presence of renal dysfunction | Decreased: In pure hypervolemia. Increased: With renal failure |
| Arterial blood gases | Assesses for hypoxemia and acid-base imbalance (acidosis or alkalosis) | Hypoxemia with alkalosis: May be present due to tachypnea associated with early pulmonary edema. Respiratory acidosis: May be present in severe pulmonary edema. Diffusion of oxygen is difficult across the edematous alveolar-capillary membrane. |
| Serum sodium and serum osmolality | Assesses for water retention | Decreased: If hypervolemia is from water retention (i.e., chronic renal failure) |
| Urinary sodium | Evaluates efficacy of renal handling of sodium | Elevated: Results from kidneys excreting excess sodium. Sodium excretion prompts fluid excretion. NOTE: Urinary sodium is not elevated with secondary hyperaldosteronism (e.g., heart failure, cirrhosis, nephrotic syndrome) because hypervolemia occurs secondary to a chronic renal stimulus; the aldosterone increases resorption of Na+ |
| Urine specific gravity | Evaluates the solute concentrating ability of the kidney | Decreased: If the kidney is excreting excess volume. May be fixed at 1.010 in acute renal failure |
| Chest radiograph | Assesses for pulmonary edema | May reveal signs of pulmonary vascular congestion (“whiter” appearance) |
Collaborative management
Care priorities
1. Restrict intake of sodium and water
Monitor intake of oral, enteral and parenteral fluids. Prevent the intake of high sodium foods. Box 1-4 lists foods high in sodium.
Used in renal failure or life-threatening fluid overload (see Acute Renal Failure/Acute Kidney Injury, p. 584)
Monitor for changes in BP and CO with diuresis.
![]() Also see specific discussions under Burns ( p. 279), Acute Lung Injury and Acute Respiratory Distress Syndrome (p. 365), and Acute Renal Failure/Acute Kidney Injury (p. 584).
Also see specific discussions under Burns ( p. 279), Acute Lung Injury and Acute Respiratory Distress Syndrome (p. 365), and Acute Renal Failure/Acute Kidney Injury (p. 584).
CARE PLANS FOR HYPERVOLEMIA
related to patient’s disease state(s), medications, and/or other therapies
![]() Electrolyte and Acid-Base Balance, Fluid Balance, Fluid Overload Severity
Electrolyte and Acid-Base Balance, Fluid Balance, Fluid Overload Severity
1. Monitor intake and output hourly. Urine output should be greater than/equal to 0.5 ml/kg/hr unless the patient is in oliguric renal failure.
2. Measure urine specific gravity or urine osmolality every 4 hours. If the patient is receiving diuretic therapy, specific gravity should be 1.010 to 1.020 with osmolality less than 500 mOsm/L.
3. Monitor and manage edema (pretibial, sacral, periorbital), using a 0 to 4+ rating scale.
4. Weigh patient daily. Daily weight measurements are the single most important indicator of fluid status.
5. Limit oral, enteral, and parenteral sodium intake as prescribed. Be aware that medications may contain sodium (e.g., penicillins, bicarbonate). See Box 1-4 for some foods high in sodium.
6. Limit fluids as prescribed. Offer a portion of allotted fluids as ice chips to minimize patient’s thirst. Teach patient and significant others the importance of fluid restriction and how to measure fluid volume.
7. Provide oral hygiene at frequent intervals to keep oral mucous membrane moist and intact.
8. Document response to diuretic therapy (e.g., increased urine output, decreased CVP/PAP, decreased adventitious breath sounds, decreased edema). Many diuretics (e.g., furosemide, thiazides) cause hypokalemia. Observe for indicators of hypokalemia: muscle weakness, dysrhythmias (especially PVCs and ECG changes such as flattened T wave, presence of U waves). (See Hypokalemia [p. 52].) Potassium-sparing diuretics (e.g., spironolactone, triamterene) may cause hyperkalemia: signs include weakness, ECG changes (e.g., peaked T wave, prolonged PR interval, widened QRS complex). (See Hyperkalemia [p. 55]) Consult physician or midlevel practitioner for significant findings.
9. Observe for indicators of overcorrection and dangerous volume depletion: Vertigo, weakness, syncope, thirst, confusion, poor skin turgor, flat neck veins, and acute weight loss.
10. Monitor VS and hemodynamic parameters for volume depletion occurring with therapy: Decreased BP, CVP, PAP, MAP, and CO; increased HR. Consult physician or midlevel practitioner for significant changes or findings.
11. Monitor appropriate laboratory tests (e.g., BUN and creatinine in renal failure). Consult with physician or midlevel practitioner for abnormal trends.
![]() Fluid Monitoring; Hypervolemia Management; Fluid/Electrolyte Management; Invasive Hemodynamic Monitoring; Hemodialysis Therapy
Fluid Monitoring; Hypervolemia Management; Fluid/Electrolyte Management; Invasive Hemodynamic Monitoring; Hemodialysis Therapy
related to fluid volume overload
![]() Respiratory Status: Gas Exchange; Respiratory Status: Ventilation
Respiratory Status: Gas Exchange; Respiratory Status: Ventilation
1. Monitor patient for signs of acute pulmonary edema, a potentially life-threatening complication of hypervolemia: air hunger, decreased pulse oximetry, anxiety, cough with production of frothy sputum, crackles, rhonchi, tachypnea, increasing ventilator pressures, tachycardia, gallop rhythm, and elevation of PAP and PAWP. Administer diuretics and other medications to reduce venous return to the heart as prescribed.
2. Monitor ABG values for hypoxemia and respiratory alkalosis. Monitor O2 saturation. Administer O2 to maintain SpO2 ≥92%. Increased O2 requirements may signal increased pulmonary vascular congestion.
3. Keep patient in semi-Fowler’s position or position of comfort to minimize dyspnea.
 related to edematous, possibly friable tissue
Patient’s skin and tissue remain intact.
![]() Tissue Integrity: Skin and Mucous Membranes
Tissue Integrity: Skin and Mucous Membranes
1. Assess and document circulation to extremities at least each shift. Note color, temperature, capillary refill, and peripheral pulses. Consult physician or midlevel practitioner if capillary refill is delayed or if pulses are diminished or absent.
2. Turn and reposition patient at least every 2 hours to minimize tissue pressure.
3. Check tissue areas at risk with each position change (e.g., heels, sacrum, areas over bony prominences).
4. Use pressure-relief mattress as indicated.
5. Support arms and hands on pillows and elevate legs to decrease dependent edema. Do not elevate legs in the presence of pulmonary congestion.
6. Treat pressure ulcers per unit protocol. Consult physician or midlevel practitioner if sores, ulcers, or areas of tissue breakdown are present; especially with patients who are at high risk for infection (i.e., those with diabetes mellitus or renal failure or who are immunosuppressed).
7. Consult a skin/wound care nurse specialist for advanced tissue breakdown or any alteration in tissue integrity in high-risk patients.
[/level-membership-for-critical-care-medicine-category][not-level-membership-for-critical-care-medicine-category]
CHAPTER 1 General concepts in caring for the critically ill
Acid-base imbalances
Pathophysiology of acid-base regulation
• Acidosis: Extra acids are present or base is lost, with a pH less than 7.35.
• Buffering of acid or compensation for an acid state, occurs in three primary ways:
• Alkalosis: Extra base is present or there is loss of acid, with a pH greater than 7.45.
• Alkalosis: Compensating for an alkaline state occurs in two ways:
Example of compensation (ph regulation):
It is essential to understand that unless the patient has ingested acid (aspirin, ethanol, etc.), all acid in the bloodstream was produced at the cellular level (Table 1-1). When evaluating patients, care providers must have a basic understanding of the acid-base balancing system. The main formula for maintenance of acid-base balance is the following:
| Acid Pathways | Cause | Measure |
| Cells produce acid (acid production increases). | Hypermetabolic states, such as pain, hyperthermia, or inflammation. The respiratory and heart rates increase, and bicarbonate is initially consumed by buffering. | HCO3 ↓ |
| Tissues are hypoxic; anaerobic metabolism ensues resulting in lactic acidosis. | Lactate level ↑ | |
| Absolute insulin deficiency results in failure of glucose to be transported into cells. | Blood glucose level ↑ Ketoacids ↑ |
|
| Cells regulate acids. | When acid production (H+) increases, pH decreases, bicarbonate is initially consumed by buffering, and CO2 is exhaled in larger amounts, and H+ exchanges for K+ as cells buffer acid. | pH ↓ HCO3 ↓ K+ ↑ Total serum CO2 ↓ |
| Lungs regulate acid. | When acid increases due to hypermetabolic states such as pain, hyperthermia, or inflammation, carbonic acid (H2CO3) increases and rapidly converts to CO2 and H2O. The respiratory rate increases to blow off CO2. | Paco2 ↓ |
| Kidneys regulate acid. | When acid increases, tubules are affected by low blood pH, and work to neutralize increased carbonic acid (H2CO3) by separating it into H+ and bicarbonate HCO3. Kidneys excrete what is necessary to sustain normal pH if renal function is normal. If abnormal, kidneys may not perform this task. | HCO3 ↑ Kidney function is assessed by serum BUN and creatinine; elevated BUN and creatinine indicate abnormal kidney function. |
Understanding the arterial blood gas
Abg values
| Normal Arterial Values | Normal Venous Values |
|---|---|
| pH: 7.35–7.45 | pH: 7.32–7.38 |
| PaCO2: 35–45 mm Hg | PvCO2: 42–50 mm Hg |
| PaO2: 80–100 mm Hg | PvO2: 40 mm Hg |
| SaO2: 95%–100% | SvO2: 60%–80% |
| Base excess (BE): −2 to +2 | BE: −2 to +2 (only calculated on ABG analyzer) |
| HCO3−: 22–26 mEq/L | total Serum CO2−: 23–27 mEq/L |
• Hypoxemia (PaO2 less than 80 mm Hg): Low partial pressure of O2 affects the cellular levels of oxygen available and may result in cellular metabolic dysfunction reflected by lactic acid production and metabolic acidosis.
• Fio2: Fraction of inspired O2 or the percentage of the atmospheric pressure which is oxygenated. Room air is 21% or 0.21 O2. O2 delivery devices can increase the FIO2 to 100% or 1.00.
• Pulse oximetry (SpO2): This can be used to noninvasively trend the arterial O2 saturation and determine ventilation status using a probe fastened to the patient’s finger, earlobe, or forehead. This monitoring technique is frequently used in critical care areas for patients at high risk of ventilation problems, in operating rooms, and in emergency departments. SpO2 should be correlated with SaO2 (or oxyhemoglobin) via blood gas analysis when pulse oximetry is initiated, to assess accuracy of SpO2 readings. Pulse oximetry is a close correlate to SaO2 under normal physiologic conditions, but if perfusion decreases, the pulse needed for accurate measurement by the SpO2 probe is decreased, prompting inaccurate readings. Anemic patients should have consistently high readings, so what is usually considered a normal SpO2 reading may be too low in an anemic patient. The measure of true oxyhemoglobin (Hgb saturated with O2) requires an ABG analysis. Many centers do not perform a correlation analysis when oximetry is initiated.
• All buffers: Absorb acids (H+), but do so with a varying affinity. Buffers are present in all body fluids and cells and act within 1 second after acid accumulation begins. They combine with excess acid to form substances that may not greatly affect pH. Some buffers have a strong affinity to acid; others are weak. The three primary plasma buffers are bicarbonate (HCO3−), intracellular proteins, and chloride (Cl−). All are negatively charged to facilitate attraction to positively charged hydrogen ions (H+). Combining positively charged with negatively charged ions yields a neutral substance.
• Proteins: Serum and intracellular proteins offer a significant contribution to buffering acids. Hgb not only transports O2 but also provides a very strong buffer for hydrogen ions (H+). Albumin is also a significant buffer, and hypoalbuminemia must be considered when performing anion gap calculations.
• HCO3− (perfect 24, normal range 22 to 26 mEq/L): Serum bicarbonate (HCO3−) is one of the major components of acid-base regulation by the kidney. Bicarbonate is generated and/or excreted by normally functioning kidneys in direct proportion to the amount of circulating acid to maintain acid-base balance. Because bicarbonate is affected by both the respiratory and metabolic components of the acid-base system, the relationship between metabolic acidosis and bicarbonate is not particularly linear or predictable. When the bicarbonate level changes, the acid level changes in the opposite direction. To determine the cause of bicarbonate changes (as the source of a pH problem versus compensation), the relationship to pH must be evaluated. The pH changes in the presence or absence of acid, and the directional relationship reflects what caused the pH alteration. The kidney is responsible for the regeneration of bicarbonate ions, as well as excretion of the hydrogen ions. Although serum bicarbonate is a buffer, it is usually reported in the standard electrolyte panel from a venous blood sample as “CO2 content” or “total CO2” rather than as bicarbonate (HCO3−). The serum HCO3− concentration is usually calculated and reported separately with ABG analysis. Either value may be used as part of the assessment of acid-base balance (Table 1-2).
• Chloride (Cl−): The number of positive and negative ions in the plasma must balance at all times. Aside from the plasma proteins, bicarbonate and chloride are the two most abundant negative ions (anions) in the plasma. To maintain electrical neutrality, any change in chloride must be accompanied by the opposite change in bicarbonate concentration. If chloride increases, bicarbonate decreases (hyperchloremic acidosis) and vice versa. However the combination of H+ and chloride actually exerts an acid effect (HCl). Chloride concentration may influence acid-base balance (see anion gap). Chloride concentration should be observed closely when large amounts of normal saline are administered to patients.
• Other buffers: Other buffers, including phosphate and ammonium, are present in very limited quantities and have a lesser impact on the regulation of acid.
• Cellular electrolytes: The cells also offer protection in the metabolic acid environment. H+ may exchange across the cell wall, attracted by negatively charged intracellular proteins in a cellular buffering process. When this happens, K+ is released from the proteins and shifts out of the cell, causing an excess of K+ in the blood.
• Anion gap: Anion gap is an estimate of the differences between measured and unmeasured cations (positively charged particles, such as Na and H+ respectively) and measured and unmeasured anions (negatively charged particles such as HCO3− and Cl−. Normally, cations and anions are equally balanced in live humans (in vivo), but when measured in the laboratory (in vitro), the difference may be between 10 to 12 mmol/L. This difference is termed a normal gap (between + and – ions). Particles that possess charges tend to have high affinity to bind to other particles that possess charges that are opposite their own (hence the term, “opposites attract”). Anion gap is used to determine if a metabolic acidosis is due to an accumulation of nonvolatile acids such as lactic acid or ketoacids. Both contribute a positive charge due to excess H+ or from net loss of bicarbonate (e.g., diarrhea). The gap is not affected when a patient has metabolic acidosis purely from kidney failure. The formula for calculation of anion gap is
Table 1-2 DIAGNOSTIC TESTS FOR ACID-BASE BALANCE
| Role of the ABG | Measures | Normals |
| Evaluation of arterial oxygen (dissolved oxygen and oxygen bound to hemoglobin) | Arterial oxygen saturation (oxygen bound to hemoglobin) |
Sao2: 0.95–1.0 or 95%–100% |
| Partial pressure of arterial oxygen (dissolved oxygen) | Pao2: 80–100 mm Hg (decreased over the age of 70) | |
| Calculation of alveolar-arterial (A-a) oxygen gradient | Alveolar-arterial gradient | A-a Do2: <20 mm Hg |
| Pao2/Fio2 ratio | PF ratio: .300 | |
| Evaluation of cellular environment | pH (reflects H2CO3) i.e., ↑↑ H2CO3 then pH ↓↓ |
pH Perfect: 7.40 Normal range: 7.35–7.45 |
| Evaluation of ventilation | Paco2 | Paco2 Normal range: 35–45 mm Hg |
| Evaluation of tissue metabolism | H+ inversely (indirectly) reflected by buffers: Bicarbonate (HCO3−) Base measures (+ or −) Total CO2 i.e., ↑↑ H+ then buffers ↓↓ |
pH Perfect: 7.40 Normal range: 7.35–7.45 |
| HCO3−: 22–26 mEq/L | ||
| Total CO2: 20–26 | ||
| Base Normal range: −2 to +2 |
||
| Anion gap: 12 + or −2 | ||
| Additional measures of tissue metabolism | Both contribute H+ to blood lactic acid Ketoacids |
Lactic acid: 1–2 mmol/L |
| Ketoacids Blood: 0.27–0.5 mmol/L Urine levels Small: <20 mg/dl Moderate: 30–40 mg/dl Large: >80 mg/dl |
||
| Evaluation of renal clearance | Appropriate clearance of excessive components: H+ or HCO3− Appropriate clearance of excessive components: BUN and creatinine |
pH Perfect: 7.40 Range: 7.35–7.45 BUN: 0–20 mg/dl Creatinine: <2.0 mEq/L |
Step-by-step guide to abg analysis
A systematic analysis is critical to the accurate interpretation of ABG values to determine the origin of acid-base imbalance, and level of compensation (see Table 1-2).
Step 1: check the ph: determine if ph is perfect (7.40)
• Acidosis: Extra acids are present or base is lost, with a pH less than 7.35
Ph greater than 7.45, alkalosis:
• Alkalosis: Extra base is present or there is loss of acid, with a pH greater than 7.45.
Respiratory acidosis
Pathophysiology
Step 1: ph is 7.28, not perfect or neutral (7.40) and outside the normal range of 7.35 to 7.45.
1. pH 7.28: Acid side, outside of range of normal
2. Question: Is there a problem? YES, acidosis (identified by the pH)
3. Where is the acid being generated? Are the acids respiratory or metabolic?
4. PaCO2: 55 (elevated outside the normal range) → respiratory acid is accumulating
5. HCO3−: 24 (perfect) → metabolic acid is not present, perfect HCO3
Step 2: paCO2 is 55 mm hg, not perfect (40 mm hg) and above the normal range of 35 to 45 mm hg indicating an excess of respiratory acid.
1. Hypercapnia/elevated Paco2 (Paco2 greater than 45 mm Hg): Signals alveolar hypoventilation. This problem occurs when alveoli are not recruited, there is poor blood flow, the respiratory rate or tidal volume is inadequate, or there is fluid or an increase in the space between alveoli and blood vessel. These conditions may be chronic or acute.
2. If this is the causative problem, the pH has to be below 7.40, reflecting excess acid (CO2) or an increase in carbonic acid (H2CO3), which is a primary acidosis. So now one must investigate what caused the increase in carbonic acid (H2CO3). For every 10 mm Hg increase in CO2, the pH will acutely decrease 0.08 (on the acid side).
Step 3: the hco3− in the example is perfect at 24 meq/l. the normal range of bicarbonate is 22 to 26 meq/l.
Is there compensation for the respiratory acidosis?
1. Only the CO2 is elevated, without a change in the HCO3−.
2. pH is down and outside range reflecting the presence of acid in the blood.
3. Problem: The patient has acute respiratory failure, causing an accumulation of respiratory acid (CO2). There is no compensation, but no evidence is available at this time.
Step 5: paO2 92 mm hg (not perfect 98 to 100 mm hg but within normal range 80 to 100 mm hg), saO2 91% (not perfect 100% and below normal range of 95% to 100%).
Investigation begins: slight decrease is apparent in paO2 and saO2
1. Use of O2: If O2 is not in use on a patient with reduced PaO2 and SaO2, applying O2 often corrects the readings. If O2 is in use, changing to a device that delivers a higher concentration of O2, such as changing from a nasal cannula to a face mask, may be sufficient to correct the alveolar levels of O2. If the PaO2 and SaO2 do not respond to the first device change or values further deteriorate, a 100% nonrebreather mask may be applied to provide close to 100% O2. Note: All ABG readings must be recorded with consideration of the mode of O2 delivery recorded, as well as the FIO2 or concentration of O2. Otherwise, evaluation of the PaO2 and SaO2 values is meaningless. If the values are NOT recorded, the assumption is made the readings are done on room air, without O2 in place.
2. Evaluating risk for poor tissue oxygenation: Thus far, ventilation has been evaluated using the ABG, but both ventilation AND perfusion must be evaluated as part of O2 delivery to the cell level. To objectively and proactively identify the patient at risk for tissue hypoxia, early signs of the perfusion changes that precede increases in serum lactate and the widening anion gap associated with lactic acidosis may be noted. Changes in heart rate (HR), blood pressure (BP), respiratory rate, urine output, saturation of continuous central or mixed venous Hgb, and serum creatinine are common. In the shock setting, normal or near normal PaO2 and SaO2 readings are possible on an ABG while capillary bed dysfunction ensues. Normal readings indicate O2 is being provided in adequate amounts to saturate Hgb effectively; but the ABG is unable to assess whether all tissue beds are receiving O2 or whether the cells are able to use the O2. Until metabolic acidosis ensues due to accumulation of lactic acid byproducts of anaerobic metabolism due to hypoperfusion, the ABG and SpO2 readings may be misleading.
Collaborative management: acute respiratory acidosis
Care priorities
1. Restore effective alveolar ventilation.
• Symmetrical lung expansion: Always check for symmetrical lung expansion, particularly if the patient was recently admitted for trauma, has recently had central line placement, or been recently intubated or extubated. A pneumothorax may be present, which may cause ineffective ventilation.
• Support ventilation: If PaCO2 is greater than 50 to 60 mm Hg, there may be a need to intubate and place the patient on mechanical ventilation, or if already ventilated, there may be a need to reevaluate the ventilation settings. The primary mechanism to treat respiratory acidosis is to increase the tidal volume (VT) and/or the respiratory rate (F), to increase minute ventilation (VT × F). Care must be taken to ensure the adequate minute ventilation; therefore, if low tidal volumes are applied, the respiratory rate may need to be increased. If the lung compliance allows, the flow rate (how rapidly the volume is delivered) may also be increased. This will prolong exhalation time and allow adequate time for CO2 excretion.
• Bronchodilation: Consider the use of inhaled beta-agonists to maintain open airways.
• Although a life-threatening pH must be corrected to an acceptable level promptly, a normal pH is not the immediate goal. Generally, the use of bicarbonate is avoided because of the risk of alkalosis when the respiratory disturbance has been corrected and the secondary effect of blocking the signal to the hemoglobin to release the oxygen (shift to the left). Note: If lactic acidosis is present, the patient has metabolic acidosis, which has resulted from ineffective tissue oxygenation. Supporting ventilation will not resolve lactic acidosis. And bicarbonate may temporarily neutralize the pH, but may actually worsen tissue hypoxia.
3. Evaluate compensation (occurs in the presence of normal renal function).
• Although the kidneys’ response to an abnormal pH level is slow (4 to 48 hours), they are able to facilitate a nearly normal pH level by excreting or retaining large quantities of HCO3− or H+ from the body. Remember that the level of available HCO3− is always opposite the level of H+ present in the plasma. HCO3 is partnered as it buffers H+, which yields carbonic acid.
Compensatory response for acute respiratory acidosis
When the respiratory acid level (CO2) increases, carbonic acid increases and the pH decreases. The increased H2CO3 (carbonic acid) is presented to the kidney, where the H+ is separated from the bond, yielding HCO3−. The “free” bicarbonate (HCO3−) provides additional buffer. In addition, the kidneys excrete the “free” H+ (hydrogen ions) in the urine to reduce the acid level. When the kidneys are functional, the pH decrease seen from increased respiratory acid is less dramatic. The decrease in pH is modified to a small degree by intracellular buffering. To compensate for the acidosis created by increased CO2, K+ ions are released from cellular proteins and H+ ions take their place, bound to the proteins. The result is frequently serum hyperkalemia (reflective of intracellular hypokalemia). This is much more common and dangerous in the presence of metabolic acidosis (particularly diabetic ketoacidosis [DKA]).
pH 7.35: Acid side but in range of normal
PaCO2 55 mm Hg: Acid and outside of range of normal
Problem: Respiratory acidosis, but pH is in range of normal
HCO3− 32 mEq/L: The kidneys took the H2CO3, separated it into HCO3− and H+; then, excreted the H+ and retained the end product, the bicarbonate (made from the CO2).
Chronic respiratory acidosis
Physical assessment
Patients have decreased depth of respirations with an initially increased rate or decreased rate and depth of respirations in severe respiratory acidosis. With obstructive lung disease or acute asthma exacerbation, audible wheezing may be present. With severe asthma, the chest can become silent, indicative gas exchange is extremely impaired, and the patient is close to respiratory arrest.
Monitoring parameters
CARE PLAN: RESPIRATORY ACIDOSIS
related to alveolar-capillary membrane changes secondary to pulmonary tissue destruction
1. Monitor serial ABG results to assess patient’s response to therapy. Consult physician for significant findings: increasing PaCO2 with decreasing pH, PaO2, and SaO2 values.
2. Monitor O2 saturation via pulse oximetry (SpO2). Compare SpO2 with SaO2 values to assess reliability. Watch SpO2 closely, especially when changing FIO2 or to evaluate patient’s response to treatment (e.g., repositioning, chest physiotherapy).
3. Assess and document patient’s respiratory status: respiratory rate and rhythm, exertional effort, and breath sounds. Compare pretreatment findings with posttreatment findings (e.g., O2 therapy, physiotherapy, medications) for evidence of improvement.
4. Assess and document patient’s level of consciousness (LOC). If PaCO2 increases, be alert to subtle, progressive changes in mental status. A common progression is agitation → insomnia → somnolence → coma. To avoid a comatose state caused by rising CO2 levels, always evaluate the arousability of a patient with elevated PaCO2 who appears to be sleeping. Consult physician if the patient is difficult to arouse.
1. Ensure appropriate delivery of prescribed O2 therapy. Assess the patient’s respiratory status after every change in FIO2. Patients with chronic CO2 retention may be very sensitive to increases in FIO2, resulting in depressed ventilatory drive. If the patient requires mechanical ventilation, be aware of the importance of maintaining the compensated acid-base status. If the PaCO2 is rapidly decreased by excessive mechanical ventilation (dropping PaCO2, but a remaining excess of bicarbonate), a severe metabolic alkalosis (posthypercapnic metabolic alkalosis) could develop. The sudden onset of metabolic alkalosis may lead to hypocalcemia or hypokalemia, which can result in tetany (see Hypocalcemia, 57). Severe alkalosis also can precipitate cardiac dysrhythmias.
1. Assess for presence of bowel sounds, and monitor for gastrointestinal (GI) distention, which can impede movement of the diaphragm and further restrict ventilatory effort.
2. Assess for presence of symmetric lung expansion and normal resonance of lung fields. Hyperresonance and asymmetry indicate pneumothorax; dullness and asymmetry indicate solid tissue or fluid occupation of lung or pleural space (e.g., hemothorax, pleural effusion, hyperplasia).
3. In patients who have obstructive lung disease and are not intubated, encourage use of pursed-lip breathing (inhalation through nose, with slow exhalation through pursed lips), which helps airways to remain open and allows for better air excursion. Optimally, this technique will diminish air entrapment in the lungs and make respiratory effort more efficient.
![]() Cough Enhancement, Acid-Base Management, Respiratory Acidosis, Mechanical Ventilation, Artificial Airway Management, Oral Health Maintenance
Cough Enhancement, Acid-Base Management, Respiratory Acidosis, Mechanical Ventilation, Artificial Airway Management, Oral Health Maintenance
Additional nursing diagnoses and interventions:
Nursing diagnoses and interventions are specific to the pathophysiologic process. See Acute Pneumonia, (p. 373), Acute Lung Injury and Acute Respiratory Distress Syndrome, (p. 365) and Acute Respiratory Failure, (p. 383), along with Mechanical Ventilation, (p. 99).
Respiratory alkalosis
Pathophysiology
The problem is alveolar hyperventilation, which results in an increased pH
Acute respiratory alkalosis
Compensatory response to respiratory alkalosis:
• Acute respiratory alkalosis: First 4 to 48 hours HCO3− (and therefore the increase in H+) will decrease 2 mEq/L for every 10 mm Hg decrease in PCO2.
• Chronic respiratory alkalosis: After about 48 hours, the amount of bicarbonate should decrease 4 mEq/L of HCO3 for every 10 mm Hg decrease in PCO2.
Chronic respiratory alkalosis
![]()
• Sodium and potassium: May be decreased slightly to profoundly (potassium will shift from the extra cellular space to the intracellular space in exchange for H+).
• Serum calcium: May be decreased because of increased calcium and bicarbonate binding. Signs of hypocalcemia include muscle cramps, hyperactive reflexes, carpal spasm, tetany, and convulsions.
• Serum phosphorus: May decrease (less than 2.5 mg/dl), especially with salicylate intoxication and sepsis, because the alkalosis causes increased uptake of phosphorus by the cells. No symptoms occur, and treatment usually is not required unless a preexisting phosphorus deficit is present.
