[level-membership-for-pulmolory-and-respiratory-category]Chapter 17
Functional Anatomy of the Cardiovascular System
After reading this chapter, you will be able to:
• Describe the gross anatomy and function of each structure of the heart
• Explain how the atria, ventricles, and heart valves work together to pump blood through the pulmonary and systemic circulations
• Explain why the heart muscle is more blood flow dependent for oxygenation than other muscles in the body
• Explain why extremely high heart rates can result in low cardiac stroke volumes and coronary artery blood flow
• Explain how the specialized cardiac conduction system coordinates the synchronized contraction and relaxation of the atria and ventricles
• Explain how cellular mechanisms, calcium ions, and adenosine triphosphate work together to bring about myocardial contraction and relaxation
• Describe how the Frank-Starling mechanism helps the heart adjust to pump-varying amounts of blood
• Discuss the timing and sequence of all mechanical events in the cardiac cycle
• Explain how pumping action and arterial elasticity work together to produce continuous blood flow
• Explain how different mechanisms work to control the distribution of blood flow through systemic capillary beds
• Explain why high diastolic pressure is more indicative of increased vascular resistance than high systolic pressure
• Explain why independent right ventricular pumping failure produces a different type of circulatory derangement than left ventricular failure
• Describe how local, central, and humoral mechanisms regulate blood pressure
Heart
Gross Anatomy
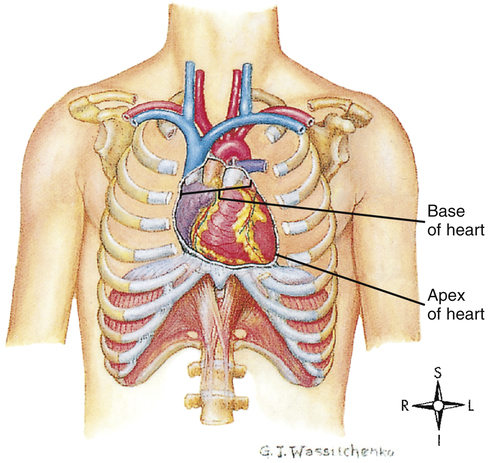
The human heart is a hollow muscular pump about the size of its owner’s closed fist. It lies in the mediastinum of the thorax just behind the sternum (Figure 17-1). About two thirds of its mass is left of the sternal midline.

Pericardium
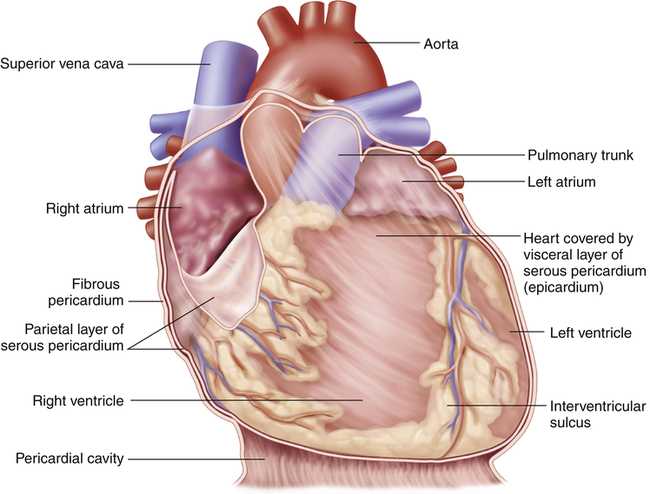
The heart is covered with a loose-fitting membranous sac called the pericardium (Figure 17-3). The pericardium consists of a tough, fibrous outer portion continuous with the connective tissue covering the great vessels. Inferiorly, it attaches to the surface of the diaphragm. The fibrous pericardium limits overexpansion of the heart, holding it in place in the mediastinum. Inside the fibrous pericardium is a thin transparent membrane called the serous pericardium. The serous pericardium is a closed envelope containing a small amount of pericardial fluid. The part of the membrane that lines the inner surface of the fibrous pericardium is the parietal pericardium. The visceral pericardium, also known as the epicardium, is the part of the serous pericardium that is fused to the heart’s surface. The space between the parietal and visceral pericardium is the pericardial space. The fluid in this space lubricates the membranes, allowing smooth, frictionless movement. As the heart beats, it moves easily in its lubricated, fibrous jacket, protected from friction with other mediastinal structures. Figure 17-4 shows a close-up cross-section of the pericardial membranes.
Heart Wall
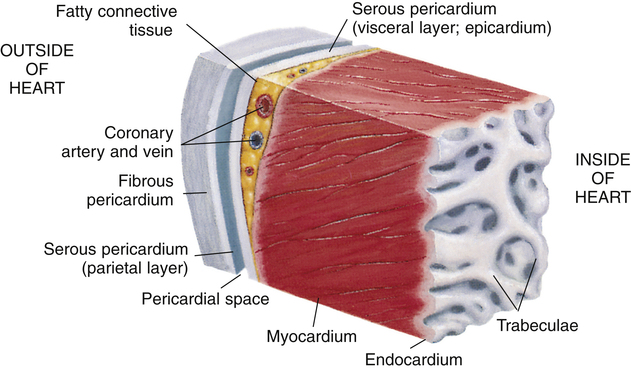
Three layers of tissue form the heart wall (see Figure 17-4): epicardium (visceral pericardium), myocardium, and endocardium. The myocardium is the heart muscle forming the bulk of the heart wall. This muscle wraps around the heart’s chambers in such a way that contraction ejects blood with great force. The endocardium lines the inner surfaces of the heart’s chambers; it resembles the smooth endothelial lining of the blood vessels (see Figure 17-4).
Heart Chambers and Valves
The heart is actually two separate muscular pumps—the right heart and the left heart—connected in sequence. The right heart pumps blood through the pulmonary circulation to the left heart, which pumps blood through the systemic circulation back to the right heart. Each heart consists of two chambers: an atrium located superiorly to a ventricle (Figure 17-5). The atria are weak pumps that prime the more powerful ventricles; they passively funnel blood into the ventricles except when they contract at the last instant to complete the filling process actively.
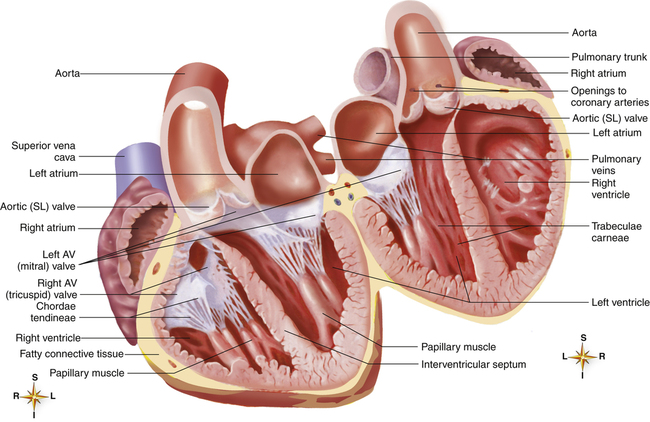
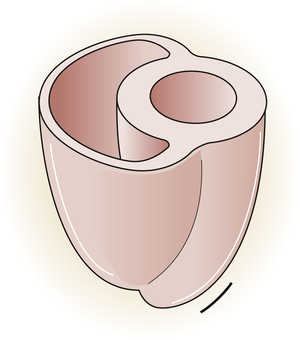
The atria are thin-walled collecting chambers, whereas the ventricles are heavily muscled pumping chambers; the inner surfaces of the ventricles are muscle bundles undercut by open spaces called trabeculae carneae (see Figure 17-4). These irregular surfaces may prevent endocardial wrinkling and damage during ventricular contraction.1 The muscle mass of the left ventricle is greater than the muscle mass of the right ventricle (see Figure 17-5) because the left ventricle pumps against a much greater resistance (systemic vascular resistance [SVR]) than the right ventricle (pulmonary vascular resistance [PVR]). The left ventricle is more spherical in cross-section than the right ventricle (Figure 17-6). The thinner walled right ventricle is crescent-shaped, appearing to wrap partly around and “hug” the left ventricle. This arrangement tends to flatten the right ventricle during left ventricular contraction, aiding ejection of blood by the right ventricle.
Each ventricle has a large outflow tract located superiorly near the AV valves. The right ventricle pumps blood through the pulmonary semilunar valve into the pulmonary trunk, whereas the left ventricle pumps blood through the aortic semilunar valve into the aorta (see Figure 17-5). These valves prevent backflow of blood into the ventricles during ventricular relaxation. The interventricular septum separates right and left ventricles, preventing mixing of oxygenated and unoxygenated blood.
Each ventricle contains cone-shaped pillars called papillary muscles from which thin, strong connective tissue strings (chordae tendineae) attach to tricuspid and mitral valve cusps (see Figure 17-5). The chordae tendineae tether the AV valve leaflets, preventing them from bulging up into the atria and opening during ventricular contraction (called regurgitation). When the ventricles relax, these valves open again, allowing blood to fill the ventricles. Most of the ventricular filling is a passive process; the atria do not contract until very near the end of ventricular relaxation (diastolic) time.
Cardiac Skeleton and Valvular Function
A tough set of connected rings (fibrous annuli) form a semirigid framework to which the heart valves and cardiac muscle are attached (Figure 17-7, A). This framework forms a fibrous skeleton, which is an electrical insulator and a physical barrier between atrial and ventricular muscle masses. The only electrical connection between atrial and ventricular muscle is a single bundle of specialized conductive tissue that penetrates the fibrous skeleton (discussed in a later section).
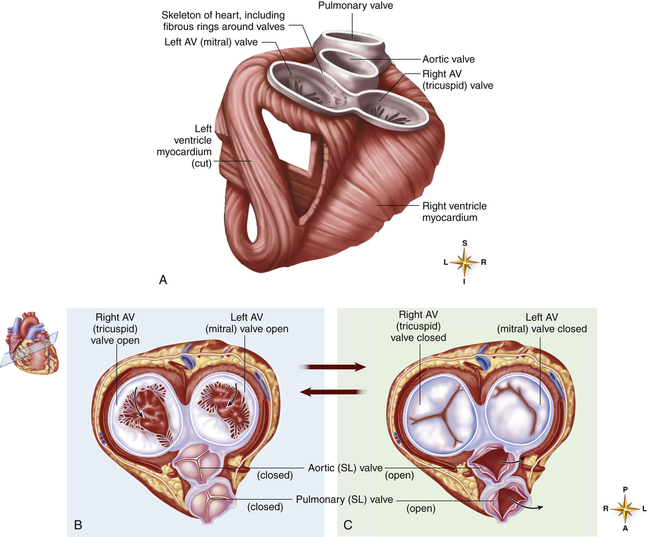
The spiral arrangement of ventricular muscle fibers (see Figure 17-7, A) propels blood upward into the aorta and pulmonary artery during contraction. This action “wrings” blood
out of ventricles from apex to base. As the heart contracts, it rotates to the right, swinging the left ventricle to the front of the chest; this creates the PMI.
The fibrous rings supporting the tricuspid and mitral valves are more compliant than the rings supporting the semilunar valves. For this reason, mitral and tricuspid rings are compressed to smaller sizes during ventricular systole; consequently, their valve cusps are larger than the area to be covered; this ensures a complete seal during contraction.1 If the size disproportion is too great, the valve cusps balloon upward into the atrium during ventricular contraction (prolapse). Heart valve function during ventricular diastole is illustrated in Figure 17-7, B; Figure 17-7, C, illustrates valvular function during ventricular systole. These illustrations correspond with ventricular filling (diastole) and ejection (systole) shown in Figure 17-8, A and B.
The crescent-shaped (semilunar) pulmonic and aortic valve cusps permit them to open fully during ventricular ejection and seal perfectly during ventricular diastole. The aortic diameter is slightly enlarged at the base just above the semilunar valves. This provides a space behind the valve cusps when they open during ventricular ejection, preventing them from occluding the coronary artery orifices.1 Coronary arteries branch off from the aorta immediately above the semilunar valve. The enlarged aortic base also keeps the valve cusps away from the aortic wall. As the ventricles relax, the backflow of blood immediately catches the valve cusps and sharply closes them, preventing blood from flowing back into the ventricles.
Coronary Circulation
Coronary Arteries
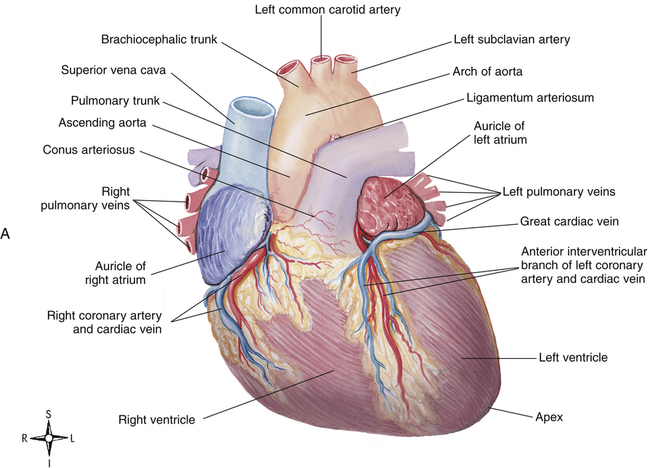
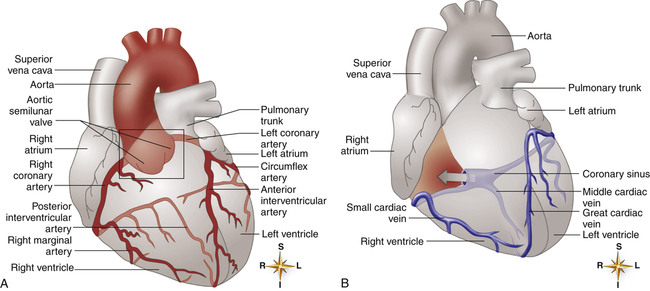
The heart muscle itself receives its blood supply from the right and left coronary arteries, which arise from the aorta immediately above the aortic semilunar valve. These arteries and their branches lie on the heart’s surface (see Figure 17-2); smaller arteries penetrate into the cardiac muscle mass. Figure 17-9, A, illustrates the coronary arterial circulation. The heart relies almost exclusively on the two main coronary arteries for its oxygen supply. The endocardial surface obtains a very small amount of oxygen directly from the blood in the heart chambers.2
Very few connections exist between the major coronary arteries; blood flow can take few detours if its main route becomes obstructed. This lack of collateral circulation explains why sudden coronary artery occlusion, such as occurs with a blood clot, is life threatening. The heart muscle supplied by the occluded artery becomes hypoxic (ischemic), which can lead to myocardial tissue death, or myocardial infarction (MI). If the narrowing of coronary arteries progresses gradually over a long time, some collateral circulation develops to supply ischemic areas; this lessens the chances that a blocked coronary artery will cause an MI.2
Ischemia produced by coronary artery occlusion stimulates myocardial nociceptive (pain-eliciting) fibers, producing the characteristic pain known as angina pectoris.3 This pain is often felt beneath the sternum, in the left arm, and in the neck. Frequent attacks of angina are associated with a greatly increased risk of coronary artery occlusion. About 35% of all deaths in the United States are caused by coronary artery disease.2
The left anterior descending and circumflex branches of the left coronary artery supply the anterior and lateral portions of the left ventricle (see Figure 17-9, A). The right coronary artery supplies the right ventricle and the posterior part of the left ventricle. The left and right atria receive blood from small branches of left and right coronary arteries. The right coronary artery is the dominant supplier of blood to the heart in about 50% of people; in about 30% of people, blood flow is equal through right and left coronary arteries; and the left artery predominates in about 20% of people.2
Coronary Veins
The coronary venous drainage (see Figure 17-9, B) follows a path generally parallel to the path of the coronary arteries. The cardiac veins converge to empty into a large venous cavity within the right atrium, the coronary sinus. In addition, the thebesian veins (not shown) empty directly into all heart chambers; this venous drainage into the left heart contributes to the normal anatomical shunt that prevents arterial blood from being fully saturated with oxygen. About 75% of coronary venous flow is through the coronary sinus.2
Oxygen Requirements and Coronary Blood Flow
Even at rest, the myocardium extracts about 70% of the oxygen from its arterial blood flow compared with a 25% extraction rate for the whole body.2 During exercise, this extraction rate is higher still. Because heart muscle cannot extract much additional oxygen from the blood, the only way it can receive more oxygen is through increased coronary blood flow. Myocardial oxygenation is highly dependent on blood flow.
Myocardial oxygen need is the major factor governing coronary blood flow. Increased metabolic activity and myocardial hypoxia cause the release of a potent coronary vasodilator called adenosine.3
Diastolic Time and Coronary Blood Flow
At rest, coronary blood flow is about 225 mL per minute, or between 4% and 5% of the cardiac output; during heavy exercise, coronary blood flow can triple or quadruple to meet the extra oxygen demands of the myocardium.2 Most coronary perfusion occurs during ventricular relaxation (diastole), opposite to flow through other vascular beds of the body. The powerful contractile force of the ventricles during systole compresses the coronary vessels, momentarily stopping or reversing the direction of their blood flow.3 Thus, sufficient diastolic time (normally about two times as long as systolic time) is important for adequate coronary blood flow. Extreme tachycardia, especially in persons with narrowed coronary arteries, may shorten diastolic time so much that coronary blood flow becomes inadequate. In healthy people, the effect of this shortened diastolic time is overridden by the coronary vasodilation that occurs with increased myocardial oxygen demand.
Cardiac Conduction System
A specialized system of modified cardiac muscle tissue (distinct from nerve tissue) conducts regular electrical impulses that stimulate rhythmic, synchronized heart muscle contractions. This conduction system also transmits the impulses rapidly and uniformly throughout the heart, much more rapidly than over regular myocardial fibers. Rapid and uniform conduction of electrical impulses is important to ensure effective, properly timed pumping action of the heart. With normal impulse conduction, the atria contract to complete the ventricular filling process about one sixth of a second before the ventricles contract.2 Figure 17-10 illustrates the electrical conduction system of the heart.
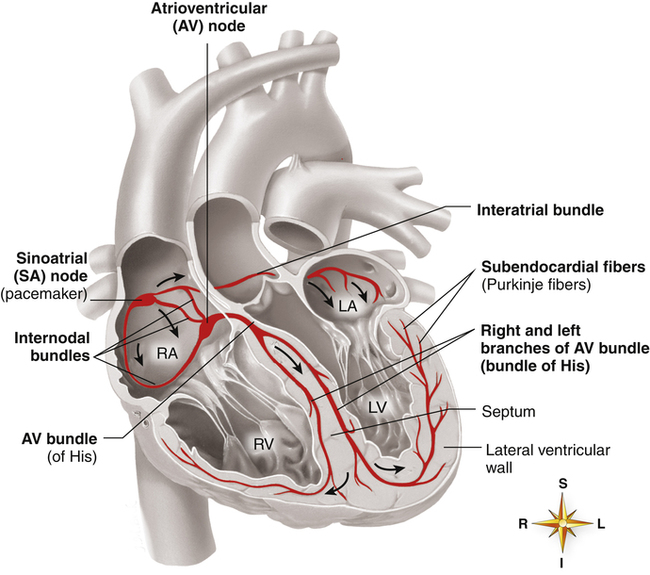
The sinoatrial (SA) node, embedded in the right atrial muscle near the superior vena cava, is responsible for initiating the electrical impulses that produce sequential atrial and ventricular contraction. The impulses of the SA node travel over specialized internodal pathways to the atrioventricular (AV) node at a velocity of about 1 m per second (regular atrial muscle conducts impulses at about 0.3 m per second). The AV node and the AV bundle slow the impulse velocity considerably before transmitting it into the ventricles. It takes the SA node impulse about 0.03 second to reach the AV node, which along with the AV bundle delays the impulse another 0.13 second before conducting it on to the ventricles; thus, about 0.16 second elapses from the time the SA node generates its impulse until the ventricles receive the signal.2 This transmission delay prevents impulses from arriving at the ventricles too rapidly in succession; in this way, the ventricles have enough time to fill between contractions.
impulses at a velocity up to 4 m per second, which is about six times faster than the impulses can travel over regular ventricular muscle. It takes these impulses about 0.03 second to travel from the AV bundle to the Purkinje fibers, where they normally stimulate rapid, simultaneous ventricular contractions.2
Innervation
Sympathetic fibers are distributed throughout the entire heart. Cardiac sympathetic receptors are mainly of the β1 type. When stimulated, they increase the myocardial force of contraction and heart rate. In contrast, parasympathetic fibers are distributed mostly to atrial muscle and the SA and AV nodes where their stimulation slows the heart rate. Although parasympathetic innervation of the ventricles is sparse, parasympathetic stimulation can decrease myocardial force of contraction by 30%.2
Cardiac Muscle Properties
General Mechanism of Muscle Contraction
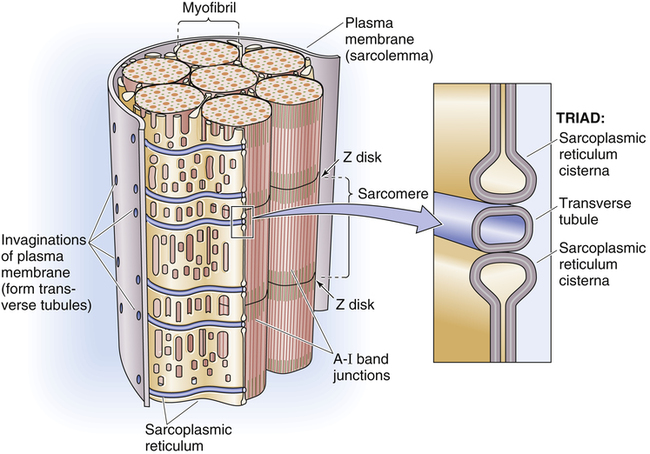
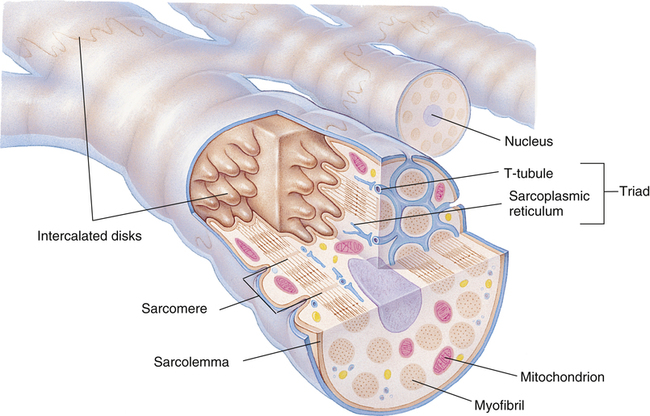
Gross muscle is composed of muscle bundles, which contain numerous muscle fibers or cells (myocytes) extending the length of the muscle (Figure 17-11, A). Each myocyte is bounded by a complex cell membrane called the sarcolemma; the cell’s protoplasm is known as the cytoplasm. Numerous mitochondria are located immediately beneath the sarcolemma and throughout the cytoplasm; these intracellular organelles generate adenosine triphosphate (ATP), the energy-rich molecules that power muscle contraction. At regular intervals along the length of the fiber, the sarcolemma dips deeply into the cell’s interior, forming a T-tubule (see Figure 17-11); this allows electrical impulses to travel deep inside the muscle cell. The sarcoplasmic reticulum is an intracellular system of membranous tubules that spread throughout the muscle fiber; this organelle forms an extensive interconnected network of canals that converge to form a single tube alongside the T-tubules. The sarcoplasmic reticulum is a storehouse for calcium ions. As shown in Figure 17-12 (inset), the T-tubule is sandwiched tightly between two sarcoplasmic reticulum tubules or cisterna, forming a so-called triad. Electrical impulses within the T-tubule stimulate the adjacent sarcoplasmic reticulum tubules, causing them to release calcium ions into the cell’s cytoplasm through specialized calcium release channels. Calcium ions are essential for muscle contraction, as explained later.
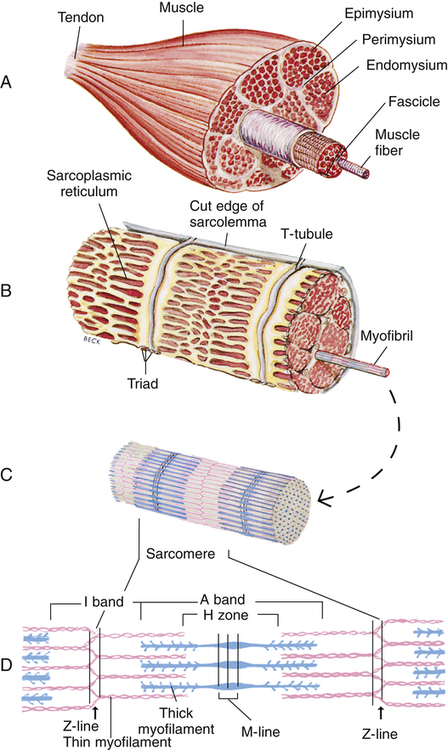
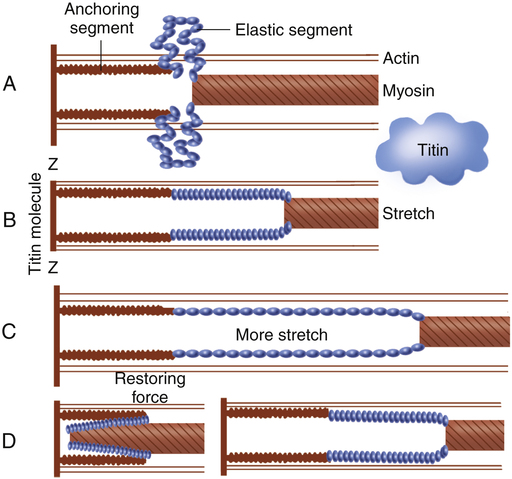
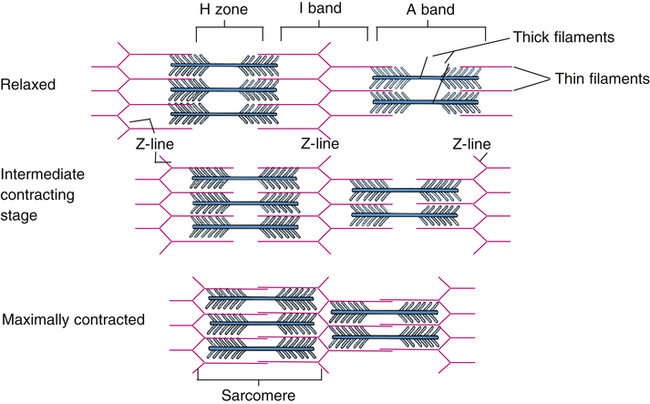
Each muscle fiber consists of numerous myofibrils (see Figures 17-11, B and C, and 17-12), which are composed of numerous myofilaments. Myofilaments are mainly composed of the contractile proteins myosin and actin. The configuration of the thick myosin and thin actin myofilaments give the myofibrils a banded or striated appearance. As shown in Figure 17-11, D, the thin actin filaments are anchored to protein disklike structures, which form the Z-line. The basic contractile unit, the sarcomere, extends from Z-line to Z-line. The thick myosin filaments in the center of the sarcomere extend between the actin filaments on both sides toward the Z-lines (see Figure 17-11, D). Titin, a giant elastic protein molecule, tethers the myosin filament to the Z-line (Figure 17-13). The titin molecule is composed of an inflexible anchoring segment and a flexible elastic segment that stretches as the sarcomere elongates during cardiac diastole. The more the titin molecule stretches as the heart fills with blood, the more vigorously it recoils when the heart contracts; this helps explain the Frank-Starling mechanism (discussed later).4 During muscle contraction, the actin myofilaments slide toward each other over the myosin filaments, bringing the Z-lines closer together and shortening the sarcomere (Figure 17-14); neither actin nor myosin filaments actually shorten. As numerous sarcomeres shorten, the muscle fiber as a whole shortens.
Excitation-Contraction Coupling
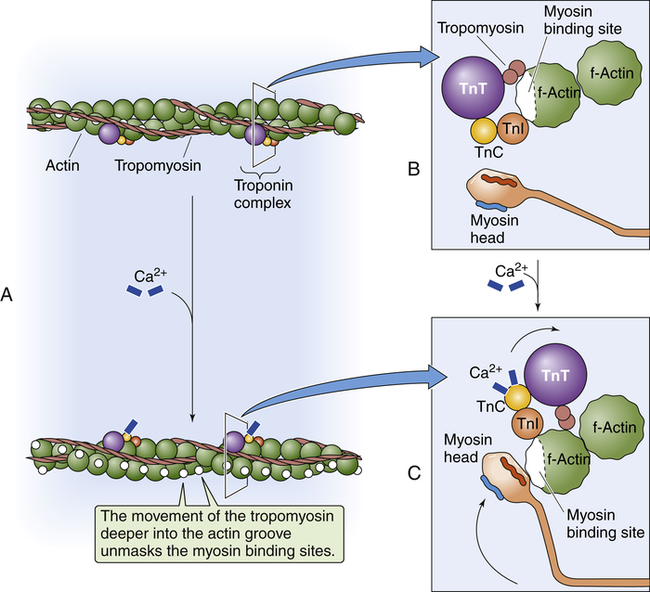
Figure 17-15 shows the microanatomy of the thin actin and thick myosin filaments. Thin filaments are composed of two beadlike actin strands twisted in a helical fashion around a “backbone” of stringlike tropomyosin molecules (see Figure 17-15). In the relaxed state, these “strings” of tropomyosin are situated in such a way that they block specialized binding sites on the actin molecules to which myosin filaments are attracted (Figure 17-16, A [top]).4 At regular intervals along the twisted actin-tropomyosin structure are troponin molecules, a complex of three protein subunits tightly bound together: troponin I (TnI), troponin T (TnT), and troponin C (TnC) (Figure 17-16, A [top] and B). TnC binds calcium ions, TnI binds to actin, and TnT binds to tropomyosin; the entire troponin complex is attached to the actin filament. The TnI subunit is responsible for inhibiting actin-myosin interaction when the myocardial fiber is in the relaxed state (see Figure 17-16, B); that is, TnI interacts with TnT to hold the tropomyosin molecule in a position that blocks the binding sites of the actin molecule.4
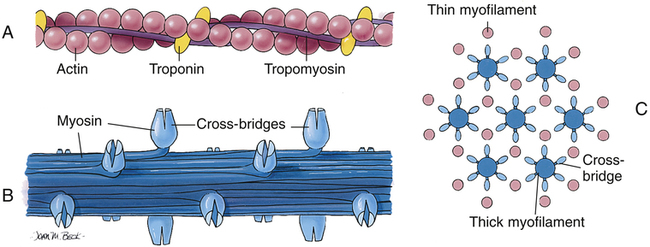
The thick myosin filaments (see Figure 17-15, B) consist of numerous individual myosin molecules shaped like golf clubs. Their “shafts” form the length of the myosin bundle with clublike “heads” sticking outward, attracted to the covered binding sites of adjacent actin molecules. The myosin heads are known as cross-bridges
Contraction occurs when a nerve impulse causes acetylcholine to stimulate the muscle cell sarcolemma. The impulse travels deep into the T-tubules causing the sarcoplasmic reticulum to release Ca++ ions, which bind with and activate TnC. Activated TnC initiates a complex interaction among all three troponin subunits that removes the inhibitory effect of TnI; this repositions the tropomyosin molecule to expose the binding sites of the actin molecule (see Figure 17-16, A [bottom] and C).
Figure 17-17 illustrates the sequence of events that occur in actin and myosin filament cross-bridge formation; at the top of the figure, the myosin head is still attached to binding sites on the actin filament from the previous cross-bridge cycle. In (1), ATP binds with the myosin head, which reduces its affinity for actin and causes it to detach. In (2), ATP is broken down (hydrolyzed) into adenosine diphosphate (ADP) and inorganic phosphate (P) on the myosin head, causing it to swivel on its hinge so that it is positioned immediately across from a new
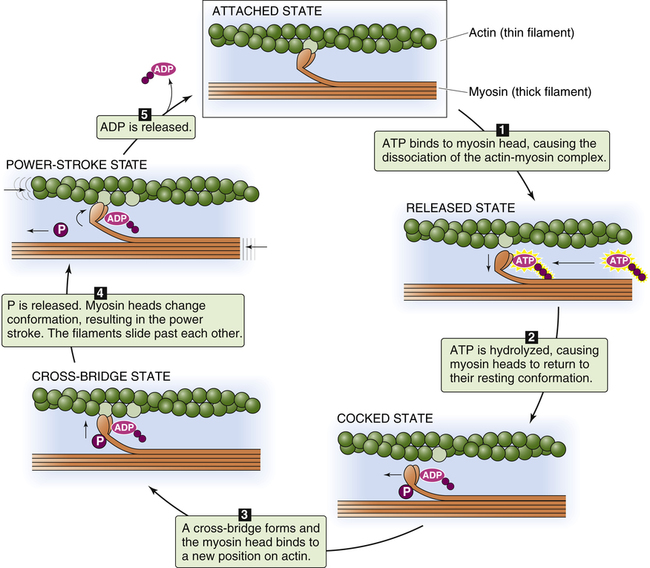
binding site farther along on the actin filament. In (3), the myosin head binds to its new position on the actin filament, forming a cross-bridge. This action causes the inorganic phosphate molecule to dissociate from ADP, which causes the myosin head (still attached to the actin filament) to flex on its hinge, pulling the actin filament toward the myosin filament’s tail (the “power stroke”). This action causes ADP to dissociate from the myosin head (5), leaving the actin-myosin complex in a rigid state (top figure). In the absence of ATP, the strong binding state between myosin and actin persists, which would potentially prevent the contractile proteins from relaxing (this occurs soon after death because ATP cannot be generated, creating a state known as rigor mortis). In living muscle cells, metabolism generates new ATP molecules that react with the myosin heads and pull them back to their resting position, restarting the cycle (1) (see Figure 17-15, A). This sequence of events, known as cross-bridge cycling, repeats many times per second and continues as long as ATP molecules are produced and available. Relaxation of the muscle occurs when the nerve impulse ceases; sarcoplasmic reticulum rapidly pumps Ca++ back into its storage sites. When calcium ions leave TnC, the entire troponin complex undergoes a conformational change, which moves tropomyosin back to its blocking position.
Cardiac Muscle
Cardiac muscle differs from skeletal muscle in that individual muscle fibers are joined end-to-end to other fibers through junctions called intercalated disks (Figure 17-18). These disks are cell membranes (sarcolemma) separating individual cardiac muscle cells. That is, cardiac muscle is made up of many individual cells joined together in series. The electrical resistance through the intercalated disks is about one four-hundredth of the resistance through the outside muscle fiber membrane.2 A reason for this low resistance is that cell membranes fuse at places along the disks, forming so-called gap junctions, which allow free passage of ions between cells. Functionally, the entire cardiac muscle mass acts as a single muscle fiber; for this reason, the myocardium is known as a syncytium.2 If one fiber in the syncytium contracts, all fibers contract (“all-or-none” principle). The heart consists of two distinctly separate syncytia: the atrial syncytium and the ventricular syncytium. These two syncytia are electrically connected only by the AV bundle.
Frank-Starling Mechanism: Sarcomere Length–Dependent Activation
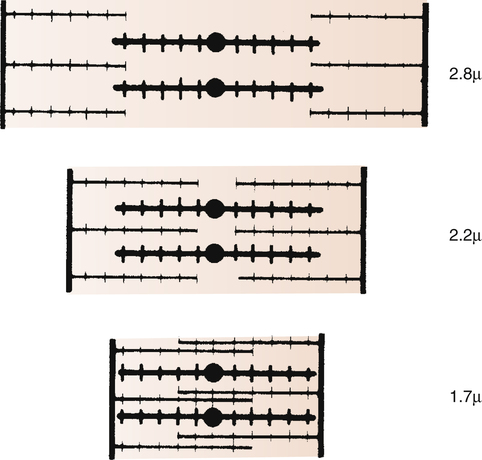
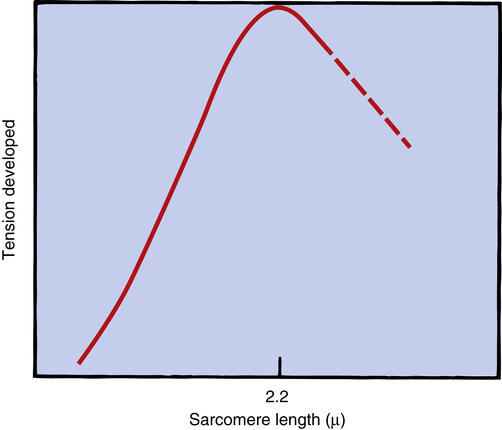
The inherent ability of the heart to increase its force of contraction as increasing amounts of blood flow into it is known as the Frank-Starling mechanism, named after two physiologists of the late nineteenth and early twentieth centuries.2 Frank and Starling observed that the greater the diastolic volume of the heart, the greater the force of contraction. This phenomenon occurs in hearts removed from the body and is thus independent of neural mechanisms. The force of myocardial contraction is proportional to the rate of cross-bridge formation between actin and myosin filaments, which is influenced by the sarcomere’s length (length-dependent activation).4 The exact mechanism is incompletely understood. The traditional explanation is that myocardial stretch brings actin and myosin filaments into a more optimal degree of overlap for cross-bridge formation. Figure 17-19 shows that too much stretch disengages some cross-bridges, whereas extremely foreshortened fibers cause actin filaments to bypass one another and overlap. A more current view is that an increase in sarcomere length increases the sensitivity of TnC to calcium, which increases the rate of cross-bridge cycling.4 In addition, the passive recoil of stretched titin molecules also may contribute to increased contractile force; a combination of mechanisms is probably at work.4 Whatever the mechanism, a precontraction sarcomere length of about 2.2 µ is associated with the greatest force of contraction.4
The precontraction length of the cardiac muscle fiber is known as the heart’s preload. The clinician can measure ventricular preload by measuring ventricular filling pressure just before contraction (end-diastolic pressure). The assumption is that greater end-diastolic pressures stretch the muscle fibers to greater lengths. In clinical terms, the Frank-Starling mechanism states, “the greater the preload, the greater the force of contraction.” This statement is true only to a point because too much fiber stretch decreases the force of contraction (Figure 17-20).
Cardiac Cycle
The cardiac cycle refers to a complete pumping cycle, consisting of contraction (systole) and relaxation (diastole) of both atria and ventricles. The average cycle from the beginning of systole to the end of diastole lasts about 0.8 second. Figure 17-21, known as a Wiggers diagram,4 graphically illustrates the sequence of events.
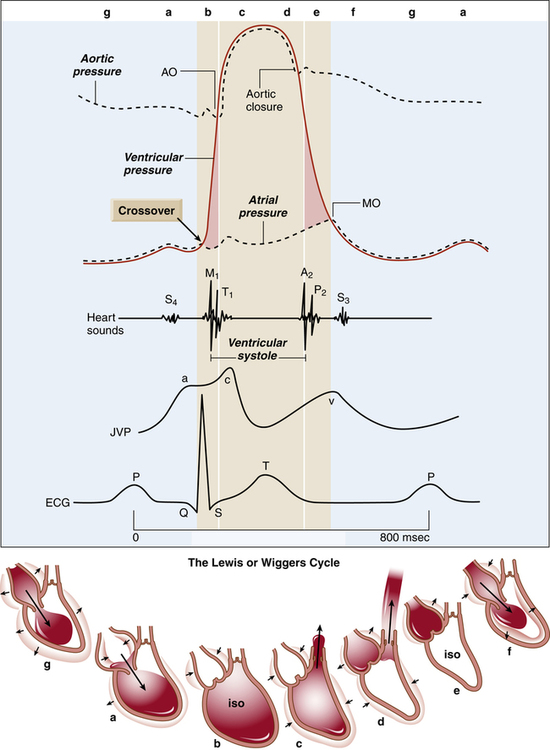
Ventricular Filling (Preload)
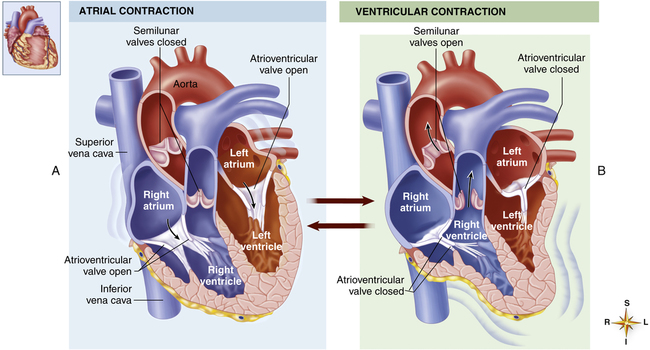
As soon as the ventricles relax, the pressure that accumulated in the atria during ventricular contraction pushes the AV valves open, and blood rushes into the ventricles, creating a rapid filling phase (see Figure 17-21, f) and a slow filling phase (see Figure 17-21, g). As blood leaves the atria, atrial pressure decreases abruptly and is only slightly higher than ventricular pressure as blood continues to drain into the ventricles. During the last 0.1 second of ventricular filling time, the atria contract (atrial kick) and force an additional amount of blood into the ventricles, distending their walls slightly (see Figure 17-21, a). About 80% of ventricular filling is passive; the remaining 20% is caused by the atrial kick.2 The atria are mere priming pumps for the ventricles, completing the “preloading” process.
Ventricular Emptying
Contraction of the ventricles rapidly builds up pressure, forcefully snapping the AV valves closed; this creates the first heart sound (see Figure 17-21, M1 and b). A fraction of a second passes before the ventricular pressure increases enough to push the aortic and pulmonary semilunar valves open against the opposing aortic and pulmonary artery pressures. During this brief time, no blood leaves the ventricles (see isovolumetric contraction, Figure 17-21, b). The ejection period occurs immediately after aortic and pulmonary semilunar valves open (see Figure 17-21, AO); the resistance to this ejection is called afterload. Blood flow is rapid early in the ejection period, slowing as the ventricle ends its systolic phase (see Figure 17-21, c and d).
Ventricular Relaxation
As the ventricles relax, their pressures fall below the pressures of the aorta and pulmonary artery, causing aortic and pulmonary semilunar valves to snap shut, creating the second heart sound (see Figure 17-21, aortic closure). Closure of these valves abruptly stops backflow of blood into the ventricles, causing blood to rebound and send shock waves back into the aorta and pulmonary artery. Consequently, these elastic vessels dilate slightly and then recoil back to their original shapes. This vascular recoil helps push the blood forward in the arteries during ventricular diastole, creating the dicrotic notch in the aortic and pulmonary artery pressure waveforms (see aortic pressure dashed line in Figure 17-21, immediately after aortic valve closure).
A fraction of a second passes before ventricular pressures decrease enough to allow AV valves to open again. This time period is called isovolumetric relaxation (see Figure 17-21, e). Passive ventricular filling then begins, and the cycle is repeated.
The end-diastolic volume of each ventricle is about 110 to 120 mL.2 Contraction ejects about 70 mL of blood (stroke volume), leaving behind about 40 to 50 mL (end-systolic volume). The filled ventricles normally eject about 60% of their volume (ejection fraction). A low ejection fraction (<50%) indicates poor contractility and pumping failure. Very powerful contractions during exercise can increase the ejection fraction to about 90%.2
Regulation of Heart Pumping Activity
Frank-Starling Mechanism
Sympathetic and Parasympathetic Stimulation
Strong sympathetic stimulation can increase the heart rate from a normal 70 beats per minute to about 180 to 200 beats per minute and can double the force of contraction, resulting in a cardiac output two or three times greater than when at rest.2 Drugs that mimic sympathetic stimulation (catecholamines) have the same effect. Drugs that block sympathetic activity have the opposite effect. Sympathetic activity is increased during exercise and anxiety. Inhibition of sympathetic activity decreases heart rate and force of contraction and can reduce cardiac output by as much as 30% below normal.2
Parasympathetic (vagal) stimulation primarily affects the atria, slowing the heart rate and, to a lesser extent, decreasing the force of contraction. Strong vagal stimulation causes severe bradycardia (slow heart rate) and can cause momentary cardiac arrest; however, the ventricles, which have much less vagal innervation than the atria, usually “escape” the influence of the atria and set up a rhythm of their own at a rate of about 20 to 40 contractions per minute.2 The trachea is richly supplied with vagal nerves. For this reason, the common respiratory care practice of inserting a catheter into the trachea to remove accumulated secretions may stimulate severe bradycardia or momentary cessation of the heartbeat.
Effect of Heart Rate
An increased heart rate generally increases cardiac output, but this effect is limited when heart rate exceeds 170 to 220 beats per minute.2 Above this critical range, diastolic time becomes so short that blood flow from the atria does not have enough time to fill the ventricles completely. The volume of blood the ventricles can eject with each stroke is reduced, offsetting the increase in cardiac output that normally accompanies increased heart rate.
Vascular System
Forces Responsible for Perfusion Pressure
The arterial system is composed of a pump (the left ventricle) attached to a system of low-resistance, distensible tubes (arteries), ending in high-resistance terminal vessels (arterioles). This arrangement creates a damping effect that converts the heart’s intermittent, pulsatile output into steady flow through the capillary beds.2
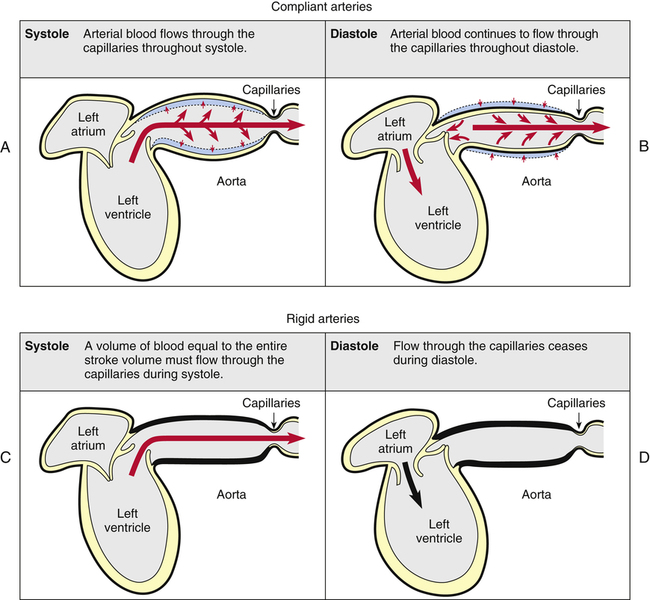
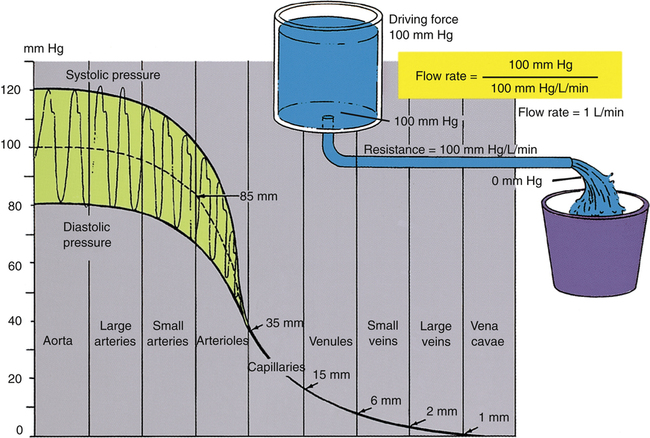
We generally tend to think the heart alone provides the pressure needed to propel blood through tissue capillary beds, but this is not entirely true. Perfusion pressure is maintained by the heart’s pumping action combined with the elastic recoil force of the arteries. Figure 17-22 illustrates this point. A single ventricular contraction discharges the stroke volume into the arteries, lasting about one third of the cardiac cycle duration. Much of the contraction’s force propels blood forward through the arteries, but some of the force distends the arteries to larger diameters (Figure 17-22, A). When the ventricle relaxes, its outflow stops, but the recoil force of the distended arteries continues to move the blood forward during ventricular diastole (Figure 17-22, B). Thus, blood flow through the capillaries is continuous. Hypothetically, if arterial walls were perfectly rigid, the entire stroke volume would flow through the capillaries in a single contraction; because arterial walls could not recoil, blood flow would cease during diastole (Figure 17-22, C and D). Although this extreme situation does not occur in the body, vascular diseases that reduce vessel wall compliance (arteriosclerosis) have a similar effect, creating a wide difference between systolic and diastolic pressures.
Vascular Structure
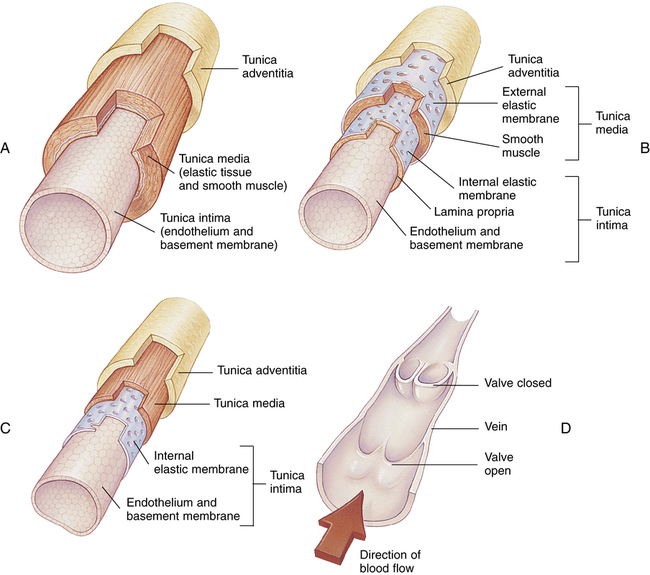
Figure 17-23 compares the structures of arteries and veins. All have similar general features. However, arterial muscular layers are generally thicker than their venous counterparts; thus, arteries have greater constricting ability. The largest arteries (see Figure 17-23, A), often called conducting arteries, have more elastic tissue and less smooth muscle than smaller arteries and arterioles. Pressures are relatively high in them, fluctuating markedly between systolic and diastolic phases of the heartbeat.
Near the point at which capillaries originate, smooth muscle in the arterioles forms precapillary sphincters (Figure 17-24). These circular bands of muscle control blood flow through local capillary beds. Hypoxia dilates precapillary sphincters, increasing blood flow. At rest, some of the sphincters are constricted, reducing blood flow to tissues with low metabolic activity. During strenuous activity, precapillary sphincters dilate, opening (recruiting) more capillaries to meet local tissue blood flow needs.
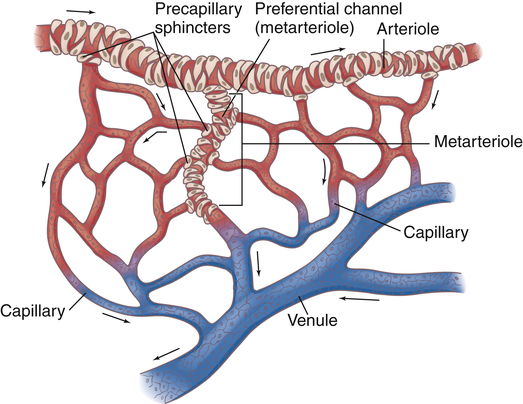
The capillary circulation is often called the microcirculation (see Figure 17-24). Capillary walls consist of a single layer of endothelial cells with no muscle tissue whatsoever; they have no intrinsic ability to constrict or dilate. Capillary diameters are determined passively, solely by the volume and pressure of blood within them, which is controlled by the precapillary sphincters. Besides oxygen and carbon dioxide exchange between blood and tissues, nutrient and waste product exchange also occur across the capillary cell walls.
Capillaries converge to form venules. A relatively direct connection between arterioles and venules is called an arteriovenous anastomosis, or thoroughfare channel (see Figure 17-24). In this way, blood can shunt past tissue capillary beds directly to the venous circulation, especially when local tissue metabolic needs are low. This kind of shunting is thought to be present in critically ill patients with septic shock. Septic shock is characterized by profound vasodilation and altered oxygen-extraction capabilities of the tissue cells. For example, venous oxygen saturation could be normal or elevated in patients with septic shock even though severe tissue hypoxia is present.5 This occurs because blood is shunted past tissue capillary beds through thoroughfare channels and fails to release adequate oxygen. For this reason, mixed venous oxygen content is an unreliable indicator of cardiac output changes in patients with septic shock (see Chapter 8 discussion of the Fick cardiac output equation).
Venules converge to form veins (see Figure 17-23, C and D). Veins contain much less smooth muscle and are generally much more distensible than arteries. Larger veins contain one-way valves (see Figure 17-23, D) to aid venous blood flow toward the heart against gravitational force. Many such veins exist in the legs where the muscles squeeze them, producing a “milking” action, propelling blood upward to the heart. For this reason, muscular activity in the lower extremities is important to prevent venous “pooling” and impaired venous circulation. This venous “pooling” explains the uncomfortable feeling one has in the legs after long periods of standing still or sitting.
Venous Reservoir
Because of their distensibility, the veins contain by far the greatest proportion of the blood volume at any given time (Table 17-1). Veins are an important blood reservoir, containing about 64% of the total blood volume. When large amounts of blood are lost from the body, reflex sympathetic venous constriction shifts blood into the arterial system. This compensatory venous constriction allows essentially normal circulatory function, even after 20% of the total blood volume is lost.2
TABLE 17-1
Distribution of Blood Volume in Blood Vessels
| Vessels | Total Blood Volume (%) |
| Systemic veins | 64 |
| Large veins (39%) | |
| Small veins (25%) | |
| Arteries | 15 |
| Large arteries (8%) | |
| Small arteries (5%) | |
| Arterioles (2%) | |
| Capillaries | 5 |
| Total in systemic vessels | 84 |
| Pulmonary vessels | 9 |
| Heart | 7 |
| Total blood volume | 100 |
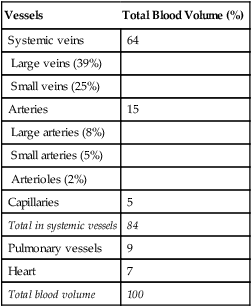
From Seeley RR, Stephens TD, Tate P: Anatomy & physiology, ed 3, New York, 1995, McGraw-Hill.
Arterial Blood Pressure, Velocity, Flow Rate, and Resistance
Blood Pressure
Blood pressure in large and medium-sized arteries varies considerably between systolic and diastolic pressures. The difference between these two pressures (pulse pressure) diminishes as blood flows farther away from the heart. The pulse pressure is influenced by stroke volume and arterial compliance. Increased stroke volume increases systolic pressure and thus increases pulse pressure. Decreased arterial compliance, as occurs with age or vascular disease, causes aortic pressure to rise higher and more sharply during systole and to fall more abruptly during diastole (see earlier discussion). For a given stroke volume, systolic pressure and pulse pressure are higher if arterial compliance is low. Figure 17-25 illustrates blood pressures in various parts of the systemic vascular system. Notice the progressive decline in pressure from aorta to vena cava and the lack of a pulsatile pressure waveform in the capillaries and venous system. This occurs because systolic and diastolic pressure fluctuations are dampened by the high-resistance arterioles.
Mean Arterial Pressure
Mean arterial pressure (MAP) is not simply the average of systolic and diastolic pressures as implied in Figure 17-25. The heart remains in systole for about one third of the cardiac cycle duration; thus, the arteries are exposed to the systolic pressure one third of the time and the diastolic pressure two thirds of the time. MAP is roughly estimated by the following equation:
< ?xml:namespace prefix = "mml" />

The greatest fall in MAP occurs across the high-resistance arterioles: blood pressure is 85 mm Hg on entering the arterioles and 35 mm Hg on exiting them (see Figure 17-25). The reason for this large fall in MAP is that the arterioles offer the greatest resistance of any circulatory component. Flow across a resistance always produces a drop in pressure; the greater the resistance, the greater the pressure drop downstream from the site of resistance.

Blood Flow Rate and Velocity
For a given driving pressure, an increased resistance decreases blood flow.
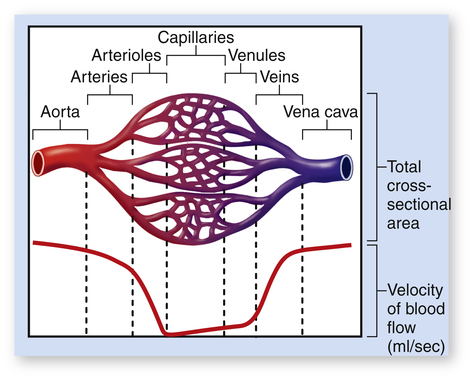
Although total blood flow rate throughout the vasculature is fairly constant under steady-state conditions, blood velocity is not constant. Velocity refers to the speed with which blood flows, or distance traveled per minute. Velocity is distinct from flow rate; flow rate is volume moved per minute. Given a constant blood flow rate, velocity is determined by the summative cross-sectional area of the vascular components. For example, the aorta’s cross-sectional area is about 5 cm2, and the millions of capillaries have a combined cross-sectional area of about 2500 cm2. For a cardiac output of 5 L per minute, blood velocity in the aorta is very high, but blood velocity in capillaries is very low (Figure 17-26). For this reason, aortic blood flow is normally turbulent, whereas capillary blood flow is laminar.
Determinants of Systolic and Diastolic Blood Pressure
On the other hand, for a given heart rate, stroke volume, and arterial compliance, diastolic pressure depends purely on the peripheral vascular resistance.6 If peripheral resistance decreases, blood runoff rate from the arterioles is greater, decreasing the diastolic pressure. Increased peripheral resistance slows arteriole runoff rate, increasing the diastolic pressure. In other words, if peripheral vascular resistance is high, the vascular pressure falls so slowly during the diastolic time interval that systole occurs before the pressure can fall to its normal diastolic level. That is, how rapidly and how far vascular pressure falls from its systolic peak depends on arteriole runoff rate.
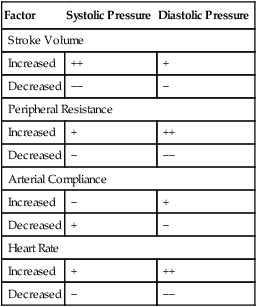
An increased heart rate also may increase diastolic pressure for a given peripheral vascular resistance. The mechanism is similar to that just described; the shortened diastolic time interval does not allow vascular pressure to fall to its normal diastolic level. Table 17-2 summarizes the isolated effects of various factors on systolic and diastolic pressures.
TABLE 17-2
Effect of a Given Factor on Systolic and Diastolic Pressures When Other Factors Are Constant
| Factor | Systolic Pressure | Diastolic Pressure |
| Stroke Volume | ||
| Increased | ++ | + |
| Decreased | −− | − |
| Peripheral Resistance | ||
| Increased | + | ++ |
| Decreased | − | −− |
| Arterial Compliance | ||
| Increased | − | + |
| Decreased | + | − |
| Heart Rate | ||
| Increased | + | ++ |
| Decreased | − | −− |
Modified from Little RC: Physiology of the heart and circulation, ed 4, Chicago, 1989, Year Book Medical Publishers.
Hypertension
Hypertension, or high blood pressure, usually refers to a MAP greater than 110 mm Hg at rest; this coincides with a diastolic pressure of about 90 mm Hg and a systolic pressure of about 135 to 140 mm Hg.2 The detrimental effects of hypertension occur in three major ways:2 (1) excessive workload on the heart, leading to heart failure; (2) rupture of a major blood vessel in the brain, known as a stroke or cerebrovascular accident (CVA); and (3) multiple kidney hemorrhages leading to extensive renal tissue destruction.
flows from the arterioles into the capillary beds. High arteriolar resistance slows the rate at which the peak pressure achieved during systole falls during diastole; this causes diastolic pressure to be higher than normal when the next ventricular contraction occurs. In the end, systolic pressure and MAP also increase.
About 90% of all people with hypertension have essential hypertension, or hypertension of unknown origin.2 The peripheral vascular resistance in these individuals is about 40% to 60% above normal, about the same amount that MAP is increased.
Venous Pressures
Right Atrial Pressure
Pressure in the right atrium is determined by the heart’s ability to pump blood out of it and the rate at which blood flows back into it from the vena cava. Powerful pumping action decreases RAP, whereas ineffective, weak pumping allows blood to dam up and increase RAP. Rapid return of venous blood to the right atrium tends to increase RAP. Venous blood flow increases if (1) there is an increased blood volume (e.g., intravenous fluid infusion); (2) venous tone increases, elevating venous pressures; and (3) arteriolar dilation occurs, causing more rapid blood flow into the venous system.2 RAP can be thought of as the preload of the right ventricle—that is, RAP is the “loading” or “filling” pressure of the right ventricle just before it contracts. In this way, RAP helps determine stroke volume and cardiac output (Frank-Starling mechanism). Normal RAP is about 0 to 5 mm Hg.
Peripheral Venous Pressure
Peripheral venous pressure is not affected by RAP until it increases to about 6 mm Hg.2 At that pressure, the veins are distended enough that their pressures rise with further RAP increases. Pumping failure of the heart—congestive heart failure—is a major reason for the elevation of venous pressure. If systemic venous pressure rises high enough, it may be transmitted back into the capillary beds and force fluid out into interstitial spaces. This kind of fluid accumulation on the venous side of systemic capillary beds is known as peripheral edema and is a sign of right ventricular failure. In such cases, structures upstream from the right atrium (jugular veins, liver, abdominal viscera, leg veins) become engorged with dammed-up blood and swell. These events result in jugular venous distention (JVD), hepatomegaly (enlarged liver), ascites (fluid accumulation in the abdominal cavity), and pedal edema (edema of the ankles and feet).
Normal peripheral venous pressures are affected by gravitational forces. Beginning at the right atrium, where pressure is about 0 mm Hg, venous pressure increases to about 22 mm Hg in the lower abdominal cavity, to 40 mm Hg in the femoral veins, and to 90 mm Hg in the feet.2 (These pressures apply to an adult standing perfectly still.) Thus, a gradient normally exists for venous blood return to the heart.
Vascular System Regulation
Local Control
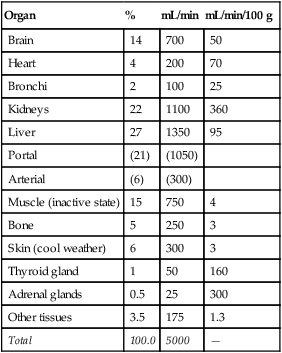
Blood flow varies widely from organ to organ depending on the organ’s metabolic needs or its functional purpose. Table 17-3 summarizes the blood flow to different organs. Generally, the higher the metabolic rate of the tissue, the greater its blood flow. Per gram of tissue weight, glandular structures receive a very high blood flow (see Table 17-3); likewise, the kidneys receive a high blood flow relative to their mass. High renal flow is necessary to cleanse the blood of waste products.
TABLE 17-3
Blood Flow to Different Organs and Tissues under Basal Conditions
| Organ | % | mL/min | mL/min/100 g |
| Brain | 14 | 700 | 50 |
| Heart | 4 | 200 | 70 |
| Bronchi | 2 | 100 | 25 |
| Kidneys | 22 | 1100 | 360 |
| Liver | 27 | 1350 | 95 |
| Portal | (21) | (1050) | |
| Arterial | (6) | (300) | |
| Muscle (inactive state) | 15 | 750 | 4 |
| Bone | 5 | 250 | 3 |
| Skin (cool weather) | 6 | 300 | 3 |
| Thyroid gland | 1 | 50 | 160 |
| Adrenal glands | 0.5 | 25 | 300 |
| Other tissues | 3.5 | 175 | 1.3 |
| Total | 100.0 | 5000 | — |
From Guyton AC: Textbook of medical physiology, ed 8, Philadelphia, 1991, Saunders. Based on data compiled by LA Sapirstein.
Two theories for the local regulation of blood flow are the vasodilator theory and the oxygen demand theory.2 According to the vasodilator theory, as tissues become more metabolically active, they produce a vasodilator substance that dilates precapillary sphincters and arterioles. Various substances, including carbon dioxide, adenosine, lactic acid, nitric oxide, potassium ions, hydrogen ions, and phosphate compounds, cause vasodilation; the concentrations of these substances increase with increases in metabolic rate. Adenosine has been suggested as the most important of these local vasodilators; this substance is especially important in dilating coronary arteries in response to increased myocardial oxygen demand.2 Endothelial nitric oxide is also an important substance in regulating local vascular resistance. Controlled release of nitric oxide from the vascular endothelium is responsible for maintaining a continuous state of vasodilation.7,8 In the presence of hypoxemia, endothelial cells release more nitric oxide, promoting vasodilation.8
The oxygen demand theory is not much different than the vasodilator theory; it states that a lack of oxygen and other nutrients dilates precapillary sphincters and arterioles, causing local blood flow to increase. When adequate amounts of oxygen and nutrients are restored to the tissues, precapillary sphincters close again. For this reason, blood flow through capillaries is not continuous; rather, it is cyclic, fluctuating because precapillary sphincters periodically relax and contract. The duration of the open phases of the cycle is proportional to oxygen requirements of the tissues. This cyclic opening and closing of precapillary sphincters is called vasomotion.2
Central Control
The vasomotor center of the lower pons and upper medulla in the brain discharges a continuous low level of impulses to sympathetic vasoconstrictor fibers. This continuous low-level state of constriction is counterbalanced by vasodilator substances, which produces a resting vasomotor tone.2 Sympathetic impulses also cause the adrenal gland (the adrenal medulla) to release epinephrine and norepinephrine into the blood. These hormones are carried by the circulation to various parts of the body where they exert influences on vessel diameter similar to direct sympathetic nervous stimulation.
Baroreceptor Reflex
Baroreceptors (also known as pressoreceptors) are special sensory fibers in the walls of large systemic arteries that are responsive to stretch. They are most numerous at the fork of the internal and external carotid arteries and in the aortic arch. When stretched by high blood pressures, carotid and aortic baroreceptors transmit impulses through the glossopharyngeal and vagus nerves to the brain’s vasomotor and cardioregulatory centers. In response, the vasomotor center causes vasodilation, and the cardioregulatory center slows the heart rate. Consequently, arterial blood pressure decreases. A sudden reduction in blood pressure decreases the normal baseline impulse frequency transmitted by the baroreceptors to the brain; this causes vasoconstriction and increased heart rate. Through these mechanisms, the baroreceptors maintain blood pressure in a narrow range on a minute-to-minute basis.2 The baroreceptors are responsible for maintaining a fairly constant blood pressure in the head and upper body when a person abruptly changes body posture (e.g., standing up after lying down).
Renin-Angiotensin-Aldosterone, Antidiuretic Hormone, and B-Natriuretic Peptide Systems
Baroreceptors do not control blood pressure on a long-term basis; they reset to any new blood pressure within 1 to 2 days.2 Mechanisms that play important roles in long-term blood pressure regulation involve the kidney and include the renin-angiotensin-aldosterone system (RAAS), the vasopressin mechanism, and a natriuretic peptide produced by ventricular walls.2
Ventricular cells of the heart release a hormone, B-type natriuretic peptide (BNP), in response to high blood pressure and stretch of ventricular walls.9 This hormone inhibits aldosterone and promotes sodium loss (diuresis) by the kidney and subsequently water loss, reducing blood volume and blood pressure. In this way, BNP inhibits the RAAS; it is an aldosterone antagonist. In congestive heart failure (pumping failure), the ventricles become distended, and their walls are stretched, increasing blood levels of BNP. (For this reason, increased blood levels of BNP are a diagnostic marker for heart failure and help differentiate cardiac and pulmonary causes of dyspnea.10) Increased blood BNP levels inhibit aldosterone, blocking sodium reabsorption and subsequently water reabsorption. In this way, diuresis occurs, and blood volume is reduced. However, when the heart fails to pump adequately, the body’s priority is to maintain the arterial blood pressure, and the fluid-retaining effects of the RAAS easily overwhelm the counteracting effects of increased BNP levels. The RAAS often causes too much fluid retention, which makes matters worse because it stresses the already failing heart even more. This harmful effect is only mildly lessened by increased blood levels of BNP.
[/level-membership-for-pulmolory-and-respiratory-category][not-level-membership-for-pulmolory-and-respiratory-category]Chapter 17
Functional Anatomy of the Cardiovascular System
After reading this chapter, you will be able to:
• Describe the gross anatomy and function of each structure of the heart
• Explain how the atria, ventricles, and heart valves work together to pump blood through the pulmonary and systemic circulations
• Explain why the heart muscle is more blood flow dependent for oxygenation than other muscles in the body
• Explain why extremely high heart rates can result in low cardiac stroke volumes and coronary artery blood flow
• Explain how the specialized cardiac conduction system coordinates the synchronized contraction and relaxation of the atria and ventricles
• Explain how cellular mechanisms, calcium ions, and adenosine triphosphate work together to bring about myocardial contraction and relaxation
• Describe how the Frank-Starling mechanism helps the heart adjust to pump-varying amounts of blood
• Discuss the timing and sequence of all mechanical events in the cardiac cycle
• Explain how pumping action and arterial elasticity work together to produce continuous blood flow
• Explain how different mechanisms work to control the distribution of blood flow through systemic capillary beds
• Explain why high diastolic pressure is more indicative of increased vascular resistance than high systolic pressure
• Explain why independent right ventricular pumping failure produces a different type of circulatory derangement than left ventricular failure
• Describe how local, central, and humoral mechanisms regulate blood pressure
Heart
Gross Anatomy
The human heart is a hollow muscular pump about the size of its owner’s closed fist. It lies in the mediastinum of the thorax just behind the sternum (Figure 17-1). About two thirds of its mass is left of the sternal midline.
Pericardium
The heart is covered with a loose-fitting membranous sac called the pericardium (Figure 17-3). The pericardium consists of a tough, fibrous outer portion continuous with the connective tissue covering the great vessels. Inferiorly, it attaches to the surface of the diaphragm. The fibrous pericardium limits overexpansion of the heart, holding it in place in the mediastinum. Inside the fibrous pericardium is a thin transparent membrane called the serous pericardium. The serous pericardium is a closed envelope containing a small amount of pericardial fluid. The part of the membrane that lines the inner surface of the fibrous pericardium is the parietal pericardium. The visceral pericardium, also known as the epicardium, is the part of the serous pericardium that is fused to the heart’s surface. The space between the parietal and visceral pericardium is the pericardial space. The fluid in this space lubricates the membranes, allowing smooth, frictionless movement. As the heart beats, it moves easily in its lubricated, fibrous jacket, protected from friction with other mediastinal structures. Figure 17-4 shows a close-up cross-section of the pericardial membranes.
Heart Wall
Three layers of tissue form the heart wall (see Figure 17-4): epicardium (visceral pericardium), myocardium, and endocardium. The myocardium is the heart muscle forming the bulk of the heart wall. This muscle wraps around the heart’s chambers in such a way that contraction ejects blood with great force. The endocardium lines the inner surfaces of the heart’s chambers; it resembles the smooth endothelial lining of the blood vessels (see Figure 17-4).
Heart Chambers and Valves
The heart is actually two separate muscular pumps—the right heart and the left heart—connected in sequence. The right heart pumps blood through the pulmonary circulation to the left heart, which pumps blood through the systemic circulation back to the right heart. Each heart consists of two chambers: an atrium located superiorly to a ventricle (Figure 17-5). The atria are weak pumps that prime the more powerful ventricles; they passively funnel blood into the ventricles except when they contract at the last instant to complete the filling process actively.
The atria are thin-walled collecting chambers, whereas the ventricles are heavily muscled pumping chambers; the inner surfaces of the ventricles are muscle bundles undercut by open spaces called trabeculae carneae (see Figure 17-4). These irregular surfaces may prevent endocardial wrinkling and damage during ventricular contraction.1 The muscle mass of the left ventricle is greater than the muscle mass of the right ventricle (see Figure 17-5) because the left ventricle pumps against a much greater resistance (systemic vascular resistance [SVR]) than the right ventricle (pulmonary vascular resistance [PVR]). The left ventricle is more spherical in cross-section than the right ventricle (Figure 17-6). The thinner walled right ventricle is crescent-shaped, appearing to wrap partly around and “hug” the left ventricle. This arrangement tends to flatten the right ventricle during left ventricular contraction, aiding ejection of blood by the right ventricle.
Each ventricle has a large outflow tract located superiorly near the AV valves. The right ventricle pumps blood through the pulmonary semilunar valve into the pulmonary trunk, whereas the left ventricle pumps blood through the aortic semilunar valve into the aorta (see Figure 17-5). These valves prevent backflow of blood into the ventricles during ventricular relaxation. The interventricular septum separates right and left ventricles, preventing mixing of oxygenated and unoxygenated blood.
Each ventricle contains cone-shaped pillars called papillary muscles from which thin, strong connective tissue strings (chordae tendineae) attach to tricuspid and mitral valve cusps (see Figure 17-5). The chordae tendineae tether the AV valve leaflets, preventing them from bulging up into the atria and opening during ventricular contraction (called regurgitation). When the ventricles relax, these valves open again, allowing blood to fill the ventricles. Most of the ventricular filling is a passive process; the atria do not contract until very near the end of ventricular relaxation (diastolic) time.
Cardiac Skeleton and Valvular Function
A tough set of connected rings (fibrous annuli) form a semirigid framework to which the heart valves and cardiac muscle are attached (Figure 17-7, A). This framework forms a fibrous skeleton, which is an electrical insulator and a physical barrier between atrial and ventricular muscle masses. The only electrical connection between atrial and ventricular muscle is a single bundle of specialized conductive tissue that penetrates the fibrous skeleton (discussed in a later section).
The spiral arrangement of ventricular muscle fibers (see Figure 17-7, A) propels blood upward into the aorta and pulmonary artery during contraction. This action “wrings” blood
out of ventricles from apex to base. As the heart contracts, it rotates to the right, swinging the left ventricle to the front of the chest; this creates the PMI.
The fibrous rings supporting the tricuspid and mitral valves are more compliant than the rings supporting the semilunar valves. For this reason, mitral and tricuspid rings are compressed to smaller sizes during ventricular systole; consequently, their valve cusps are larger than the area to be covered; this ensures a complete seal during contraction.1 If the size disproportion is too great, the valve cusps balloon upward into the atrium during ventricular contraction (prolapse). Heart valve function during ventricular diastole is illustrated in Figure 17-7, B; Figure 17-7, C, illustrates valvular function during ventricular systole. These illustrations correspond with ventricular filling (diastole) and ejection (systole) shown in Figure 17-8, A and B.
The crescent-shaped (semilunar) pulmonic and aortic valve cusps permit them to open fully during ventricular ejection and seal perfectly during ventricular diastole. The aortic diameter is slightly enlarged at the base just above the semilunar valves. This provides a space behind the valve cusps when they open during ventricular ejection, preventing them from occluding the coronary artery orifices.1 Coronary arteries branch off from the aorta immediately above the semilunar valve. The enlarged aortic base also keeps the valve cusps away from the aortic wall. As the ventricles relax, the backflow of blood immediately catches the valve cusps and sharply closes them, preventing blood from flowing back into the ventricles.
Coronary Circulation
Coronary Arteries
The heart muscle itself receives its blood supply from the right and left coronary arteries, which arise from the aorta immediately above the aortic semilunar valve. These arteries and their branches lie on the heart’s surface (see Figure 17-2); smaller arteries penetrate into the cardiac muscle mass. Figure 17-9, A, illustrates the coronary arterial circulation. The heart relies almost exclusively on the two main coronary arteries for its oxygen supply. The endocardial surface obtains a very small amount of oxygen directly from the blood in the heart chambers.2
Very few connections exist between the major coronary arteries; blood flow can take few detours if its main route becomes obstructed. This lack of collateral circulation explains why sudden coronary artery occlusion, such as occurs with a blood clot, is life threatening. The heart muscle supplied by the occluded artery becomes hypoxic (ischemic), which can lead to myocardial tissue death, or myocardial infarction (MI). If the narrowing of coronary arteries progresses gradually over a long time, some collateral circulation develops to supply ischemic areas; this lessens the chances that a blocked coronary artery will cause an MI.2
Ischemia produced by coronary artery occlusion stimulates myocardial nociceptive (pain-eliciting) fibers, producing the characteristic pain known as angina pectoris.3 This pain is often felt beneath the sternum, in the left arm, and in the neck. Frequent attacks of angina are associated with a greatly increased risk of coronary artery occlusion. About 35% of all deaths in the United States are caused by coronary artery disease.2
The left anterior descending and circumflex branches of the left coronary artery supply the anterior and lateral portions of the left ventricle (see Figure 17-9, A). The right coronary artery supplies the right ventricle and the posterior part of the left ventricle. The left and right atria receive blood from small branches of left and right coronary arteries. The right coronary artery is the dominant supplier of blood to the heart in about 50% of people; in about 30% of people, blood flow is equal through right and left coronary arteries; and the left artery predominates in about 20% of people.2
Coronary Veins
The coronary venous drainage (see Figure 17-9, B) follows a path generally parallel to the path of the coronary arteries. The cardiac veins converge to empty into a large venous cavity within the right atrium, the coronary sinus. In addition, the thebesian veins (not shown) empty directly into all heart chambers; this venous drainage into the left heart contributes to the normal anatomical shunt that prevents arterial blood from being fully saturated with oxygen. About 75% of coronary venous flow is through the coronary sinus.2
Oxygen Requirements and Coronary Blood Flow
Even at rest, the myocardium extracts about 70% of the oxygen from its arterial blood flow compared with a 25% extraction rate for the whole body.2 During exercise, this extraction rate is higher still. Because heart muscle cannot extract much additional oxygen from the blood, the only way it can receive more oxygen is through increased coronary blood flow. Myocardial oxygenation is highly dependent on blood flow.
Myocardial oxygen need is the major factor governing coronary blood flow. Increased metabolic activity and myocardial hypoxia cause the release of a potent coronary vasodilator called adenosine.3
Diastolic Time and Coronary Blood Flow
At rest, coronary blood flow is about 225 mL per minute, or between 4% and 5% of the cardiac output; during heavy exercise, coronary blood flow can triple or quadruple to meet the extra oxygen demands of the myocardium.2 Most coronary perfusion occurs during ventricular relaxation (diastole), opposite to flow through other vascular beds of the body. The powerful contractile force of the ventricles during systole compresses the coronary vessels, momentarily stopping or reversing the direction of their blood flow.3 Thus, sufficient diastolic time (normally about two times as long as systolic time) is important for adequate coronary blood flow. Extreme tachycardia, especially in persons with narrowed coronary arteries, may shorten diastolic time so much that coronary blood flow becomes inadequate. In healthy people, the effect of this shortened diastolic time is overridden by the coronary vasodilation that occurs with increased myocardial oxygen demand.
Cardiac Conduction System
A specialized system of modified cardiac muscle tissue (distinct from nerve tissue) conducts regular electrical impulses that stimulate rhythmic, synchronized heart muscle contractions. This conduction system also transmits the impulses rapidly and uniformly throughout the heart, much more rapidly than over regular myocardial fibers. Rapid and uniform conduction of electrical impulses is important to ensure effective, properly timed pumping action of the heart. With normal impulse conduction, the atria contract to complete the ventricular filling process about one sixth of a second before the ventricles contract.2 Figure 17-10 illustrates the electrical conduction system of the heart.
The sinoatrial (SA) node, embedded in the right atrial muscle near the superior vena cava, is responsible for initiating the electrical impulses that produce sequential atrial and ventricular contraction. The impulses of the SA node travel over specialized internodal pathways to the atrioventricular (AV) node at a velocity of about 1 m per second (regular atrial muscle conducts impulses at about 0.3 m per second). The AV node and the AV bundle slow the impulse velocity considerably before transmitting it into the ventricles. It takes the SA node impulse about 0.03 second to reach the AV node, which along with the AV bundle delays the impulse another 0.13 second before conducting it on to the ventricles; thus, about 0.16 second elapses from the time the SA node generates its impulse until the ventricles receive the signal.2 This transmission delay prevents impulses from arriving at the ventricles too rapidly in succession; in this way, the ventricles have enough time to fill between contractions.
impulses at a velocity up to 4 m per second, which is about six times faster than the impulses can travel over regular ventricular muscle. It takes these impulses about 0.03 second to travel from the AV bundle to the Purkinje fibers, where they normally stimulate rapid, simultaneous ventricular contractions.2
