8 Fluid Management
Regulatory Mechanisms: Fluid Volume, Osmolality, and Arterial Pressure
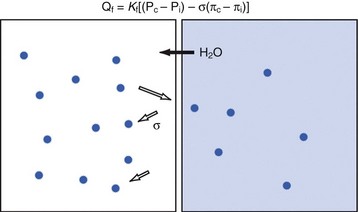
Water is in thermodynamic equilibrium across cell membranes, and it moves only in response to the movement of solutes (E-Fig. 8-1). Movement of water is described by the Starling equation:

where Qf is fluid flow; Kf is the membrane fluid filtration coefficient; Pc, Pi, πc, and πi are hydrostatic and osmotic pressures on either side of the membrane; and σ is the reflection coefficient for the solute and membrane of interest. The reflection coefficient gives a measure of a solute’s permeability and, consequently, its contribution to osmotic force after equilibration. Across the blood-brain barrier, for example, the σ for sodium approaches 1.0,1 whereas in muscle and other cell membranes, σ is on the order of 0.15 to 0.3.2 Therefore, when isotonic sodium-containing solutions are given intravenously, usually only 15% to 30% of administered salt and water remains in the intravascular space while the remainder accumulates as interstitial edema.3,4 In contrast, hypertonic solutions permit greater expansion of circulating blood volume with smaller fluid loads and less edema.5–7
Both the amount and the concentration of solute are tightly regulated to maintain the volumes of intravascular and intracellular compartments. Because sodium is the primary extracellular solute, this ion is the focus of homeostatic mechanisms concerned with maintenance of intravascular volume. When osmolality is held constant, water movement follows sodium movement. As a result, total body sodium (although not necessarily serum Na+) and total body water (TBW) generally parallel one another. Because sodium “leak” across membranes limits its contribution to the support of intravascular volume, this compartment is also critically dependent on large, impermeable molecules such as proteins. In contrast to sodium, albumin molecules, for example, follow the Starling equilibrium with a reflection coefficient in excess of 0.8.8 Soluble proteins create the so-called colloid oncotic pressure, approximately 80% of which is contributed by albumin.
Although the presence of albumin supports intravascular volume, protein leak into the interstitium (and consequent water movement) may limit its effectiveness. It has been observed, for example, that the reflection coefficient for albumin decreases by as much as one third after mechanical trauma.9 Furthermore, because of ongoing leakage, a slow continuous infusion of albumen is superior to bolus administration for increasing the serum albumen concentration in critically ill individuals.10
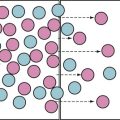
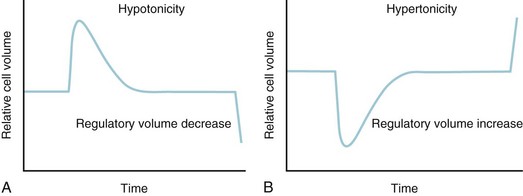
Potassium is the primary intracellular solute, with approximately one third of cellular energy metabolism devoted to Na+/K+ exchange. Sodium continuously leaks into cells along its concentration gradient, yet it is rapidly extruded in exchange for potassium. As the cell is exposed to varying osmolarity, water movement occurs, causing cell swelling or shrinkage. Because stable cell volume is critical for survival, complex regulatory mechanisms have evolved to ensure that stability is maintained.11,12 The processes by which swollen cells return to normal size are collectively termed regulatory volume decrease processes, and those returning a shrunken cell to normal are termed regulatory volume increase processes (Fig. 8-1). With sudden, brief changes in osmolality, regulatory volume increase or decrease processes are activated after small (1% to 2%) changes in cell volume, returning cell volume to normal primarily through transport of electrolytes. If anisosmotic conditions persist, chronic compensation occurs through the accumulation or loss of small organic molecules termed osmolytes or idiogenic osmoles (e.g., polyols, sorbitol, myoinositol), amino acids and their derivatives (e.g., taurine, alanine, proline), and methylamines (e.g., betaine, glycerylphosphorylcholine).
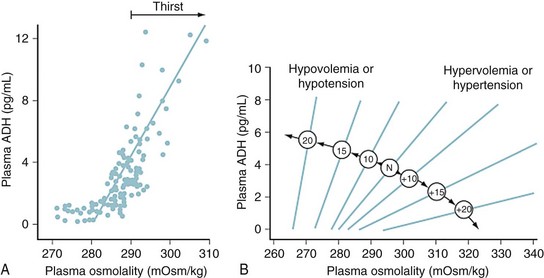
Serum osmolality is primarily regulated by antidiuretic hormone (ADH), thirst, and renal concentrating ability. Because the indirect aim of osmolar control is actually volume control, these same osmoregulatory mechanisms are also influenced by factors such as blood pressure (BP), cardiac output, and vascular capacitance.13,14 In pathologic conditions such as ascites or hemorrhage, intravascular volume preservation takes precedence over osmolality and osmoregulatory mechanisms operate to restore intravascular volume, even at the expense of disrupting physiologic solute balance.
For example, ADH is released from neurons of the supraoptic and paraventricular nuclei in response to osmolar fluctuations in cell size. Solutes that readily permeate cell membranes, such as urea, increase the serum osmolality without triggering the release of ADH. Infusion of solutes with large actual or effective reflection coefficients (σ) at the cell membrane (e.g., sodium, mannitol) elicits a robust ADH release. ADH release begins when the serum osmolality reaches a threshold of approximately 280 mOsm/L. Rapid increases in osmolality lead to a greater release of ADH than do slow increases. Hypovolemia and hypotension diminish the threshold for ADH release and increase the “gain” of the system by exaggerating the rate of increase in serum ADH concentrations (E-Fig. 8-2). Thus, in a volume-depleted or hypotensive child, brisk ADH release occurs in response to plasma osmolalities as low as 260 to 270 mOsm/L. It has been hypothesized that different populations of vasopressin-secreting cells are responsive to osmotic and baroreceptor-mediated input.

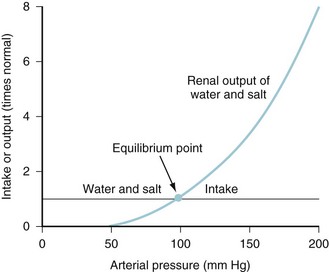
Intravascular fluid volume, salt and water intake, electrolyte balance, and cardiovascular status are interrelated at several levels.15 For example, as the veins and arteries become replete with fluid and the systemic BP increases, ADH release wanes as both pressure diuresis and natriuresis commence.16 The resulting relationship between urine output and arterial pressure is termed the renal function curve, and its intersection with salt and water intake determines the equilibrium point at which arterial BP ultimately stabilizes (Fig. 8-2). Equilibrium (chronic) BP is influenced only by shifts of the renal function or fluid intake curves. Transient changes in arterial pressure secondary to peripheral vascular resistance changes are always resolved by opposing shifts in total body salt and TBW.
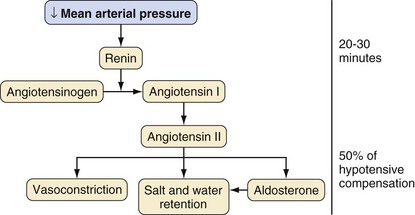
In response to a decreasing arterial pressure, the renin-angiotensin system is also mobilized. With decreased renal perfusion, juxtaglomerular cells release renin, which in turn converts renin substrate (angiotensinogen) to angiotensin I. Angiotensin I is then rapidly converted to angiotensin II by angiotensin-converting enzyme present in lung endothelium. Angiotensin II supports arterial pressure in three ways: (1) direct vasoconstriction, (2) increased salt and water retention (via renal vasoconstriction and decreased glomerular filtration), and (3) stimulation of aldosterone secretion (Fig. 8-3).
ADH, pressure diuresis, and the renin-angiotensin system permit wide ranges in salt and water intake without large fluctuations in BP or volume status. All serve to support the systemic circulation when threatened and complement the more immediate activity of the sympathetic nervous system. In addition to high-pressure sensors such as aortic arch and carotid sinus baroreceptors, intravascular volume information is provided by low-pressure thoracic sensors. For this reason, effective increases or decreases in intrathoracic blood volume may mimic changes in whole-body volume status and produce natriuresis, diuresis, or fluid retention. Intravascular volume may also be sensed as the stretch of atrial muscle fibers, leading to release of atrial natriuretic peptide.17 Although its complete physiologic role is uncertain, atrial natriuretic peptide may serve to “fine tune” volume status by causing modest vasodilation, gently increasing the glomerular filtration rate (GFR), and decreasing reabsorption of sodium. The combination of complex autoregulatory mechanisms with complementary actions operating on varying time scales, all responding to different, yet interrelated, effector stimuli, yields an elegant system by which the mature individual may maintain circulation amid a variety of challenges. In this context, it is interesting to observe that successful heart transplant recipients, despite general cardiovascular stability, typically manifest fundamental derangements in body fluid homeostasis.18
Maturation of Fluid Compartments and Homeostatic Mechanisms
Body Water and Electrolyte Distribution
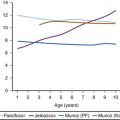
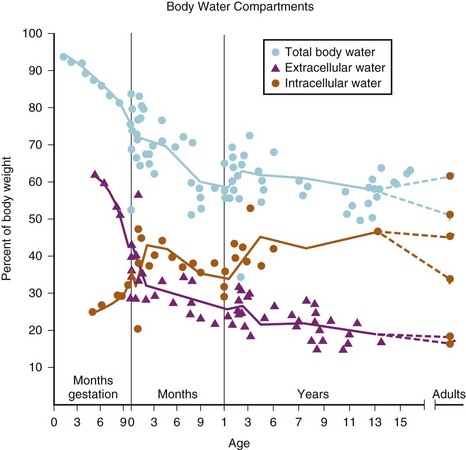
Much of our understanding of the development of body water compartments is derived from deuterium oxide dilution studies performed in the 1950s.19 In a series of 21 neonates, TBW was found to be approximately 78 ± 5% of body weight. Subsequent measurements in fewer subjects showed that TBW decreased to approximately 60% in the second 6 months of life with most of the loss being extracellular. A smaller decrease (to about 57%) is observed late in childhood (Fig. 8-4).
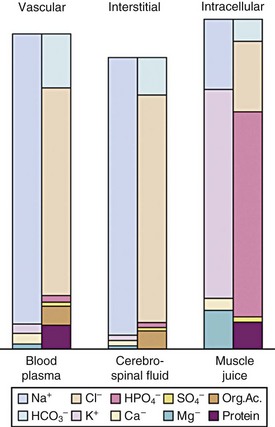
The importance of the extracellular compartment, its relationship to the intracellular space, and much of the chemical anatomy of both were first described by Gamble in educational monographs issued during the first part of the 20th century (E-Fig. 8-3).20,21 The chemical compositions of mature body fluid compartments are provided in Table 8-1.
| Extracellular Fluid | Intracellular Fluid | |
|---|---|---|
| Osmolality (mOsm) | 290-310 | 290-310 |
| Cations (mEq/L) | 155 | 155 |
| Na+ | 138-142 | 10 |
| K+ | 4.0-4.5 | 110 |
| Ca2+ | 4.5-5.0 | — |
| Mg2+ | 3 | 40 |
| Anions (mEq/L) | 155 | 155 |
| Cl− | 103 | — |
| HCO3− | 27 | — |
| HPO42− | — | 10 |
| SO42− | — | 110 |
| PO42− | 3 | — |
| Organic acids | 6 | — |
| Protein | 16 | 40 |

Circulating Blood Volume
The blood volume in neonates was determined to be 82 ± 9 mL/kg using an iodine 121–labeled human serum albumin technique, although substantial variability may result from the degree of placental-fetal transfusion.22 In low-birth-weight (LBW), preterm, or critically ill infants, values as high as 100 mL/kg have been measured.23 Blood volume increases slightly during the first few months of life, reaching its zenith at 2 months of age (approximately 86 mL/kg), then returns to near 80 mL/kg and finally stabilizes at 70 mL/kg by the end of the first year of life. In general, the ratio of blood volume to weight decreases with growth. The most accurate basis for prediction of blood volume is lean body mass, the consideration of which removes any male/female variation even into adulthood.24 An estimate of the circulating blood volume is presented in Table 8-2.
| Age | Estimated Blood Volume (mL/kg) |
|---|---|
| Preterm infant | 100 |
| Full-term neonate | 90 |
| Infant | 80 |
| School age | 75 |
| Adults | 70 |
Maturation of Homeostatic Mechanisms
In the first year of life, renal plasma flow and GFR are approximately one half the adult values of 350 and 70 mL/min/m2, respectively.25 Consequently, serum creatinine is increased in term and preterm infants, yet normalizes in the second month of life. Fractional excretion of sodium (FENa) is markedly increased in preterm infants, decreases somewhat by term, and stabilizes at adult levels by the second month of life. Although the adult kidney may easily achieve FENa values as low as 0.5%, the 34-week-gestation infant is limited to no less than 2%.
Fluid and Electrolyte Requirements
Holliday summarized the evolution of contemporary hydration therapy.20 In 1831, Latta first reported the use of intravenous (IV) fluids in the resuscitation of patients dehydrated by cholera.26 In 1918, growing information on the subject permitted Blackfan and Maxcy to successfully treat nine infants by intraperitoneal injection.27 In 1923, Gamble and associates detailed the anatomy of fluid and electrolyte compartments, introducing the use of milliequivalents to clinical practice.21 This paved the way for the development of the “deficit therapy” regimen of Darrow.28
Holliday and Segar provided calculations for a first approximation of “the maintenance need for water in parenteral fluid therapy” in 1957.29 Integrating the relevant known physiology at that time, these authors observed that “insensible loss of water and urinary water loss roughly parallel energy metabolism and do not parallel weight.” However, because water utilization parallels energy metabolism, energy metabolism follows surface area, and surface area follows weight, it should be possible to estimate water requirement from weight alone. The authors then proceeded under a series of assumptions to extrapolate from limited data to a “relationship between weight and energy expenditure that might easily be remembered.”
Assuming energy requirements of “hospitalized patients” to be “roughly midway between basal and normal levels,” they constructed a curve of caloric requirement versus weight.29 This curve could be seen as comprising three linear sections: 0 to 10 kg, 10 to 20 kg, and 20 to 70 kg (Fig. 8-5). Viewing the curve in this manner, the authors reasoned that “fortuitously, the average need for water, expressed in milliliters, equals energy expenditure in calories”: 100 mL/kg/day for weights to 10 kg, an additional 50 mL/kg/day for each kilogram from 11 to 20 kg, and 20 mL/kg/day more for each kilogram beyond 20 kg. In anesthetic practice, this formula has been further simplified, with the hourly requirement referred to as the “4-2-1 rule” (4 mL/kg/hr for the first 10 kg of weight, 2 mL/kg/hr for the next 10 kg, and 1 mL/kg/hr for each kilogram thereafter; Table 8-3).
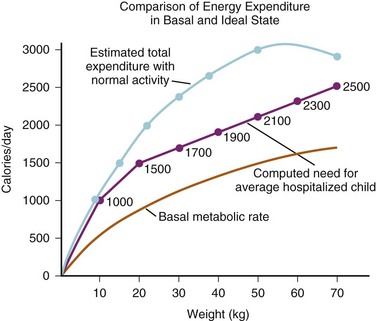
FIGURE 8-5 The upper and lower curves were plotted from data from the study by Talbot.126 Weights at the 50th percentile level were selected for converting calories at various ages to calories related to weight. The computed line for the average hospitalized child was derived from the following equations:
2. 10-20 kg: 1000 kcal + 50 kcal/kg for each kg over 10 kg
3. 20 kg and up: 1500 kcal + 20 kcal/kg for each kg over 20 kg
(From Holliday MA, Segar WE. The maintenance need for water in parenteral fluid therapy. Pediatrics 1957;19:823-32.)
TABLE 8-3 Relationship between Weight and Hourly or Daily Maintenance Fluid Requirements of Children as per the 4-2-1 Rule
| MAINTENANCE FLUID REQUIREMENTS | ||
|---|---|---|
| Weight (kg) | Hour | Day |
| <10 | 4 mL/kg | 100 mL/kg |
| 10-20 | 40 mL + 2 mL/kg for every kg >10 kg | 1000 mL + 50 mL/kg for every kg >10 kg |
| >20 | 60 mL + 1 mL/kg for every kg >20 kg | 1500 mL + 20 mL/kg for every kg >20 kg |
For decades, the simplicity and elegance of the Holliday and Segar formula has made it the starting point for fluid management in healthy children. As recently as 2006, the majority of consultant anesthetists in the United Kingdom administered hyponatremic glucose-containing solutions intraoperatively and postoperatively to children undergoing elective surgery.30 However, the uncritical use of these solutions was never intended, and their blind application in the operating room, or in any clinical situation, is unwarranted. Further, as Holliday and Segar have themselves pointed out, their original approach involved hyponatremic glucose-containing solutions rather than near-isotonic solutions such as 0.9% saline or lactated Ringer solution (LR).30a In addition, these requirements were assessed at a basal metabolic state and not when the child was acutely ill or under physiologic stress. As the authors cautioned that “understanding of the limitations and of exceptions to the system [is] required. Even more essential is the clinical judgment to modify the system as circumstances dictate.” General water losses for infants and children are summarized in Table 8-4.
TABLE 8-4 Normal Water Losses for Infants and Children
| Cause of Loss | Volume of Loss (mL/100 kcal) |
|---|---|
| Output | |
| Urine | 70 |
| Insensible loss | |
| Skin | 30 |
| Respiratory tract | 15 |
| Hidden intake (from burning 100 calories) | 15 |
| Total | 100 |
More recently, Holliday revised the approach to fluid therapy in children that he and Segar enshrined with several caveats.30b In a related commentary, Holliday pointed out several problems with applying the original 4-2-1 rule to acutely ill children.30c Namely, dysregulation of ADH is a hallmark of critical illness because ADH secretion is affected by a variety of nonosmotic factors such as pain, stress, mechanical ventilation, and many medications. As a result, the choice of intravenous fluid and the rapidity of deficit replacement must be approached with care. The authors recommended a relatively simple strategy for healthy children undergoing elective surgery (including outpatients) to turn off ADH secretion and prevent perioperative water retention and subsequent hyponatremia. When a child (who is without significant heart or kidney disease) presents with marginal to moderate hypovolemia (e.g., after fasting for surgery), 20 to 40 mL/kg of isotonic fluids should be given during surgery and the postanesthesia care unit stay (as rapidly as 10 to 20 mL/kg/hr). Clinical judgment must always allow for modification of these recommendations if indicated for an individual child.31,32 If hypovolemia is more severe (e.g., after an extensive bowel preparation), 40 to 80 mL/kg may be necessary during the perioperative period.
Postrecovery IV fluid therapy should consist of an isotonic solution infused at half the rate described in the original 4-2-1 fluid regimen (i.e., 2 mL/kg for the first 10 kg, 1 mL/kg for the next 10 kg, and 0.5 mL/kg for each additional kilogram thereafter). If the child does not or cannot tolerate oral intake after 6 to 12 hours, standard maintenance fluid therapy using hypotonic saline (e.g., 0.45% saline) should be initiated to avoid hypernatremia and fluid overload from prolonged administration of the isotonic solutions. This regimen should limit the ADH response and reduce the risk for postoperative hyponatremia and hypernatremia.31–33 It remains essential, however, to monitor plasma electrolyte concentrations serially on the ward, regardless of the fluid doctrine followed, to be certain that electrolyte concentrations remain within normal limits.34,35
Neonatal Fluid Management
Three distinct phases of fluid and electrolyte homeostasis have been described in LBW36 and very low–birth-weight (VLBW)37 infants. In the first day of life, there is minimal urine output, and body weight is stable despite low fluid intake. In the second phase, days 2 and 3 of life, diuresis occurs irrespective of the amount of fluid administered. By the fourth and fifth days of life, urine output begins to vary with changes in fluid intake and state of health.
In the neonatal ICU, fluid management focuses on provision of adequate nutrition, maintenance of electrolyte balance, and limitation of fluid overload. The last factor is of particular concern because plasma oncotic pressure is reduced in preterm infants and the whole-body protein reflection coefficient is less than that in adults.38 VLBW infants are at particular risk for fluid and electrolyte imbalances.39 Even modest fluid overload may exacerbate pulmonary edema, prolong ductal patency, and more readily produce congestive heart failure. This perspective typically accompanies the infant to the operating room, where the primary considerations are routinely quite the opposite: restoration of circulating blood volume after third space accumulation, maintenance of intravascular volume amid ongoing blood loss, replacement of potentially massive evaporative losses, and maintenance of BP despite anesthetic-induced vasodilatation and increased venous capacitance. During surgery, these concerns must take precedence; yet unnecessary administration of fluid is best avoided.
Intraoperative Fluid Management
Intravenous Access and Fluid Administration Devices
Complex surgeries in sicker children usually require at least two large-bore catheters. In pediatrics, however, “large bore” is a relative term, with 22-gauge catheters typically providing sufficient access in infants. Preferred sites for larger catheters include the antecubital and saphenous veins. In cases in which access to the central circulation is required (as for pressure monitoring, infusion of vasoactive medications, or prolonged access), longer catheters may be placed via the femoral, subclavian, or internal jugular vein (the latter usually via a high, anterior approach).40 Although secure access may also be obtained via the external jugular vein, it is often difficult to negotiate the J-wire or catheter tip into the central circulation.41 Peripherally inserted central catheter (PICC) lines are becoming increasingly used in hospitalized children. Although they represent a long-term means of delivering IV fluids and medications in children who require such treatment interventions, there are limitations to their utility intraoperatively. First, practitioners must maintain strict sterile technique when accessing these lines in order to avoid infection. Second, the lines tend to have smaller diameters and are quite long. Therefore, resistance can be significant, even with larger-bore PICC lines. Consequently, bolus and infusion dosing of drugs can be met with high resistance. These lines are not appropriate for large-volume resuscitation, and care should be taken to secure larger-bore IV access if large fluid shifts or significant blood loss is anticipated.
In selecting the appropriate IV catheter, it is useful to consider the relative effects of catheter length and diameter on solution flow rates. Longer catheters offer more resistance to flow than shorter ones and are therefore less desirable when rapid infusion of a large volume of fluids is necessary (see E-Fig. 51-1 and Figs. 51-1, 51-2). In vitro, catheters that were designed for peripheral venous access had 18% to 164% greater flow rates when compared with the same-gauge catheters designed for central venous use. Under pressure, as might be employed during emergent volume resuscitation, rates differed up to 17-fold.42 Although this seems to suggest that short peripheral catheters should be preferred, in vivo data are more complex. In animal models, overall catheter flow rates are less than in vitro rates, and central access presents somewhat less resistance to flow than peripheral access.43 Finally, when weighing the risks and benefits of central versus peripheral access, it is also interesting to consider that central administration of resuscitation medications may provide little practical advantage over peripheral administration.44
Intraosseous devices are now commonly used in the initial resuscitation of critically ill or injured children (see Fig. 48-6).45,46 Flow rates via these devices depend less on needle diameter than on resistance in the marrow compartment.47 In the operating room, the intraosseous route has been used for both induction and maintenance of anesthesia.48–50 However, onset of drug effect is less predictable, and the device is more easily dislodged than an IV catheter. Potential complications include compartment syndrome51–53 and, very rarely, damage to the growth plate.46,54 Such devices are probably best considered an emergency or last-resort option.49
Choice and Composition of Intravenous Fluids
In the early 1960s,55 simultaneous measurements of plasma and extracellular fluid volumes demonstrated that, during surgery, plasma volume is supported at the expense of the extravascular space. At the same time, it was classically observed that isotonic resuscitation fluids temporarily redistribute from the intravascular spaces to what was originally believed to be a third, nonfunctional space. It is now clear that destruction of the endothelial glycocalyx, as caused by surgical trauma, permits fluid to shift from the intravascular to interstitial space. Therefore, the historical “third space” simply represents reversible expansion of the interstitium. Because of the differences in fluid distribution and renal function in infants compared with older children, it was at first unclear that these findings could be extended to infancy. Thus, fluid restriction remained the standard of care until careful studies specifically demonstrated that fluid and electrolyte requirements are often extremely large in neonates who are undergoing major surgical procedures.56–58
Although hypotonic fluids are selected for maintenance hydration throughout the hospital (according to the reasoning outlined previously), isotonic solutions are preferred intraoperatively for several reasons. First, most ongoing volume losses are isotonic, consisting of shed blood and interstitial fluids. Second, large volumes of hypotonic solutions may rapidly diminish serum osmolality, producing very low concentrations of electrolytes (in particular, sodium) and undesirable fluid shifts. Indeed, even large volumes of “isotonic” fluids have been shown to significantly decrease serum osmolality in adult volunteers.59 Third, as discussed earlier, the plasma volume expansion that is necessary in response to diminished vascular tone under anesthesia is difficult to achieve even with isotonic fluids. Finally, increases in ADH and other elements of intraoperative physiology result in free water retention in excess of sodium if inadequate amounts of the latter are provided.
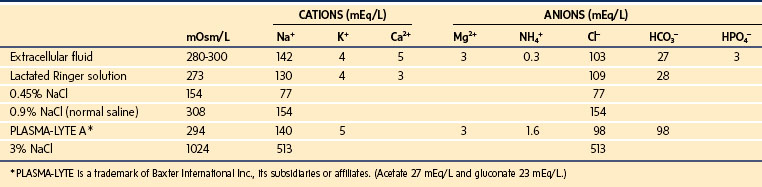
The compositions of commonly used IV solutions are presented in Table 8-5. Assuming normal plasma osmolality of 275 to 290 mOsm/L, it is noteworthy that 0.9% NaCl (normal saline, NS) is slightly hypertonic to plasma and that LR is isotonic (273 mOsm/L), although slightly hyponatremic (130 mEq/L). For dextrose-containing solutions, added osmolality is rapidly dissipated as sugar is metabolized, resulting in increased volumes of free water. Therefore, administration of 5% dextrose in water is ultimately equivalent to administration of free water.
HES solutions with a greater MW-to-MS ratio tend to remain in the intravascular space much longer than those with smaller ratios. However, they also are prone to more significant side effects including hypocoagulability. Newer, low MW/low MS solutions have much less effect on hemostatic mechanisms than older, higher MW/higher MS solutions. The exact mechanism of the effect on coagulation remains unclear, although it is thought that the HES compounds interfere with von Willebrand factor, factor VIII, and platelet function. A greater C2:C6 ratio is responsible for the slower degradation of the starch by amylase with fewer side effects.60 Newer HES solutions (e.g., HES 130/0.42/6:1) are very safe in children scheduled for surgery who have normal renal function; they maintain hemodynamic stability and produce only mild to moderate changes in acid–base status.61 Synthetic colloids such as these should be considered in surgical patients who demonstrate the need for aggressive intraoperative fluid resuscitation, such as children with large-volume blood loss or excessive insensible losses. Use of these solutions in cardiac surgery remains controversial given the effects on coagulation factors and platelet function induced by the cardiopulmonary bypass circuit.
The routine intraoperative use of glucose-containing solutions has also been a subject of debate. As a rule, operative stress evokes physiologic responses that increase serum glucose. In practice, therefore, hypoglycemia is seldom a problem in healthy children when glucose is omitted from perioperative IV fluids.62,63 Indeed, the risk should be particularly small if the period of fasting is limited to less than 10 hours.63 At the same time, rapid administration of dextrose solutions may certainly produce acute hyperglycemia and hyperosmolality.62,63 Therefore, glucose-containing solutions should not be used to replace fluid deficits, third space losses, or blood losses. However, some populations, such as debilitated infants,64 children who are malnourished, neonates and infants < 6 months of age62,64a,64b and those undergoing cardiac surgery, have been shown to be at risk for intraoperative hypoglycemia,65,66 and the use of glucose-containing solutions (1% to 2.5% dextrose)62,64a,67, along with intraoperative glucose monitoring, may be beneficial in these children.
Hyperalimentation
It is now common practice that critically ill children arrive in the operating room with hyperalimentation solutions infusing. Common contents of hyperalimentation solutions are shown in Table 8-6. In general, children require 0.5 to 3.0 mg/kg/day of protein, 6 to 9 mg/kg/min of glucose, and 0.5 to 3 g/kg/day of fat. Children receiving parenteral nutrition preoperatively should continue to receive those infusions separately, and a corresponding volume should be deducted from isotonic operative fluids. Hyperalimentation typically consists of two infusions: Intralipid (Fresenius Kabi, Uppsala, Sweden) and a concentrated glucose/protein solution. It is prudent to discontinue the Intralipid solution during surgery; but if that is not possible, then every effort should be made to avoid accessing any ports in the line to reduce the risk of contaminating the Intralipid. Conversely, the concentrated glucose/protein solution should be continued at the same rate (because circulating insulin concentrations have acclimated accordingly). Because of hyperglycemic responses to the stress of surgery and reduced metabolism due to anesthesia and hypothermia, some practitioners routinely decrease hyperalimentation infusion rates by one third to one half. If the latter practice is followed, clinicians should consider checking serum glucose concentrations at regular intervals to monitor for hypoglycemia. Under no circumstances should concentrated glucose solutions (such as D10 or D20) be abruptly discontinued, because high levels of circulating insulin may cause a precipitous and profound decrease in the serum glucose concentration.
TABLE 8-6 Common Contents of Parenteral Nutrition Solutions*
*Common contents of parenteral nutrition solutions containing dextrose, protein, lipids, and standard additives such as electrolytes. These values represent standard starting points that may be modified based on individual patient needs.
Concerns regarding the routine use of intraoperative dextrose-containing solutions, in large part from recognition that hyperglycemia may exacerbate neurologic injury after an ischemic or hypoxic event, resulted in most clinicians’ avoiding such solutions for routine cases. If dextrose-containing solutions are used, appropriate monitoring is advised to avoid serum glucose extremes. Many practitioners administer glucose-containing solutions as a separate piggyback infusion using an infusion pump or other rate- or volume-limiting device to avoid accidental bolus administration. Alternatively, evidence indicates that isotonic solutions that contain reduced glucose concentrations (e.g., 1% or 2.5% versus 5%) are safe alternative solutions for intraoperative use that minimize both hyponatremia and hyperglycemia.68 In the United States, several Food and Drug Administration (FDA)-approved solutions containing 2.5% dextrose are available but none in lower concentrations. In Europe, 1% dextrose electrolyte solutions are now available.64a,68 Because intraoperative administration of solutions containing 5% dextrose (D5LR) frequently causes hyperglycemia, prudent anesthesiologists should selectively administer dextrose-containing solutions to those who are at particular risk for intraoperative hypoglycemia (i.e., neonates, chronic malnourished children, and cachectic children). In these instances, it may be sensible to administer solutions with a reduced dextrose concentration.60,64a
Fasting Recommendations
At issue is the effectiveness of fasting in lowering a child’s gastric volume and the benefits of this effect when weighed against the added discomfort and risk of dehydration. Numerous studies of gastric volume and pH have convincingly demonstrated that clear liquids are rapidly emptied from the stomach and the stimulated peristalsis actually serves to decrease gastric volume and acidity. Taking this together with the benefits of improved hydration and mental status, it is clear that prolonged nil per os (NPO) status is unwarranted. NPO guidelines currently in use in many institutions are included in Table 4-1.69 As described earlier, for the vast majority of children, 20 to 40 mL/kg of LR given intraoperatively will provide adequate fluid deficit replacement.
Assessment of Intravascular Volume
Assessment of intravascular volume begins with knowledge of age-related norms for heart rate and BP (see Tables 2-7 and 2-8). Is the heart rate persistently increased, or does it vary with surgical stimulation? Is the pulse pressure narrow, or, more ominously, is the BP reduced for age? Does it vary with positive-pressure breaths? Are the extremities warm? Is capillary refill brisk? What is the urine output? Are these variables changing? What is the rate of the change? When hypovolemia is suspected, observing the response to a 10- to 20-mL/kg bolus of isotonic crystalloid or colloid may test the hypothesis.
Measurement and continuous monitoring of central venous pressure are often helpful in assessing the status of circulating volume (see Figs. 48-2 to 48-5). In addition to traditional central lines introduced into the superior vena cava or left atrium, animal70 and limited clinical71 data suggest that femoral lines that terminate in the abdominal vena cava may also be useful. In infants and children, mean end-expiratory pressure measurements in the right atrial and inferior vena cava differed by less than 1 mm Hg.71 Assessment of changes in the contour of the arterial waveform may also be helpful in assessing volume status and the response to volume administration (see Fig. 10-11).
Ongoing Losses and Third-Spacing
As a rule, 1 mL of shed blood is replaced with 1 mL of colloid (5% albumin or blood) or about 1.5 mL of isotonic crystalloid such as LR.67,72 Isotonic crystalloid is also used to replenish third space losses. Surgical procedures that involve only mild tissue trauma may entail third space losses of 3 to 4 mL/kg/hr. More extensive surgical procedures involving moderate trauma may require replacement equivalent to 5 to 7 mL/kg/hr to adequately support intravascular volume. In small infants undergoing very large abdominal procedures, the losses may approach 10 mL/kg/hr or more.56,58 In neonates, fluid requirements for emergent abdominal surgery for necrotizing enterocolitis have been estimated at up to 50 mL/kg/hr.67 These “losses” result from the vascular compartment and include both evaporation and redistribution of fluid. The latter must be most carefully considered because it is exacerbated by the hemodilution and increased capillary pressures caused by excessive fluid administration.
Postoperative Fluid Management
General Approach
Frequently, losses via surgical or gastric drains are large in both real and relative terms. For example, a neonate with a nasogastric tube may lose more than 100 mL/kg/day (normally 20 to 40 mL/kg/day) in gastric fluid. Therefore, in determining the volume and composition of replacement fluids, it is sometimes helpful to consider the electrolyte content of various losses (Table 8-7).

Postoperative Physiology and Hyponatremia
Therefore, unless isotonic, sodium-containing fluids are provided, postoperative children are universally at risk for developing hyponatremia.73,74 In a retrospective review of 24,412 surgical admissions to a large children’s hospital, the incidence of significant postoperative hyponatremia was 0.34%, with a substantial mortality rate (8.4%) in these previously healthy children.75 If this measured incidence were extended to the entire population in the United States, 7448 children would present annually with postoperative hyponatremia and 626 would die from an entirely avoidable cause. Mortality rates as great as 40% to 60% have been reported after hyponatremia, although it may only be a surrogate marker for a disease with a poor prognosis rather than the actual cause of the death.76,77
In reviewing the etiology of hyponatremia, two factors stand out: extensive extrarenal loss of electrolyte-containing fluid and IV replacement with hypotonic fluids.75 In addition, delay in recognition often plays a major role in associated morbidity. The solution seems a simple one: (1) administration of hypotonic fluids without a specific indication should be avoided postoperatively, (2) ongoing losses should be replaced in a timely fashion, and (3) serum electrolytes should be measured routinely in children exhibiting potential symptoms of hyponatremia (see later discussion).
Postoperative Pulmonary Edema
Children who receive large volumes of fluid intraoperatively are at risk for development of pulmonary edema as operative fluids are mobilized. Usually, fluid mobilization begins to occur on the second postoperative day and continues through day 3 or 4. Although this is less common in children than in the elderly, it occurs occasionally in children with burn injuries78 or in pediatric patients receiving large amounts of fluid during resuscitation from trauma or sepsis. In one review,79 13 patients (11 adults and 2 children) developed postoperative pulmonary edema; all began to exhibit symptoms within 36 hours after surgery and had total net fluid retention in excess of 67 mL/kg postoperatively.
Pathophysiologic States and Their Management
Fluid Overload and Edema
Edema is essentially a “sodium disease,” representing sodium and water overload with excessive fluid residing in the extracellular space. Although intracellular volume changes can sometimes be substantial, prolonged cell swelling represents failure of essential volume regulatory functions and is likely a preterminal event. In fluid-overload states, plasma volume is generally increased unless the balance of Starling forces is disturbed, as in nephrotic syndrome or lymphatic obstruction. Edema formation is opposed by (1) low compliance of the interstitial compartment, (2) increased lymphatic flow, (3) osmotic washout of interstitial proteins, and (4) impedance and elasticity of the proteoglycan gel. The differential diagnosis of fluid overload and edema formation is presented in Table 8-8. Principles of therapy for fluid overload states include the following:


TABLE 8-8 Differential Diagnosis of Fluid Overload and Edema Formation
| Condition | Differential Diagnosis |
|---|---|
| Imbalance of intake and output | Salt poisoning |
| Formula dilution errors | |
| Intravenous infusion errors | |
| Drugs given as sodium salts | |
| Steroid excess with normal sodium intake | Congenital adrenal hyperplasia |
| Exogenous steroids | |
| Perceived decreases in effective plasma volume | ↓ MAP → baroreceptors → ↑ sympathetic tone, ADH, renin, aldosterone |
| Vasodilators | |
| Congestive heart failure | |
| Cirrhosis | |
| Nephrotic syndrome | |
| Impaired sodium excretion | Chronic renal failure |
| Acute glomerular disease (↓ GFR with normal tubular function) | |
| Nonsteroidal antiinflammatory drugs (↓ PGE2 and RBF) | |
| Water excess | SIADH |
| Hypotonic infusion | |
| Stress (↑ ADH) |
ADH, Antidiuretic hormone; GFR, glomerular filtration rate; MAP, mean arterial pressure; PGE2, prostaglandin E2; RBF, renal blood flow; SIADH, syndrome of inappropriate antidiuretic hormone secretion.
Dehydration States
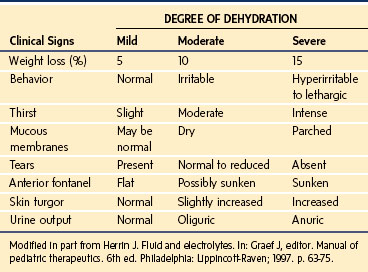
Dehydration states are common in children. The extent of dehydration is best assessed by weight, because clinical signs such as tachycardia, capillary refill, and skin elasticity,80 although often reliable, may be influenced by factors other than hydration status. A capillary refill time of 1.5 to 3.0 seconds, for example, suggests a fluid deficit of between 50 and 100 mL/kg, yet this sign is extremely dependent on ambient temperature.81 Similarly, poor skin elasticity reflects significant volume loss, yet elasticity may be well preserved in children with hypernatremic dehydration.80 Clinical signs associated with varying levels of dehydration are presented in Table 8-9.
As a first approximation, correction of most dehydration states in older children is most readily achieved with administration of a simple bolus of NS, LR, or PLASMA-LYTE 148 (balanced crystalloid solution). In infants or children with unusual, prolonged, or severe dehydration, however, management must be more precise. A five-point questionnaire to assess the severity of dehydration may help develop an appropriate treatment strategy82:
1. Does a volume deficit exist and, if so, how great is it?
As noted previously, assessment of volume deficit is best made by weight, yet rough estimates of 5% (mild), 10% (moderate), and 15% (severe) may be made in infants based on clinical signs (see Table 8-9).
2. Does an osmolar disturbance exist? Is it acute or chronic?
Approximately 15% of dehydrated children present with hypertonic dehydration (Na+ > 150 mEq/L). These children are at greatest risk and have usually experienced the greatest fluid losses for a given set of clinical signs.83 If the condition is chronic, they may require extensive, slow rehydration over much longer periods.84
In general, chronic dehydration states must be repaired slowly and acute dehydration states (<24 hours) may be corrected more rapidly. This is because cell volume equilibration occurs acutely through gain or loss of electrolytes (which are moved rapidly) and chronically through gain or loss of organic osmolytes (which are moved more slowly).11 Reequilibration of brain cell volume during correction of hypertonicity can be very slow, mandating patience in correction of chronic fluid deficits. Similarly, rapid correction of hyponatremic disturbances can be hazardous,75 even when seemingly safe isotonic solutions are employed.85
3. Does an acid–base abnormality exist?
Quantitation of the child’s acid–base status gives useful, although limited, information as to the severity of dehydration. When evaluating acid–base status, it is important to recall that bicarbonate reabsorption and urine acidification are limited in preterm and young infants, leaving even the normal infant in a state of mild metabolic acidosis (pH, 7.3; serum bicarbonate 20 to 21 mEq/L [normal 22 to 26 mEq/L]). Although slow, spontaneous correction of acid–base status is typically observed on rehydration, rapid fluid boluses in poorly perfused children may result in a transient “reperfusion acidosis” as returning circulation washes the products of anaerobic metabolism out of the tissues. In this setting, or when renal insufficiency exists, blood-buffering capacity is such that children with serum bicarbonate concentrations lower than 8 mEq/L or pH lower than 7.2 may benefit from administration of supplemental base (sodium bicarbonate) (Fig. 8-6).82
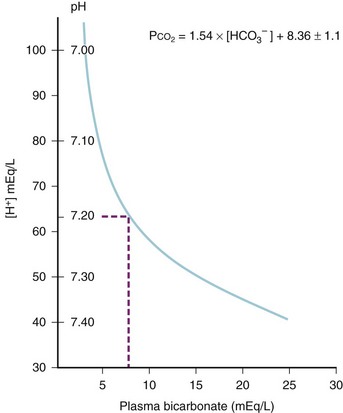
FIGURE 8-6 Data from children with metabolic acidosis127 were used to depict the displacement of pH as serum bicarbonate declines. The zone of rapid pH displacement (pH < 7.20) has a slope that is several times greater than the zone of gradual pH displacement (pH ≥ 7.20). As the pH moves through the zone of rapid pH displacement, a further decline of serum bicarbonate, of as little as 1 or 2 mEq/L, produces a highly leveraged further decrease of pH. [H],+ Hydrogen ion concentration; [HCO3−], bicarbonate ion concentration; Pco2, carbon dioxide tension.
(From Kallen RJ. The management of diarrheal dehydration in infants using parenteral fluids. Pediatr Clin North Am 1990;37:265-86.)

4. Is renal function impaired?
Initial evaluation includes the timing of the last urine void and recent urine output, measurement of urine specific gravity, and serum levels of blood urea nitrogen and creatinine. If uncertainty persists, measurement of serum and urine electrolytes for comparison and calculation of the FENa is indicated (see Chapter 26).
5. What is the state of potassium balance?
Potassium homeostasis is critical to life, and serum potassium levels are generally maintained within a very narrow range. Nonetheless, serum potassium concentrations do not reflect whole-body stores and substantial potassium depletion may exist in the presence of modest changes in serum potassium concentration (K+serum). Gastrointestinal losses or metabolic acidosis is usually accompanied by a potassium deficit, whereas other dehydration states are not. Rapid fluid boluses or pH correction, or both, may acutely reduce K+serum,86 and refractory hypokalemia may occur in children deficient in magnesium.87 In all cases, adequate renal function should be present before administration of potassium, and complete repletion should be accomplished over 48 to 72 hours. Once the nature and severity of dehydration have been determined, the clinician may proceed using any of a variety of correction strategies. In one approach, moderate to severe dehydration deficits may be estimated, as in Table 8-9. Fluid and electrolyte repair may then proceed according to a three-phase approach wherein circulating plasma volume, perfusion, and urine output are restored rapidly using isotonic crystalloid or colloid solution and remaining deficits are corrected over 24 hours as follows88:


Hypernatremia and Hyponatremia
Hypernatremia
In contrast to its rareness in adults, acute hypernatremia is common in children. A mortality rate greater than 40% for the acute disorder and 10% for the chronic disorder has been quoted for hypernatremia (serum sodium >160 mEq/L).76,89 Mortality and permanent neurologic injury are even more common in infants. Depending on degree and duration, neurologic findings include irritability and coma. Seizures may be a presenting symptom, but they are more commonly encountered after the start of therapy. Children with acute conditions are usually symptomatic, whereas those with chronic conditions (acclimated individuals) are typically asymptomatic. General principles for treatment of hypernatremia are as follows:
 In the setting of circulatory collapse, colloid or NS bolus should be administered. Although the assertion is debatable, a colloid bolus provides the theoretical benefit of sustained hemodynamic support with lower fluid load. Saline, in contrast, rapidly reequilibrates, necessitating repeated boluses while adding to the total salt burden.


Hyponatremia
Hyponatremia is also common in infants and children. Increasing prevalence due to erroneous formula dilution has intermittently been reported.90,91 In the practice of anesthesiology, mild hyponatremia is a common postoperative condition after surgery of any severity92–94; in neurosurgical patients, hyponatremia may represent cerebral salt wasting or syndrome of inappropriate antidiuretic hormone secretion (SIADH).95 In general, symptomatic patients are acutely hyponatremic and asymptomatic individuals are chronically hyponatremic.96 After surgery, acutely hyponatremic children may present with nonspecific symptoms that are often erroneously attributed to other causes. Early central nervous system symptoms include headache, nausea, weakness, and anorexia. Advancing symptoms include mental status changes, confusion, irritability, progressive obtundation, and seizures. Respiratory arrest (or irregularity) is a common manifestation of advanced hyponatremia.
When planning to correct hyponatremia, the presence of symptoms must be considered a medical emergency, whereas asymptomatic children do not require rapid intervention. Chronic hyponatremia must be corrected slowly and by no more than 0.5 mEq/L/hr to avoid neurologic complications that include central pontine myelinolysis.97 The best treatment for acute hyponatremia is early recognition and intervention. Because hypoxia exacerbates the neurologic injury, the simple ABCs of resuscitation are attended to first, and the airway is secured in the child who has seizures or respiratory irregularity. Hyponatremic seizures may be quieted by relatively modest (3 to 6 mEq/L) increases of serum sodium.98 In several series,91,99,100 such limited, rapid correction of symptomatic hyponatremia with hypertonic saline (514 mEq/L NaCl) was found to be well tolerated. It should be emphasized, however, that complete correction is unnecessary and unwise.101 Initial therapy is aimed at increasing the serum sodium concentration no more than is necessary to stop seizure activity (usually 3 to 5 mEq/L). Further, the correction takes place over several days. Hypertonic saline may be used for the correction until the serum sodium increases to greater than 120 mEq/L. Remembering that TBW may range from 75% in infancy to 60% or less in older children, total sodium deficit is estimated as follows:


Because such calculations involve estimates, frequent measurement of the serum sodium concentration is necessary during correction. As with hypernatremia, much of the morbidity and mortality associated with hyponatremia relates to complicating factors such as seizures and hypoxia that may occur during therapy. Therefore, children undergoing therapy should be cared for in a monitored setting. When overzealous correction has occurred, there may be value in acutely relowering Na+serum using hypotonic fluids,96 although such therapy is not without its own hazards.
General principles for treatment of hyponatremia are as follows:
 Asymptomatic hyponatremia in and of itself need not be rapidly corrected. Associated cardiovascular compromise due to volume depletion may be addressed by colloid bolus or administration of isotonic saline (1 L/m2/day). Provision of sodium is accompanied by free water restriction.


 If the attendant fluid load is excessive or if oliguria is present, diuretics may be useful.
Disorders of Potassium Homeostasis
Hyperkalemia
Hyperkalemia is occasionally the presenting finding in conditions such as congenital adrenal hyperplasia. More commonly, it results from acute renal insufficiency, massive tissue injury, acidosis, or iatrogenic mishaps. In the operating room, acute hyperkalemia may follow the use of succinylcholine in children with myopathies, burns, upper and lower motor neuron lesions, chronic sepsis, or disuse atrophy and occasionally during massive, rapid transfusion of red blood cells or whole blood (see Chapters 6 and 10).102 It may occur with rhabdomyolysis or as a late sign in malignant hyperthermia.
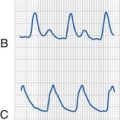
Although neurologic status is the main concern for children with abnormal serum sodium levels, cardiac status (rate and rhythm) determines the care of children with hyperkalemia. In children with hyperkalemia, the appearance of peaked T waves is followed by lengthening of the PR interval and widening of the QRS complex until P waves are lost. Finally, the QRS complex merges with its T wave to produce a sinusoidal pattern (Fig. 8-7). Successful treatment traditionally utilizes the following approach:
 Emergent therapy is first directed toward antagonism of the cardiac effects of potassium by cautious administration of intravenous calcium (calcium chloride [10 to 30 mg/kg] as 0.1 to 0.3 mL/kg of a 10% solution, or calcium gluconate [30 to 100 mg/kg] as 0.3 to 1 mL/kg of a 10% solution) over 3 to 5 minutes to avoid bradycardia. Calcium does not decrease the serum potassium concentration but rather reestablishes the gradient between the resting membrane potential, which is increased in the presence of hyperkalemia, and the threshold potential, which is determined by the calcium concentration. It also increases the refractory period of the action potential, the net effect being the prevention of spontaneous depolarization.


 After stabilization, attention is directed toward removal of the whole-body potassium burden (sodium polystyrene sulfonate [Kayexalate], furosemide, dialysis) and correction of the underlying cause (Fig. 8-8).
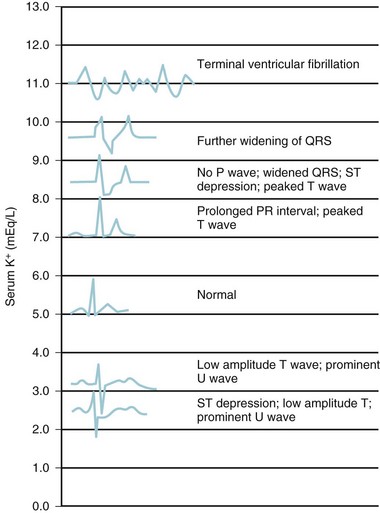
FIGURE 8-7 Electrocardiographic changes associated with hyperkalemia.
(From Williams GS, Klenk EL, Winters RW. Acute renal failure in pediatrics. In: Winters RW, editor. The body fluids in pediatrics: medical, surgical, and neonatal disorders of acid-base status, hydration, and oxygenation. Boston: Little, Brown; 1973. p. 523-57.)
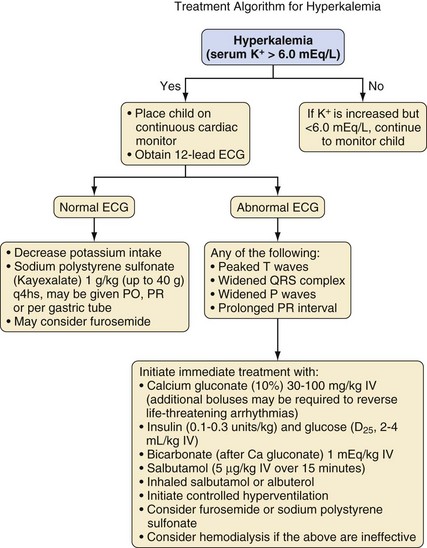
The knowledge that β-adrenergic stimulation modulates the translocation of potassium into the intracellular space103,104 has prompted the consideration of β-agonists in the treatment of acute hyperkalemia.105–108 In children, a single infusion of an IV β-agonist such as salbutamol (5 µg/kg over 15 minutes) effectively reduces serum potassium concentrations within 30 minutes. Because of the rapidity, efficacy, and safety of salbutamol in children, it has become the first-choice treatment for hyperkalemia.105 In addition to IV therapy, both salbutamol109 and albuterol108 by inhalation effectively reduce the serum potassium concentration. It should be noted that at this time, salbutamol is not available in IV formulations in the United States. The inhalation route has the significant advantages of being readily available in emergency departments and not requiring IV access. However, the observation that a paradoxical exacerbation of hyperkalemia sometimes occurs on initiation of treatment,109 together with concerns regarding the possibility of associated arrhythmias,110 suggests that more experience is required before such therapy can be considered the standard of care. Inhalation of albuterol during such an event in the operating room may speed the reduction in serum potassium while other methods of treatment are instituted.
Hypokalemia
Hypokalemia is most common in children as a complication of diarrhea or persistent vomiting associated with gastroenteritis. Muscle weakness is the most common sign in hypokalemia and has been correlated with the serum potassium concentration.111 In the operating room or ICU, hypokalemia may also accompany a wide variety of other conditions, including diabetes, hyperaldosteronism, pyloric stenosis, starvation, renal tubular disease, chronic steroid or diuretic use, and β-agonist therapy. Severe hypokalemia can also be accompanied by electrocardiographic changes, including QT prolongation, diminution of the T wave, and appearance of U waves (see Fig. 8-7).
Syndrome of Inappropriate Antidiuretic Hormone Secretion
Many non-osmotic factors are capable of stimulating ADH release, and these can occasionally override osmotic control priorities. When this occurs, clinicians have historically deemed the increased ADH concentrations “inappropriate” because control of the serum osmolarity is lost (see Chapter 26). As detailed earlier, however, intravascular depletion is the most potent stimulus for vasopressin release, and it is hardly inappropriate that defense of circulation takes priority over defense of serum sodium levels. Pain, surgical stress, critical illness, sepsis, pulmonary disease, central nervous system injury, drugs, and a variety of other factors may all stimulate ADH release above and beyond that necessary to maintain osmolar balance.
SIADH is common in children yet is often overlooked. Minor head trauma, for example, may elicit spikes in ADH levels, although infrequently to the extent that it produces serious hyponatremia and seizures.112 Urine output after spinal fusion is often reduced because of increased concentrations of ADH, which usually return to normal within 24 hours without therapy.113 Infants with bronchiolitis and hyperinflated lungs frequently demonstrate markedly increased plasma ADH concentrations and exhibit fluid retention, weight gain, urinary concentration, and plasma hypoosmolality until their illness begins to resolve.114 Hyponatremia to the point of seizures, however, is only occasionally observed.


Diabetes Insipidus
In the operating room and the ICU, diabetes insipidus is most commonly associated with the care of neurosurgical patients.115–117 Diabetes insipidus is also caused by neuroendocrine failure in brain death, and management may be necessary if organ donation is requested.118,119 Diabetes insipidus results from decreased secretion of, or renal insensitivity to, vasopressin (see Chapter 26). Manifestations include massive polyuria, volume contraction, dehydration, and plasma hyperosmolality. Dilute polyuria (<250 mOsm, >2 mL/kg/hr) in the presence of hypernatremia (Na+ > 145 mEq/L) with hyperosmolality (>300 mOsm/L) is the hallmark. In central diabetes insipidus, administration of desmopressin concentrates the urine but water deprivation does not. Postoperative diabetes insipidus may initially be difficult to distinguish from mobilization of operative fluids.
Attempts have been made to develop protocols for perioperative management of diabetes insipidus.120 Because vasopressin is difficult to titrate to urine output, our practice involves maximal antidiuresis and fluid restriction. In this setting, volume status must be monitored closely, because urine output is no longer a marker of renal perfusion. Children who need close perioperative monitoring for the development of diabetes insipidus include those with preexisting diabetes insipidus as well as those who are undergoing resection of craniopharyngiomas or pituitary lesions or other procedures that involve resection or manipulation of the pituitary stalk.121
Hyperchloremic Acidosis
Administration of large amounts of NS can lead to excess serum chloride.122 The chloride content of NS is 154 mEq/L. This excess of chloride ions can lead to a hyperchloremic acidosis, which has been categorized as a strong-ion acidosis.123,124 This type of acidosis results from an excess of strong anions (e.g., lactate, ketoacids, sulfates) relative to the strong cations. As the strong ion difference increases, acidosis occurs. The magnitude of the acidosis is related to the amount of NS administered as well as the rate of administration. Infusions of 35 mL/kg NS over 2 hours in healthy patients undergoing gynecologic surgery resulted in acidosis. Acidosis did not occur with similar infusions of LR.122
Cerebral Salt Wasting
Cerebral salt wasting (also known as renal salt wasting) is a hyponatremic syndrome of unclear etiology. Most commonly recognized in neurosurgical patients, it is a primary natriuresis probably related to dysregulation of brain or atrial natriuretic peptides. The condition has been increasingly recognized, and an incidence as great as 5% has been reported in children with brain tumors.125 Cerebral salt wasting can sometimes be difficult to distinguish from SIADH but, unlike the latter, the former is marked by hyponatremia, natriuresis, and hypovolemia. Initial therapy consists of fluid resuscitation with isotonic solutions and ongoing correction of intravascular volume depletion with sodium-containing solutions. Although spontaneous resolution is the norm, persistent cases may require mineralocorticoid therapy.
Arieff AI, Ayus JC, Fraser CL. Hyponatraemia and death or permanent brain damage in healthy children. BMJ. 1992;304:1218–1222.
Constable PD. Hyperchloremic acidosis: the classic example of strong ion acidosis. Anesth Analg. 2003;96:919–922.
Friis-Hansen B. Body water compartments in children: changes during growth and related changes in body composition. Pediatrics. 1961;28:169–181.
Holliday MA, Friedman AL, Segar W, et al. Acute hospital-induced hyponatremia in children: a physiologic approach. J Pediatr. 2004;145:584–587.
Holliday MA, Segar WE. The maintenance need for water in parenteral fluid therapy. Pediatrics. 1957;19:823–832.
Shires T, Williams J, Brown F. Acute change in extracellular fluids associated with major surgical procedures. Ann Surg. 1961;154:803–810.
1 Fenstermacher JD, Johnson JA. Filtration and reflection coefficients of the rabbit blood-brain barrier. Am J Physiol. 1966;211:341–346.
2 Perl W, Chowdhury P, Chinard FP. Reflection coefficients of dog lung endothelium to small hydrophilic solutes. Am J Physiol. 1975;228:797–809.
3 Lamke LO, Liljedahl SO. Plasma volume changes after infusion of various plasma expanders. Resuscitation. 1976;5:93–102.
4 Moon PF, Hollyfield-Gilbert MA, Myers TL, et al. Effects of isotonic crystalloid resuscitation on fluid compartments in hemorrhaged rats. Shock. 1994;2:355–361.
5 Svensen C, Hahn RG. Volume kinetics of Ringer solution, dextran 70, and hypertonic saline in male volunteers. Anesthesiology. 1997;87:204–212.
6 Christ F, Niklas M, Kreimeier U, et al. Hyperosmotic-hyperoncotic solutions during abdominal aortic aneurysm (AAA) resection. Acta Anaesthesiol Scand. 1997;41:62–70.
7 Younes RN, Aun F, Accioly CQ, et al. Hypertonic solutions in the treatment of hypovolemic shock: a prospective, randomized study in patients admitted to the emergency room. Surgery. 1992;111:380–385.
8 Richardson PD, Granger DN, Mailman D, et al. Permeability characteristics of colonic capillaries. Am J Physiol. 1980;239:G300–G305.
9 Kongstad L, Moller AD, Grande PO. Reflection coefficient for albumin and capillary fluid permeability in cat calf muscle after traumatic injury. Acta Physiol Scand. 1999;165:369–377.
10 Greissman A, Silver P, Nimkoff L, et al. Albumin bolus administration versus continuous infusion in critically ill hypoalbuminemic pediatric patients. Intensive Care Med. 1996;22:495–499.
11 McManus ML, Churchwell KB, Strange K. Regulation of cell volume in health and disease. N Engl J Med. 1995;333:1260–1266.
12 Chamberlin ME, Strange K. Anisosmotic cell volume regulation: a comparative view. Am J Physiol. 1989;257:C159–C173.
13 Schrier RW, Abraham WT. Hormones and hemodynamics in heart failure. N Engl J Med. 1999;341:577–585.
14 Abraham WT, Schrier RW. Body fluid volume regulation in health and disease. Adv Intern Med. 1994;39:23–47.
15 Fitzsimons JT. Angiotensin, thirst, and sodium appetite. Physiol Rev. 1998;78:583–686.
16 Navar LG. The kidney in blood pressure regulation and development of hypertension. Med Clin North Am. 1997;81:1165–1198.
17 Levin ER, Gardner DG, Samson WK. Natriuretic peptides. N Engl J Med. 1998;339:321–328.
18 Braith RW, Mills RM, Jr., Wilcox CS, et al. Breakdown of blood pressure and body fluid homeostasis in heart transplant recipients. J Am Coll Cardiol. 1996;27:375–383.
19 Friis-Hansen B. Body water compartments in children: changes during growth and related changes in body composition. Pediatrics. 1961;28:169–181.
20 Holliday M. The evolution of therapy for dehydration: should deficit therapy still be taught? Pediatrics. 1996;98:171–177.
21 Gamble J, Ross G, Tisdall F. The metabolism of fixed base in fasting. J Biol Chem. 1923;57:633–695.
22 Linderkamp O, Versmold HT, Riegel KP, et al. Estimation and prediction of blood volume in infants and children. Eur J Pediatr. 1977;125:227–234.
23 Cassady G. Plasma volume studies in low birth weight infants. Pediatrics. 1966;38:1020–1027.
24 Feldschuh J, Enson Y. Prediction of the normal blood volume: relation of blood volume to body habitus. Circulation. 1977;56:605–612.
25 Herrin J. Fluid and electrolytes. In: Graef JW, ed. Manual of pediatric therapeutics. 6th ed. Philadelphia: Lippincott-Raven; 1997:63–75.
26 Latta T. Central Board of Health, London: Relative to the treatment of cholera by the copious injection of aqueous and saline fluids into the vein. Lancet. 1831;2:274–277.
27 Blackfan K, Maxcy K. Intraperitoneal injection of saline solution. Am J Dis Child. 1918;15:19–28.
28 Darrow D. Therapeutic measures promoting recovery from the physiologic disturbances of infantile diarrhea. Pediatrics. 1952;9:519–533.
29 Holliday MA, Segar WE. The maintenance need for water in parenteral fluid therapy. Pediatrics. 1957;19:823–832.
30 Way C, Dhamrait R, Wade A, Walker I. Perioperative fluid therapy in children: a survey of current prescribing practice. Br J Anaesth. 2006;97:371–379.
30a Holliday MA, Ray PE, Friedman AL. Fluid therapy for children: facts, fashions and questions. Arch Dis Child. 2007;92:546–550.
30b Holliday MA, Friedman AL, Segar WE, Chesney R, Finberg L. Acute hospital-induced hyponatremia in children: a physiologic approach. J of Pediatrics. 2004;145:584–587.
30c Holliday MA, Segar WE, Friedman A, Chesney R, Finberg L. Intravenous fluids for seriously ill children. Lancet. 2004;363(9404):241. author reply:242
31 Holliday MA. Isotonic saline expands extracellular fluid and is inappropriate for maintenance therapy. Pediatrics. 2005;115:193–194.
32 Holliday MA, Ray PE, Friedman AL. Fluid therapy for children: facts, fashions and questions. Arch Dis Child. 2007;92:546–550.
33 Holliday MA, Friedman AL, Segar W, et al. Acute hospital-induced hyponatremia in children: a physiologic approach. J Pediatr. 2004;145:584–587.
34 Armon K, Playfor SD, Riordan A, Millman G, Khader A. Paediatric Research Society: Hyponatraemia and hypokalaemia during intravenous fluid administration. Arch Dis Child. 2008;93:285–287.
35 Snaith R, Peutrell J, Ellis D. An audit of intravenous fluid prescribing and plasma electrolyte monitoring: a comparison with guidelines from the National Patient Safety Agency. Pediatr Anesth. 2008;18:940–946.
36 Lorenz JM, Kleinman LI, Kotagal UR, et al. Water balance in very low-birth-weight infants: relationship to water and sodium intake and effect on outcome. J Pediatr. 1982;101:423–432.
37 Lorenz JM, Kleinman LI, Ahmed G, et al. Phases of fluid and electrolyte homeostasis in the extremely low birth weight infant. Pediatrics. 1995;96:484–489.
38 Gold PS, Brace RA. Fetal whole-body permeability: surface area product and reflection coefficient for plasma proteins. Microvasc Res. 1988;36:262–274.
39 Takahashi N, Hoshi J, Nishida H. Water balance, electrolytes and acid-base balance in extremely premature infants. Acta Paediatr Jpn. 1994;36:250–255.
40 Coté CJ, Jobes DR, Schwartz AJ, et al. Two approaches to cannulation of a child’s internal jugular vein. Anesthesiology. 1979;50:371–373.
41 Nicolson SC, Sweeney MF, Moore RA, Jobes DR. Comparison of internal and external jugular cannulation of the central circulation in the pediatric patient. Crit Care Med. 1985;13:747–749.
42 Hodge D, 3rd., Fleisher G. Pediatric catheter flow rates. Am J Emerg Med. 1985;3:403–407.
43 Hodge D, 3rd., Delgado-Paredes C, Fleisher G. Central and peripheral catheter flow rates in “pediatric” dogs. Ann Emerg Med. 1986;15:1151–1154.
44 Fleisher G, Caputo G, Baskin M. Comparison of external jugular and peripheral venous administration of sodium bicarbonate in puppies. Crit Care Med. 1989;17:251–254.
45 Rosetti VA, Thompson BM, Miller J, et al. Intraosseous infusion: an alternative route of pediatric intravascular access. Ann Emerg Med. 1985;14:885–888.
46 Fiser DH. Intraosseous infusion. N Engl J Med. 1990;322:1579–1581.
47 Hodge D, 3rd., Delgado-Paredes C, Fleisher G. Intraosseous infusion flow rates in hypovolemic “pediatric” dogs. Ann Emerg Med. 1987;16:305–307.
48 Selby IR, James MR. The intraosseous route for induction of anaesthesia. Anaesthesia. 1993;48:982–984.
49 Schwartz RE, Pasquariello CA, Stayer SA. Elective use in pediatric anesthesia of intraosseous infusion: proceed only with extreme caution. Anesth Analg. 1993;76:918–919.
50 Stewart FC, Kain ZN. Intraosseous infusion: elective use in pediatric anesthesia. Anesth Analg. 1992;75:626–629.
51 Moscati R, Moore GP. Compartment syndrome with resultant amputation following intraosseous infusion. Am J Emerg Med. 1990;8:470–471.
52 Galpin RD, Kronick JB, Willis RB, et al. Bilateral lower extremity compartment syndromes secondary to intraosseous fluid resuscitation. J Pediatr Orthop. 1991;11:773–776.
53 Ribeiro JA, Price CT, Knapp DR, Jr. Compartment syndrome of the lower extremity after intraosseous infusion of fluid: a report of two cases. J Bone Joint Surg Am. 1993;75:430–433.
54 Fiser RT, Walker WM, Seibert JJ, et al. Tibial length following intraosseous infusion: a prospective, radiographic analysis. Pediatr Emerg Care. 1997;13:186–188.
55 Shires T, Williams J, Brown F. Acute change in extracellular fluids associated with major surgical procedures. Ann Surg. 1961;154:803–810.
56 Bennett EJ, Daughety MJ, Jenkins MT. Fluid requirements for neonatal anesthesia and operation. Anesthesiology. 1970;32:343–350.
57 Philippart AI, Canty TG, Filler RM. Acute fluid volume requirements in infants with anterior abdominal wall defects. J Pediatr Surg. 1972;7:553–558.
58 Mollitt DL, Ballantine TV, Grosfeld JL, et al. A critical assessment of fluid requirements in gastroschisis. J Pediatr Surg. 1978;13:217–219.
59 Williams EL, Hildebrand KL, McCormick SA, et al. The effect of intravenous lactated Ringer’s solution versus 0.9% sodium chloride solution on serum osmolality in human volunteers. Anesth Analg. 1999;88:999–1003.
60 Bailey AG, McNaull PP, Jooste E, Tuchman JB. Perioperative crystalloid and colloid fluid management in children: where are we and how did we get here? Anesth Analg. 2010;110:375–390.
61 Sumpelmann R, Kretz FJ, Gabler R, et al. Hydroxyethyl starch 130/0.42/6:1 for perioperative plasma volume replacement in children: preliminary results of a European prospective multicenter observational postauthorization safety study (PASS). Pediatr Anesth. 2008;18:929–933.
62 Mikawa K, Maekawa N, Goto R, et al. Effects of exogenous intravenous glucose on plasma glucose and lipid homeostasis in anesthetized children. Anesthesiology. 1991;74:1017–1022.
63 Welborn LG, McGill WA, Hannallah RS, et al. Perioperative blood glucose concentrations in pediatric outpatients. Anesthesiology. 1986;65:543–547.
64 Mercer S, Bass J. Hypoglycemia associated with pediatric surgical procedures. Can J Surg. 1983;26:246–249.
64a Murat I, Humblot A, Girault L, Piana F. Neonatal fluid management. Best Pract Res Clin Anaesth. 2010;24:365–374.
64b Nishina K, Mikawa K, Maekawa N, Asano M, Obara H. Effects of exogenous intravenous glucose on plasma glucose and lipid homeostasis in anesthetized infants. Anesthesiology. 1995;83:258–263.
65 Aouifi A, Neidecker J, Vedrinne C, et al. Glucose versus lactated Ringer’s solution during pediatric cardiac surgery. J Cardiothorac Vasc Anesth. 1997;11:411–414.
66 Nicolson SC, Jobes DR, Zucker HA, et al. The effect of administering or withholding dextrose in pre-bypass intravenous fluids on intraoperative blood glucose concentrations in infants undergoing hypothermic circulatory arrest. J Cardiothorac Vasc Anesth. 1992;6:316–318.
67 Murat I, Dubois MC. Perioperative fluid therapy in pediatrics. Pediatr Anesth. 2008;18:363–370.
68 Sumpelmann R, Mader T, Eich C, et al. A novel isotonic-balanced electrolyte solution with 1% glucose for intraoperative fluid therapy in children: results of a prospective multicentre observational post-authorization safety study (PASS). Pediatr Anesth. 2010;20:977–981.
69 Practice guidelines for preoperative fasting and the use of pharmacologic agents to reduce the risk of pulmonary aspiration: application to healthy patients undergoing elective procedures. An updated report by the American Society of Anesthesiologists Committee on Standards and Practice Parameters. Anesthesiology. 2011;114:495–511.
70 Berg RA, Lloyd TR, Donnerstein RL. Accuracy of central venous pressure monitoring in the intraabdominal inferior vena cava: a canine study. J Pediatr. 1992;120:67–71.
71 Lloyd TR, Donnerstein RL, Berg RA. Accuracy of central venous pressure measurement from the abdominal inferior vena cava. Pediatrics. 1992;89:506–508.
72 SAFE Study Investigators. A comparison of albumin and saline for fluid resuscitation in the intensive care unit. N Engl J Med. 2004;350:2247–2256.
73 Halberthal M, Halperin ML, Bohn D. Lesson of the week. Acute hyponatremia in children admitted to hospital: retrospective analysis of factors contributing to its development and resolution. BMJ. 2001;322:780–782.
74 Judd BA, Haycock GB, Dalton N, Chantler C. Hyponatremia in premature babies and following surgery in older children. Acta Paediatr Scand. 1987;76:385–393.
75 Arieff AI, Ayus JC, Fraser CL. Hyponatraemia and death or permanent brain damage in healthy children. BMJ. 1992;304:1218–1222.
76 Guarner J, Hochman J, Kurbatova E, Mullins R. Study of outcomes associated with hyponatremia and hypernatremia in children. Pediatr Dev Pathol. 2011;14:117–123.
77 Baran D, Hutchinson TA. The outcome of hyponatremia in a general hospital population. Clinical Nephrol. 1984;22:72–76.
78 Zak AL, Harrington DT, Barillo DJ, et al. Acute respiratory failure that complicates the resuscitation of pediatric patients with scald injuries. J Burn Care Rehabil. 1999;20:391–399.
79 Arieff AI. Fatal postoperative pulmonary edema: pathogenesis and literature review. Chest. 1999;115:1371–1377.
80 Laron Z. Skin turgor as a quantitative index of dehydration in children. Pediatrics. 1957;19:816–821.
81 Saavedra JM, Harris GD, Li S, et al. Capillary refilling (skin turgor) in the assessment of dehydration. Am J Dis Child. 1991;145:296–298.
82 Kallen RJ. The management of diarrheal dehydration in infants using parenteral fluids. Pediatr Clin North Am. 1990;37:265–286.
83 Conley SB. Hypernatremia. Pediatr Clin North Am. 1990;37:365–372.
84 Lee JH, Arcinue E, Ross BD. Brief report: organic osmolytes in the brain of an infant with hypernatremia. N Engl J Med. 1994;331:439–442.
85 Ellis SJ. Extrapontine myelinolysis after correction of chronic hyponatraemia with isotonic saline. Br J Clin Pract. 1995;49:49–50.
86 Malone DR, McNamara RM, Malone RS, et al. Hypokalemia complicating emergency fluid resuscitation in children. Pediatr Emerg Care. 1990;6:13–16.
87 Whang R, Flink EB, Dyckner T, et al. Magnesium depletion as a cause of refractory potassium repletion. Arch Intern Med. 1985;145:1686–1689.
88 Finberg L. Hypernatremic (hypertonic) dehydration in infants. N Engl J Med. 1973;289:196–198.
89 Moritz ML, Ayus JC. The changing pattern of hypernatremia in hospitalized children. Pediatrics. 1999;104:435–439.
90 Vanapruks V, Prapaitrakul K. Water intoxication and hyponatraemic convulsions in neonates. Arch Dis Child. 1989;64:734–735.
91 Keating JP, Schears GJ, Dodge PR. Oral water intoxication in infants: an American epidemic. Am J Dis Child. 1991;145:985–990.
92 Guy AJ, Michaels JA, Flear CT. Changes in the plasma sodium concentration after minor, moderate and major surgery. Br J Surg. 1987;74:1027–1030.
93 Neville KA, Sandeman DJ, Rubenstein A, et al. Prevention of hyponatremia during maintenance intravenous fluid administration: a prospective randomized study of fluid type versus fluid rate. J Pediatr. 2010;156:313–319.
94 Rando K, Zunini G, Negroto A. Intraoperative hyponatremia during craniofacial surgery. Pediatr Anesth. 2009;19:358–363.
95 Sivakumar V, Rajshekhar V, Chandy MJ. Management of neurosurgical patients with hyponatremia and natriuresis. Neurosurgery. 1994;34:269–274.
96 Soupart A, Ngassa M, Decaux G. Therapeutic relowering of the serum sodium in a patient after excessive correction of hyponatremia. Clin Nephrol. 1999;51:383–386.
97 Gross P, Reimann D, Neidel J, et al. The treatment of severe hyponatremia. Kidney Int Suppl. 1998;64:S6–11.
98 Gruskin AB, Sarnaik A. Hyponatremia: pathophysiology and treatment: a pediatric perspective. Pediatr Nephrol. 1992;6:280–286.
99 Sharf RE. Seizure from hyponatremia in infants: early recognition and treatment. Arch Fam Med. 1993;2:647–652.
100 Sarnaik AP, Meert K, Hackbarth R, et al. Management of hyponatremic seizures in children with hypertonic saline: a safe and effective strategy. Crit Care Med. 19, 1991. 758–752
101 Ayus JC, Krothapalli RK, Arieff AI. Changing concepts in treatment of severe symptomatic hyponatremia: rapid correction and possible relation to central pontine myelinolysis. Am J Med. 1985;78:897–902.
102 Larach MG, Rosenberg H, Gronert GA, et al. Hyperkalemic cardiac arrest during anesthesia in infants and children with occult myopathies. Clin Pediatr (Phila). 1997;36:9–16.
103 Rosa RM, Silva P, Young JB, et al. Adrenergic modulation of extrarenal potassium disposal. N Engl J Med. 1980;302:431–434.
104 Williams ME, Gervino EV, Rosa RM, et al. Catecholamine modulation of rapid potassium shifts during exercise. N Engl J Med. 1985;312:823–827.
105 Kemper MJ, Harps E, Hellwege HH, et al. Effective treatment of acute hyperkalaemia in childhood by short-term infusion of salbutamol. Eur J Pediatr. 1996;155:495–497.
106 Kim HJ. Acute therapy for hyperkalemia with the combined regimen of bicarbonate and beta(2)-adrenergic agonist (salbutamol) in chronic renal failure patients. J Korean Med Sci. 1997;12:111–116.
107 Hanna MG, Stewart J, Schapira AH, et al. Salbutamol treatment in a patient with hyperkalaemic periodic paralysis due to a mutation in the skeletal muscle sodium channel gene (SCN4A). J Neurol Neurosurg Psychiatry. 1998;65:248–250.
108 Greenberg A. Hyperkalemia: treatment options. Semin Nephrol. 1998;18:46–57.
109 Mandelberg A, Krupnik Z, Houri S, et al. Salbutamol metered-dose inhaler with spacer for hyperkalemia: how fast? how safe? Chest. 1999;115:617–622.
110 Semmekrot BA, Monnens LA. A warning for the treatment of hyperkalaemia with salbutamol. Eur J Pediatr. 1997;156:420.
111 Reid A, Anderson B, Futter M, Holford NHG. Relationship of muscle strength to potassium concentration in a hypokalaemic infant. Anaesth Intensive Care. 1997;25:525–527.
112 Padilla G, Leake JA, Castro R, et al. Vasopressin levels and pediatric head trauma. Pediatrics. 1989;83:700–705.
113 Burrows FA, Shutack JG, Crone RK. Inappropriate secretion of antidiuretic hormone in a postsurgical pediatric population. Crit Care Med. 1983;11:527–531.
114 Gozal D, Colin AA, Jaffe M, Hochberg Z. Water, electrolyte, and endocrine homeostasis in infants with bronchiolitis. Pediatr Res. 1990;27:204–209.
115 Balestrieri FJ, Chernow B, Rainey TG. Postcraniotomy diabetes insipidus: who’s at risk? Crit Care Med. 1982;10:108–110.
116 Baskin DS, Wilson CB. Surgical management of craniopharyngiomas: a review of 74 cases. J Neurosurg. 1986;65:22–27.
117 Honegger J, Buchfelder M, Fahlbusch R. Surgical treatment of craniopharyngiomas: endocrinological results. J Neurosurg. 1999;90:251–257.
118 Staworn D, Lewison L, Marks J, et al. Brain death in pediatric intensive care unit patients: incidence, primary diagnosis, and the clinical occurrence of Turner’s triad. Crit Care Med. 1994;22:1301–1305.
119 Kissoon N, Frewen TC, Bloch M, Gayle M, Stiller C. Pediatric organ donor maintenance: pathophysiologic derangements and nursing requirements. Pediatrics. 1989;84:688–693.
120 Wise-Faberowski L, Soriano SG, Ferrari L, et al. Perioperative management of diabetes insipidus in children. J Neurosurg Anesthesiol. 2004;16:220–225.
121 Nemergut EC, Zuo Z, Jane JA, Jr., Laws ER, Jr. Predictors of diabetes insipidus after transsphenoidal surgery: a review of 881 patients. J Neurosurg. 2005;103:448–454.
122 Scheingraber S, Rehm M, Sehmisch C, Finsterer U. Rapid saline infusion produces hyperchloremic acidosis in patients undergoing gynecologic surgery. Anesthesiology. 1999;90:1265–1270.
123 Constable PD. Hyperchloremic acidosis: the classic example of strong ion acidosis. Anesth Analg. 2003;96:919–922.
124 Story DA, Morimatsu H, Bellomo R. Hyperchloremic acidosis in the critically ill: one of the strong-ion acidoses? Anesth Analg. 2006;103:144–148.
125 Hardesty DA, Kilbaugh TJ, Storm PB. Cerebral salt wasting syndrome in post-operative pediatric brain tumor patients. Neurocrit Care. 2011 August 6. [Epub ahead of print]
126 Talbot FB. Basal metabolism of children. Physiol Rev. 1925;5:477–517.
127 lbert MS, Dell RB, Winters RW. Quantitative displacement of acid-base equilibrium in metabolic acidosis. Ann Intern Med. 1967;66:312–322.