Fluid, Electrolyte and Acid–Base Balance
 ) are the major osmotically active particles in plasma. Glucose and urea make a smaller contribution. Plasma osmolality (POSM) may be estimated from the formula:
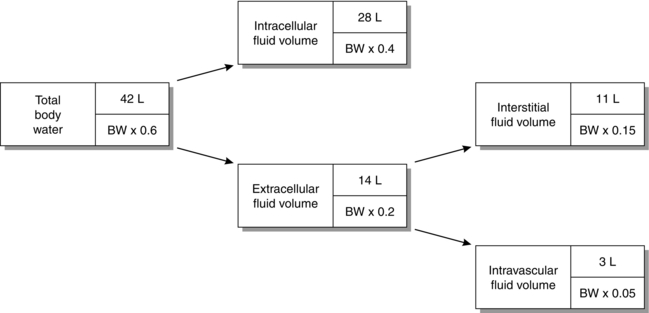
COMPARTMENTAL DISTRIBUTION OF TOTAL BODY WATER
The distribution of TBW between the main body compartments is illustrated in Figure 12.1. One-third of TBW is contained in the extracellular fluid volume (ECFV) and two-thirds in the intracellular fluid volume (ICFV). The ECFV is subdivided further into the interstitial and intravascular compartments. In addition to the absolute volumes of each compartment, Figure 12.1 shows the relative size of each compartment compared with body weight.
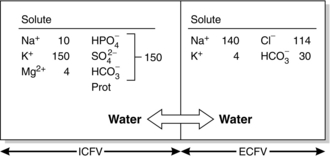
SOLUTE COMPOSITION OF BODY FLUID COMPARTMENTS
Intracellular Fluid
Figure 12.2 shows the solute composition of the main body fluid compartments. Although the total concentration of intracellular ions exceeds that of extracellular ions, the numbers of osmotically active particles (and thus the osmolalities) are the same on each side of the cell membrane (290 mosmol kg–1 of solution).
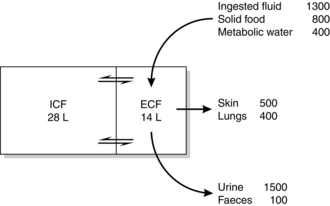
WATER HOMEOSTASIS
The principal sources of body water are ingested fluid, water present in solid food and water produced as an end-product of metabolism. Intravenous fluids are another common source in hospital patients. Actual and potential outlets for water are classified conventionally as sensible and insensible losses. Insensible losses emanate from the skin and lungs; sensible losses occur mainly from the kidneys and gastrointestinal tract. Figure 12.3 depicts the daily water balance in a 70 kg adult in whom input and output balance. It should be noted that sources of potential loss are not evident in this diagram. For example, over 5 L of fluid are secreted daily into the gut in the form of saliva, bile, gastric juices and succus entericus, yet only 100 mL of fluid is present in faeces. This illustrates the potential that exists for significant fluid loss in the presence of disease.
PRACTICAL FLUID BALANCE
Table 12.1 shows the electrolyte contents of five intravenous solutions used commonly in the United Kingdom. These solutions are adequate for most clinical situations. Two self-evident but important generalizations may be made regarding solutions for intravenous infusion.
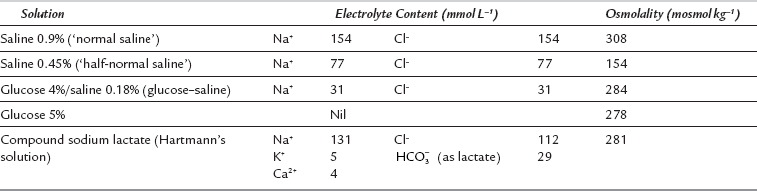
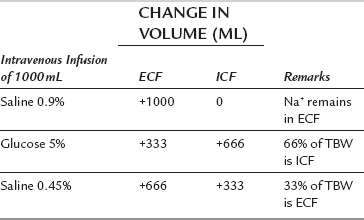
Rule 1: All infused Na+ remains in the ECF; Na+ cannot gain access to the ICF because of the sodium pump. Thus, if saline 0.9% is infused, all Na+ remains in the ECF. As this is an isotonic solution, there is no change in ECF osmolality and therefore no water exchange occurs across the cell membrane. Thus, saline 0.9% expands ECFV only. However, if saline 0.45% is given, ECF osmolality decreases; this causes a shift of water from ECF to ICF. If saline 1.8% is administered, all Na+ remains in the ECF, its osmolality increases and water moves from ICF to ECF to maintain osmotic equality.
Rule 2: Water without sodium expands the TBW. After infusion of a solution of glucose 5%, the glucose enters cells and is metabolized. The infused water enters both ICF and ECF in proportion to their initial volumes.
Table 12.2 illustrates the results of infusion of 1 L of saline 0.9%, saline 0.45% or glucose 5% in a 70 kg adult.
TABLE 12.2
Compartmental Expansion Resulting from Infusion of 1 L of Saline 0.9%, Saline 0.45% or Glucose 5%
Assessment of daily fluid requirements may be allocated usefully into three processes:


Normal Maintenance Needs
Water. Regardless of the disease process, water and electrolyte losses occur in urine and as evaporative losses from skin and lungs. It is evident from Figure 12.3 that a normothermic 70 kg patient with a normal metabolic rate may lose 2500 mL of water per day. Allowing for a gain of 400 mL from water of metabolism, this hypothetical patient needs about 2000 mL day–1 of water. As a rule of thumb, a volume of 30–35 mL kg–1 day–1 of water is a useful estimate for daily maintenance needs.
Sodium. The normal requirement is 1 mmol kg–1 day–1 (50–80 mmol day–1) for adults.
Potassium. The normal requirement is 1 mmol kg–1 day–1 (50–80 mmol day–1) for adults.


Existing Deficits
Dehydration with accompanying salt loss is a common disorder in the acutely ill surgical patient.


Perioperative Fluid Therapy
 if blood or serum is lost from drains (colloid solutions should be used if losses exceed 500 mL)
 if gastrointestinal losses continue, e.g. from a nasogastric tube or a fistula

 during rewarming if the patient has become hypothermic during surgery.
After major surgery, assessment of fluid and electrolyte requirements is achieved best by measurement of CVP and serum electrolyte concentrations. Fluid and electrolyte requirements in infants and small children differ from those in the adult (see Ch 36).
SODIUM AND POTASSIUM
Disorders of Sodium/Water Balance
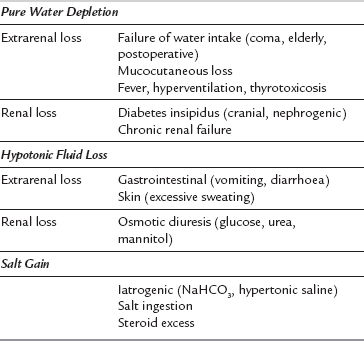
Hypernatraemia is defined as a plasma sodium concentration of more than 150 mmol L–1 and may result from pure water loss, hypotonic fluid loss or salt gain. In the first two conditions, ECFV is reduced, whereas salt gain is associated with an expanded ECFV. For this reason, the clinical assessment of volaemic status is important in the diagnosis and management of hypernatraemic states. The common causes of hypernatraemia are summarized in Table 12.3. The abnormality common to all hypernatraemic states is intracellular dehydration secondary to ECF hyperosmolality. Primary water loss resulting in hypernatraemia may occur during prolonged fever, hyperventilation or severe exercise in hot, dry climates. However, a more common cause is the renal water loss that occurs when there is a defect in either the production or release of ADH (cranial diabetes insipidus) or an abnormality in response to ADH (nephrogenic diabetes insipidus).
Consequences of Hypernatraemia: The major clinical manifestations of hypernatraemia involve the central nervous system. Severity depends on the rapidity with which hyperosmolality develops. Acute hypernatraemia is associated with a prompt osmotic shift of water from the intracellular compartment, causing a reduction in cell volume and water content of the brain. This results in increased permeability and even rupture of the capillaries in the brain and subarachnoid space. The patient may present with pyrexia (a manifestation of impaired thermoregulation), nausea, vomiting, convulsions, coma and virtually any type of focal neurological syndrome. The mortality and long-term morbidity of sustained hypernatraemia (Na+ > 160 mmol L–1 for over 48 h) is high, irrespective of the underlying aetiology. In many cases, the development of hypernatraemia can be anticipated and prevented, e.g. cranial diabetes insipidus associated with head injury, but in situations where preventative strategies have failed, treatment should be instituted without delay.


Hyponatraemia
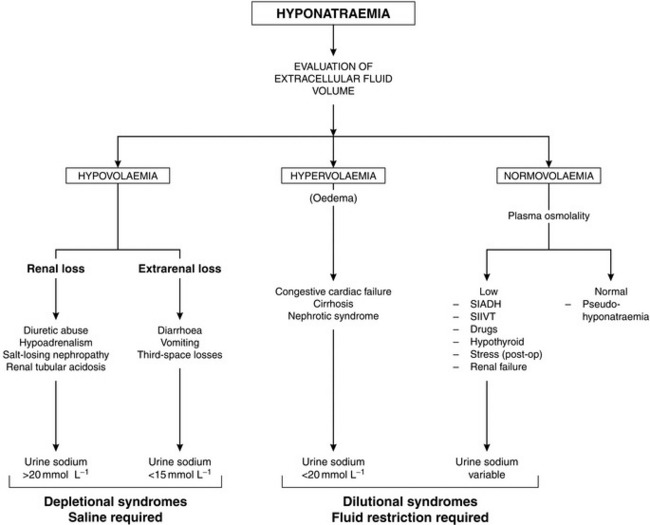
A scheme depicting the causes of hyponatraemia is shown in Figure 12.4. True hyponatraemia must be distinguished from pseudohyponatraemia. Sodium ions are present only in plasma water, which constitutes 93% of normal plasma. In the laboratory, the concentration of sodium in plasma is measured in an aliquot of whole plasma and the concentration is expressed in terms of plasma volume (mmol L–1 of whole plasma). If the percentage of water present in plasma is decreased, as in hyperlipidaemia or hyperproteinaemia, the amount of Na+ in each aliquot of plasma is also decreased, even if its concentration in plasma water is normal. A clue to this cause of hyponatraemia is the finding of a normal plasma osmolality. Pseudohyponatraemia is not encountered when plasma sodium concentration is measured by increasingly used ion-specific electrodes, because this method assesses directly the sodium concentration in the aqueous phase of plasma.
A more chronic water overload may occur in patients with hypothyroidism and in conditions associated with an inappropriately elevated concentration of ADH. The syndrome of inappropriate ADH secretion (SIADH) is characterized by hyponatraemia, low plasma osmolality and an inappropriate antidiuresis, i.e. a urine osmolality higher than anticipated for the degree of hyponatraemia. It occurs in the presence of malignant tumours (e.g. lung, prostate, pancreas), which produce ADH-like substances, in neurological disorders (e.g. head injury, tumours, infections) and in some severe pneumonias. A number of drugs are associated with increased ADH secretion or potentiate the effects of ADH (Table 12.4). In patients with SIADH, the urine is concentrated in spite of hyponatraemia. Management comprises restriction of fluid intake to encourage a negative fluid balance. In severe or refractory cases, demeclocycline or lithium may result in improvement. Both drugs induce a state of functional diabetes insipidus and have been used effectively in SIADH if the primary disease cannot be treated.
TABLE 12.4
Drugs Associated with Antidiuresis and Hyponatraemia
Increased ADH Secretion
Hypnotics – barbiturates
Analgesics – opioids
Hypoglycaemics – chlorpropamide, tolbutamide
Anticonvulsants – carbamazepine
Miscellaneous – phenothiazines, tricyclics
Potentiation of ADH at Distal Tubule
Paracetamol
Indometacin
Chlorpropamide
Consequences of Hyponatraemia: Symptoms vary with the underlying aetiology, the magnitude of the reduction of plasma sodium and the rapidity with which the plasma sodium concentration decreases. Serious consequences involve the central nervous system and result from intracellular overhydration, cerebral oedema and raised intracranial pressure. Nausea, vomiting, delirium, convulsions and coma result.
Treatment of Hyponatraemia: Acute symptomatic hyponatraemia is a medical emergency and requires prompt intervention using hypertonic saline. The rapidity with which hyponatraemia should be corrected is the subject of controversy because of observations that rapid correction may cause central pontine myelinolysis, a disorder characterized by paralysis, coma and death. As a causal relationship between this syndrome and the rate of increase of plasma sodium has not been established and it is clear that there is a prohibitive mortality associated with inadequately treated water intoxication, rapid correction of the symptomatic hyponatraemic state is warranted. Sufficient sodium should be given to return the plasma concentration to 125 mmol L–1 only and this should be administered over a period of no less than 12 h. The amount of sodium needed to cause the desired correction in the plasma sodium can be calculated as follows:

Potassium Balance
Hypokalaemia
The causes of hypokalaemia are summarized in Table 12.5. Management includes diagnosis and treatment of the underlying disorder in addition to repletion of total body potassium stores. As a general rule, a reduction in plasma K+ concentration by 1 mmol L–1 reflects a total body K+ deficit of approximately 100 mmol. Potassium supplements may be given orally or intravenously. The maximum infusion rate should not exceed 0.5 mmol kg–1 h–1 to allow equilibration with the intracellular compartment; much slower rates are generally used.
TABLE 12.5
| Cause | Comments |
| Reduced intake | Usually only contributory |
| Tissue redistribution | Insulin therapy, alkalaemia, β2-adrenergic agonists, familial periodic paralysis, vitamin B12 therapy |
| Increased Loss | |
| Gastrointestinal (urine K+ < 20 mmol L–1) | Diarrhoea, vomiting, fistulae, nasogastric suction, colonic villous adenoma |
| Renal | Diuretic therapy, primary or secondary hyperaldosteronism, malignant hypertension, renal artery stenosis (high renin), renal tubular acidosis, hypomagnesaemia, renal failure (diuretic phase) |
Hyperkalaemia
This is defined as a plasma potassium concentration exceeding 5 mmol L–1. Vague muscle weakness progressing to flaccid paralysis may occur. However, the major clinical feature of an increasing plasma potassium concentration is the characteristic sequence of ECG abnormalities. The earliest change is the development of tall, peaked T waves and a shortened QT interval, reflecting more rapid repolarization (6–7 mmol L–1). As plasma K+ increases (8–10 mmol L–1), abnormalities in depolarization become manifest as widened QRS complexes and widening, and eventually loss, of the P wave; the widened QRS complexes merge finally into the T waves (sine wave pattern). Plasma concentrations in excess of 10 mmol L–1 are associated with ventricular fibrillation. The cardiac toxicity of K+ is enhanced by hypocalcaemia, hyponatraemia or acidaemia. The causes of hyperkalaemia are summarized in Table 12.6.
TABLE 12.6
Factitious (Pseudohyperkalaemia)
In vitro haemolysis
Thrombocytosis
Leucocytosis
Tourniquet
Exercise
Impaired Excretion
Renal failure
Acute or chronic hyperaldosteronism
Addison’s disease
K+-sparing diuretics
Indometacin
Tissue Redistribution
Tissue damage (burns, trauma)
Rhabdomyolysis
Tumour necrosis
Hyperkalaemic periodic paralysis
Massive intravascular haemolysis
Succinylcholine
Excessive Intake
Blood transfusion
Excessive i.v. administration


Methods by which the plasma potassium concentration may be reduced are summarized in Table 12.7.
TABLE 12.7
Calcium gluconate 10% i.v. (0.5 ml kg–1 to maximum of 20 mL) given over 5 min. No change in plasma [K+]. Effect immediate but transient
Glucose 50 g (0.5–1.0 g kg–1) plus insulin 20 units (0.3 unit kg–1) as single i.v. bolus dose. Then infusion of glucose 20%, plus insulin 6–20 units h–1 (depending on blood glucose)
Sodium bicarbonate 1.5–2.0 mmol kg–1 i.v. over 5–10 min
Calcium resonium 15 g p.o. or 30 g p.r. 8-hourly
Peritoneal or haemodialysis
ACID–BASE BALANCE
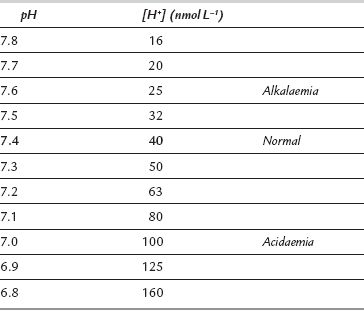
A more logical arithmetic convention which expresses [H+] in nmol L–1 is gaining popularity. Table 12.8 compares values of [H+] expressed as pH and nmol L–1 and reveals several disadvantages of the pH notation. The most obvious disadvantage is that it moves in the opposite direction to [H+]; a decrease in pH is associated with increased [H+] and vice versa. It is also apparent that the logarithmic scale distorts the quantitative estimate of change in [H+]; for example, twice as many hydrogen ions are required to reduce pH from 7.1 to 7.0 as are needed to reduce it from 7.4 to 7.3. The pH scale gives the false impression that there is relatively little difference in the sensitivity of biological systems to an equivalent increase or decrease in [H+]. However, when [H+] is expressed in nmol L–1, it becomes apparent that tolerance is limited to a reduction in [H+] of only 24 nmol L–1 from normal, but to an increase of up to 120 nmol L–1. Nevertheless, the pH notation remains the most widely used system and is used in the remainder of this chapter.
TABLE 12.8
Comparison of Logarithmic and Arithmetic Methods of Expressing Hydrogen Ion Concentration in the Range of Blood [H+] Compatible with Life
Basic Definitions
 ) is the conjugate base of carbonic acid:
 ]:
]:
where K = dissociation constant and pK = –log10K.

 ] is 24 mmol L–1 and PaCO2 is 5.3 kPa. Thus:


Acid–Base Disorders
 acidosis – a process that causes acid to accumulate
 acidaemia – this is present if pH < 7.36


 ] and PaCO2, along with calculation of standard bicarbonate, base excess and anion gap (see below) will enable meaningful diagnosis and treatment. The first step involves diagnosis of the primary disorder; this is followed by an assessment of the extent and appropriateness of any compensation.
Primary acid–base disorders are either respiratory or metabolic. The disorder is respiratory if the primary disturbance involves CO2, and metabolic if it involves  . Thus, four potential primary disturbances exist (Table 12.9) and each may be identified by analysis of pH, [
 ] and PaCO2. Both pH and PaCO2 are measured directly by the blood gas machine. [
 ] is measured directly on the electrolyte profile but is derived in most blood gas machines. Other derived variables include standard bicarbonate and base excess. The standard bicarbonate is not the actual bicarbonate of the sample but an estimate of bicarbonate concentration after elimination of any abnormal respiratory contribution to [
 ], i.e. an estimate of [
 ] at a PaCO2 of 5.3 kPa. The base excess (in alkalosis) or base deficit (in acidosis) is the amount of acid or base (in mmol) required to return the pH of 1 L of blood to normal at a PaCO2 of 5.3 kPa; it is a measure of the magnitude of the metabolic component of the acid–base disorder.
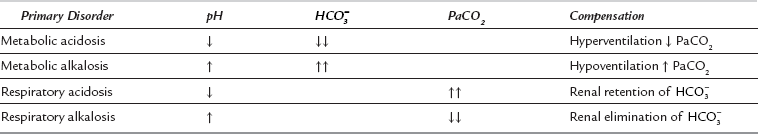
 , whereas a primary metabolic acidosis is compensated for by hyperventilation and a decrease in PaCO2. Thus, in each case, the acidaemia produced by the primary acidosis is reduced by a compensatory alkalosis. The response to a respiratory alkalosis is increased renal elimination of
  , and metabolic alkalosis results in hypoventilation and increased PaCO2, pH being restored towards normal by the compensatory respiratory acidosis. In each case, the efficiency of compensatory mechanisms is limited; compensation is usually only partial and rarely complete. Overcompensation does not occur.
Metabolic Acidosis
 ], a low pH and an appropriately low PaCO2. The extent of the acidaemia depends upon the nature, severity and duration of the initiating pathology in addition to the efficiency of compensatory mechanisms. The magnitude of the compensatory response is proportional to the decrease in [HCO3]. The lower limit of the respiratory response is a PaCO2 of 1.3 kPa. In a steady state:
predicted PaCO2 = (0.2×observed bicarbonate) +1.1 (kPa)


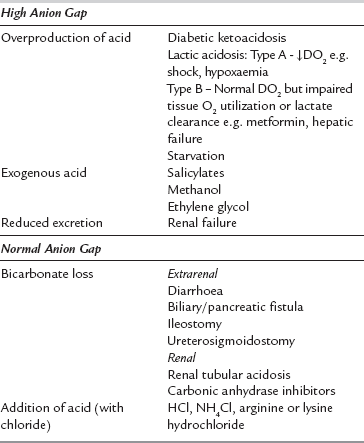
Clinically, it is useful to divide the metabolic acidoses into those associated with a normal anion gap and those with an increased anion gap. The former are caused by loss of  from the body and replacement with chloride. In acidoses associated with an increased anion gap,
  has been titrated by either endogenous, e.g. lactic acidosis, diabetic ketoacidosis, or exogenous acids (e.g. poisons), thus increasing the number of unmeasured plasma anions without altering the plasma chloride concentration (Table 12.10). Another useful concept is the osmolal/osmolar (depending on units used) gap:
osmolal gap = measured osmolality – calculated osmolality
Clinical Effects and Treatment: Metabolic acidosis results in widespread physiological disturbances, including reduced cardiac output, pulmonary hypertension, arrhythmias, Kussmaul respiration and hyperkalaemia; the severity of the disturbances is related to the extent of the acidaemia. Treatment should be directed initially at identifying and reversing the cause. If acidaemia is considered to be life-threatening (pH < 7.2, [ ] < 10 mmol L–1), measures may be required to restore blood pH to normal. Overzealous use of sodium bicarbonate may lead to rapid correction of blood pH, with the risks of tetany and convulsions in the short term and volume overload and hypernatraemia in the longer term. The required quantity of bicarbonate should be calculated:
bicarbonate requirement (mmol) = body weight (kg) × base deficit (mmol L–1) × 0.3
 ] and pH. Sodium bicarbonate is available as isotonic (1.4%; 163 mmol L–1) and hypertonic (8.4%; 1000 mmol L–1) solutions. Slow infusion of the hypertonic solution is advisable to minimize adverse effects.
Metabolic Alkalosis
The cardinal features of a metabolic alkalosis are an increased plasma [ ], a high pH and an appropriately raised PaCO2. The compensatory response of hypoventilation is limited and not very effective. For diagnostic and therapeutic reasons, it is usual to subdivide metabolic alkalosis into the chloride-responsive and chloride-resistant varieties (Table 12.11). The differential diagnosis of metabolic alkalosis, and in particular the classification of patients on the basis of the urinary chloride concentration, is important because of the differences in treatment of the two groups. In chloride-responsive alkalosis, the administration of saline causes volume expansion and results in the excretion of excess bicarbonate; if potassium is required, it should be given as the chloride salt. In patients in whom volume administration is contraindicated, the use of acetazolamide results in renal loss of
  and an improvement in pH. H2-receptor antagonists may be helpful if nasogastric suction is contributing to hydrogen ion loss.
TABLE 12.11
Types and Causes of Metabolic Alkalosis
Chloride-Responsive (urine chloride < 20 mmol L–1)
Loss of acid
Vomiting
Nasogastric suction
Gastrocolic fistula
Chloride depletion
Diarrhoea
Diuretic abuse
Excessive alkali
NaHCO3 administration
Antacid abuse
Chloride-Resistant (urine chloride > 20 mmol L–1)
Primary or secondary hyperaldosteronism
Cushing’s syndrome
Severe hypokalaemia
Carbenoxolone
Respiratory Acidosis
 ].
].Usually, hypoxaemia and the manifestations of the underlying disease dominate the clinical picture, but hypercapnia per se may result in coma, raised intracranial pressure and a hyperdynamic cardiovascular system (tachycardia, vasodilatation, ventricular arrhythmias) resulting from release of catecholamines. There are many causes of respiratory acidosis, the most important of which are classified in Table 12.12. Treatment consists of reversing the underlying pathology if possible and mechanical ventilatory support if required.
TABLE 12.12
Causes of Respiratory Acidosis
Central Nervous System
Drug overdose
Trauma
Tumour
Degeneration or infection
Cerebrovascular accident
Cervical cord trauma
Peripheral Nervous System
Polyneuropathy
Myasthenia gravis
Poliomyelitis
Botulism
Tetanus
Organophosphorus poisoning
Primary Pulmonary Disease
Airway obstruction
Asthma
Laryngospasm
Chronic obstructive airways disease
Parenchymal disease
ARDS
Pneumonia
Severe pulmonary oedema
Chronic obstructive airways disease
Loss of mechanical integrity
Flail chest
Respiratory Alkalosis
The causes of respiratory alkalosis are summarized in Table 12.13. Treatment comprises correction of the underlying cause and thus differential diagnosis is important.
TABLE 12.13
Causes of Respiratory Alkalosis
Supratentorial
Voluntary/hysterical hyperventilation
Pain, anxiety
Specific Conditions
CNS disease
Meningitis/encephalitis
Cerebrovascular accident
Tumour
Trauma
Respiratory disease
Pneumonia
Pulmonary embolism
Early pulmonary oedema or ARDS
High altitude
Shock
Cardiogenic
Hypovolaemic
Septic
Miscellaneous
Cirrhosis
Gram-negative septicaemia
Pregnancy
IPPV
Drugs/hormones
Salicylates
Aminophylline
Progesterone
Stewart’s Physicochemical Theory of Acid–Base Balance
 The strong ion difference (SID)=([Na+] + [K+] + [Mg2 +] + [Ca2 +])–([Cl−]–[lactate]), i.e. the total concentration of fully dissociated cations minus the total concentration of fully dissociated anions


where α is the solubility coefficient for carbon dioxide
These three variables come together to form the Stewart equation:
Arieff, A.I. Indications for the use of bicarbonate in patients with metabolic acidosis. Br. J. Anaesth. 1991;67:165–178.
Hubble, S.M.A. Acid–base and blood gas analysis. Anaesth. Int. Care Med. 2007;8(11):471–473.
Kitching, J.K., Edge, C.J. Acid–base balance: a review of normal physiology. Br. J. Anaesth. CEPD reviews. 2002;2:3–6.
Lane, N., Allen, K. Hyponatraemia after orthopaedic surgery. Br. Med J. 1999;318:1363–1364.
Morris, C.G. Review: Metabolic acidosis in the critically ill: Part 1 Classification and pathophysiology. Anaesthesia. 2008;63:294–301.
Sirker, A.A., Rhodes, A., Grounds, R.M., Bennett, E.D. Acid–base physiology: the ‘traditional’ and the ‘modern’ approaches. Anaesthesia. 2002;57:348–356.
Swales, J.D. Management of hyponatraemia. Br. J. Anaesth. 1991;67:146–154.
Thomson, W.S.T., Adams, J.F., Cowan, R.A. Clinical acid–base balance. Oxford: Oxford University Press; 1997.
Wooten, E.W. Science review: quantitative acid–base physiology using the Stewart model. Crit. Care. 2004;8:448–452.