[level-membership-for-pulmolory-and-respiratory-category]
Fluid and Electrolyte Balance
A Percentage of body weight made up by water (Table 14-1):
TABLE 14-1
| Body Water | Adult Male (% body weight) | Adult Female (% body weight) | Infant (% body weight) |
| Total body water | 60 ± 15 | 50 ± 15 | 80 |
| Intracellular | 45 | 40 | 50 |
| Extracellular | 15-20 | 15-20 | 30 |
| Interstitial | 11-15 | 11-15 | 24 |
| Intravascular | 4.5 | 4.5 | 5.0 |
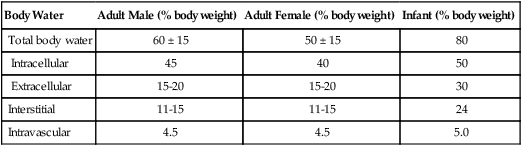
From Wilkins RL, et al: Egan’s Fundamentals of Respiratory Care, ed 8. St. Louis, Mosby, 2003.
TABLE 14-2
| Regulation | Average Daily Volume (mL) | Maximum Daily Volume |
| Water Losses | ||
| Insensible | ||
| Skin | 700 | 1500 ml |
| Lung | 200 | |
| Sensible | ||
| Urine | 1000-1200 | 2000+ ml/hr |
| Intestinal | 200 | 8000 ml |
| Sweat | 0 | 2000+ ml/hr |
| Water Gain | ||
| Ingestion | ||
| Fluids | 1500-2000 | 2000+ ml/hr |
| Solids | 500-600 | 1500 ml/hr |
| Body metabolism | 250 | 1000 ml |
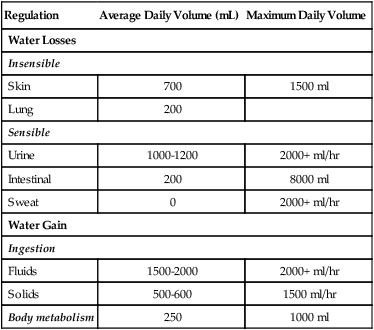
From Wilkins RL, et al: Egan’s Fundamentals of Respiratory Care, ed 8. St. Louis, Mosby, 2003.
4. Obese persons: ≤45%. Fat is much less vascular than muscle, thus the greater the fat content, the lower the water content.
B In the average adult, total body fluid volume is approximately 40 L.
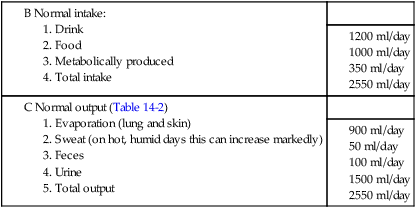
II Normal Intake and Output of Fluids
III Composition of the Intravascular Space (Figure 14-1)
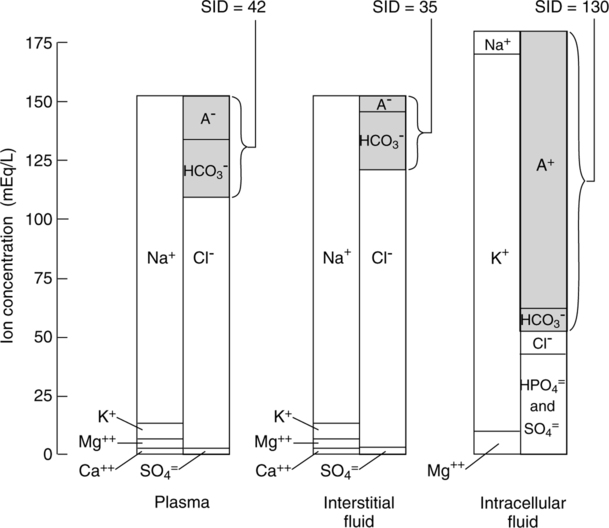
A Normally all fluid compartments in the body are in electrostatic balance as described by the law of electroneutrality (i.e., cation and anion concentrations are equal).
1. Cation mean values (mEq/L):
| Na+ | 142 |
| K+ | 5 |
| Ca+2 | 5 |
| Mg+ 2 | 3 |
| Total | 155 |
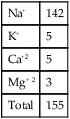
| HCO3− | 27 |
| Cl− | 103 |
| Protein | 16 |
| Organic acids | 6 |
| PO4−3 | 2 |
| SO4−2 | 1 |
| Total | 155 |
B Plasma protein concentrations can be subdivided into:
| Mean values | |
| Albumin | 4.8 g/100 ml |
| Globulin | 2.5 g/100 ml |
| Fibrinogen | 300 mg/100 ml |
C The following neutral substances also are present in vascular fluid:
| Mean values | |
| Glucose | 90 mg/100 ml |
| Lipids | 600 mg/100 ml |
D Anion gap: The difference between the commonly measured anions and cations, reflecting the quantity of unmeasured anions:
< ?xml:namespace prefix = "mml" />
1. Normally the anion gap ranges from approximately 15 to 20 mEq/L.
2. An increased anion gap is caused by a metabolic acidosis in which fixed acids accumulate in the body.
3. An increased anion gap indicates an increase in unmeasured anions.
4. However, a metabolic acidosis caused by HCO3− loss does not cause an increased anion gap because a HCO3− loss is associated with a Cl− gain, maintaining electrical neutrality. This type of acidosis is referred to as a hyperchloremic acidosis.
5. Causes of anion gap and nonanion gap metabolic acidosis are listed in Box 14-1.
6. A decrease in the anion gap is caused by a metabolic alkalosis in which increased levels of base accumulate in the body (Box 14-2).
1. Another approach to defining electrolyte imbalances and, as a result, metabolic acid-base disturbances is by assessing the strong ion difference (SID).
2. The SID represents the amount of anions necessary to balance the number of cations (primarily Na+) to maintain electrical neutrality.
3. SID is regulated by the amount of renal reabsorption of Na+: the greater the Na+ reabsorption, the greater the SID, and the lesser the Na+ reabsorption, the lesser the SID.
4. Protein is the other major component of the SID; however, unlike HCO3− it is not regulated with respect to maintenance of ion or acid-base balance.
5. Thus the SID is the amount of HCO3− and protein, the two major body buffers, needed to balance the cations.
6. As noted in Figure 14-1, the SID varies based on fluid compartment evaluated.
7. Because protein is not readily diffusible across the cell membrane, the intracellular SID is greater than the extracellular SID.
8. An increase in the SID is observed during metabolic alkalosis, and a decrease is seen during metabolic acidosis.
IV Composition of Extravascular (Interstitial) Fluid (see Figure 14-1)
A The extravascular concentrations of most substances are about the same as their intravascular concentrations.
B The major exception is protein. Because protein is not freely diffusible across the capillary membrane, extravascular protein concentrations are less than one third intravascular concentrations.
C As with all other compartments, electrostatic balance is maintained.
V Composition of the Intracellular Compartment (see Figure 14-1)
A Electrostatic balance is maintained within the intracellular space.
B However, the composition of anions and cations differs considerably from intravascular levels.
1. Cations, mean values (mEq/L):
| Na+ | 10 |
| K+ | 140 |
| Ca+2 | 0 |
| Mg+2 | 30 |
| Total | 180 |
2. Anions, mean values (mEq/L):
| HCO3− | 10 |
| Cl− | 4 |
| Protein | 61 |
| PO4−3 | 11 |
| SO4−2 | 2 |
| Other anions | 92 |
| Total | 180 |
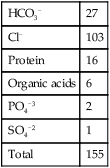
A The following mechanisms are responsible for the movement of fluid and dissolved substances across membranes:
B Facilitated diffusion (Figure 14-2) occurs from an area of high concentration of the diffusing substance to an area of low concentration. However, a carrier substance is necessary for movement to occur across the membrane.
1. No energy is expended compared with active transport.
2. Glucose moves across cell membranes by facilitated diffusion. Insulin allows a rapid attachment of glucose to the intramembrane carrier substance.
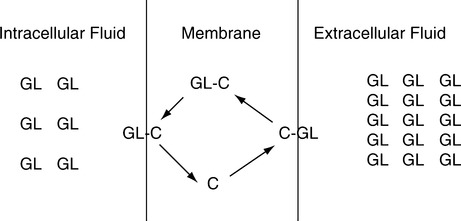
C Active transport is the movement of a substance from an area of low concentration to an area of high concentration (Figure 14-3).
1. Movement is always uphill—low concentration to high concentration.
2. Energy in the form of adenosine triphosphate (ATP) is necessary for transport to occur.
3. The movement of many substances is controlled by active transport. Figure 14-3 depicts the most common active transport mechanism, the movement of Na+ out of the cell and the movement of K+ into the cell.
VII Starling Law of Fluid Exchange
A The Starling law of fluid exchange is the interrelationship among factors that determine the quantity and the direction of fluid movement across membranes.
B The relationship is expressed as:

C Theoretically there are two pressures on each side of a capillary membrane.
1. Hydrostatic pressure: Blood pressure or interstitial fluid pressure.
a. Colloid osmotic pressure is the osmotic pressure caused by nondiffusible protein.
b. Because all dissolved substances except protein are readily diffusible, the effective osmotic pressure of either plasma or interstitial fluid is established by protein.
c. The quantity of protein is approximately three times greater in the plasma than in the interstitial fluid.
D Capillary membrane permeability can be altered by many forms of physiologic stress, resulting in alterations in net fluid movement, given fixed hydrostatic and colloid osmotic pressures.
E The pressures across the pulmonary capillary membrane are depicted in Figure 14-4.
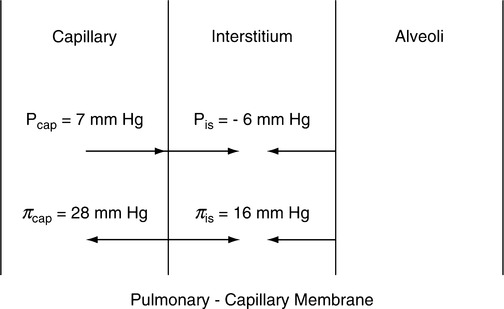
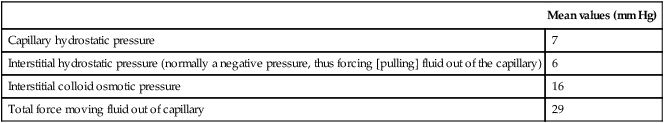
1. Forces tending to move fluid out of the pulmonary capillary:
| Mean values (mm Hg) | |
| Capillary hydrostatic pressure | 7 |
| Interstitial hydrostatic pressure (normally a negative pressure, thus forcing [pulling] fluid out of the capillary) | 6 |
| Interstitial colloid osmotic pressure | 16 |
| Total force moving fluid out of capillary | 29 |
2. Forces tending to maintain fluid in the pulmonary capillary:
| Mean values (mm Hg) | |
| Plasma colloid osmotic pressure | 28 |
| Total force maintaining fluid inside the pulmonary capillaries | 28 |
3. Net force causing fluid to leave pulmonary capillaries is approximately 1 mm Hg (29-28 mm Hg).
4. The amount of fluid leaving the capillary as a result of the 1-mm Hg pressure gradient depends on the permeability of the pulmonary capillary membrane.
5. The negative interstitial hydrostatic pressure not only assists in moving fluid out of pulmonary capillaries but also maintains the alveoli “dry.” This force, along with the interstitial colloid osmotic pressure, moves fluid from the lung into the interstitial space.
6. The pulmonary interstitial colloid osmotic pressure is much higher than the systemic interstitial colloid osmotic pressure because the pulmonary capillaries are much more permeable than the systemic capillaries.
7. Any alteration in the pressures listed can result in increased fluid movement into the interstitium or the alveoli.
F Forces affecting systemic capillary fluid movement, mean values (mm Hg; Figure 14-5).
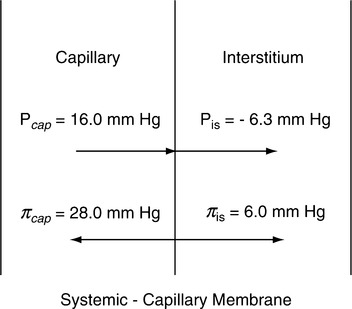
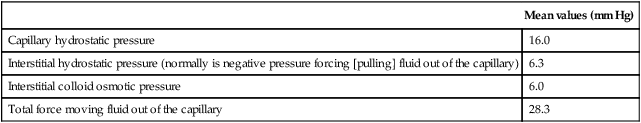
1. Forces moving fluid out of the capillary are:
| Mean values (mm Hg) | |
| Capillary hydrostatic pressure | 16.0 |
| Interstitial hydrostatic pressure (normally is negative pressure forcing [pulling] fluid out of the capillary) | 6.3 |
| Interstitial colloid osmotic pressure | 6.0 |
| Total force moving fluid out of the capillary | 28.3 |
2. Forces moving fluid into the capillary are:
| Mean values (mm Hg) | |
| Capillary colloid osmotic pressure | 28 |
| Total force moving fluid into the capillary | 28 |
3. Net force causing fluid movement out of the capillary is approximately 0.3 mm Hg (28.3 – 28 mm Hg).
4. The amount of fluid leaving the capillary as a result of the 0.3-mm Hg pressure gradient depends on the permeability of the capillary membrane.
5. Any alteration in the pressures listed can cause fluid to move into the interstitium.
A Normal serum sodium levels range from approximately 135 to 145 mEq/L, necessary to maintain extracellular fluid volume.
B Serum Na+ concentration is normally a reflection of extracellular fluid volume.
C Approximately 70 to 100 mEq of Na+ is excreted daily:
D Hyponatremia (decreased serum Na+ concentration) is present if serum [Na+] level is <130 mEq/L.
1. Hyponatremia occurs in the presence of a decreased, increased, or normal extracellular fluid volume:
a. Decreased extracellular fluid volume
b. Normal extracellular fluid volume
2. The following clinical signs of hyponatremia are rare unless the [Na+] level decreases <120 mEq/L:
3. As the [Na+] level decreases <110 mEq/L, drowsiness, progressing to coma, with convulsions occurs.
a. In the presence of a decreased extracellular fluid volume, intravenous (IV) replacement is begun immediately to reestablish Na+ and fluid volume.
b. In the presence of a normal extracellular fluid volume, management should focus on the underlying condition (i.e., diuretic therapy, excessive ADH production, and glucocorticoid deficiency).
c. In the presence of an expanded extracellular fluid volume, the management should focus on the cause of the fluid overload.
E Hypernatremia (increase in serum Na+ concentration) always reflects a deficiency of water compared with total body solute volume ([Na+] >145 mEq/L).
A Chloride balance is similar to Na+ balance, necessary to maintain cellular electrostatic and fluid balance.
B Normal serum levels range from approximately 95 to 105 mEq/L.
C Hypochloremia (decreased serum Cl− concentration <95 mEq/L) may be caused by:
D Hyperchloremia (increased serum Cl− concentration >105 mEq/L) may be caused by:
E Because of the exchange of Cl− and HCO3− by the kidney, serum concentrations of these electrolytes are indirectly related. The pH of the urine and the plasma also change in the opposite direction as Cl− levels change.
F In chronic CO2 retention with increased HCO3−, Cl− is decreased.
G Because changes in [Cl−] closely mirror disturbances in [Na+] balance, symptoms of [Cl−] changes are similar to [Na+] changes.
H Management focuses on reversal of the underlying cause along with the administration of either NaCl or water, depending on the abnormality.
A Normal serum K+ concentrations are approximately 3.5 to 5.5 mEq/L, necessary to maintain normal cardiac and voluntary muscle function.
C Normal K+ ingestion: 50 to 100 mEq
D Minimum required K+ ingestion: 40 mEq
E Hypokalemia (decreased serum K+ concentration <3.5 mEq/L)
F Hyperkalemia (increased serum K+ concentration >5.5 mEq/L)
A Normal total serum Ca+2 concentrations are approximately 8.0 to 10 mg/dL, and normal ionized Ca+2 levels are 4.6 to 5.3 mg/dL, necessary to maintain normal cardiac and voluntary muscle function.
B Approximately 50% of the calcium in the blood is bound to protein. The amount of Ca+2 bound to protein is affected by plasma pH.
C Hypocalcemia (decreased serum calcium concentration)
A Normal serum PO4−3 levels are 2.7 to 4.5 mg/dL, necessary for the normal production of ATP and muscle function.
B Hypophosphatemia (decreased serum phosphate concentration <2.7 mg/dL)
C Hyperphosphatemia (increased serum phosphate concentration >4.5 mg/dL):
A Normal serum Mg+2 concentration is 1.5 to 2.5 mEq/L, necessary for normal muscle function, voluntary and involuntary.
B Hypomagnesemia (decreased serum Mg+2 concentration <1.5 mEq/L)
A The venous system is referred to as the capacitance system because it has the ability to store large quantities of blood.
B The storage capabilities of the venous system are depicted in Figure 14-6.
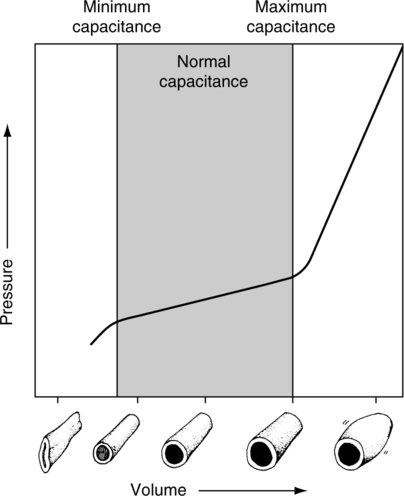
1. Below minimum capacitance, large volume changes result in small pressure changes.
2. Within the normal capacitance range, a volume change results in a small pressure change.
3. Beyond the maximum capacitance level, a small volume change results in a large pressure change.
C Venous conductance is the ability of the venous system to conduct flow.
D Conductance is a reciprocal of resistance and is equal to flow divided by change in pressure.
E The greater the conductance, the greater the ability of the vessel to conduct flow.
F Either increasing driving pressure or increasing conductance increases venous return.
1. Physiologically the body increases venotone to increase driving pressure, thus increasing venous return.
2. Clinically increasing conductance is the most common method to increase venous return.
3. Optimizing the vascular volume-to-vascular space relationship increases conductance.
4. This is achieved by maintaining a vascular volume that moves the venous system to a capacitance level that is near its maximum capacitance.
G Fluid administration (fluid challenge principle)
1. This is an approach to fluid administration that results in optimization of the vascular volume-to-vascular space relationship.
2. A general clinical and hemodynamic assessment of the patient is performed to establish baseline values. Specifically the pulmonary wedge pressure (PWP) or central venous pressure (CVP) is determined.
3. Approximately 50 to 200 ml of fluid is rapidly administered. The volume used depends on the patient’s clinical status.
4. The patient is then assessed clinically for improvements in:
5. The PWP or CVP is reassessed; if neither changes the challenge can be repeated. However, if they increase, careful reassessment of the cardiovascular system is required before additional fluid is administered.
[/level-membership-for-pulmolory-and-respiratory-category][not-level-membership-for-pulmolory-and-respiratory-category]
Fluid and Electrolyte Balance
A Percentage of body weight made up by water (Table 14-1):
TABLE 14-1
| Body Water | Adult Male (% body weight) | Adult Female (% body weight) | Infant (% body weight) |
| Total body water | 60 ± 15 | 50 ± 15 | 80 |
| Intracellular | 45 | 40 | 50 |
| Extracellular | 15-20 | 15-20 | 30 |
| Interstitial | 11-15 | 11-15 | 24 |
| Intravascular | 4.5 | 4.5 | 5.0 |
From Wilkins RL, et al: Egan’s Fundamentals of Respiratory Care, ed 8. St. Louis, Mosby, 2003.
TABLE 14-2
| Regulation | Average Daily Volume (mL) | Maximum Daily Volume |
| Water Losses | ||
| Insensible | ||
| Skin | 700 | 1500 ml |
| Lung | 200 | |
| Sensible | ||
| Urine | 1000-1200 | 2000+ ml/hr |
| Intestinal | 200 | 8000 ml |
| Sweat | 0 | 2000+ ml/hr |
| Water Gain | ||
| Ingestion | ||
| Fluids | 1500-2000 | 2000+ ml/hr |
| Solids | 500-600 | 1500 ml/hr |
| Body metabolism | 250 | 1000 ml |
From Wilkins RL, et al: Egan’s Fundamentals of Respiratory Care, ed 8. St. Louis, Mosby, 2003.
4. Obese persons: ≤45%. Fat is much less vascular than muscle, thus the greater the fat content, the lower the water content.
B In the average adult, total body fluid volume is approximately 40 L.
II Normal Intake and Output of Fluids
III Composition of the Intravascular Space (Figure 14-1)
A Normally all fluid compartments in the body are in electrostatic balance as described by the law of electroneutrality (i.e., cation and anion concentrations are equal).
1. Cation mean values (mEq/L):
| Na+ | 142 |
| K+ | 5 |
| Ca+2 | 5 |
| Mg+ 2 | 3 |
| Total | 155 |
| HCO3− | 27 |
| Cl− | 103 |
| Protein | 16 |
| Organic acids | 6 |
| PO4−3 | 2 |
| SO4−2 | 1 |
| Total | 155 |
B Plasma protein concentrations can be subdivided into:
| Mean values | |
| Albumin | 4.8 g/100 ml |
| Globulin | 2.5 g/100 ml |
| Fibrinogen | 300 mg/100 ml |
C The following neutral substances also are present in vascular fluid:
| Mean values | |
| Glucose | 90 mg/100 ml |
| Lipids | 600 mg/100 ml |
D Anion gap: The difference between the commonly measured anions and cations, reflecting the quantity of unmeasured anions:
< ?xml:namespace prefix = "mml" />
1. Normally the anion gap ranges from approximately 15 to 20 mEq/L.
2. An increased anion gap is caused by a metabolic acidosis in which fixed acids accumulate in the body.
3. An increased anion gap indicates an increase in unmeasured anions.
4. However, a metabolic acidosis caused by HCO3− loss does not cause an increased anion gap because a HCO3− loss is associated with a Cl− gain, maintaining electrical neutrality. This type of acidosis is referred to as a hyperchloremic acidosis.
5. Causes of anion gap and nonanion gap metabolic acidosis are listed in Box 14-1.
6. A decrease in the anion gap is caused by a metabolic alkalosis in which increased levels of base accumulate in the body (Box 14-2).
1. Another approach to defining electrolyte imbalances and, as a result, metabolic acid-base disturbances is by assessing the strong ion difference (SID).
2. The SID represents the amount of anions necessary to balance the number of cations (primarily Na+) to maintain electrical neutrality.
3. SID is regulated by the amount of renal reabsorption of Na+: the greater the Na+ reabsorption, the greater the SID, and the lesser the Na+ reabsorption, the lesser the SID.
4. Protein is the other major component of the SID; however, unlike HCO3− it is not regulated with respect to maintenance of ion or acid-base balance.
5. Thus the SID is the amount of HCO3− and protein, the two major body buffers, needed to balance the cations.
6. As noted in Figure 14-1, the SID varies based on fluid compartment evaluated.
7. Because protein is not readily diffusible across the cell membrane, the intracellular SID is greater than the extracellular SID.
8. An increase in the SID is observed during metabolic alkalosis, and a decrease is seen during metabolic acidosis.
IV Composition of Extravascular (Interstitial) Fluid (see Figure 14-1)
A The extravascular concentrations of most substances are about the same as their intravascular concentrations.
B The major exception is protein. Because protein is not freely diffusible across the capillary membrane, extravascular protein concentrations are less than one third intravascular concentrations.
C As with all other compartments, electrostatic balance is maintained.
V Composition of the Intracellular Compartment (see Figure 14-1)
A Electrostatic balance is maintained within the intracellular space.
B However, the composition of anions and cations differs considerably from intravascular levels.
1. Cations, mean values (mEq/L):
| Na+ | 10 |
| K+ | 140 |
| Ca+2 | 0 |
| Mg+2 | 30 |
| Total | 180 |
2. Anions, mean values (mEq/L):
| HCO3− | 10 |
| Cl− | 4 |
| Protein | 61 |
| PO4−3 | 11 |
| SO4−2 | 2 |
| Other anions | 92 |
| Total | 180 |
A The following mechanisms are responsible for the movement of fluid and dissolved substances across membranes:
B Facilitated diffusion (Figure 14-2) occurs from an area of high concentration of the diffusing substance to an area of low concentration. However, a carrier substance is necessary for movement to occur across the membrane.
1. No energy is expended compared with active transport.
2. Glucose moves across cell membranes by facilitated diffusion. Insulin allows a rapid attachment of glucose to the intramembrane carrier substance.
C Active transport is the movement of a substance from an area of low concentration to an area of high concentration (Figure 14-3).
