[level-membership-for-physical-medicine-and-rehabilitation-category]
Chapter 2 Examination of the Pediatric Patient
Assessment of an infant or a child requires that the examiner has the ability to attain a complete medical, developmental, and family history; has a flexible approach to the physical examination; and understands the unique interaction between a child and that child’s physical and psychosocial environment. Establishing a diagnostic label is important, but determining the child’s functional status is also important for the rehabilitation management of the child. Although the evaluation of children has many similarities to that of adults (see Chapter 1), it also has many distinctive features, as highlighted in this chapter.
Diagnostic Evaluations
History
A history should include a determination of the ages at which major developmental milestones were met, because this aids in assessing deviations from normal (Table 2-1). The achievement of major landmarks in gross motor, fine motor, and adaptive skills; in speech and language; and in personal and social behavior should clarify whether the disability is confined primarily to the neuromuscular system or involves deficits in other areas as well. The coexistence of multiple problems influences the rehabilitation program, interventional methods, and ultimate outcome.
A family history can assist in the identification of inherited or congenital diseases. A query of multigenerational medical problems should be obtained and formal genetic counseling offered if an inherited disease is suspected or known to exist. It is frequently helpful to briefly examine a family member if a genetic disorder is suspected. For example, assessing a parent for grip myotonia or the inability to release and quickly open up the hand can be done with a simple handshake. Examination of the parent’s foot can demonstrate a pes cavus or high-arched foot, which when present in the child is suggestive of the autosomal dominant form of Charcot-Marie-Tooth disease (see Chapter 47).
Physical Examination
There is no standardized approach to the physical examination of infants and children.1,5,21,22,29 Pediatric examinations are tailored to the individual child, based on age and developmental stage. Knowledge of developmental stages is important in evaluating both acute and chronic diseases. Young children should be examined with the parents present, but the parents’ presence is optional for adolescents.
Growth
Growth during infancy occurs at a very rapid rate, slows during early childhood, and increases once again during adolescence. Routine health care visits should emphasize the evaluation of growth parameters for every child, including height, weight, and head circumference. It is critical for a child’s growth to be plotted on age- and gender-appropriate charts.9 Growth is influenced not only by genetic programming but also by medical conditions and nutrition. The onset of organic or psychosocial illness might be accompanied by a sudden acceleration or cessation of growth. The rate of growth is more important than the absolute values, as evidenced by a child whose head circumference increases from the 5th percentile to the 50th percentile in a 2-month period, representing untreated hydrocephalus. Growth charts are now available for specific genetic syndromes, including Turner and Down syndromes, and for specific disabilities such as quadriplegic cerebral palsy.
Head circumference is measured serially using the occipitofrontal circumference. The average head circumference at birth is 35 cm and increases to 47 cm by 1 year of age.25 Microcephaly is defined as a head circumference that falls below two standard deviations from the mean, and is suggestive of central nervous system abnormalities including congenital infections, anoxic encephalopathy, or a degenerative disorder. Macrocephaly, defined as a head circumference greater than two standard deviations above the mean, can be associated with hydrocephalus, a metabolic disease, or the presence of a mass and requires further evaluation. Approximately 50% of macrocephaly in children is familial. Parental head size should be plotted on adult growth charts. A child with an isolated large head, no developmental delays, and a parent with a large head is probably normal.
The average height of a newborn is 50 cm, increasing by 50% at 1 year of age and doubling by 4 years.25 An estimate of adult height is obtained by doubling the child’s height at age 2 years. Many genetic syndromes are associated with short stature, including Down and Turner syndromes. Birth weight is influenced by multiple parameters and includes parental size, nutrition, gender, genetics, gestation and health of the baby. The average full-term child in the United States has a birth weight of 3400 g. Birth weight should double by 5 months of age and triple by 1 year of age. Deviations from normal weight should alert the provider to potential health-related problems that need to be investigated.
Adolescents pass through a predictable sequence of pubertal events as they mature. The Tanner stages of sexual maturity describe the secondary sexual characteristics of teenage girls and boys.33,34 Assessment of breast development and pubic hair in girls, and genital size and pubic hair in boys, is the basis for assigning a Tanner stage to an adolescent. The average age of menarche in girls is typically around 12 years. Precocious puberty is diagnosed if there is a premature development of secondary sexual characteristics. It is present when there are findings of puberty in girls younger than 8 years and in boys younger than 9 years.55 The etiology can be either peripheral or within the central nervous system, such as a hypothalamic-pituitary abnormality. Precocious puberty is well documented in children with spina bifida and brain injuries.51 Tanner staging is useful in evaluating musculoskeletal issues such as leg length discrepancies and scoliosis, as treatment options can vary depending on the pubertal stage of the child.
General Inspection
Visual inspection is critical in the examination of a child. It begins with a general assessment of the child’s appearance. This gives the examiner a sense of how the infant or child interacts with the parents as well as information about the child’s general movements, abnormal physical features, and overall general health. The presence of abnormal physical features can be helpful in identifying common syndromes (Table 2-2). The examiner should pay specific attention to facial abnormalities such as abnormal spacing of the eyes, position and size of the ears and philtrum, and size of the upper and lower jaws. Normal measurements can be referenced when attempting to distinguish specific features such as ocular hypertelorism or small-appearing ears.26
Table 2-2 Common Syndromes and the Associated Abnormal Features
| Syndrome | Abnormalities |
|---|---|
| Angelman syndrome | Severe mental retardation, delay in attainment of motor milestones, microbrachycephaly, maxillary hypoplasia, deep-set eyes, blond hair (65%), ataxia and jerky arm movements resembling those of a marionette (100%), seizures |
| Hunter syndrome | Growth deficiency, coarsening of facial features, full lips, macrocephaly, macroglossia, contractures of joints, broadening of bones, hepatosplenomegaly, delayed tooth eruption |
| Marfan syndrome | Tall stature with long slim limbs, little subcutaneous fat, arachnodactyly, joint laxity, scoliosis (60%), retinal detachment, upward lens subluxation, dilatation of ascending aorta |
| Neurofibromatosis syndrome | Areas of hyperpigmentation or hypopigmentation with café au lait spots (94%); “freckling” of axilla, inguinal folds, and perineum; cutaneous neurofibromas that are small, soft, pigmented nodules; plexiform neurofibromas; Lisch nodules |
The assessment of the head and neck includes inspection of shape and symmetry. Since the American Academy of Pediatrics initiated the Back to Sleep program in 1992, the recommendation for newborns and infants to sleep in the supine position, more infants are presenting to their primary care providers with the presence of plagiocephaly, primarily observed as a unilateral flattening of the occiput.41 Examination of the head and neck can also identify the presence of torticollis involving tightness of the sternocleidomastoid muscle. Children with torticollis have a head tilt to the involved side, and the chin will be turned to the contralateral side. Children with a short, broad neck with webbing might have Klippel-Feil syndrome, and with girls Turner syndrome must be considered.
Musculoskeletal Assessment
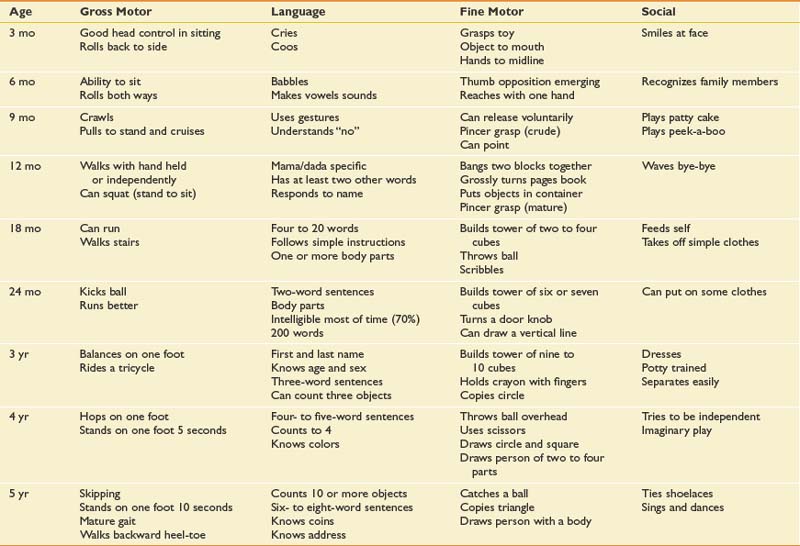
The spine and back examination includes an assessment of the bones and muscular elements, as well as a postural assessment. Evaluation includes having the child stand or sit while the back is examined. The height of the shoulders, position of scapula, and height of the pelvis should be assessed. The child is asked to bend forward so the examiner can look for rib and back asymmetries indicating scoliosis (Figure 2-1). Radiographs of the spine help define the severity of kyphotic and scoliotic curves. Scoliosis is categorized as infantile, juvenile, adolescent, or neuromuscular. The most common form is adolescent idiopathic scoliosis seen in pubertal girls with a right thoracic curve.35 Children should also be evaluated for other spinal pathology (Table 2-3).
| Spine Abnormality | Clinical Findings |
|---|---|
| Scoliosis (idiopathic, congenital, neuromuscular) |
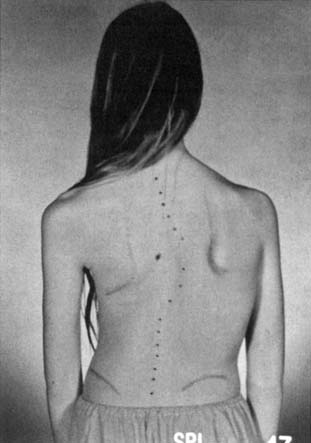
Examination of the lower limbs includes an evaluation of joint range of motion and torsional forces. Most torsional deformities tend to correct spontaneously as children grow and develop. Evaluation of the foot includes the toes and the three parts of the foot: forefoot, midfoot, and hindfoot. The shoes should be assessed for patterns of wear. The most common foot deformity is metatarsus adductus, which is medial deviation of the metatarsal bones (Figure 2-2). It is usually caused by intrauterine position, and the severity of the deformity can be classified according to the flexibility of the foot. Mild anomalies are easily corrected, while moderate cases require that some force be applied to the foot. Severe abnormalities cannot be corrected by conservative means and should be referred to an orthopedic surgeon.
Pes planus, or flatfoot, is a normal variant seen in children up to the age of 3 to 5 years.49 It occurs when the medial longitudinal arch is not well developed or there is underlying ligamentous laxity. Flexible flatfeet can also be a normal variant into adulthood, as long as an arch forms when individuals stand on their toes. Rigid or painful feet with reduced subtalar joint motion are often associated with tarsal coalition. This is an abnormal fusion of two or more bones in the midfoot or hindfoot that restricts motion. The two most common joints involved are the talocalcaneal and calcaneonavicular. Congenital vertical talus is a rigid flatfoot deformity with a rocker bottom and a dorsal dislocation of the navicular on the talus. It is associated with the genetic syndromes of myelodysplasia and arthrogryposis.
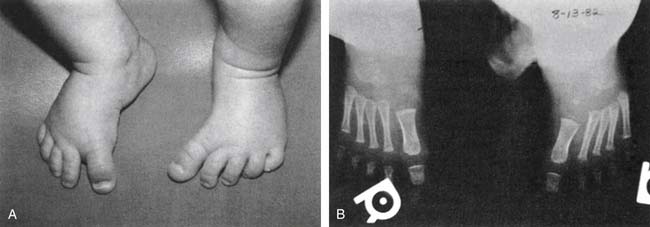
Pes cavus is a high-arched foot that does not flatten with weight-bearing. It is often associated with clawing of the toes, hindfoot varus, plantar fascia contractures, and great toe cock-up deformities. It can be a normal variant or might indicate a neuromuscular disorder such as Charcot-Marie-Tooth disease (Figure 2-3).
Congenital talipes equinovarus, or the classic clubfoot, is a complex deformity characterized by a small foot with a medial border crease, hindfoot equinus, and forefoot and hindfoot varus, along with forefoot adductus.43 The etiology remains controversial, as several theories have been proposed, including intrauterine position, primary germ cell defect in the talus causing persistent plantar flexion and inversion, and soft tissue abnormalities affecting the neuromuscular units. There is an association with other disorders such as cerebral palsy, arthrogryposis, chromosomal abnormalities, spina bifida, and neuromuscular diseases.
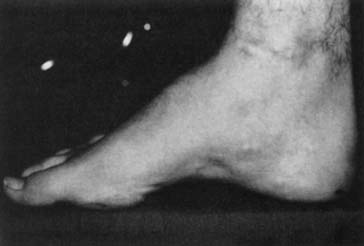
Tibial torsion is a twisting of the distal tibia in relationship to the proximal segment.32 It can result in either internal or external rotation of the tibia and can cause an abnormal-appearing gait pattern. Children have approximately 5 degrees of internal tibial torsion at birth, which progresses to 10 to 15 degrees in the adult. It is the most common reason for intoeing in the toddler age range. The evaluation includes assessment of the position of the patella during gait, along with the thigh-foot angle (Figure 2-4). Thigh-foot angle is assessed in the prone position with the knee flexed to 90 degrees. Two bisecting lines are drawn: one along the femur and the other through the heel and third web space. The angle should be −10 degrees to +10 degrees.
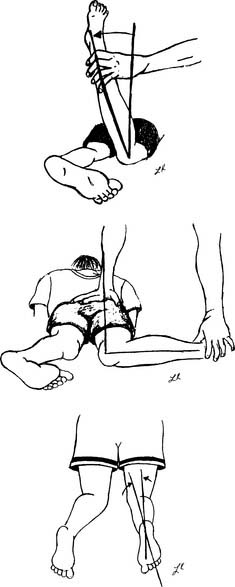
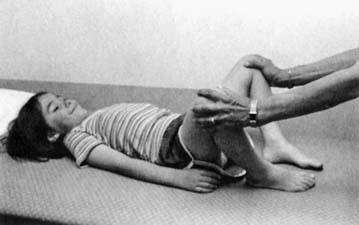
The hip should be evaluated for torsional forces, including femoral anteversion and retroversion, along with routine range of motion including assessment of both internal and external rotation. Femoral anteversion is a twisting of the femur between the femoral neck and the femoral condyles. The femoral neck moves forward in relation to the rest of the femur. The result is increased internal rotation at the hip. Infants normally have 30 to 40 degrees of anteversion at birth, which shifts to around 15 to 25 degrees when full grown. Femoral anteversion is the most common cause of intoeing in the older child up to 10 years of age. Children with excessive femoral anteversion often present as clumsy, pigeon-toed walkers whose patellae are rotated medially. Femoral retroversion can cause outtoeing, clinically opposite to anteversion and less likely to correct with growth because the forces tend to rotate the femur outward. Evaluation of hip rotation measurements are done with the child in the prone position (see Figure 2-4). Hip abduction should be assessed with the child supine (Figure 2-5). Asymmetry of the range of motion can indicate hip subluxation, dislocation, contracture, or spasticity.
The child’s gait should be carefully analyzed and evaluated. Components of the gait cycle including the stance and swing phases are evaluated. Young children typically have progressive changes in gait characteristics, but generally the patterns mature by 7 years of age.28 Understanding normal and abnormal gait patterns helps the practitioner make diagnostic and functional decisions (Table 2-4).
| Gait | Characteristic(s) | Clinical Association |
|---|---|---|
| Spastic |
Neurologic Assessment
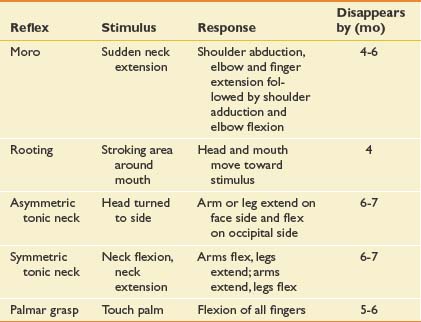
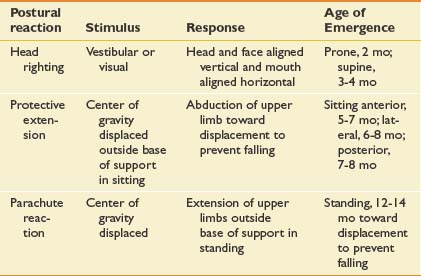
Developmental reflex assessment is a critical tool in evaluating a typical infant or an infant or child with a disability. Motor behaviors in newborns are dominated by primitive reflexes that are controlled at the level of the brainstem and spinal cord.16 These reflexes develop during gestation and disappear between the third and sixth month of life. Primitive reflexes are a predictable, involuntary response to a specific sensory stimulus (Table 2-5). Suppression of primitive reflexes reflects central nervous system maturation. Persistence or reoccurrence of abnormal reflexes is a strong indicator of neurologic dysfunction. The presence of an obligatory primitive reflex, one that a child cannot volitionally suppress, is always abnormal and suggests a central nervous system disorder. Primitive reflexes are precursors to volitional motor skills. Developmentally, primitive reflexes are replaced by postural reactions, which are involuntary postural patterns that enable righting, equilibrium, or protective movements (Table 2-6). Postural reactions appear in an organized fashion after 2 to 3 months of age and allow an infant to predictably progress with motor development, including rolling, sitting, and walking. Head righting is one of the automatic postural responses, elicited by sensory input that signals when the head or trunk is not in the midline. The parachute reaction, a protective extension of limbs to prevent or break a fall, is elicited by vestibular input signaling a change in head position. With few exceptions, postural reactions persist throughout life. Delays in the appearance of postural reactions are often detrimental to acquiring new voluntary motor skills.
Muscle tone refers to the amount of resistance present in muscles during passive range of motion. Muscle tone changes during development and can be affected by activity, alertness, and comfort. Flexor tone predominates in the first several months of infancy. A newborn infant is more hypotonic than a toddler. If true hypotonia persists, it generally points to an abnormality in the central nervous system, peripheral nervous system, or muscle. Hypertonia indicates an abnormality within the central nervous system that can be further defined as spasticity, rigidity, or dystonia.46 Spasticity is velocity dependent and results in resistance to muscle stretch, while dystonia is an involuntary pattern of muscle contractions and posture causing twisting and abnormal postures. Rigidity is present when resistance to movement is not influenced by the speed or position of the limb. An individual with a disability can have an isolated movement disorder or a combination of patterns. Muscle stretch reflexes are easily elicited in children of all ages. Absent or reduced reflexes can indicate an anterior horn cell disease, a peripheral neuropathy, or a myopathy. An increase in reflexes is often associated with an upper motor neuron process, suggesting central nervous system involvement.
Strength testing or manual muscle testing can be formally examined in the school-age child, using the same scoring system as in adults (see Chapter 1). Young children can present a challenge to the examiner as a result of a short attention span or a lack of understanding or cooperation, depending on their age and developmental level. A modified scale must be used in this situation. Use of a 0- to 4-point scale is recommended, with 0 indicating no movement; 1, trace movement; 2, movement with gravity eliminated; 3, movement against gravity; and 4, the child can take resistance. (This is the same as the adult scale except for combining grades 4 and 5 into one grade.) In testing the strength of infants and very young children, helpful techniques include checking for age-appropriate head and trunk control. This can be done by holding the child under the arms and lifting him or her into the air, placing in ventral suspension, and observing the child sitting and standing. Muscle strength in the older child can be evaluated through observation of simple activities such as rising from the floor, walking, reaching overhead, or throwing or kicking a ball. Quantitative measurements are generally not required unless specific therapeutic interventions are contemplated.
Coordination is best assessed by evaluating gross motor and fine motor skills. Impaired coordination is a common sign of a central movement disorder. Specific tests can be done in the older child. Most children are able to walk a straight line, although unsteadily, by 3 years of age. Tandem walking is a 5-year-old skill. School-age children can be more formally tested. Subtle symptoms can be seen by evaluating handwriting, drawing,13 and other higher-level physical skills. The child’s avoidance of organized sports or physical activity can be a clue that coordination problems exist. Ataxia is evaluated by having the child reach for an object, do the finger-to-nose test, sit or stand, and do tandem walking.
Sensory evaluation is difficult in young or uncooperative children and must be age-adjusted to obtain information that is useful. A child of 4 to 5 years can interpret joint position, vibration, light touch, temperature, and pain. In the very young child, behavioral responses are the best indicator of sensory awareness. These responses include withdrawing and stopping the activity, as well as looking, crying, or squirming.
Standardized Assessment Tools
A formal developmental assessment of an infant and a young child can be accomplished with the use of standardized developmental evaluations (Table 2-7). Use of the Denver Developmental Screening Test (DDST-II)17 by primary care providers can identify a child who requires further evaluation. This standardized screening tool can be used with children from birth to 6 years in an office setting. The four domains in the DDST-II that are assessed include gross motor, fine motor, language, and personal-social behavior. Direct observation and parent report comprise this screening test. A child who fails the DDST-II can be further evaluated by a specialist using either the Bayley Scale of Infant Development,3 which provides separate mental and motor scores, or the Gesell Developmental Schedule.20 These tests are easy to administer but require some test familiarity and the cooperation of the child. The appropriate interpretation of the information obtained is most important. Many infant evaluation measures rely heavily on motor responses to assess the child’s interest in learning.12 If a child has significant physical limitations, drawing correct inferences about the child’s current or future intellectual abilities can be difficult. Repeated studies have found a low correlation between abilities measured on infant tests and later childhood intelligence quotients (IQs).2,8,10 Infant test results must be considered provisional and should be followed by periodic reevaluation for further diagnostic and prognostic clarification.
| Test | Age Range | Scope and Value |
|---|---|---|
| Denver Developmental Screening Test17 | Birth to 6 yr | Quick screen for deviations from normal development of normal and near-normal children; pattern of functional deviations guides further evaluation |
| Bayley Scale of Infant Development3 | Birth to 30 mo | Separate mental and motor scales; well standardized; heavily weighted with motor-based items, which limits predictive value in physically handicapped children |
| Gesell Developmental Schedule20 | 4 wk to 6 yr | Indicator of current developmental level |
The assessment of preschool and school-age children includes assessment of both physical and intellectual abilities (Table 2-8). The chief strength of intelligence tests lies in their correlation with school performance. If the results are appropriately interpreted, the tests reflect the probability of standard academic achievement. It is important to note both the overall score and the subscores to assess whether a child’s abilities are evenly developed, or whether there are patterns of strengths and weaknesses that are relevant to learning and general adaptation.10
Table 2-8 Intellectual Evaluations
| Test | Age Range (yr) | Scope and Value |
|---|---|---|
| Stanford-Binet Intelligence Scale50 | 2 to adult | Detailed diagnostic assessment (mental age and IQ); guidelines for hearing, visual, and motor handicaps |
| Wechsler Preschool and Primary Scale of Intelligence—Revised (WPPSI-R)54 | 3-6½ | Verbal, performance, and full-scale scores; delineates strengths and weaknesses; not appropriate for children with severe developmental delays |
| Wechsler Intelligence Scale for Children— Revised (WISC-R)53 | 6-16 | Verbal, performance, and full-scale scores; subtests point to specific areas of strength or dysfunction |
| Kaufman Assessment Battery for Children27 | 2½-12 | Measures mental processes independent of the content of acquired knowledge; useful for children from disadvantaged backgrounds |
IQ, Intelligence quotient.
Most of the standardized intelligence tests rely heavily on language and motor performance. For some disabled children, such as those with language or motor impairments, alternative nonverbal and motor-eliminated assessments might be needed (Table 2-9). Vocabulary tests typically show the strongest correlation with overall intellectual ability and school success.
Table 2-9 Alternative Nonverbal and Motor-Eliminated Tests
| Test | Age Range (yr) | Scope and Value |
|---|---|---|
| Peabody Picture Vocabulary Test (PPVT)15 | 2½-18 | Effective test of language, especially in children with speech and motor impairments |
| Leiter International Performance Scale31 | 2-18 | Measures nonverbal problem-solving abilities in deaf and in speech- and motor-handicapped children |
| Pictorial Test of Intelligence18 | 3-8 | Measures intellectual ability of multiply handicapped children; requires receptive language |
| Raven’s Progressive Matrices42 | 6 to adult | Measures nonverbal intelligence and concept formation |
Several tests have been designed to evaluate visual motor maturity in children and to detect delays or impairment in visual perceptual skills and eye-hand coordination (Table 2-10). Children with neurologic and developmental disabilities sometimes exhibit difficulties in visual perceptual, perceptual motor, auditory, kinesthetic, and tactile functioning. A wide variety of instruments are available to test for these impairments. Achievement tests are designed specifically to evaluate the child’s performance in school subject areas, such as reading and mathematics (Table 2-11). Scores are typically given in terms of school grade equivalence, which can provide an estimate of the child’s level of academic skill, as well as standard scores based on age norms. Many are paper-and-pencil tests that penalize disabled children for their slower pace, poor attention, or difficulty keeping track of their place on the page. It is important that a skilled observer administer the test because observation of task approach can be used to adjust quantitative results.
Table 2-10 Perceptual Evaluations
| Test | Age Range (yr) | Scope and Value |
|---|---|---|
| Beery-Buktenica Development Test of Visual Motor Integration4 | 2-16 | Assesses visual motor performance, ability to copy geometric shapes, age equivalence |
| Bender Visual Motor Gestalt Test7 | 5 to adult | Assesses visual motor performance; easy to administer; nine geometric designs |
Table 2-11 Academic Achievement Tests
| Test | Grade Level or Age Range | Scope and Value |
|---|---|---|
| Wide Range Achievement Test—Revised (WRAT)24 | Kindergarten to 12th grade | Yields academic achievement level in reading, spelling, arithmetic; can measure progress |
| Woodcock-Johnson Psychoeducational Battery: Test of Achievement56 | 3 yr to adult | Yields age and grade level, percentiles, and standard scores in reading, mathematics, written language, and general tasks |
| Peabody Individual Achievement Test14 | Kindergarten to 12th grade | Only pointing response for overview of achievement; useful for handicapped |
The test composite scores, or full-scale scores (IQs), are used to designate a child’s overall level of intellectual functioning.10 This is derived by comparing an individual child’s performance with the performance of children in a representative age-stratified norm group. On most of these tests, the mean score is 100, representing average or normal intelligence. Classifications as superior or subaverage typically refer to scores that fall two standard deviations above or below the mean.
Assessment Tools for the Child With a Disability
The Gross Motor Function Measure (GMFM) is a reliable and valid measure of motor function designed for quantifying change in the gross motor abilities of children with cerebral palsy.45 The GMFM-88 consists of 88 items that have been grouped into five different dimensions of gross motor function: lying and rolling; sitting; crawling and kneeling; standing; and walking, running, and jumping. Scoring is based on a 4-point scale for each item, using the following key: 0, does not initiate; 1, initiates; 2, partially completes; and 3, completes. All items are attainable by 5-year-old children with normal motor development. A newer version, GMFM-66, comprises a subset of the original GMFM-88.44 The GMFM-88 version is also valid for use with children who have Down syndrome.19,40
Several assessment tools are available to evaluate and track the progress of a child with upper limb involvement. The Quality of Upper Extremity Skills Test (QUEST) is a reliable and valid outcome measure designed to evaluate movement patterns and hand function in children with cerebral palsy.11 The Assisting Hand Assessment (AHA) is a hand function evaluation instrument that was developed for use with children who have a functional limitation in one upper extremity. It measures how children use their affected hand collaboratively with the nonaffected hand in bimanual activities. The AHA can be used with children from 18 months to 12 years of age.30
The Pediatric Evaluation of Disability Inventory (PEDI) was developed to provide a comprehensive clinical assessment of key functional capabilities and performance in children between the ages of 6 months and 7 years.23 The PEDI can also be used for the evaluation of older children if their functional abilities fall below that expected of 7-year-old children without disabilities. The assessment was designed to serve as a descriptive measure of the child’s current functional performance, as well as a method for tracking change across time. The PEDI measures both capability and performance of functional activities in three content domains: self-care, mobility, and social function. Capability is measured by the identification of functional skills for which the child has demonstrated mastery and competence. Functional performance is measured by the level of assistance a caregiver must provide for the child to accomplish major functional activities such as eating or outdoor mobility. A modifications scale provides a measure of environmental modifications and assistive devices used by the child in routine daily activities.
The Functional Independence Measure for Children (WeeFIM) is a tool to assess a child’s function in the domains of mobility, locomotion, self-care, sphincter control, communication, and social cognition.37,38 It measures the level of independence and degree of caregiver assistance that is necessary to accomplish daily activities. This tool has a similar scoring profile to the adult version known as the FIM. The WeeFIM can be used to track over time children seen in outpatient clinics, as well as the changes observed within an inpatient rehabilitation program. There are other disability-specific evaluation tools such as the spina bifida neurologic scale39 and the prosthetic upper extremity functional index57,58 that can be used when evaluating special populations in the outpatient clinic setting.
A complete assessment of a child with a disability should include a description of social and adaptive abilities as well as quality-of-life measurements (Tables 2-12 and 2-13). The Vineland Adaptive Behavior Scale (VABS) is a tool to assess the personal and social self-sufficiency of individuals with or without disabilities. The VABS measures adaptive behaviors in five domains: communication, daily living skills, socialization, motor skills, and maladaptive behavior. The Pediatric Quality of Life Inventory (PedsQL) measures health-related quality of life in healthy children and adolescents and those with acute and chronic health conditions.52 The PedsQL measures the core components of health as outlined by the World Health Organization and includes physical functioning, emotional functioning, and social functioning, as well as one additional item—school functioning. Personality can be assessed at 3 to 10 years with the Children’s Apperception Test.6 Care must be taken when arriving at a specific diagnosis on the basis of developmental testing performed early in a child’s life, because of the inherent limitations of the tests. In addition, central nervous system dysfunction is not incompatible with normal intelligence, and the degree to which a child might be intellectually impaired cannot be predicted solely from physical or motor deficits. Familiarity with the tests that are being used is essential when interpreting this information.
| Test | Age Range | Scope and Value |
|---|---|---|
| Vineland Adaptive Behavior Scale48 | 1 mo to adult | Questionnaire of social competence in communication, socialization, daily living skills, and motor skills; adjusted for handicapped |
| American Association of Mental Deficiency Adaptive Behavior Scale35 | 3 yr to adult | Activities of daily living; adaptive and maladaptive behaviors; assists in program planning |
Table 2-13 Quality-of-Life Measures
| Test | Age Range (yr) | Scope and Value |
|---|---|---|
| Pediatric Quality of Life Inventory (PedsQL) self-report and parent-proxy questionnaire | 2-18 | Measures health-related quality of life |
1. Barness C.A. Manual of pediatric physical diagnosis. St Louis: Mosby-Year Book; 1991.
2. Barness C.A. Principles and practice of pediatrics. Philadelphia: Lippincott; 1994.
3. Bayley N. Bayley Scale of Infant Development. New York: Psychological Corp; 1969.
4. Beery K., Buktenica N. Developmental Test of Visual-Motor Integration. Chicago: Follett; 1967.
5. Behrman R.E., Vaughan V.C., editors. Nelson’s textbook of pediatrics. Philadelphia: Saunders, 1987.
6. Bellak L. Manual Children’s Apperception Test. New York: Grune & Stratton; 1961.
7. Bender L. Bender Visual-Motor Gestalt Test. New York: Orthopsychiatric Association; 1946.
8. Capute A.J., Accardo P.F., Vining E.P.G. Primitive reflex profile. Baltimore: University Park Press; 1977.
9. Centers for Disease Control and Prevention. 2000 CDC growth charts: United States. National Center for Health Statistics. Available at: http://www.cdc.gov/growthcharts/. Accessed May 20, 2004.
10. Chinitz S.P., Feder C.Z. Psychological assessment. In: Molnar G.E., editor. Pediatric rehabilitation. Baltimore: Williams & Wilkins, 1992.
11. DeMatteo C., et al. QUEST: Quality of Upper Extremity Skills Test. Hamilton: McMaster University, 1992.
12. DiBose R. Predictive value of infant intelligence scales with multiply handicapped children. Am J Ment Defic. 1977;81:388-390.
13 DiLeo J. Children’s drawings as diagnostic aides. New York: Brunner-Mazel; 1973.
14. Dunn L., Markwardt F. Manual: Peabody Individual Achievement Test. Circle Pines: American Guidance Service; 1970.
15. Dunn L.M. Peabody Picture Vocabulary Test—Revised. Circle Pines: American Guidance Service; 1970.
16. Fiorentino M.R. Normal and abnormal development. Springfield, IL: Charles C Thomas; 1972.
17. Frakenburg W.C., Dodds J., Archer P. Denver II technical manual. Denver: Denver Developmental Materials; 1990.
18. French J. Manual: Pictorial Test of Intelligence. Boston: Houghton Mifflin; 1964.
19. Gemus M., Palisano R., Russell D., et al. Using the Gross Motor Function Measure to evaluate motor development in children with Down syndrome. Phys Occup Ther Pediatr. 2001;21(2-3):69-79.
20. Gesell A: Gesell Developmental Schedule, New York, 1979, Psychological Corp.
21. Green M. Pediatric diagnosis: interpretation of symptoms and signs in different age periods. Philadelphia: Saunders; 1985.
22. Gundy J.H. The pediatric physical examination. In: Hoekelman R.A., editor. Primary pediatric care. St Louis: Mosby-Year Book, 1992.
23. Haley S.M. Pediatric Evaluation of Disability Inventory. In: Coster W.J.L., Larry H., editors. Pediatric Evaluation of Disability Inventory, Boston. Boston University, 1992.
24. Jastak S., Wilkinson G.S. The Wide Range Achievement Test—Revised. Wilmington: Jastak Associates; 1984.
25. Johnson C.P., Blasco P.A. Infant growth and development. Pediatr Rev. 1997;18(7):224-242.
26. Jones K.L. Smith’s recognizable patterns of human malformation, ed 5. Philadelphia: Saunders; 1997.
27. Kaufman A., Kaufman N. Kaufman Assessment Battery for Children. In Circle Pines, MN. American Guidance Service; 1983.
28. Keen M. Early development and attainment of normal mature gait. J Prosthet Orthot. 1993;5(2):35-38.
29. Kottke F.J., Lehman J.F., editors. Krusen’s handbook of physical medicine and rehabilitation. Philadelphia: Saunders, 1990.
30. Krumlinde-Sundholm L., Holmefur M., Kottorp A., et al. The Assisting Hand Assessment: current evidence of validity, reliability, and responsiveness to change, Dev Med Child Neurol. 2007;49(4):259-264.
31. Leiter R. The Leiter International Performance Scale. Chicago: Stoelting; 1969.
32. Lincoln T.L., Suen P.W. Common rotational variations in children. J Am Acad Orthop Surg. 2003;11(5):312-320.
33. Marshall W.A., Tanner J.M. Variations in pattern of pubertal changes in girls. Arch Dis Child. 1969;44(235):291-303.
34. Marshall W.A., Tanner J.M. Variations in the pattern of pubertal changes in boys. Arch Dis Child. 1970;45(239):13-23.
35. Mehlman CT. Idiopathic scoliosis. Available at: http://www.emedicine.com/orthoped/topic504.htm. Accessed June 30, 2004.
36. Mihira K., Foster R., Shellhaas M. AAMD adaptive behavior scales. Washington DC: American Association of Mental Deficiency; 1974.
37. Msall M.E., DiGaudio K., Duffy L.C., et al. WeeFIM. Normative sample of an instrument for tracking functional independence in children. Clin Pediatr (Phila). 1994;33(7):431-438.
38. Msall M.E., DiGaudio K., Rogers B.T., et al. The functional independence measure for children (WeeFIM). Conceptual basis and pilot use in children with developmental disabilities. Clin Pediatr (Phila). 1994;33(7):421-430.
39. Oi S., Matsumoto S. A proposed grading and scoring system for spina bifida: Spina Bifida Neurological Scale (SBNS). Childs Nerv Syst. 1992;8(6):337-342.
40. Palisano R.J., Walter S.D., Russell D.J., et al. Gross motor function of children with Down syndrome: creation of motor growth curves. Arch Phys Med Rehabil. 2001;82(4):494-500.
41. Persing J., James H., Swanson J., et al. Prevention and management of positional skull deformities in infants. American Academy of Pediatrics Committee on Practice and Ambulatory Medicine, Section on Plastic Surgery and Section on Neurological Surgery. Pediatrics. 2003;112(1 part 1):199-202.
42. Raven J. Raven’s Progressive Matrices. Dumfries: Crichton Royal; 1958.
43. Roye D.P.Jr., Roye B.D. Idiopathic congenital talipes equinovarus. J Am Acad Orthop Surg. 2002;10(4):239-248.
44. Russell D.J., Avery L.M., Rosenbaum P.L., et al. Improved scaling of the Gross Motor Function Measure for children with cerebral palsy: evidence of reliability and validity. Phys Ther. 2000;80(9):873-885.
45. Russell D.J., Rosenbaum P.L., Cadman D.T., et al. The Gross Motor Function Measure: a means to evaluate the effects of physical therapy. Dev Med Child Neurol. 1989;31(3):341-352.
46. Sanger T.D., Delgado M.R., Gaebler-Spira D., et al. Classification and definition of disorders causing hypertonia in childhood. Pediatrics. 2003;111(1):e89-e97.
47. Simms M.D., Schum R.L. Preschool children who have atypical patterns of development. Pediatr Rev. 2000;21(5):147-158.
48. Sparrow S.S., Balla D.A., Ciccheti D.V. Vineland Adaptive Behavior Scale. Circle Pines, MN: American Guidance Service; 1984.
49. Sullivan J.A. Pediatric flatfoot: evaluation and management. J Am Acad Orthop Surg. 1999;7(1):44-53.
50. Thorndike R.L., Hagen E.P., Sattler J.M. The Stanford-Binet Intelligence Scale, ed 4. Chicago: Riverside; 1986.
51. Trollmann R., Dorr H.G., Strehl E., et al. Growth and pubertal development in patients with meningomyelocele: a retrospective analysis. Acta Paediatr. 1996;85(1):76-80.
52. Varni J.W., Seid M., Rode C.A. The PedsQL: measurement model for the Pediatric Quality of Life Inventory. Med Care. 1999;37:126-139.
53. Wechsler D. Wechsler Intelligence Scale for Children—Revised. New York: Psychological Corp; 1974.
54. Wechsler D. Wechsler Preschool and Primary Scales of Intelligence—Revised. San Antonio, TX: Psychological Corp; 1989.
55. Wheeler M.D., Styne D.M. Diagnosis and management of precocious puberty. Pediatr Clin North Am. 1990;37(6):1255-1271.
56. Woodcock R., Johnson M.D. Woodcock-Johnson Psychoeducational Battery: Tests of Achievement. Allen: DLM Teaching Resources. 1989.
57. Wright F.V., Hubbard S., Jutai J., et al. The Prosthetic Upper Extremity Functional Index: development and reliability testing of a new functional status questionnaire for children who use upper extremity prostheses. J Hand Ther. 2001;14(2):91-104.
58. Wright F.V., Hubbard S., Naumann S., et al. Evaluation of the validity of the Prosthetic Upper Extremity Functional Index for Children. Arch Phys Med Rehabil. 2003;84(4):518-527.
[/level-membership-for-physical-medicine-and-rehabilitation-category][not-level-membership-for-physical-medicine-and-rehabilitation-category]
Chapter 2 Examination of the Pediatric Patient
Assessment of an infant or a child requires that the examiner has the ability to attain a complete medical, developmental, and family history; has a flexible approach to the physical examination; and understands the unique interaction between a child and that child’s physical and psychosocial environment. Establishing a diagnostic label is important, but determining the child’s functional status is also important for the rehabilitation management of the child. Although the evaluation of children has many similarities to that of adults (see Chapter 1), it also has many distinctive features, as highlighted in this chapter.
Diagnostic Evaluations
History
A history should include a determination of the ages at which major developmental milestones were met, because this aids in assessing deviations from normal (Table 2-1). The achievement of major landmarks in gross motor, fine motor, and adaptive skills; in speech and language; and in personal and social behavior should clarify whether the disability is confined primarily to the neuromuscular system or involves deficits in other areas as well. The coexistence of multiple problems influences the rehabilitation program, interventional methods, and ultimate outcome.
A family history can assist in the identification of inherited or congenital diseases. A query of multigenerational medical problems should be obtained and formal genetic counseling offered if an inherited disease is suspected or known to exist. It is frequently helpful to briefly examine a family member if a genetic disorder is suspected. For example, assessing a parent for grip myotonia or the inability to release and quickly open up the hand can be done with a simple handshake. Examination of the parent’s foot can demonstrate a pes cavus or high-arched foot, which when present in the child is suggestive of the autosomal dominant form of Charcot-Marie-Tooth disease (see Chapter 47).
Physical Examination
There is no standardized approach to the physical examination of infants and children.1,5,21,22,29 Pediatric examinations are tailored to the individual child, based on age and developmental stage. Knowledge of developmental stages is important in evaluating both acute and chronic diseases. Young children should be examined with the parents present, but the parents’ presence is optional for adolescents.
Growth
Growth during infancy occurs at a very rapid rate, slows during early childhood, and increases once again during adolescence. Routine health care visits should emphasize the evaluation of growth parameters for every child, including height, weight, and head circumference. It is critical for a child’s growth to be plotted on age- and gender-appropriate charts.9 Growth is influenced not only by genetic programming but also by medical conditions and nutrition. The onset of organic or psychosocial illness might be accompanied by a sudden acceleration or cessation of growth. The rate of growth is more important than the absolute values, as evidenced by a child whose head circumference increases from the 5th percentile to the 50th percentile in a 2-month period, representing untreated hydrocephalus. Growth charts are now available for specific genetic syndromes, including Turner and Down syndromes, and for specific disabilities such as quadriplegic cerebral palsy.
Head circumference is measured serially using the occipitofrontal circumference. The average head circumference at birth is 35 cm and increases to 47 cm by 1 year of age.25 Microcephaly is defined as a head circumference that falls below two standard deviations from the mean, and is suggestive of central nervous system abnormalities including congenital infections, anoxic encephalopathy, or a degenerative disorder. Macrocephaly, defined as a head circumference greater than two standard deviations above the mean, can be associated with hydrocephalus, a metabolic disease, or the presence of a mass and requires further evaluation. Approximately 50% of macrocephaly in children is familial. Parental head size should be plotted on adult growth charts. A child with an isolated large head, no developmental delays, and a parent with a large head is probably normal.
The average height of a newborn is 50 cm, increasing by 50% at 1 year of age and doubling by 4 years.25 An estimate of adult height is obtained by doubling the child’s height at age 2 years. Many genetic syndromes are associated with short stature, including Down and Turner syndromes. Birth weight is influenced by multiple parameters and includes parental size, nutrition, gender, genetics, gestation and health of the baby. The average full-term child in the United States has a birth weight of 3400 g. Birth weight should double by 5 months of age and triple by 1 year of age. Deviations from normal weight should alert the provider to potential health-related problems that need to be investigated.
Adolescents pass through a predictable sequence of pubertal events as they mature. The Tanner stages of sexual maturity describe the secondary sexual characteristics of teenage girls and boys.33,34 Assessment of breast development and pubic hair in girls, and genital size and pubic hair in boys, is the basis for assigning a Tanner stage to an adolescent. The average age of menarche in girls is typically around 12 years. Precocious puberty is diagnosed if there is a premature development of secondary sexual characteristics. It is present when there are findings of puberty in girls younger than 8 years and in boys younger than 9 years.55 The etiology can be either peripheral or within the central nervous system, such as a hypothalamic-pituitary abnormality. Precocious puberty is well documented in children with spina bifida and brain injuries.51 Tanner staging is useful in evaluating musculoskeletal issues such as leg length discrepancies and scoliosis, as treatment options can vary depending on the pubertal stage of the child.
General Inspection
Visual inspection is critical in the examination of a child. It begins with a general assessment of the child’s appearance. This gives the examiner a sense of how the infant or child interacts with the parents as well as information about the child’s general movements, abnormal physical features, and overall general health. The presence of abnormal physical features can be helpful in identifying common syndromes (Table 2-2). The examiner should pay specific attention to facial abnormalities such as abnormal spacing of the eyes, position and size of the ears and philtrum, and size of the upper and lower jaws. Normal measurements can be referenced when attempting to distinguish specific features such as ocular hypertelorism or small-appearing ears.26
Table 2-2 Common Syndromes and the Associated Abnormal Features
| Syndrome | Abnormalities |
|---|---|
| Angelman syndrome | Severe mental retardation, delay in attainment of motor milestones, microbrachycephaly, maxillary hypoplasia, deep-set eyes, blond hair (65%), ataxia and jerky arm movements resembling those of a marionette (100%), seizures |
| Hunter syndrome | Growth deficiency, coarsening of facial features, full lips, macrocephaly, macroglossia, contractures of joints, broadening of bones, hepatosplenomegaly, delayed tooth eruption |
| Marfan syndrome | Tall stature with long slim limbs, little subcutaneous fat, arachnodactyly, joint laxity, scoliosis (60%), retinal detachment, upward lens subluxation, dilatation of ascending aorta |
| Neurofibromatosis syndrome | Areas of hyperpigmentation or hypopigmentation with café au lait spots (94%); “freckling” of axilla, inguinal folds, and perineum; cutaneous neurofibromas that are small, soft, pigmented nodules; plexiform neurofibromas; Lisch nodules |
The assessment of the head and neck includes inspection of shape and symmetry. Since the American Academy of Pediatrics initiated the Back to Sleep program in 1992, the recommendation for newborns and infants to sleep in the supine position, more infants are presenting to their primary care providers with the presence of plagiocephaly, primarily observed as a unilateral flattening of the occiput.41 Examination of the head and neck can also identify the presence of torticollis involving tightness of the sternocleidomastoid muscle. Children with torticollis have a head tilt to the involved side, and the chin will be turned to the contralateral side. Children with a short, broad neck with webbing might have Klippel-Feil syndrome, and with girls Turner syndrome must be considered.
Musculoskeletal Assessment
The spine and back examination includes an assessment of the bones and muscular elements, as well as a postural assessment. Evaluation includes having the child stand or sit while the back is examined. The height of the shoulders, position of scapula, and height of the pelvis should be assessed. The child is asked to bend forward so the examiner can look for rib and back asymmetries indicating scoliosis (Figure 2-1). Radiographs of the spine help define the severity of kyphotic and scoliotic curves. Scoliosis is categorized as infantile, juvenile, adolescent, or neuromuscular. The most common form is adolescent idiopathic scoliosis seen in pubertal girls with a right thoracic curve.35 Children should also be evaluated for other spinal pathology (Table 2-3).
| Spine Abnormality | Clinical Findings |
|---|---|
| Scoliosis (idiopathic, congenital, neuromuscular) |
Examination of the lower limbs includes an evaluation of joint range of motion and torsional forces. Most torsional deformities tend to correct spontaneously as children grow and develop. Evaluation of the foot includes the toes and the three parts of the foot: forefoot, midfoot, and hindfoot. The shoes should be assessed for patterns of wear. The most common foot deformity is metatarsus adductus, which is medial deviation of the metatarsal bones (Figure 2-2). It is usually caused by intrauterine position, and the severity of the deformity can be classified according to the flexibility of the foot. Mild anomalies are easily corrected, while moderate cases require that some force be applied to the foot. Severe abnormalities cannot be corrected by conservative means and should be referred to an orthopedic surgeon.
Pes planus, or flatfoot, is a normal variant seen in children up to the age of 3 to 5 years.49 It occurs when the medial longitudinal arch is not well developed or there is underlying ligamentous laxity. Flexible flatfeet can also be a normal variant into adulthood, as long as an arch forms when individuals stand on their toes. Rigid or painful feet with reduced subtalar joint motion are often associated with tarsal coalition. This is an abnormal fusion of two or more bones in the midfoot or hindfoot that restricts motion. The two most common joints involved are the talocalcaneal and calcaneonavicular. Congenital vertical talus is a rigid flatfoot deformity with a rocker bottom and a dorsal dislocation of the navicular on the talus. It is associated with the genetic syndromes of myelodysplasia and arthrogryposis.
Pes cavus is a high-arched foot that does not flatten with weight-bearing. It is often associated with clawing of the toes, hindfoot varus, plantar fascia contractures, and great toe cock-up deformities. It can be a normal variant or might indicate a neuromuscular disorder such as Charcot-Marie-Tooth disease (Figure 2-3).
Congenital talipes equinovarus, or the classic clubfoot, is a complex deformity characterized by a small foot with a medial border crease, hindfoot equinus, and forefoot and hindfoot varus, along with forefoot adductus.43 The etiology remains controversial, as several theories have been proposed, including intrauterine position, primary germ cell defect in the talus causing persistent plantar flexion and inversion, and soft tissue abnormalities affecting the neuromuscular units. There is an association with other disorders such as cerebral palsy, arthrogryposis, chromosomal abnormalities, spina bifida, and neuromuscular diseases.
Tibial torsion is a twisting of the distal tibia in relationship to the proximal segment.32 It can result in either internal or external rotation of the tibia and can cause an abnormal-appearing gait pattern. Children have approximately 5 degrees of internal tibial torsion at birth, which progresses to 10 to 15 degrees in the adult. It is the most common reason for intoeing in the toddler age range. The evaluation includes assessment of the position of the patella during gait, along with the thigh-foot angle (Figure 2-4
[/not-level-membership-for-physical-medicine-and-rehabilitation-category]
