Evidence-based eye examinations
1.1 Evidence-based optometry
Evidence-based optometry means integrating individual clinical expertise with the best currently available evidence from the research literature.1 A significant amount of evidence-based eye care is associated with treatments and their effectiveness and this information is typically provided by the results from randomised controlled trials (RCTs) or the collation of results from several RCTs within systematic reviews and meta-analyses.2 However, the diagnostic tests and procedures used in optometric practice should also be evidence based and what should always be avoided is the use of exam procedures based on anecdotal evidence, tradition or habit. The research literature should be regularly reviewed. There may be reports of newly developed techniques or instruments that are superior to the ones you typically use or even studies indicating that old and forgotten tests are actually better than commonly used ones.3
1.1.1 Reviewing the research literature
Currently professional bodies provide clinical guidelines that are based on research evidence and academic researchers write review articles, books and give lectures and this seems to be the preferred source of information for many optometrists.4 You may not need to review the research literature yourself, although it seems likely that this will become more common in future years as evidence-based optometry becomes an integral part of the undergraduate and postgraduate curriculum.4,5 If you wish to review the literature, one very useful free access website is PubMed (www.pubmed.com), which is provided by the US National Library of Medicine and includes the abstracts or summaries of all the main optometry and ophthalmology research journals. An increasing desire for research evidence to be freely provided to as many people as possible means that a growing number of the full articles are also free to access. Questions from clinicians on optometric internet/e-mail discussion groups can often be fully answered by a quick PubMed search that can provide a much better level of evidence than anecdotal suggestions based on one or two patient encounters. Full access to one or more of the main international optometry research journals, Ophthalmic and Physiological Optics, Optometry and Vision Science, Clinical and Experimental Optometry, Journal of Optometry and Contact Lens and Anterior Eye depends on which professional bodies you belong to, but note that the first three journals provide free access to a number of hot topic papers at www.whatshotoptometry.org.
1.1.2 Evaluating the usefulness of optometric tests
The usefulness of optometric tests is typically assessed by either comparing the test against an appropriate gold standard and/or assessing its repeatability.6 For example, a test that is being used as an objective measure of subjective refraction should be assessed by how closely the results match subjective refraction results and new tonometers are assessed by their agreement with the results of Goldmann Applanation Tonometry (GAT).
Clearly the appropriateness of the gold standard test in these studies is critical. For example, Calvin and colleagues used the von Graefe phoria measurement as the gold standard test to assess the usefulness of the cover test and suggested that the cover test was occasionally inaccurate.7 The gold standard in this area should be the cover test and not the von Graefe. The cover test is the only test that discriminates between strabismus and heterophoria, it is objective and not reliant on subject responses and subsequent studies have shown it to be far more repeatable than the von Graefe, which they indicate is unreliable and does not appear to warrant its widespread use.3,8,9 The Calvin study7 should have used the cover test as the gold standard and they would then have reported the limitations of the von Graefe. The gold standard test must also be appropriately measured. For example, Salchow et al. compared autorefraction results after LASIK refractive surgery against the gold standard of subjective refraction.10 Subjective refraction was an appropriate choice of gold standard, but was inappropriately measured. The authors concluded that autorefraction compared very poorly against subjective refraction post-LASIK. However, inspection of the results clearly indicates that the majority of the subjective refractions (particularly of the hyperopes) provided a result of plano. This suggests that a normal or near normal VA resulted in a ‘brief’ subjective refraction and a result of plano. Finally, any limitations of the gold standard test must be recognised. For example, GAT is known to provide high intra-ocular pressure (IOP) readings on thick corneas and low readings with thin corneas.11 This has tended to be ignored until recently when significant reductions in IOP have been found after refractive surgery (section 7.7). If a tonometer that was resistant to corneal thickness effects had been compared to GAT, it would have been shown to be variable. The conclusion would have been that the new tonometer was somewhat variable compared to GAT.
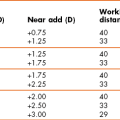
The use of subjective refraction as a gold standard assessment of refractive error has meant that there has been little or no comparison of the various methods used in subjective refraction. Previous studies have tended to compare the various tests against each other. For example, West and Somers compared the various binocular balancing tests and found that they all gave similar results and concluded that they were therefore all equally useful.12 Johnson and colleagues reported a similar finding when comparing subjective tests for astigmatism.13 These are not surprising findings and are limited by an unhelpful study design. A very good but under-utilised approach is to use some measure of patient satisfaction as the gold standard. If patients are happy with the results of subjective refraction using a particular test, then the test must be providing appropriate results and vice-versa. Hanlon and colleagues used this approach in a comparison of techniques used to determine the reading addition.14 They examined 37 patients that were dissatisfied with the near vision in their new spectacles. From the case history information in the review (recheck) examination, it was determined whether the improper add was too low or too high. For each patient, their reading addition was then determined using four methods (age, ½ amplitude of accommodation, NRA/PRA balance and binocular cross-cylinder). The percentage of adds for each test that gave the same result as the improper add or worse (higher than an improper add determined too high or lower than an improper add determined as too low) was calculated (section 4.14) The study would have been even better if they had confirmed that the patients were subsequently satisfied with their changed spectacles (i.e., that it really was the gold standard). This technique of using patient satisfaction as the gold standard test could be usefully employed to compare the various techniques used in distance refraction, particularly those that assess astigmatism and binocular balancing.
1.1.3 Analysis in clinical test comparison studies
In the past, test comparison studies tended to quantify the relationship between the test and gold standard using correlation coefficients. This is not appropriate for two reasons. First, a high correlation coefficient just indicates there is a strong relationship between the two sets of data and does not necessarily mean that agreement between the tests is good.6,15 For example, if the test results were always twice as big as the gold standard test, the correlation coefficient would be 1.0, but agreement would be very poor. In addition, correlation coefficients are very much affected by the range of values used in the analysis.6,15,16 If a small range of values is used in calculations the correlation coefficient is likely to be much smaller than if a larger range is used. This is highlighted in Figure 1.1, which shows a plot of correlation coefficients between visual acuity and other clinical measures of visual function versus the range of visual acuity of the subjects used in the studies. A much better analysis, commonly known as a Bland-Altman plot, shows the 95% confidence limits of the difference between the test and gold standard (Figure 1.2).6,15 The extent to which the 95% Bland-Altman agreement figures are clinically acceptable should be discussed by the authors of a paper and ideally acceptable limits should be determined prior to any assessment.6
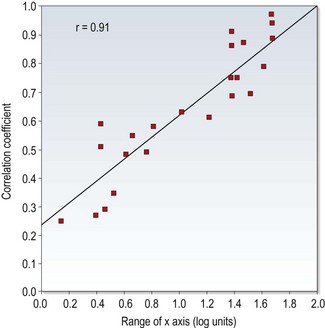
Fig. 1.1 Correlation coefficients from the literature between high contrast visual acuity and other spatial vision measures are plotted as a function of the range of high-contrast acuities in those studies. The solid line is the regression line and the correlation coefficient for the plotted data points is 0.91. (Redrawn with permission from Haegerstrom-Portnoy G, Schneck ME, Lott LA, Brabyn JA. The relation between visual acuity and other spatial vision measures. Optometry and Vision Science 77:653–62, ©The American Academy of Optometry, 2000.)
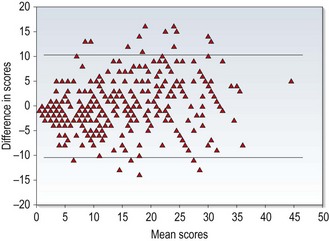
Fig. 1.2 A Bland-Altman plot showing agreement between optometrist grading of melanocytic fundal lesions and the gold standard assessment by an ocular oncologist versus the average score for each lesion. (Reprinted with permission from Hemmerdinger C, Beech M, Groenewald C and Damato B. Validation of an online referral guide for melanocytic fundus lesions. Ophthalmic and Physiological Optics 31:574–9. ©The College of Optometrists, 2011.)
1.1.4 Analysis of test repeatability
Repeatability assesses the ability of a measurement to be consistently produced. It is sometimes called precision or reliability and particularly in older reports has been quantified in terms of correlation coefficients. The limitations of correlation coefficients have already been discussed and it is better to assess repeatability in terms of the coefficient of repeatability (COR) or similar.6 This represents the 95% confidence limits of the difference between the test and retest scores and can be displayed using Bland-Altman plots (Figure 1.2).15 Correlation coefficients can be used when comparing tests that do not use the same units, but their limitations need to be realised. In particular, a large range of values should be used, so that correlation coefficients are not artificially low. Concordance values (the percentage of patients getting exactly the same score on test and retest) have also been used to indicate that a test is repeatable. However, a high proportion of patients often obtaining exactly the same score on follow-up visits indicates that the step sizes on the test are too big rather than that the test is repeatable.17 For example, a visual acuity chart containing only 20/20 (6/6) and 20/200 (6/60) lines would provide very high concordance but would be of very little value.
Repeatability studies providing COR data indicate the size of the change in score due to chance and a clinically significant change in score is anything larger than the COR (at least for tests with a continuous scale).18 Repeatability appears to be a very important quality of a test, as an unreliable test is likely to correlate poorly with a gold standard and have poor discriminative ability.19 As these studies are also relatively quick and simple, the results of repeatability studies should be available for all clinical tests.
1.1.5 Critically appraising a research paper
Research journals such as those listed earlier include a rigorous review process so that the majority of papers include minimal problems and many list the limitations of the study within the report. However, not all research reports necessarily provide accurate information and a study could be flawed for a variety of reasons.20,21 In addition, articles on the internet and in professional magazines are unlikely to provide the same level of scrutiny and it is very useful to be able to critique a research report, rather than just accept its conclusions. Various criteria can be used to assess the methodological quality of research articles and a high quality paper should include the following20,21:
• The paper should be easy to read and understand. Particularly in the area of the assessment of clinical and diagnostic techniques, there should be little that a clinician cannot understand. The rationale behind any complicated statistical analyses should be explained in a simple way. A paper that is difficult to understand often indicates a poorly written paper rather than any lack of understanding on the part of the reader.
• The introduction of a paper should include the purpose of the study and discuss pertinent previous work.
• The methods section should be clear and precise. Another researcher should be able to replicate the study from the information provided in the methods section. It is usually necessary to randomise the order in which tests are performed to ensure that there are no significant learning or fatigue effects that could affect the data.
• In studies where tests are compared against a gold standard, the clinicians should be blind to the results from the other test.
• The subject sample should be clearly outlined. A sufficiently large sample and a broad spectrum of subjects should be used to ensure no recruitment bias. In assessments of diagnostic tests, the patient sample must be representative of patients you would be examining in practice. For example, some Primary Open Angle Glaucoma (POAG) research studies include patients with moderate to severe POAG and healthy controls. This may be reasonable for an initial study, but likely tells you little about how well a new test would perform in discriminating between very early POAG and normal, healthy eyes in practice.
• In diagnostic studies, it is sometimes reported that a significant difference was found between a group of patients with an ocular abnormality and a control group. It should be noted that this only indicates that there is a difference between the averages of the two groups. It does not indicate how well the test predicts whether an individual patient has the abnormality or not.
• The authors may indicate the limitations of the study. The majority of research studies have some limitations and it is very helpful to the reader if the authors indicate them. It also suggests that the authors are not exaggerating the findings of their study.
1.2 ‘Screen everybody, so i don’t miss any glaucoma’: is this reasonable?
In many countries, glaucoma and other eye diseases are detected by ‘opportunistic case finding’ in that patients are self-selecting and they are detected as part of an eye examination that includes some assessment of ocular health and visual function.22 Professional bodies within different countries generally provide evidence-based guidelines which tend to suggest which tests are appropriate for different patient demographics and perhaps for certain signs and symptoms. There has been a tendency, however, particularly with the increased use of clinical assistants within optometric practice (section 1.3.5) to increasingly ‘screen’ patients with tests such as visual fields and non-contact tonometry to attempt to ‘not miss anything’.23 This approach is examined below and highlights the importance of understanding diagnostic indices of optometric tests.
1.2.1 Diagnostic test indices and what they can tell us
New diagnostic tests must have their diagnostic ability compared to a gold standard reference. The research study will therefore determine how well a test can correctly identify ‘abnormal’ or ‘normal’ eyes as classified independently by a gold standard test or battery of tests. For example, new instruments or techniques that attempt to identify POAG are typically assessed against classifications of patients into glaucomatous and control groups by clinical evaluation of optic nerve head assessment, visual fields and tonometry.24
Please note that the following figures of sensitivity, specificity and prevalence are not accurate and have been simplified. Imagine a POAG test that correctly detects patients with POAG 95% of the time (the sensitivity of the test is 95%); if the test indicates that a patient has POAG, what are the chances that they actually have the disease? Is it 95%? If lower, how much lower? When considering this question, you must not only consider how good the test is at identifying POAG, but you must also consider how good the test is at correctly identifying someone as normal. Unfortunately all tests provide false positives: patients who have normal, healthy eyes who the test results suggest are abnormal. There are four possible outcomes from the results of a diagnostic test (Table 1.1) and this information is used to quantify how well the test discriminates between ‘normal’ and ‘abnormal’ eyes, by providing sensitivity and specificity values.
Table 1.1
Possible outcomes of a screening test
| Diseased eye | Normal eye | |
| Test says diseased | True positive, TP (hit) | False positive, FP (false alarm) |
| Test says normal | False negative, FN (miss) | True negative, TN |
• Sensitivity is the ability of the test to identify the disease in those who have it.
• Sensitivity = TP / (TP + FN).
• Specificity is the ability of the test to correctly identify those who do not have the disease.
• Specificity = TN / (TN + FP).
• The false positive rate is simply 1 minus the specificity.
• Another important term to understand is the Predictive Value (PV), which has positive and negative forms.
• PPV or +PV is the proportion of people with a positive test result who have the disease. PPV = TP / (TP + FP).
• NPV or –PV is the proportion of people with a negative test result who do not have the disease. NPV = TN / (TN + TP).
The reported sensitivity and specificity of a test will differ depending on the pool of patients examined, the gold standard used to determine the presence or absence of disease and the cut-off criteria used. Sensitivity and specificity values and plots of one against the other for a range of cut-off values in receiver operating characteristic (ROC) curves (Figure 1.3) are usually presented.
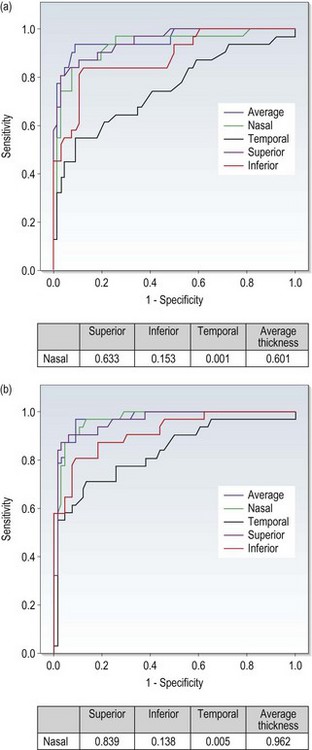
Fig. 1.3 Receiver-operating characteristic (ROC) curve showing OCT ability (using nerve fibre layer thickness in various quadrants) to discriminate between optic nerve head drusen and optic disc oedema. (Redrawn with permission from Flores-Rodríguez P, Gili P and Martín-Ríos MD. Sensitivity and specificity of time-domain and spectral-domain optical coherence tomography in differentiating optic nerve head drusen and optic disc oedema. Ophthalmic and Physiological Optics 32:213–21. ©The College of Optometrists, 2012.)
The ability of a diagnostic test to correctly identify patients with disease is highly dependent upon how prevalent the condition is (Bayes Theorem). For example, let us consider POAG and assume a prevalence in the over 40 population of 1%, and a diagnostic test for glaucoma with 95% sensitivity and 95% specificity. Table 1.2 shows the likely outcomes from 1000 patients. Nine or all 10 patients with POAG have a positive test result, but so have 50 patients with normal, healthy eyes. Returning to the question at the beginning of this section, if a POAG test that correctly detects patients with POAG 95% of the time (95% sensitivity) indicates that a patient has POAG, the chances that they actually have the condition (given a test specificity of 95%) is 17%! Detecting disease that has a low prevalence is very difficult no matter how good your diagnostic tests are because there are so few patients with the disease and so many people who don’t have that disease. This also highlights that with diseases with low prevalence, you are better off using tests (or cut-off scores for a test) that have the highest specificity (limiting false positives) even if this lowers sensitivity and a small number with POAG (in its early stages) are missed.
Table 1.2
Results for 1,000 patients from a ‘glaucoma test’ with 95% sensitivity and 95% specificity where the prevalence of primary open angle glaucoma (POAG) is either 1% or 10%. Data are also provided for the 1% prevalence group when the test is repeated
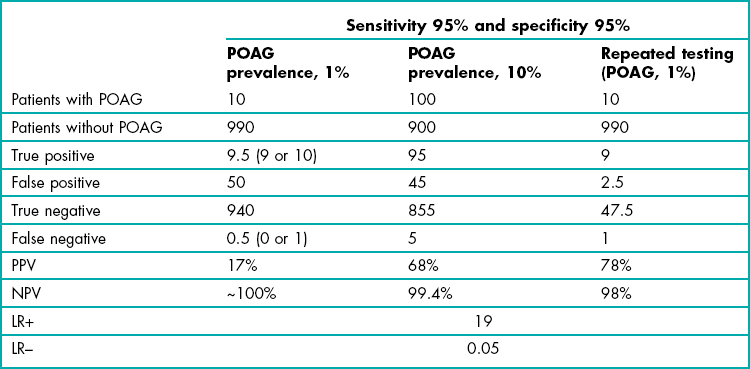
In addition to the diagnostic indices of sensitivity, specificity, PPV and NPV, likelihood ratios (LR) are becoming increasingly used to indicate diagnostic accuracy and unlike the predictive values, they are not dependent on the prevalence of the disease. A positive likelihood ratio (or LR+, sensitivity/1–specificity) expresses how much a positive test increases the odds that a patient has the disease. A negative likelihood ratio (or LR–, 1–sensitivity/specificity) indicates how much a negative test decreases the odds of having it. Charts have been developed that link a pre-test probability that a patient has a particular disease via a likelihood ratio column to indicate the post-test probability that a patient has the disease given either a positive or negative test result. The evidence-based medicine approach encourages the use of these indices and calculations for individual patient diagnosis. However, physicians still struggle to use these concepts and this would appear to have some way to go to be useable, but suggests the future direction of this area.25
1.2.2 Are there a lot of false positive referrals from primary eye care?
Figures for false positive referrals will vary dependent on the disease type (most of the reports present data from suspect glaucoma referrals, which will obviously have higher false positive rates than referrals for conditions such as cataract), the structure and funding model of the primary-secondary eye care system, the level of training, expertise and equipment, the introduction of locally agreed guidelines, etc, etc.26 For these reasons, it is perhaps enough to say that it can be high and perhaps higher than you might expect. For example, in the most comprehensive study of its type to date, Bowling and colleagues reported a 46% false positive rate for suspect glaucoma from 2505 optometric referrals to the Oxford Eye Hospital over a 10-year period (1994–2004).27
1.2.3 Do false positive referrals matter?
Elmore and colleagues reported the false positive rate of the two main breast cancer screening tests to be 6.5% and 3.7%.28 These translate to very good specificity values of 93.5% and 96.3%. Despite this good specificity, over a ten-year period, nearly one-third of the women screened had at least one false positive mammogram or clinical breast examination. This highlights that if you test healthy people often enough, they will sooner or later obtain a positive test result, i.e. a false positive. It has been shown that these false positive results have negative psychological effects on these women and likely their families.29 Similarly, there is considerable and unnecessary worry and stress caused by a false positive result leading to referral to a secondary eye care system, in that some patients worry that they might be going blind. Patients should not be referred to secondary eye care on the basis of a slightly high intra-ocular pressure using a non-contact tonometer or a single positive visual field screening result. In addition to the psychological effects on patients and their families, the costs in terms of secondary eye care staff and patient time (including the delay that other patients will suffer because of busy clinics) prompted by a positive screening result should be considered.23
1.2.4 Reducing false positives 1: Only screen ‘at risk’ patients
Due to the high number of false positive results when screening patients for a disease with low prevalence (Bayes Theorem), it may be better to only screen those patients that are ‘at risk’. In these patients, the prevalence of the disease is higher than in the general population. Table 1.2 considers the likely outcomes using the same test discussed earlier on patients with a family history of POAG where the prevalence of the disease is higher and for simplicity we will assume a figure of 10%. In total, 140 patients gave positive results, of which 95 had the disease (PPV = 68%). Note how much better the test performs when it is used in patients at higher risk of having the disease. The positive predictive value is also significantly improved if you just perform screening on all patients over 75 years of age or patients over 40 years of age who are black (African American or African Caribbean) or those with suspicious optic discs or high intra-ocular pressure. Burr and colleagues in their systematic review suggested that screening of patients with ‘minor’ risk factors including myopia and diabetes did not improve the PPV sufficiently and was not cost-effective.22
1.2.5 Reducing false positives 2: Repeat testing
Another way of keeping false positive referrals to a minimum, and imperative if you are intending to screen more than ‘at risk’ patients, is to repeat positive results. For example, as part of the ocular hypertension treatment study, Keltner and colleagues found 703 Humphrey visual field test results that showed abnormal (positive glaucoma hemifield test and/or Corrected Pattern Standard Deviation, p < 0.05) and reliable visual fields.30 On retesting, abnormalities were not confirmed for 604 (86%)! The vast majority of visual field abnormalities were not verified on retest and confirmation of visual field abnormalities is essential for distinguishing reproducible visual field loss from long-term variability.
If the same glaucoma diagnostic test from Table 1.2, which suggested that 60 patients had POAG (only 10 did, a PPV of 17%), was repeated on these 60 patients, 9 or all 10 of the glaucoma patients would be identified, but 95% of the false positives (47 or 48) would now give a normal result. On retesting, positive results are found for 13 patients, of whom 10 have the disease (PPV = 77%). Of course, you could also combine both approaches by only screening at risk patients and repeating positive tests.
1.3 Primary eye care examination formats
The primary eye care examination must first and foremost adhere to the legal requirements where you are working. However, legal requirements tend to be provided in very broad terms. Some professional organisations that you belong to may also provide clinical guidelines of what your eye examination should include. These may be prescriptive or for guidance only. There are three main styles for a primary eye care examination, which could be used singularly or in combination: the database format, which uses a predetermined series of tests, the systems approach, which ensures an assessment of several systems and/or the problem-oriented approach, which focuses mainly on the patient’s problems.31,32 In addition, some parts of the eye examination could be performed by clinical assistants.
1.3.2 Systems examination
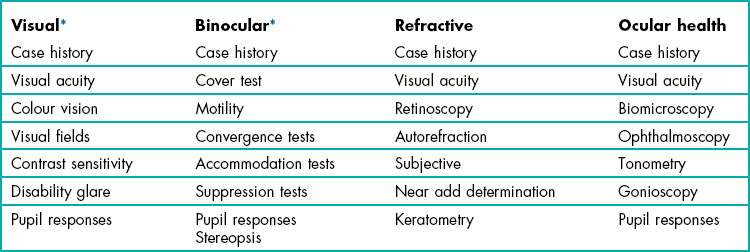
A systems examination style includes an assessment of visual function, the refractive and binocular systems and an ocular health assessment. The optometric examination is defined not by tests used, but by the systems that are assessed (Table 1.3). This approach is much more flexible as it does not demand that a certain collection of tests is used. In such an examination style, a minimum database has been gathered when each system has been tested. In summary, think in terms of assessing systems and not of using individual tests.
1.3.3 Problem-oriented examination
The problem-oriented examination aligns the examination around the problems reported by the patient. However, it does not only use tests that help solve the patient’s problems as it is built upon a systems examination approach.31,32 To perform a problem-oriented examination, the case history is critical as it guides the whole examination. From the information gained in the case history, you should attempt to deduce a list of tentative diagnoses (or several lists if more than one condition is suspected). For example, symptoms of blurred distance vision with normal near vision in a teenager could suggest the following tentative diagnoses (in order of likelihood): myopia, non-organic visual loss (section 4.12.6) and pseudomyopia. It is likely that visual acuity, retinoscopy and subjective refraction are all that is required to enable a differential diagnosis, although a cycloplegic refraction may be required if pseudomyopia is suspected. Other tests ensure an assessment of all the systems and depending on legal requirements and as a minimum these could include a cover and motility test (binocular system), assessment of pupil reflexes, slit-lamp biomicroscopy and fundus biomicroscopy (ocular health assessment).
• The patient might believe that their headaches are not associated with their vision or their eyes.
• The patient may assume that the clinician will identify a problem and would ask specifically about it if it was important.
• The patient could think that their slightly blurred vision is a normal consequence of ageing and so not mention it.
• The patient might not mention some symptoms such as flashes and floaters because they may think that they are not important and they may even believe that mentioning such symptoms would make them look foolish.
This further highlights the need to use the problem-oriented examination within a system assessment approach. It also indicates the importance of developing a good rapport with the patient to obtain a comprehensive case history (section 2.1). A further disadvantage of the problem-oriented approach is its complexity. To perform a problem-oriented examination, excellent communication skills are required to obtain a complete case history. A competent grasp of the information provided in the case history and how it relates to various ocular abnormalities is also needed, plus a knowledge of which tests are required to perform the huge variety of differential diagnoses. It is not suitable for the student clinician and can only be developed after significant experience has been gained.
1.3.5 The use of clinical assistants
The rationale behind the use of clinical assistants in pre-examination is twofold:
• As clinical assistants perform certain tests that the optometrist would previously have performed, some of the optometrist’s time is freed up. They could use this time to perform additional procedures or examine more patients per day.
• These procedures generally become more routinely performed.
After a period of training, clinical assistants should be able to competently perform any automated procedure, such as automated visual fields and focimetry, autorefraction and non-contact tonometry. The dangers of routinely screening all patients or all patients over 40 years of age with visual field tests and tonometry (unless you are committed to repeating any positive test results) has been discussed in section 1.2. In addition, other simple tests could be performed such as colour vision and stereopsis screening and interpupillary distance (PD) measurement. It is not possible for a clinical assistant to complete the full case history, since history taking continues throughout the examination. However, assistants could record a baseline history that could be reviewed and augmented by the clinician. However, this approach provides less likelihood of a good rapport being established between patient and clinician, which is vital for an optimal examination result (section 2.1). Clinical assistants could also measure visual acuity with the patient’s spectacles. However, important information can be obtained during visual acuity measurement in addition to the acuity score (section 3.2) and as an important part of the subjective refraction is to compare the final visual acuity (which the optometrist measures) with the habitual acuity, it appears best to have both measurements made by the clinician.
1.3.6 Should dilated fundus examinations be routine?
There has been considerable debate about whether a primary care eye examination should routinely include a dilated fundus examination (DFE).33–36 Two main arguments, supported by clinical data, are proposed in favour of the DFE. The first is that a DFE increases the number of posterior pole anomalies detected.33,34 In these studies, a non-dilated fundus examination with direct ophthalmoscopy was compared to a DFE using headband binocular indirect ophthalmoscopy (BIO) and direct ophthalmoscopy. Siegel et al. also used a monocular indirect ophthalmoscope examination as part of the non-dilated exam.33 The poor field of view of the direct ophthalmoscope was particularly blamed for missing anomalies in the posterior pole as it is too small to examine the area quickly and easily. The second argument in favour of a DFE is that significant anomalies would otherwise be missed in the peripheral retina. Although many of the anomalies found in the peripheral retina are benign and do not need treatment, studies assessing the optomap system have shown that it missed treatable conditions in both the mid-peripheral and particularly the far peripheral retina when compared with a dilated fundus examination.33–35,37,38
Further study seems to be required. This should compare DFEs against an undilated fundus examination with fundus biomicroscopy, and most importantly the comparison should be made only for those patients where there are no symptoms, signs (including a small undilated pupil that would restrict the view) and/or risk factors that would normally prompt a DFE. It is possible that the better field of view and stereoscopic image provided by fundus biomicroscopy would limit the advantage of a DFE for the posterior pole in a patient with a reasonable pupil size and that very few treatable peripheral conditions would be missed. The majority of patients with peripheral retinal disease reported by Batchelder and colleagues had important risk factors including previous anterior segment surgery, previous retinal detachment, strong family history of retinal detachment and high myopia.35
1.3.7 Test order
Box 1.1 provides a suggested order of testing for performing an efficient optometric examination. The exact testing to be performed will depend on the presenting complaint of the patient. Other test procedures should be inserted at appropriate times when the test result is not jeopardised by a preceding test and will not jeopardise tests that follow it in the eye examination. For example, refraction and pupil reflexes must be assessed prior to mydriasis and near muscle balance tests must be performed prior to cycloplegia. If the patient attends for an eye examination wearing their contact lenses, you may consider altering the order of your examination routine so that tests that can be completed with the lenses in situ are performed first (e.g. ophthalmoscopy, as issues associated with minification or magnification of the fundus image due to ametropia are minimised), then the lenses are removed before the remainder of the tests are completed.
References
1. Greenhalgh, T. How to Read a Paper: The Basics of Evidence-Based Medicine, 3rd ed. Oxford: Blackwell Publishing; 2006.
2. Rudnicka, AR, Owen, CG. An introduction to systematic reviews and meta-analyses in health care. Ophthalmic Physiol Opt. 2012;32:174–183.
3. Rainey, BB, Schroeder, TL, Goss, DA, Grosvenor, TP. Inter-examiner repeatability of heterophoria tests. Optom Vision Sci. 1998;75:719–726.
4. Suttle, CM, Jalbert, I, Alnahedh, T. Examining the evidence base used by optometrists in Australia and New Zealand. Clin Exp Optom. 2012;95:28–36.
5. Graham, AM. Finding, retrieving and evaluating journal and web-based information for evidence-based optometry. Clin Exp Optom. 2007;90:244–249.
6. McAlinden, C, Khadka, J, Pesudovs, K. Statistical methods for conducting agreement (comparison of clinical tests) and precision (repeatability or reproducibility) studies in optometry and ophthalmology. Ophthalmic Physiol Opt. 2011;31:330–338.
7. Calvin, H, Rupnow, P, Grosvenor, T. How good is the estimated cover test at predicting the von Graefe phoria measurement? Optom Vision Sci. 1996;73:701–706.
8. Wong, EP, Fricke, TR, Dinardo, C. Interexaminer repeatability of a new, modified prentice card compared with established phoria tests. Optom Vision Sci. 2002;79:370–375.
9. Casillas, EC, Rosenfield, M. Comparison of subjective heterophoria testing with a phoropter and trial frame. Optom Vision Sci. 2006;83:237–241.
10. Salchow, DJ, Zirm, ME, Stieldorf, C, Parisi, A. Comparison of objective and subjective refraction before and after laser in situ keratomileusis. J Cataract Refract Surg. 1999;25:827–835.
11. Doughty, MJ, Zaman, ML. Human corneal thickness and its impact on intraocular pressure measures: a review and meta-analysis approach. Surv Ophthalmol. 2000;44:367–408.
12. West, D, Somers, WW. Binocular balance validity: A comparison of five different subjective techniques. Ophthalmic Physiol Opt. 1984;4:155–159.
13. Johnson, BL, Edwards, JS, Goss, DA, et al. A comparison of three subjective tests for astigmatism and their interexaminer reliabilities. J Am Optom Assoc. 1996;67:590–598.
14. Hanlon, SD, Nakabayashi, J, Shigezawa, G. A critical view of presbyopic add determination. J Am Optom Assoc. 1987;58:468–472.
15. Bland, JM, Altman, DG. Statistical methods for assessing agreement between two methods of clinical measurement. Lancet. 1986;1:307–310.
16. Haegerstrom-Portnoy, G, Schneck, ME, Lott, LA, Brabyn, JA. The relation between visual acuity and other spatial vision measures. Optom Vision Sci. 2000;77:653–662.
17. Bailey, IL, Bullimore, MA, Raasch, TW, Taylor, HR. Clinical grading and the effects of scaling. Invest Ophthalmol Vis Sci. 1991;32:422–432.
18. Elliott DB, Bullimore MA, Bailey IL. Improving the reliability of the Pelli-Robson contrast sensitivity test. Clin Vision Sci 1991;6:471–5.
19. Elliott DB, Bullimore MA. Assessing the reliability, discriminative ability, and validity of disability glare tests. Invest Ophthalmol Vis Sci 1993; 34:108–19.
20. Harper, R, Reeves, B. Compliance with methodological standards when evaluating ophthalmic diagnostic tests. Invest Ophthalmol Vis Sci. 1999;40:1650–1657.
21. Lai, TY, Leung, GM, Wong, VW, et al. How evidence-based are publications in clinical ophthalmic journals? Invest Ophthalmol Vis Sci. 2006;47:1831–1838.
22. Burr JM, Mowatt G, Hernández R, et al. The clinical effectiveness and cost-effectiveness of screening for open angle glaucoma: a systematic review and economic evaluation. Health Technol Assess 2007;11:1-190.
23. Vernon, SA. The changing pattern of glaucoma referrals by optometrists. Eye. 1998;12:854–857.
24. Hutchings, N, Hosking, SL, Wild, JM, Flanagan, JG. Long-term fluctuation in short-wavelength automated perimetry in glaucoma suspects and glaucoma patients. Invest Ophthalmol Vis Sci. 2001;42:2332–2337.
25. Puhan, MA, Steurer, J, Bachmann, LM, ter Riet, G. A randomized trial of ways to describe test accuracy: the effect on physicians’ post-test probability estimates. Ann Intern Med. 2005;143:184–189.
26. Ang GS, Ng WS, Azuara-Blanco A. The influence of the new general ophthalmic services (GOS) contract in optometrist referrals for glaucoma in Scotland. Eye 2009;23:351–5.
27. Bowling B, Chen SD, Salmon JF. Outcomes of referrals by community optometrists to a hospital glaucoma service. Br J Ophthalmol 2005;89:1102–4.
28. Elmore, JG, Barton, MB, Moceri, VM, et al. Ten-year risk of false positive screening mammograms and clinical breast examinations. N Engl J Med. 1998;338:1089–1096.
29. Brett, J, Austoker, J. Women who are recalled for further investigation for breast screening: psychological consequences 3 years after recall and factors affecting re-attendance. J Pub Health Med. 2001;23:292–300.
30. Keltner, JL, Johnson, CA, Quigg, JM, et al. Confirmation of visual field abnormalities in the Ocular Hypertension Treatment Study. Arch Ophthalmol. 2000;118:1187–1194.
31. Amos JF. The problem-solving approach to patient care. In Diagnosis and Management in Vision Care (JF Amos, ed.), Boston: Butterworths; 1987. pp. 1–8.
32. Elliott DB. The problem-oriented optometric examination. Ophthalmic Physiol Opt Suppl 1998;18:S21–S9.
33. Siegel, BS, Thompson, AK, Yolton, DP, et al. A comparison of diagnostic outcomes with and without pupillary dilatation. J Am Optom Assoc. 1990;61:25–34.
34. Parisi, ML, Scheiman, M, Coulter, RS. Comparison of the effectiveness of a non-dilated versus dilated fundus examination in the pediatric population. J Am Optom Assoc. 1996;67:266–272.
35. Batchelder, TJ, Fireman, B, Friedman, GD, et al. The value of routine dilated pupil screening examination. Arch Ophthalmol. 1997;115:1179–1184.
36. Bullimore, MA. Is routine dilation a waste of time? Optom Vision Sci. 1998;75:161–162.
37. Mackenzie, PJ, Russell, M, Ma, PE, et al. Sensitivity and specificity of the optos optomap for detecting peripheral retinal lesions. Retina. 2007;27:1119–1124.
38. Cheng, SC, Yap, MK, Goldschmidt, E, et al. Use of the Optomap with lid retraction and its sensitivity and specificity. Clin Exp Optom. 2008;91:373–378.