[level-membership-for-cardiovascular-category]
Chapter 16 Evaluation of Intracardiac Masses
General Benefits of Three-Dimensional Echocardiography Over Two-Dimensional Echocardiography
Tumors: Generalities
Primary tumors of the heart are extremely rare, with a reported prevalence of 0.001% to 0.03% by autopsy series.1 The most common primary cardiac tumor is the myxoma, even though myxoma is relatively uncommon. Myxomas are most common in the atria, particularly the left atrium. They often have a clear stalk attached to the interatrial septum and clearly visualized with 3DE. Myxomas typically are benign, but the most common primary malignant tumors are sarcomas, which are highly invasive and uniformly fatal tumors. Angiosarcoma is the most common of this group. Metastatic tumors to the heart are much more common than are primary tumors, with the most common being breast and lung tumors; the usual cardiac site of metastasis is the pericardium. In fact, secondary involvement of the heart by extracardiac tumors is 20 to 40 times more common compared with primary cardiac tumors.1–3 Melanoma is a tumor that has particular propensity to metastasize to the heart.4
Individual Tumors: Myxomas
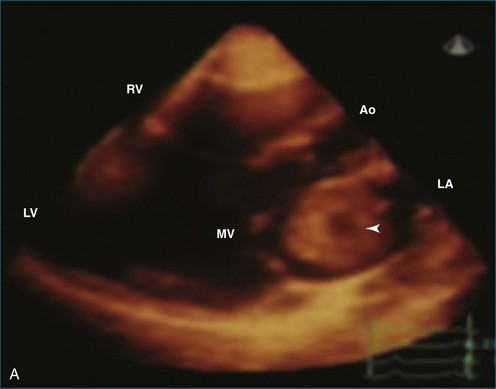
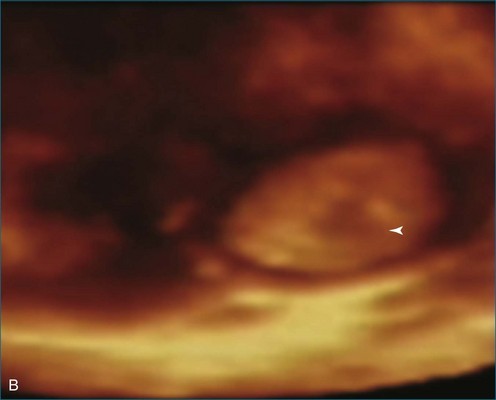
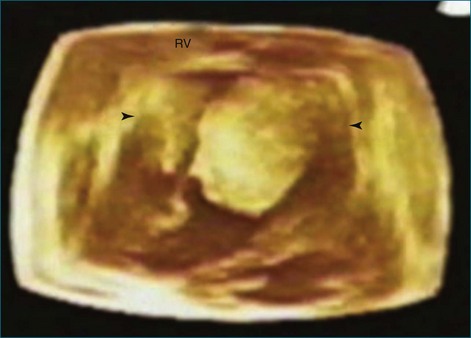
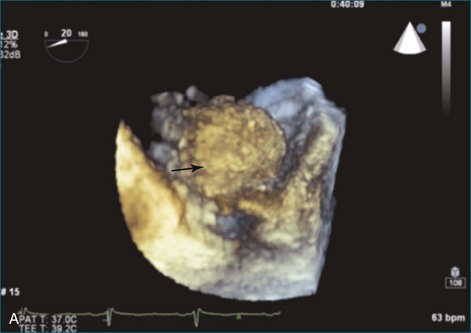
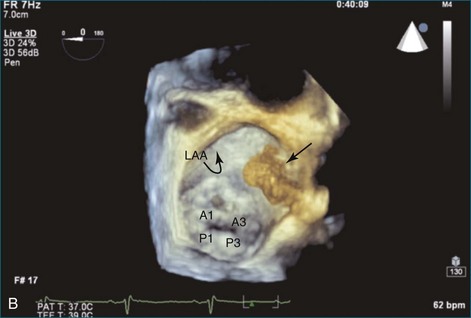
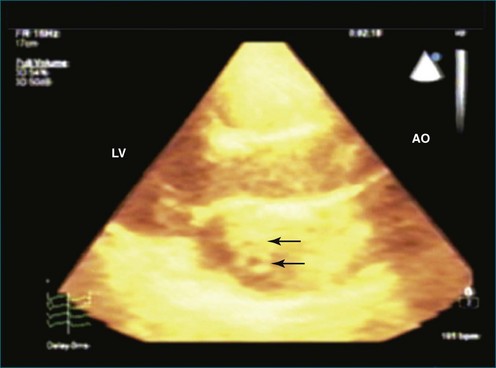
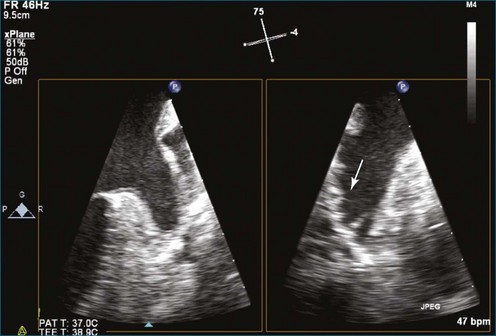
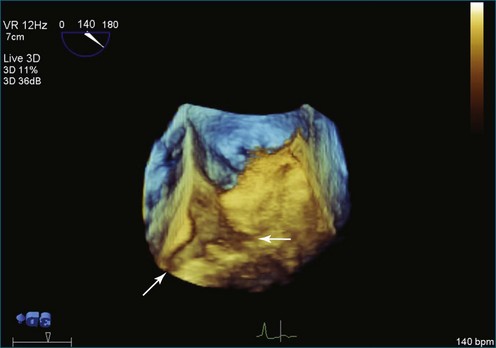
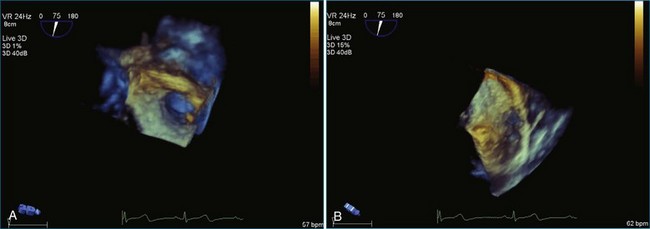
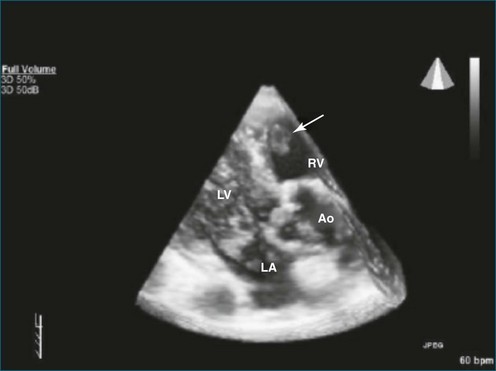
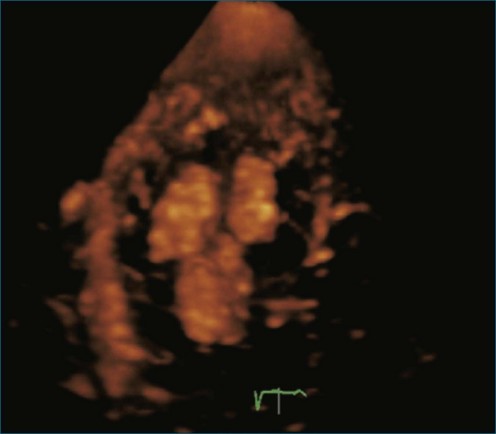
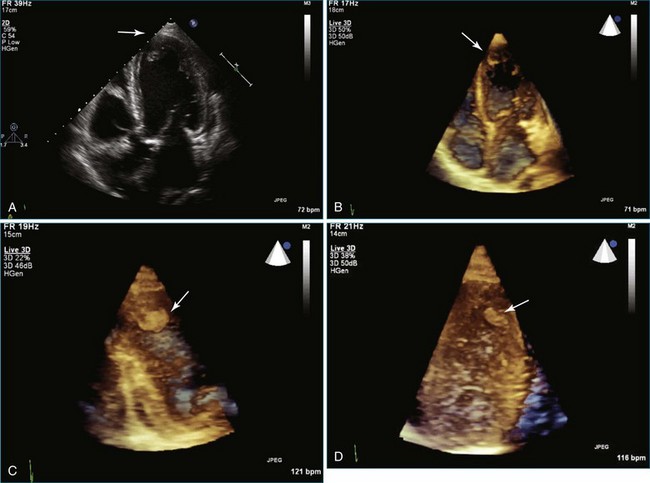
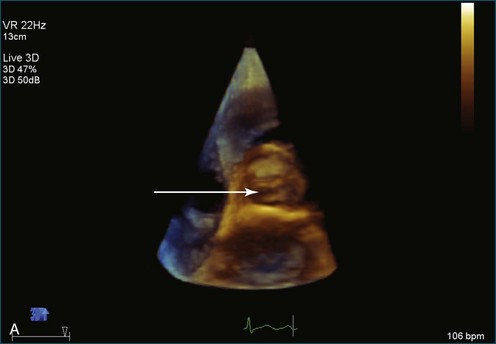
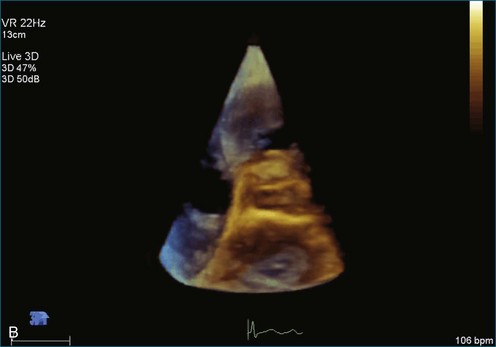
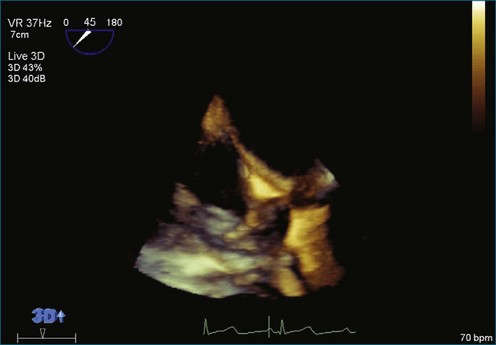
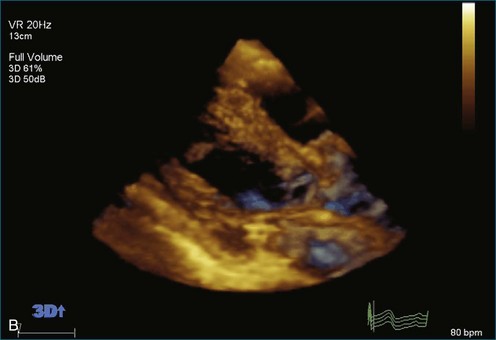
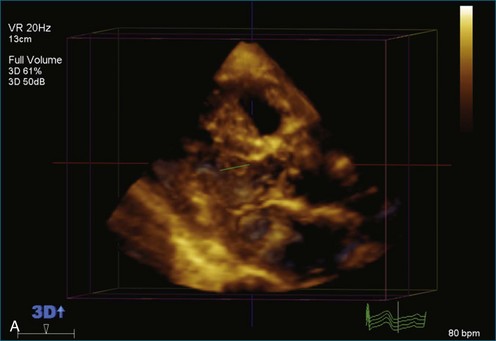
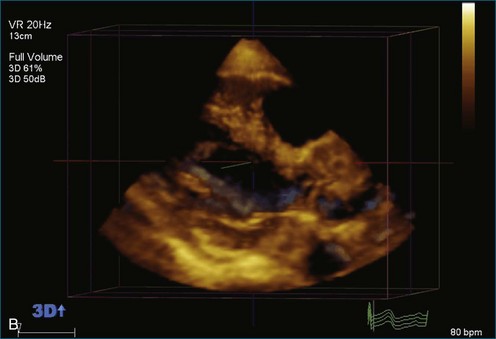
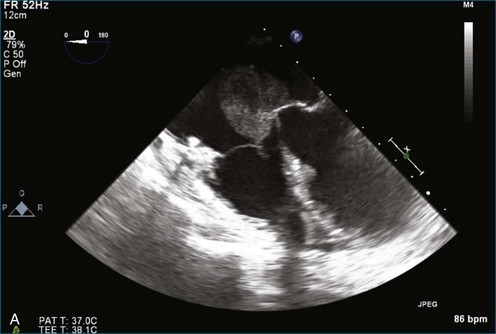
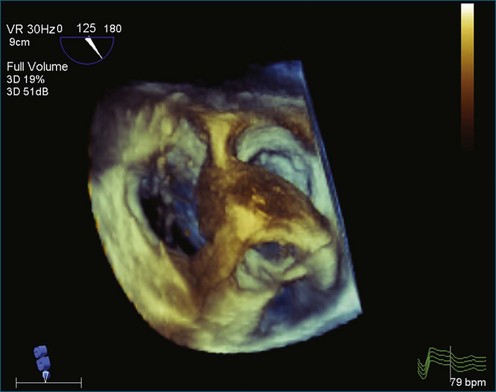
As mentioned, myxomas are the most common primary cardiac tumors (Figures 16-1 to 16-3; Videos 16-1 to 16-6). 3D imaging of atrial myxomas has been reported by transthoracic and transesophageal methods. The main benefits of 3DE over 2DE for myxomas are (1) identification of the stalk of the tumor and (2) evaluation of the heterogeneity of the mass. In fact, both characteristics often are seen with 2DE. The first case of imaging a right atrial myxoma by RT3DTEE was reported by Scohy et al (Figure 16-4).5 At the time of surgical excision, it was noted that the size of the mass correlated extremely well with the estimate by RT3DTEE. In fact, the volume of 6.4 mL was the same as shown by 3DTEE and by ex vivo measurement. Butz et al6 also measured a left atrial myxoma preoperatively by using 3DTEE and determined excellent correlation with the excised mass at the time of surgery. In another case study, a right ventricular and tricuspid valve myxoma was identified by 2DTTE; it measured 5.5 × 3.8 cm but was remarkably larger as shown by 3DTTE (12 × 6 cm). 3DTTE improved the visualization of the special relationship with surrounding structures and identified the involvement of the tricuspid valve, which was not appreciated by 2DTTE (Figure 16-5).7 Two cases of giant myxoma resulting in significant mitral valve obstruction were described by Culp et al.8 RT3DTEE volume measurement coordinated well with the ex vivo measurement. 2DTEE underestimated the volume (Figure 16-6).
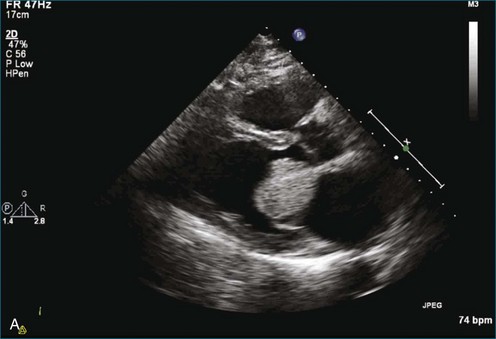
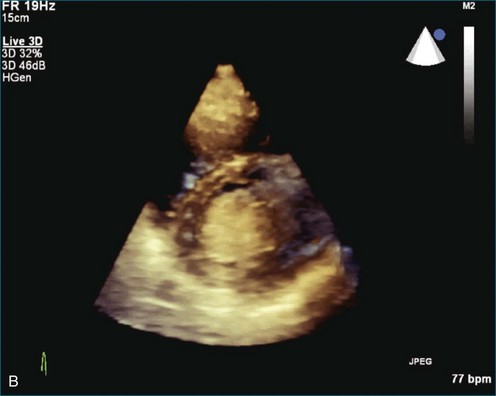
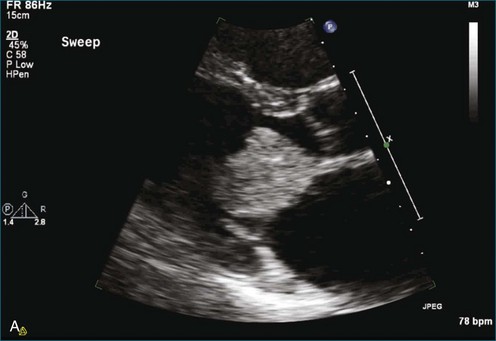
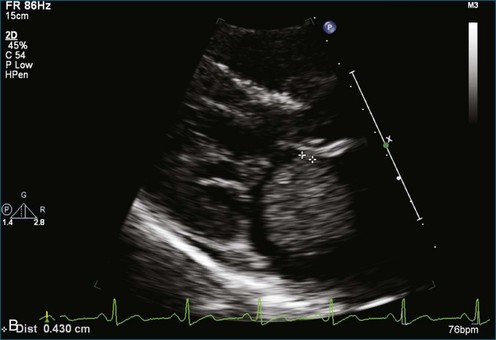
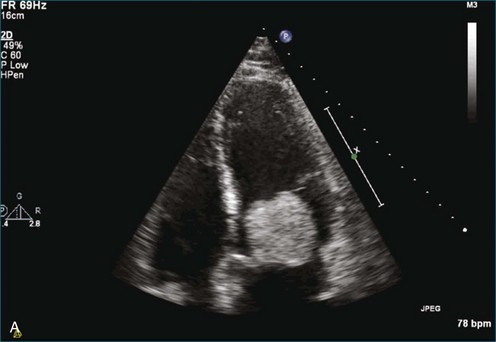
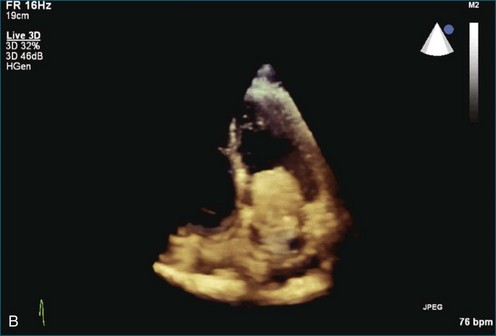
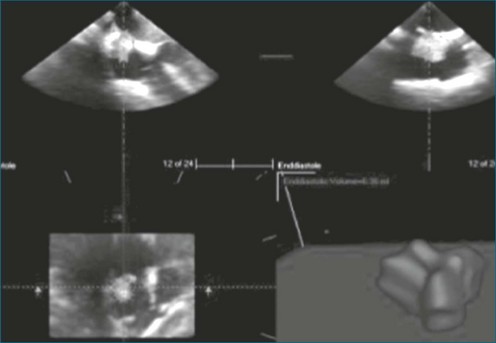
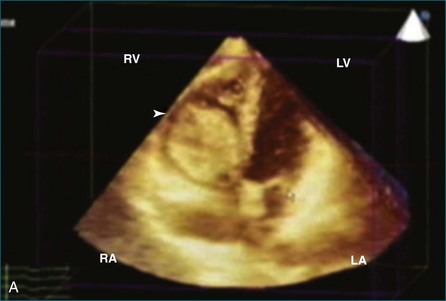
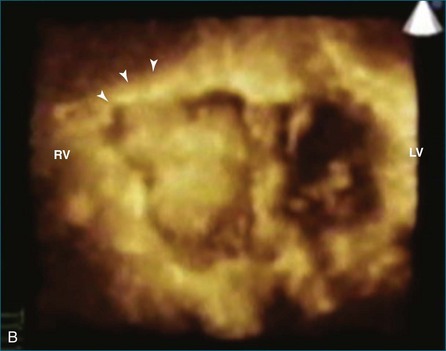
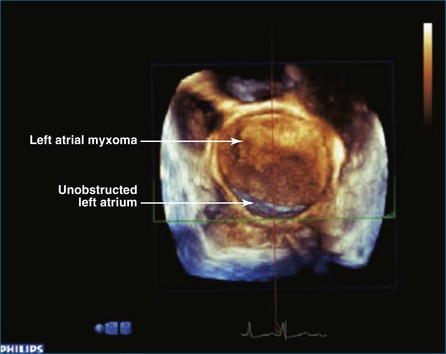
Figure 16-6 A giant myxoma of the left atrium causing obstruction of the mitral orifice.
(From Culp WC Jr, Ball TR, Armstrong CS, et al: Three-dimensional transesophageal echocardiographic imaging and volumetry of giant left atrial myxomas. J Cardiothorac Vasc Anesth 23:66–68, 2009.)
Prior to these publications, incremental value for the characterization of internal composition of masses and volume calculation had been appreciated with RT3DTTE imaging for myxomas and a hemangioma. In this small series, four left atrial tumors, including three myxomas and one hemangioma, were imaged by RT3D and correlated with histopathology specimens. Echolucencies suggestive of intramass hemorrhage were more frequently seen with 3D imaging compared with 2DE. In addition, 3DTTE detected more extensive and closely packed echolucencies involving the whole extent of the tumor in the hemangioma compared with more scattered echolucencies in myxomas (Figure 16-7).9
Fibroma
Fibroma is a congenital neoplasm that usually affects children. A right ventricular fibroma was diagnosed by 2DTTE in a patient with previous incomplete resection of the same. The fibroma (Figure 16-8) was dramatically larger (9.0 × 2.8 cm) by RT3DTTE compared with 2DE (2.6 × 2.7 cm).7 A left atrial fibroma (Figure 16-9) was associated with Gardner syndrome.10
Papillary Fibroelastoma
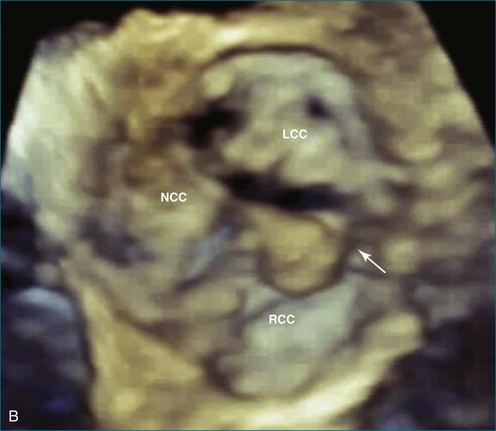
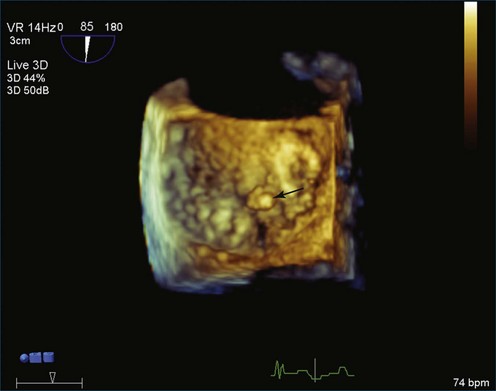
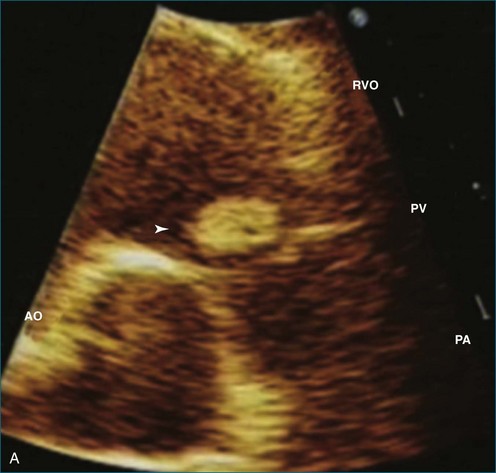
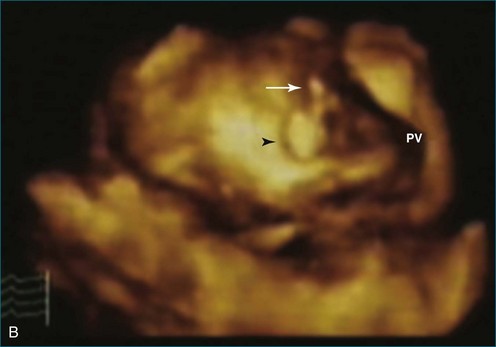
Papillary fibroelastoma is the third most common tumor of the heart, with an incidence of 0.33% among autopsy series.11 It is the most common tumor of the heart valves and is most frequently identified on the aortic valve (Figure 16-10), although all valves have been described (Figure 16-11; Video 16-7). The value of RT3DTTE was illustrated in a case presented by Singh and colleagues12 with a papillary fibroelastoma of the pulmonary valve. RT3DTTE pinpointed the attachment point, which was helpful in planning valve-sparing surgery. Also, 3D cropping through multiple orthogonal planes revealed frondlike projections and no echolucencies, which helped differentiate the mass from a myxoma or thrombus (Figure 16-12). Le Tourneau and associates13 studied seven consecutive patients with this lesion who had surgical resection of the lesion and found feasibility of imaging the mass to be 100%. Correlation of the 3D volume size with the actual resected tumor was very good. They believed RT3DTTE helped with surgical planning in three of the seven patients; surgical planning is key when valve-sparing surgery is planned. Most of the lesions (five of seven) were on the aortic valve.13
Sarcomas
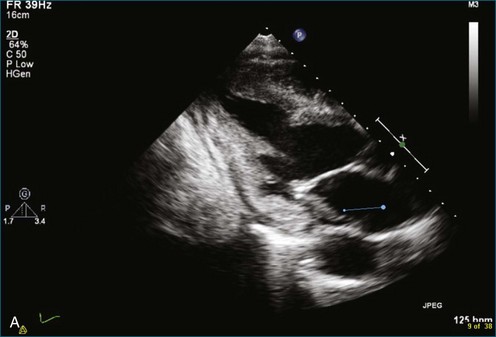
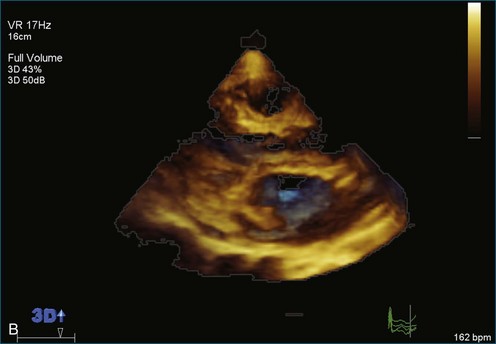
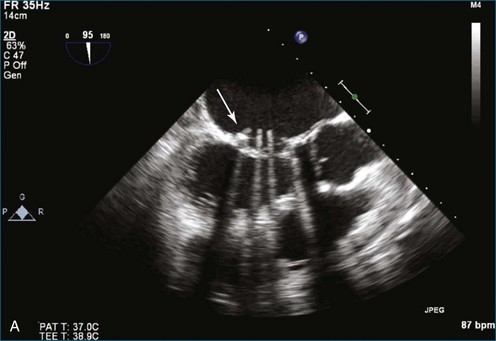
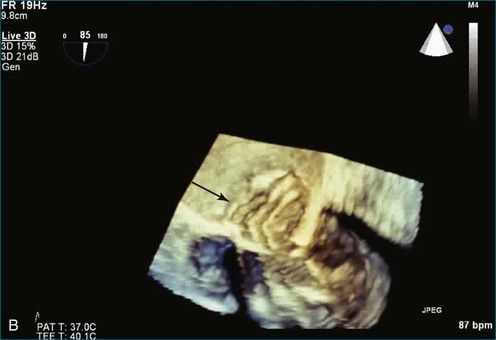
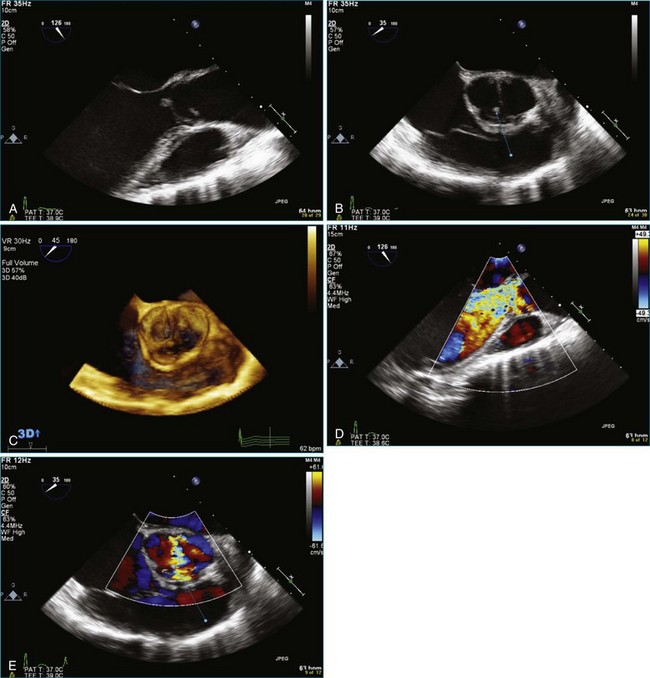
Sarcomas are quite rare primary tumors of the heart but are, in fact, the most common type of primary malignant cardiac tumor, at least in the adult population. Angiosarcoma is the most common among cardiac sarcomas and typically arises in the right atrium, often adjacent to the inferior or superior vena cava. These tumors often are large and aggressive, sometimes occupying much of the right atrium (Figures 16-13 to 16-16; Videos 16-8 to 16-10). Suwanjutah et al14 described a case of leiomyosarcoma imaged by RT3DTTE (Figure 16-17). The notable incremental value of RT3DTTE was the composition of the mass. RT3DTTE, again, thanks to its cropping capability, allowed imaging of an area of echolucency, suggesting necrosis or hemorrhage surrounded by bandlike structures consistent with collagen. This image created a “donut” appearance. Excision and evaluation of the resultant histopathology revealed the same pattern of necrosis and vascular channels within the fibrotic tumor. The morphology seen in this case of the tumor by RT3DTTE was suggestive of tumor as opposed to a thrombus. Just as important, the size of the mass by RT3DTTE was significantly larger than when measured by 2DTTE.
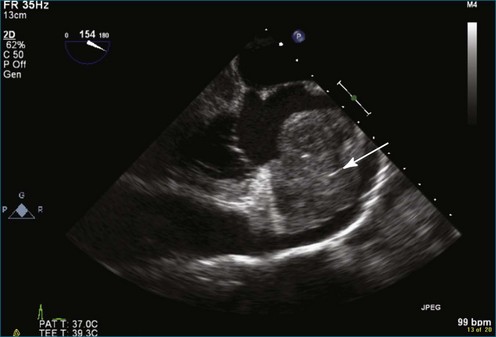
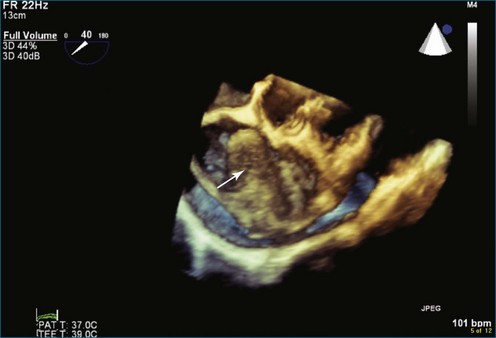
Figure 16-14 Three-dimensional transesophageal echocardiography of a right atrial angiosarcoma (arrow).
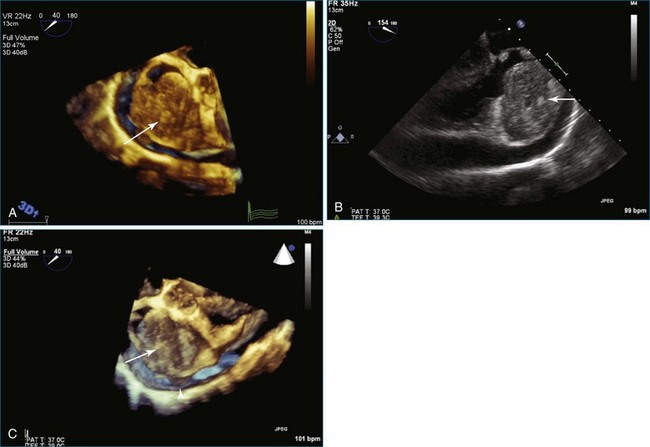
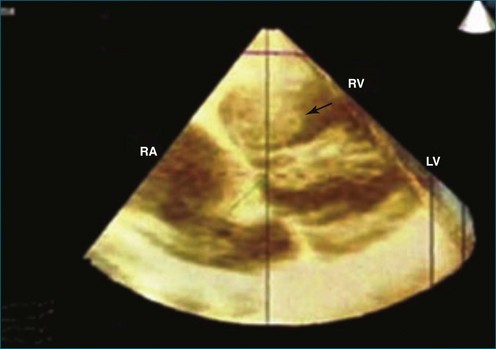
Figure 16-16 Right ventricular sarcoma (arrow). LV, left ventricle; RA, right atrium; RV, right ventricle.
(From Reddy VK, Faulkner M, Bandarupalli N, et al: Incremental value of live/real time three-dimensional transthoracic echocardiography in the assessment of right ventricular masses. Echocardiography 26:598–609, 2009.)
Lymphomas
Lymphomas represent 5% of primary cardiac malignancies, although diagnosis is not commonly made during life due to nonspecific presenting symptoms. A case of non-Hodgkin lymphoma in the right atrium that presented as atrial fibrillation was described and imaged by RT3DTTE. Follow-up imaging was useful for chemotherapy cleanup and showed marked shrinkage of the mass.15
Carcinoid Syndrome
Cardiac involvement occurs in more than 50% of patients with carcinoid syndrome. The right-sided heart valves are characteristically involved, with the tricuspid valve particularly affected. As previously mentioned, the pulmonary valve is particularly challenging to image by echocardiography. In a series of cases reported by Nalawadi and colleagues16 in three patients who were diagnosed with cardiac carcinoid, RT3DTEE performed well when determining involvement of the tricuspid and pulmonary valves (Figure 16-18). There was particular incremental value for viewing the tricuspid valve en face, particularly by RT3DTTE, which demonstrated a fixed, open-orifice tricuspid valve with severe tricuspid regurgitation. The pulmonary valve was seen well in only one of the four cases, and notable RT3DTEE findings were not visible in the images provided. However, the authors state that “RT3D was particularly helpful in showing carcinoid involvement of the pulmonic valve with thickening, retraction, and distortion, as well as, if present, identifying a mass on the valve.” Our own experience with RT3DTEE in carcinoid syndrome has been limited, but it is clear that the aortic arch view of the pulmonary valve would be useful in this setting (see Chapter 10).
Rarer Metastatic Tumors
A case of renal cell carcinoma metastatic to the inferior vena cava was imaged by the RT3DTEE probe. The significant incremental value over 2D image was in the en face view, which showed the tumor adherent to the os of the inferior vena cava–right atrial junction. RT3DTEE provided an en face view of the tumor that was causing intermittent obstruction of the inferior vena cava.17
Chordomas and melanomas are relatively rare tumors, but melanoma has a known unique propensity to localize to the heart.1 Conversely, chordoma rarely metastasizes to the heart. Despite these paradoxic facts, both melanoma and chordoma metastatic to the right atrium and right ventricle, respectively, have been identified and imaged by RT3DTEE (Figure 16-19).18,19 In one report, the chordoma volume by 3DE (45 mL) correlated well with the excised volume of 40 mL. Echodense areas by 3DE correlated with fibrotic areas of the tumor and echolucencies likewise correlated with areas of necrosis.19
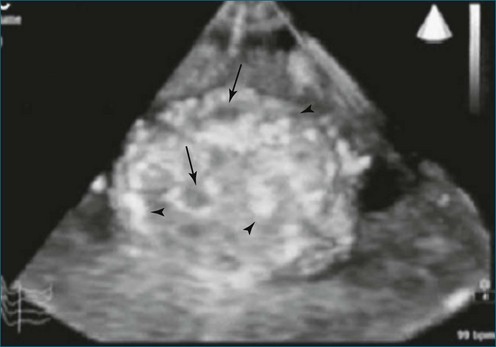
Figure 16-19 Chordoma. Arrows represent hemorrhage and/or cystic areas. Arrowheads represent fibrous bands.
(From Pothineni KR, Nanda NC, Burri MV, et al: Live/real time three-dimensional transthoracic echocardiographic description of chordoma metastatic to the heart. Echocardiography 25:440–442, 2008.)
Cardiomyopathy or Noncompaction
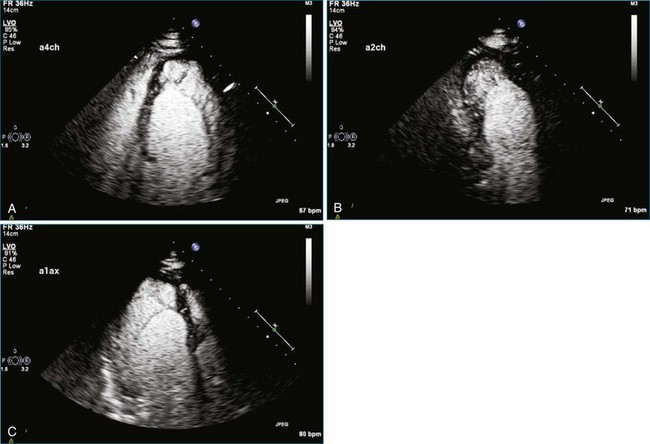
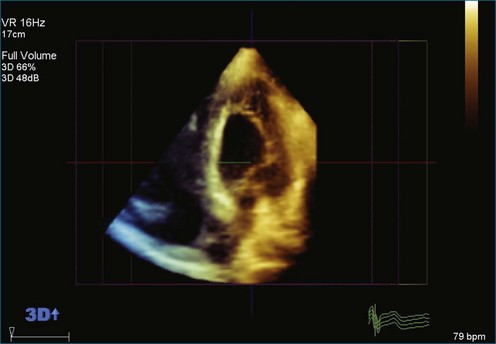
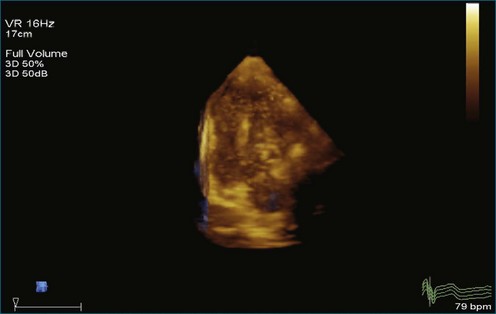
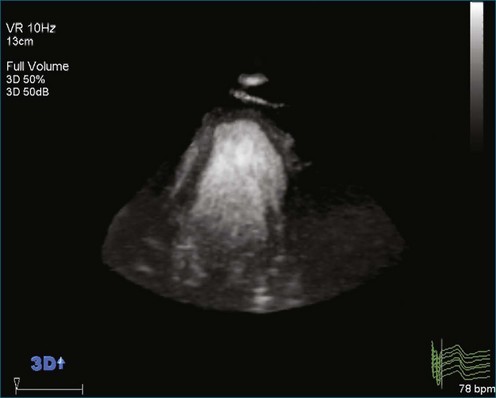
In a series by Reddy and associates,7 three cases of right ventricular noncompaction were identified. RT3DTTE was believed to have incremental value in that the certainty of noncompaction was increased by identifying the lack of expansion of the muscle at the right ventricular apex. In another case described by Nemes et al,20 2DTTE diagnosed left ventricular noncompaction with a reduced ejection fraction of 38%, but only the addition of RT3DTTE yielded the diagnosis of right ventricular noncompaction. The additional benefits derived from using 3DE in addition to 2D imaging to assess for noncompaction syndrome also were described by Rajdev and associates.21 In their substantial review of 21 patients with left ventricular noncompaction syndrome, 2DTTE underestimated left ventricular trabecular mass and total number of trabeculations compared with RT3DTTE.21 Noncompaction images by standard 2D imaging and RT3D imaging, with and without contrast, are shown in Figures 16-20 to 16-24 (Videos 16-11 to 16-20). The combination of 3D imaging and contrast enhancement helped determine the length of the noncompaction; that is, the length of the sinusoids, a key point in differentiating noncompaction from more commonly encountered marked trabeculations. The ratio of the thickness of the myocardium to the thickness of the trabeculations must be less than 0.5 to be consistent with noncompaction.22 The number of sinusoids has been cited by some investigators as also being important.
Thrombi
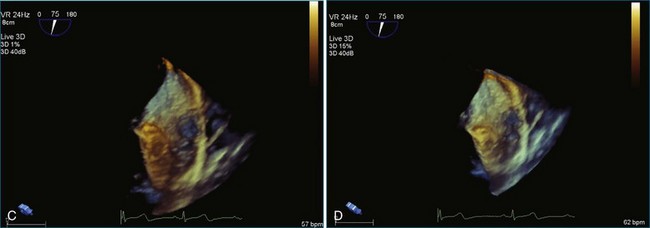
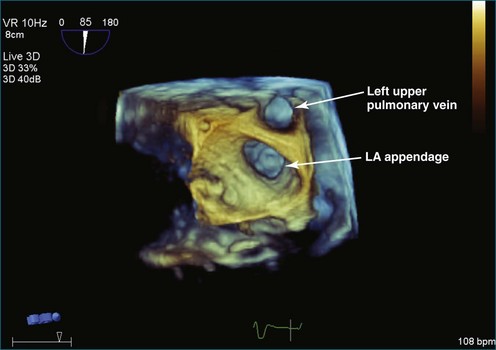
Atrial thrombi commonly are encountered; the main challenge they present is differentiation from other intracardiac masses, such as myxomas. RT3DE frequently can pinpoint attachment points; thrombi are rarely attached to the interatrial septum, whereas atrial myxomas frequently are. In addition, 3DE, particularly RT3DTEE, occasionally identifies left atrial appendage thrombi not seen by 2DTEE. An even greater benefit to RT3DTEE with regard to left atrial appendage thrombi is its ability to exclude thrombi that are “suspected” by 2DTEE. The advantage RT3DTEE provides left atrial appendage analysis lies in its ability to differentiate the normal trabeculations of the “rough” area of the appendage from thrombi. This is accomplished by the combination of X-plane 2D imaging, which allows simultaneous orthogonal views of multiple 2D planes, as well as real-time 3D imaging (Figures 16-25 to 16-28; Videos 16-21 to 16-26) The advantages of the RT3DTEE imaging are the ability to see the opening of the appendage en face and the ability to crop the appendage from the opening into the left atrium all the way to the apex (Figure 16-29). The adjacent structure, the left upper pulmonary vein, is a useful landmark for probe orientation.
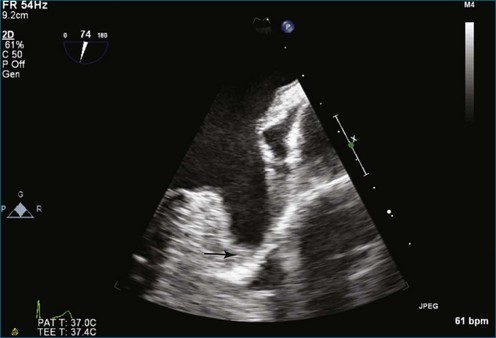
Figure 16-25 Suspected thrombus by two-dimensional transesophageal echocardiography (arrow). In what turned out to be left atrial appendage trabeculations (see Figure 16-26), in this view the findings in the left atrial appendage could easily be diagnosed as thrombus (see Video 16-21).
Thrombi within the left ventricle have been imaged and described by 3DTTE.23 The 3D approach allowed the thrombus to be easily viewed from the lateral projection, helped identify the site of attachment, and, by cropping the 3D images, identified the degree and extent of lysis within the thrombus (large echo void within the mass consistent with thrombus lysis). The identification of lysis within the thrombi suggests efficacy of the anticoagulation regimen. The identification of left ventricular thrombus lysis was described by Sinha and associates23 in a patient with postpartum cardiomyopathy. Thrombus was observed by 2DTTE, but only RT3DTTE showed large echolucent areas consistent with lysis within the thrombi (Figures 16-30 and 16-31).
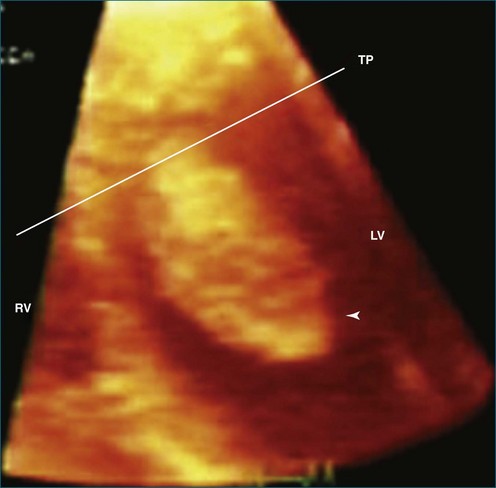
Figure 16-30 Thrombi with echolucent areas consistent with lysis. LV, left ventricle; RV, right ventricle; TP, transverse plane.
(From Sinha A, Nanda NC, Khanna D, et al: Morphological assessment of left ventricular thrombus by live three-dimensional transthoracic echocardiography. Echocardiography 21:649–655, 2004.)
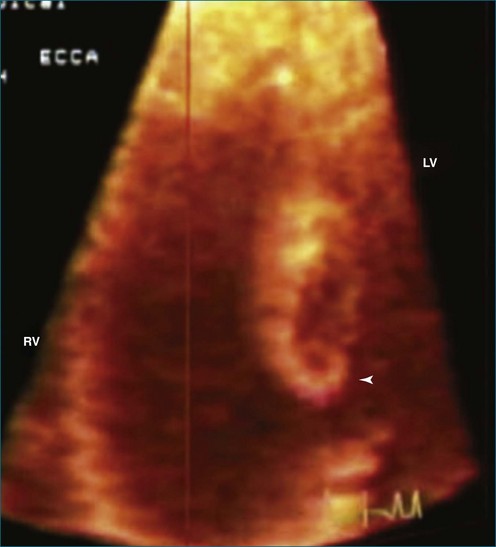
Figure 16-31 Thrombi with echolucent areas consistent with lysis (arrowhead). LV, left ventricle; RV, right ventricle.
In a study by Anwar and colleagues,24 RT3DE was found to be superior to 2DE for the assessment of thrombus mobility, differentiation between thrombus and myocardium, and delineation of changes in thrombi structure and volume. The sensitivity of RT3DE in finding thrombi was greater than 90%, and the specificity was greater than 85%. Moreover, RT3DE allowed better visualization of left atrial appendage thrombi (78% vs. 33% by 2DE). In another case study, a thrombus was visualized in the right ventricle by 3DE but not by 2DE (Figure 16-32).25 Three thrombi in the apex in a patient with cardiomyopathy are well visualized in a case described by Lo et al (Figure 16-33).26 Additional examples of apical thrombi are shown in Figures 16-34 and 16-36 (Videos 16-27 to 16-30).
Vegetations
Next to evaluation of left ventricular systolic function, the evaluation of vegetations resulting from infectious endocarditis is arguably the most useful application of 3DE. A series of patients with aortic valve vegetations is shown as well as a case with a hole, or “rent,” in the aortic valve (Figures 16-37 to 16-43; Videos 16-31 to 16-38). The size and extent of valvular vegetations have consistently measured larger by all methods of RT3DE compared with 2DE. In addition to the size, RT3DE helps visualize intricacies of the shape and mobility of vegetations. Accurate vegetation size assessment is clinically relevant because surgical indications can change depending on vegetation size alone. RT3DTEE has been particularly useful for the characterization of complications of endocarditis, such as abscess cavity formation and valve destruction. Our experience supports the detection of abscess with RT3DTEE. A study by Liu and associates,27 which enrolled 46 patients with endocarditis, compared 2DTTE with RT3DTTE. The sensitivity for detection of endocarditis was very similar (92%), but the specificity of RT3DTTE was superior (88% vs. 100%). In this study, a mobile “nodule” visualized in RT3DE was found to be the most accurate finding for diagnosis of infective endocarditis. A smaller study (13 patients) compared 2DTEE to RT3DTEE and found incremental value in RT3DTEE in terms of more accurate sizing of vegetations, the ability to measure volumes, the ability to discover echolucencies within myocardial masses, and improved detection of abscess cavity.28 The main difference was the ability to visualize the valve leaflets en face and determine the number of mitral valve scallops as well as chordae tendinae involved in the process. The en face visualization also allowed the determination of leaflet perforation as well as measurement of the area of the valve leaflet affected by the endocarditic process.
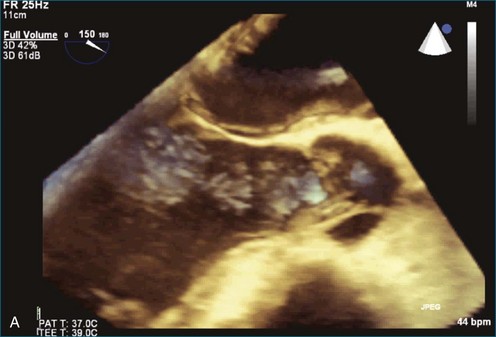
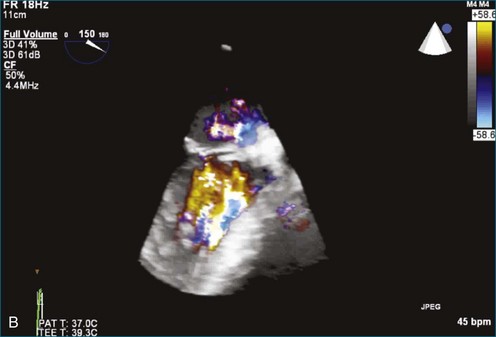
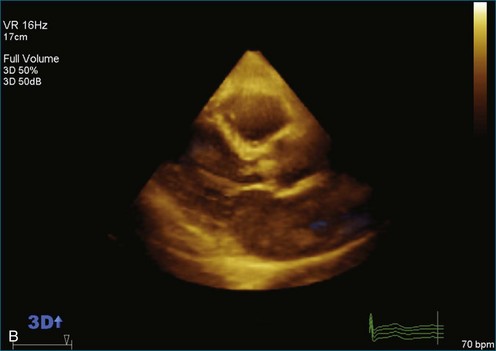
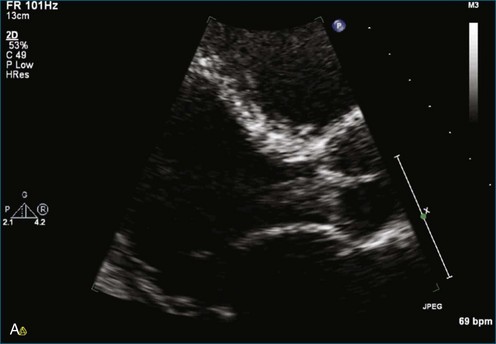
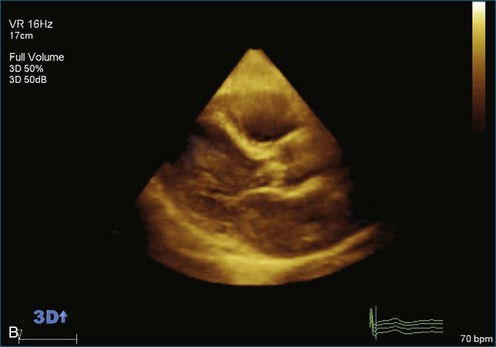
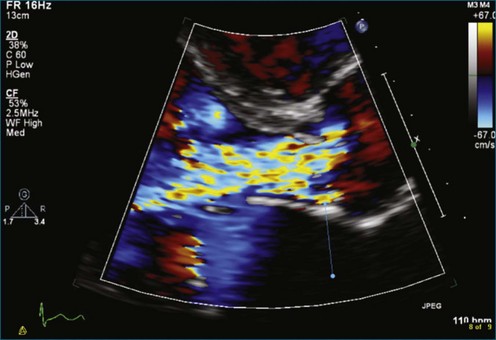
Figure 16-40 Severe aortic valve regurgitation from endocarditis and associated destruction of the valve.
Masses Associated with Devices
Pacemaker and implantable cardioverter defibrillator (ICD) infections are increasing at an alarming rate and, when present, frequently present a management challenge.29,30 Paley and colleagues31 described an infectious vegetation associated with a defibrillator wire. It could not be discerned by 2DTEE whether the mass was attached to the wire. However, with RT3DTEE, it was very clear that the vegetation was attached to the defibrillator wire. Others have described similar evaluation of pacemaker-related vegetations by RT3DTTE.32 In a case report by Naqvi and associates33 that included two patients, RT3DE was particularly helpful in differentiating vegetations arising from ICD leads and those arising from the valve itself. In one of the patients with tricuspid annuloplasty ring, it was unclear by 2DE if the vegetation was arising from the tricuspid annuloplasty ring or from the ICD lead, but RT3DE was able to demonstrate that the vegetation was only attaching to the ICD lead. On the basis of this information, the patient only underwent ICD wire removal, after which repeat imaging revealed no residual vegetations. Figures 16-42 and 16-43 (see Videos 16-36 to 16-38) show two examples of masses, in this case vegetations, associated with pacemaker wires. In the first case, the vegetation is attached to the pacemaker wire. In the second case, the vegetation is completely separate from the pacemaker wire; RT3DTEE was instrumental in making that distinction.
Normal Variants
Classic normal variants that frequently arise on 2DE include structures such as a Chiari network, a prominent eustachian valve, Lambl’s excrescence, the ligament of Marshall (also known as the “warfarin ridge,” the tissue separating the left atrial appendage from the left upper pulmonary vein), and false chords or tendons with either the right or left ventricle. RT3DTTE and RT3DTEE have helped visualize all these normal variants better than traditional 2DTTE and 2DTEE. An example is the false tendon frequently seen in the left ventricle. Figure 16-44 (Video 16-39) illustrates a 3D image of a false tendon as well as a case of a prominent and mobile chorda tendinae. Although the variant is clear by either modality, the 3D image allows visualization of the depth of the tendon and its relationship to the back wall of the ventricle. Imaging a prominent crista terminalis and eustachian ridge of the right atrium with RT3DTTE has been described; the authors advocated imaging with the ventricle foreshortened by angling the transducer posteriorly in the apical four-chamber view.34
Calcification of the mitral valve, the aortic valve, or both is common in older patients. Differentiating between calcification and tumor or vegetation occasionally can be challenging. RT3DE has been used to aid in this differentiation and thus avoid unnecessary surgical procedures. A case of caseous mitral annular calcification was described by Assudani and colleagues.35 RT3DE demonstrated characteristics similar to those of the pathologic specimen that was surgically excised (Figure 16-45). These characteristics included echogenic bandlike areas surrounded by a well-defined, highly echogenic border. Figure 16-46 (Videos 16-40 and 16-41) shows an example of mitral annular calcification imaged by 2DE and RT3DTTE. Once again, the 3D image provides depth and improves the perspective of the size of the mass. Figure 16-47 (Video 16-42) shows an example of cropping through the 3D dataset. In this case, slight azimuthal movement into the dataset, moving toward the back wall of the left atrium, shows that the mass is no longer seen; hence the thickness of the mitral annular calcification is appreciated.
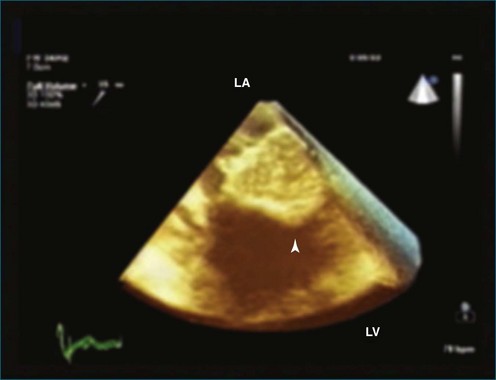
Figure 16-45 Mitral annular calcification (arrowhead). LA, left atrium; LV, left ventricle.
(From Assudanni J, Singh B, Samar A, et al: Live/real time three-dimensional transesophageal echocardiographic findings in caseous mitral annular calcification. Echocardiography 27:1147–1150, 2010.)
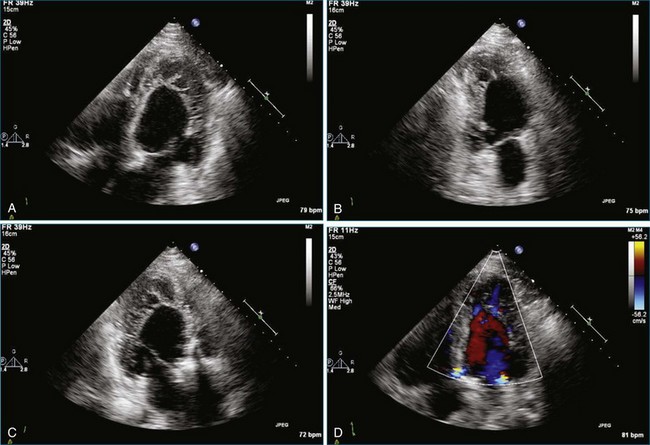
Case 1
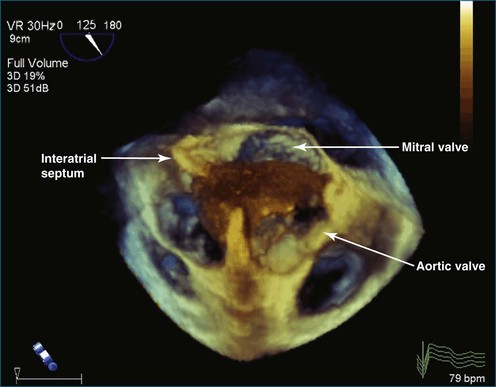
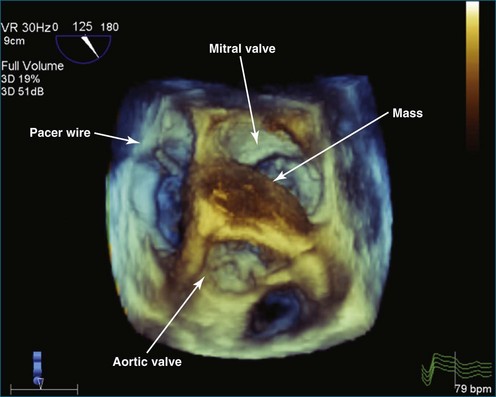
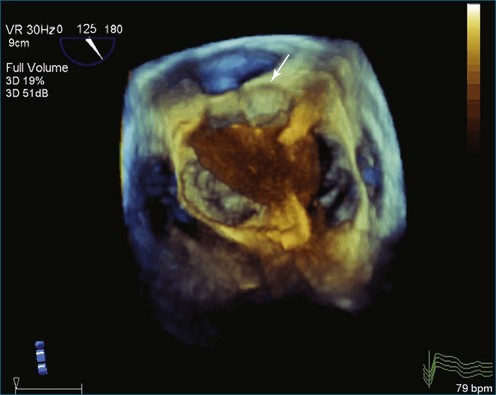
A 55-year-old woman presented to the emergency department with dizziness and near-syncope. Electrocardiography performed immediately revealed sinus rhythm with complete heart block. A temporary transvenous pacer was placed. The patient had no known history of heart disease. TTE revealed a mass in the left atrium. TEE revealed that the mass was much more extensive and infiltrated both the interatrial and interventricular septa and was present in both atria and in the left ventricular outflow tract. Initial presumed diagnosis was a cardiac tumor (Figures 16-48 to 16-52; Videos 16-43 to 16-46). It was believed that surgery would be used for diagnosis only and that removal or debulking would not be possible. A permanent DDD pacemaker was placed. After pacemaker placement, a percutaneous biopsy revealed that the tissue was granulomatous and an inflammatory mass, not a tumor. The patient had a history of exposure to tuberculosis and had additional immunologic evidence based on interferon gamma release assay. However, chest radiograph and CT of the chest were not suggestive of pulmonary tuberculosis. Because of the strong suspicion that the mass could be a tuberculoma, the patient was treated for approximately 1 month with four tuberculosis drugs. The patient could not tolerate this treatment, however, and it was stopped. Anti-myeloperoxidase titers, initially positive at 2.0, increased to 7.5. In addition, antineutrophilic cytoplasmic antibody test results, initially negative, became positive at 1 : 64. Hence the diagnosis of Wegner’s granulomatosis was serologically confirmed.
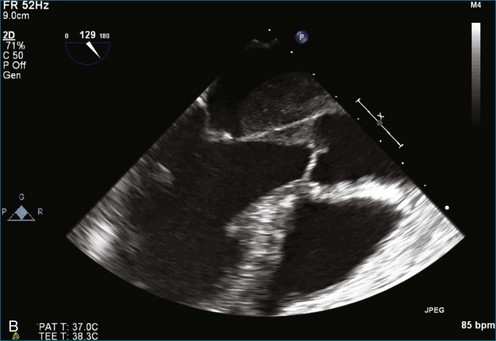
Case 2
A 45-year-old woman was admitted with an acute left middle cerebral artery cerebrovascular accident. The patient had a history of rheumatic heart disease with mitral valve replacement. She had stopped taking warfarin. An initial 2DTEE showed a thrombus in the left atrial appendage as well as a mass, likely a thrombus, associated with the posterior leaflet of the prosthetic mitral valve (Figure 16-53; Videos 16-47 and 16-48). RT3DTEE allowed visualization of the entire valve en face. In addition, RT3DTEE enhanced visualization of the thrombus associated with the mitral valve and, more importantly, showed that it was more than twice as large as was appreciated by 2DTEE.
Case 3
A 43-year-old man with a known history of a bicuspid aortic valve presented for follow-up echocardiogram 3 years after his last echocardiogram. At the time of his previous echocardiogram he had only mild aortic regurgitation with upper normal ventricular size. At that time, he had been admitted with methicillin-resistant Staphylococcus aureus bacteremia. Despite having no discrete vegetation on his bicuspid aortic valve, he met the Duke criteria for endocarditis and was treated with a prolonged course of vancomycin. Surprisingly, 2DTTE and RT3DTTE images on the current presentation showed severe aortic regurgitation and a mass on the right coronary cusp of the aortic valve. 3DTEE was therefore ordered and performed. This confirmed the mass and its presence on the anterior cusp of the bicuspid aortic valve, anatomically where the right coronary cusp should be located. The mass on the right coronary cusp of the valve was consistent either with vegetation or prolapse of the valve leaflet caused by previous endocarditis or chronic degeneration of the valve. With RT3DTEE, the mass was recognized as a more discrete nodule, as opposed to being less clear by 2DTEE and suggestive of an undulating mass consistent with a vegetation (Figure 16-54; Videos 16-49 to 16-53). An infectious workup, however, was unrevealing, with no growth from blood cultures, no fever, and no elevated white blood cell count. It was therefore apparent that the patient did not have recurrent endocarditis. In this case, the RT3DTEE was clear in terms of identifying a discrete, nodular mass that appeared more chronic rather than acute. The mass appeared more diffuse and mobile by 2DTEE.
1 Burke A, Virmani R. Tumors of the heart and other great vessels. In: Atlas of tumor pathology. Washington, DC: Armed Forces Institute of Pathology; 1996.
2 Best AK, Dobson RL, Ahmad AR. Best cases from the AFIP: Cardiac angiosarcoma. Radiographics. 2003;23:S141–S145.
3 Grebenc ML, Rosado de Christenson ML, Burke AP, et al. Primary cardiac and pericardial neoplasms: Radiologic-pathologic correlation. Radiographics. 2000;20:1073–1103.
4 Abraham KP, Reddy V, Gattuso P. Neoplasms metastatic to the heart: Review of 3314 consecutive autopsies. Am J Cardiovasc Pathol. 1990;3:195–198.
5 Scohy TV, Lecomte PV, McGhie J, et al. Intraoperative real time three-dimensional transesophageal echocardiographic evaluation of right atrial tumor. Echocardiography. 2008;25:646–649.
6 Butz T, Scholtz W, Korfer J, et al. Prolapsing left atrial myxoma: Preoperative diagnosis using a multimodal imaging approach with magnetic resonance imaging and real-time three-dimensional echocardiography. Eur J Echocardiogr. 2008;9:430–432.
7 Reddy VK, Faulkner M, Bandarupalli N, et al. Incremental value of live/real time three-dimensional transthoracic echocardiography in the assessment of right ventricular masses. Echocardiography. 2009;26:598–609.
8 Culp WC, Jr., Ball TR, Armstrong CS, et al. Three-dimensional transesophageal echocardiographic imaging and volumetry of giant left atrial myxomas. J Cardiothorac Vasc Anesth. 2009;23:66–68.
9 Mehmood F, Nanda NC, Vengala S, et al. Live three-dimensional transthoracic echocardiographic assessment of left atrial tumors. Echocardiography. 2005;22:137–143.
10 Yang HS, Arabia FA, Chaliki HP, et al. Images in cardiovascular medicine. Left atrial fibroma in Gardner syndrome: Real-time 3-dimensional transesophageal echo imaging. Circulation. 2008;118:e692–e696.
11 Howard RA, Aldea GS, Shapira OM, et al. Papillary fibroelastoma: Increasing recognition of a surgical disease. Ann Thorac Surg. 1999;68:1881–1885.
12 Singh A, Miller AP, Nanda NC, et al. Papillary fibroelastoma of the pulmonary valve: Assessment by live/real time three-dimensional transthoracic echocardiography. Echocardiography. 2006;23:880–883.
13 Le Tourneau T, Polge AS, Gautier C, Deklunder G. Three-dimensional echography: cardiovascular applications. J Radiol. 2006;87:1993–2004.
14 Suwanjutah T, Singh H, Plaisance BR, et al. Live/real time three-dimensional transthoracic echocardiographic findings in primary left atrial leiomyosarcoma. Echocardiography. 2008;25:337–339.
15 Trifunovic D, Vujisic-Tesic B, Vuckovic M, et al. Multimodality imaging in the assessment of cardiac lymphoma presented as new-onset atrial fibrillation. Echocardiography. 2010;27:332–336.
16 Nalawadi SS, Siegel RJ, Wolin E, et al. Morphologic features of carcinoid heart disease as assessed by three-dimensional transesophageal echocardiography. Echocardiography. 2010;27:1098–1105.
17 Lokhandwala J, Liu Z, Jundi M, et al. Three-dimensional echocardiography of intracardiac masses. Echocardiography. 2004;21:159–163.
18 Chong JJ, Richards DA, Chard R, et al. Two-dimensional and three-dimensional transthoracic echocardiography in surgical planning for right atrial metastatic melanoma. Eur J Echocardiogr. 2008;9:286–288.
19 Pothineni KR, Nanda NC, Burri MV, et al. Live/real time three-dimensional transthoracic echocardiographic description of chordoma metastatic to the heart. Echocardiography. 2008;25:440–442.
20 Nemes A, Caliskan K, Soliman OI, et al. Diagnosis of biventricular non-compaction cardiomyopathy by real-time three-dimensional echocardiography. Eur J Echocardiogr. 2009;10:356–357.
21 Rajdev S, Singh A, Nanda NC, et al. Comparison of two- and three-dimensional transthoracic echocardiography in the assessment of trabeculations and trabecular mass in left ventricular noncompaction. Echocardiography. 2007;24:760–767.
22 Chin TK, Perloff JK, Williams RG, et al. Isolated noncompaction of left ventricular myocardium. A study of eight cases. Circulation. 1990;82:507–513.
23 Sinha A, Nanda NC, Khanna D, et al. Morphological assessment of left ventricular thrombus by live three-dimensional transthoracic echocardiography. Echocardiography. 2004;21:649–655.
24 Anwar AM, Nosir YF, Ajam A, Chamsi-Pasha H. Central role of real-time three-dimensional echocardiography in the assessment of intracardiac thrombi. Int J Cardiovasc Imag. 2010;26:519–526.
25 Wertman BM, Goland S, Davidson RM, Siegel RJ. Right atrial and ventricular masses of unknown origin. J Am Soc Echocardiogr. 2008;21:776. e5–e7
26 Lo CI, Chang SH, Hung CL. Demonstration of left ventricular thrombi with real-time 3-dimensional echocardiography in a patient with cardiomyopathy. J Am Soc Echocardiogr. 2007;20:905. e9–e13
27 Liu YW, Tsai WC, Lin CC, et al. Usefulness of real-time three-dimensional echocardiography for diagnosis of infective endocarditis. Scand Cardiovasc J. 2009;43:318–323.
28 Hansalia S, Biswas M, Dutta R, et al. The value of live/real time three-dimensional transesophageal echocardiography in the assessment of valvular vegetations. Echocardiography. 2009;26:1264–1273.
29 Cabell CH, Heidenreich PA, Chu VH, et al. Increasing rates of cardiac device infections among Medicare beneficiaries: 1990–1999. Am Heart J. 2004;147:582–586.
30 Voigt A, Shalaby A, Saba S. Continued rise in rates of cardiovascular implantable electronic device infections in the United States: Temporal trends and causative insights. Pacing Clin Electrophysiol. 2010;33:414–419.
31 Paley AJ, Kronzon I. A defibrillator wire vegetation: the contribution of 3D real time transesophageal echocardiography. Echocardiography. 2008;25:1014–1015.
32 Pothineni KR, Nanda NC, Patel V, Madadi P. Live/real time three-dimensional transthoracic echocardiographic detection of vegetation on a pacemaker/defibrillator lead. Am J Geriatr Cardiol. 2006;15:62–63.
33 Naqvi TZ, Rafie R, Ghalichi M. Real-time 3D TEE for the diagnosis of right-sided endocarditis in patients with prosthetic devices. JACC Cardiovasc Imag. 2010;3:325–327.
34 McKay T, Thomas L. Prominent crista terminalis and Eustachian ridge in the right atrium: Two dimensional (2D) and three dimensional (3D) imaging. Eur J Echocardiogr. 2007;8:288–291.
35 Assudani J, Singh B, Samar A, et al. Live/real time three-dimensional transesophageal echocardiographic findings in caseous mitral annular calcification. Echocardiography. 2010;27:1147–1150.
[/level-membership-for-cardiovascular-category][not-level-membership-for-cardiovascular-category]
Chapter 16 Evaluation of Intracardiac Masses
General Benefits of Three-Dimensional Echocardiography Over Two-Dimensional Echocardiography
Tumors: Generalities
Primary tumors of the heart are extremely rare, with a reported prevalence of 0.001% to 0.03% by autopsy series.1 The most common primary cardiac tumor is the myxoma, even though myxoma is relatively uncommon. Myxomas are most common in the atria, particularly the left atrium. They often have a clear stalk attached to the interatrial septum and clearly visualized with 3DE. Myxomas typically are benign, but the most common primary malignant tumors are sarcomas, which are highly invasive and uniformly fatal tumors. Angiosarcoma is the most common of this group. Metastatic tumors to the heart are much more common than are primary tumors, with the most common being breast and lung tumors; the usual cardiac site of metastasis is the pericardium. In fact, secondary involvement of the heart by extracardiac tumors is 20 to 40 times more common compared with primary cardiac tumors.1–3 Melanoma is a tumor that has particular propensity to metastasize to the heart.4
Individual Tumors: Myxomas
As mentioned, myxomas are the most common primary cardiac tumors (Figures 16-1 to 16-3; Videos 16-1 to 16-6). 3D imaging of atrial myxomas has been reported by transthoracic and transesophageal methods. The main benefits of 3DE over 2DE for myxomas are (1) identification of the stalk of the tumor and (2) evaluation of the heterogeneity of the mass. In fact, both characteristics often are seen with 2DE. The first case of imaging a right atrial myxoma by RT3DTEE was reported by Scohy et al (Figure 16-4).5 At the time of surgical excision, it was noted that the size of the mass correlated extremely well with the estimate by RT3DTEE. In fact, the volume of 6.4 mL was the same as shown by 3DTEE and by ex vivo measurement. Butz et al6 also measured a left atrial myxoma preoperatively by using 3DTEE and determined excellent correlation with the excised mass at the time of surgery. In another case study, a right ventricular and tricuspid valve myxoma was identified by 2DTTE; it measured 5.5 × 3.8 cm but was remarkably larger as shown by 3DTTE (12 × 6 cm). 3DTTE improved the visualization of the special relationship with surrounding structures and identified the involvement of the tricuspid valve, which was not appreciated by 2DTTE (Figure 16-5).7 Two cases of giant myxoma resulting in significant mitral valve obstruction were described by Culp et al.8 RT3DTEE volume measurement coordinated well with the ex vivo measurement. 2DTEE underestimated the volume (Figure 16-6).
Figure 16-6 A giant myxoma of the left atrium causing obstruction of the mitral orifice.
(From Culp WC Jr, Ball TR, Armstrong CS, et al: Three-dimensional transesophageal echocardiographic imaging and volumetry of giant left atrial myxomas. J Cardiothorac Vasc Anesth 23:66–68, 2009.)
Prior to these publications, incremental value for the characterization of internal composition of masses and volume calculation had been appreciated with RT3DTTE imaging for myxomas and a hemangioma. In this small series, four left atrial tumors, including three myxomas and one hemangioma, were imaged by RT3D and correlated with histopathology specimens. Echolucencies suggestive of intramass hemorrhage were more frequently seen with 3D imaging compared with 2DE. In addition, 3DTTE detected more extensive and closely packed echolucencies involving the whole extent of the tumor in the hemangioma compared with more scattered echolucencies in myxomas (Figure 16-7).9
Fibroma
Fibroma is a congenital neoplasm that usually affects children. A right ventricular fibroma was diagnosed by 2DTTE in a patient with previous incomplete resection of the same. The fibroma (Figure 16-8) was dramatically larger (9.0 × 2.8 cm) by RT3DTTE compared with 2DE (2.6 × 2.7 cm).7 A left atrial fibroma (Figure 16-9) was associated with Gardner syndrome.10
Papillary Fibroelastoma
Papillary fibroelastoma is the third most common tumor of the heart, with an incidence of 0.33% among autopsy series.11 It is the most common tumor of the heart valves and is most frequently identified on the aortic valve (Figure 16-10), although all valves have been described (Figure 16-11; Video 16-7). The value of RT3DTTE was illustrated in a case presented by Singh and colleagues12 with a papillary fibroelastoma of the pulmonary valve. RT3DTTE pinpointed the attachment point, which was helpful in planning valve-sparing surgery. Also, 3D cropping through multiple orthogonal planes revealed frondlike projections and no echolucencies, which helped differentiate the mass from a myxoma or thrombus (Figure 16-12). Le Tourneau and associates13 studied seven consecutive patients with this lesion who had surgical resection of the lesion and found feasibility of imaging the mass to be 100%. Correlation of the 3D volume size with the actual resected tumor was very good. They believed RT3DTTE helped with surgical planning in three of the seven patients; surgical planning is key when valve-sparing surgery is planned. Most of the lesions (five of seven) were on the aortic valve.13
Sarcomas
Sarcomas are quite rare primary tumors of the heart but are, in fact, the most common type of primary malignant cardiac tumor, at least in the adult population. Angiosarcoma is the most common among cardiac sarcomas and typically arises in the right atrium, often adjacent to the inferior or superior vena cava. These tumors often are large and aggressive, sometimes occupying much of the right atrium (Figures 16-13 to 16-16; Videos 16-8 to 16-10). Suwanjutah et al14 described a case of leiomyosarcoma imaged by RT3DTTE (Figure 16-17). The notable incremental value of RT3DTTE was the composition of the mass. RT3DTTE, again, thanks to its cropping capability, allowed imaging of an area of echolucency, suggesting necrosis or hemorrhage surrounded by bandlike structures consistent with collagen. This image created a “donut” appearance. Excision and evaluation of the resultant histopathology revealed the same pattern of necrosis and vascular channels within the fibrotic tumor. The morphology seen in this case of the tumor by RT3DTTE was suggestive of tumor as opposed to a thrombus. Just as important, the size of the mass by RT3DTTE was significantly larger than when measured by 2DTTE.
Figure 16-14 Three-dimensional transesophageal echocardiography of a right atrial angiosarcoma (arrow).
Figure 16-16 Right ventricular sarcoma (arrow). LV, left ventricle; RA, right atrium; RV, right ventricle.
(From Reddy VK, Faulkner M, Bandarupalli N, et al: Incremental value of live/real time three-dimensional transthoracic echocardiography in the assessment of right ventricular masses. Echocardiography 26:598–609, 2009.)
Lymphomas
Lymphomas represent 5% of primary cardiac malignancies, although diagnosis is not commonly made during life due to nonspecific presenting symptoms. A case of non-Hodgkin lymphoma in the right atrium that presented as atrial fibrillation was described and imaged by RT3DTTE. Follow-up imaging was useful for chemotherapy cleanup and showed marked shrinkage of the mass.15
Carcinoid Syndrome
Cardiac involvement occurs in more than 50% of patients with carcinoid syndrome. The right-sided heart valves are characteristically involved, with the tricuspid valve particularly affected. As previously mentioned, the pulmonary valve is particularly challenging to image by echocardiography. In a series of cases reported by Nalawadi and colleagues16
[/not-level-membership-for-cardiovascular-category]
