FIGURE 415e-3 Factors released by the adipocyte that can affect peripheral tissues. IL-6, interleukin 6; PAI, plasminogen activator inhibitor; RBP4, retinal binding protein 4; TNF, tumor necrosis factor.
ETIOLOGY OF OBESITY
Although the molecular pathways regulating energy balance are beginning to be illuminated, the causes of obesity remain elusive. In part, this reflects the fact that obesity is a heterogeneous group of disorders. At one level, the pathophysiology of obesity seems simple: a chronic excess of nutrient intake relative to the level of energy expenditure. However, due to the complexity of the neuroendocrine and metabolic systems that regulate energy intake, storage, and expenditure, it has been difficult to quantitate all the relevant parameters (e.g., food intake and energy expenditure) over time in human subjects.
Role of Genes Versus Environment Obesity is commonly seen in families, and the heritability of body weight is similar to that for height. Inheritance is usually not Mendelian, however, and it is difficult to distinguish the role of genes and environmental factors. Adoptees more closely resemble their biologic than adoptive parents with respect to obesity, providing strong support for genetic influences. Likewise, identical twins have very similar BMIs whether reared together or apart, and their BMIs are much more strongly correlated than those of dizygotic twins. These genetic effects appear to relate to both energy intake and expenditure. Currently, identified genetic variants, both common and rare, account for less than 5% of the variance of body weight.
Whatever the role of genes, it is clear that the environment plays a key role in obesity, as evidenced by the fact that famine prevents obesity in even the most obesity-prone individual. In addition, the recent increase in the prevalence of obesity in the United States is far too rapid to be due to changes in the gene pool. Undoubtedly, genes influence the susceptibility to obesity in response to specific diets and availability of nutrition. Cultural factors are also important—these relate to both availability and composition of the diet and to changes in the level of physical activity. In industrial societies, obesity is more common among poor women, whereas in underdeveloped countries, wealthier women are more often obese. In children, obesity correlates to some degree with time spent watching television. Although the role of diet composition in obesity continues to generate controversy, it appears that high-fat diets may, when combined with simple, rapidly absorbed carbohydrates, promote obesity. Specific genes are likely to influence the response to specific diets, but these genes are largely unidentified.
Additional environmental factors may contribute to the increasing obesity prevalence. Both epidemiologic correlations and experimental data suggest that sleep deprivation leads to increased obesity. Changes in gut microbiome with capacity to alter energy balance are receiving experimental support from animal studies, and a possible role for obesigenic viral infections continues to receive sporadic attention.
Specific Genetic Syndromes For many years, obesity in rodents has been known to be caused by a number of distinct mutations distributed through the genome. Most of these single-gene mutations cause both hyperphagia and diminished energy expenditure, suggesting a physiologic link between these two parameters of energy homeostasis. Identification of the ob gene mutation in genetically obese (ob/ob) mice represented a major breakthrough in the field. The ob/ob mouse develops severe obesity, insulin resistance, and hyperphagia, as well as efficient metabolism (e.g., it gets fat even when ingesting the same number of calories as lean litter mates). The product of the ob gene is the peptide leptin, a name derived from the Greek root leptos, meaning thin. Leptin is secreted by adipose cells and acts primarily through the hypothalamus. Its level of production provides an index of adipose energy stores (Fig. 415e-4). High leptin levels decrease food intake and increase energy expenditure. Another mouse mutant, db/db, which is resistant to leptin, has a mutation in the leptin receptor and develops a similar syndrome. The ob gene is present in humans where it is also expressed in fat. Several families with morbid, early-onset obesity caused by inactivating mutations in either leptin or the leptin receptor have been described, thus demonstrating the biologic relevance of the leptin pathway in humans. Obesity in these individuals begins shortly after birth, is severe, and is accompanied by neuroendocrine abnormalities. The most prominent of these is hypogonadotropic hypogonadism, which is reversed by leptin replacement in the leptin-deficient subset. Central hypothyroidism and growth retardation are seen in the mouse model, but their occurrence in leptin-deficient humans is less clear. Mutations in the leptin or leptin receptor genes do not play a prominent role in common forms of obesity.
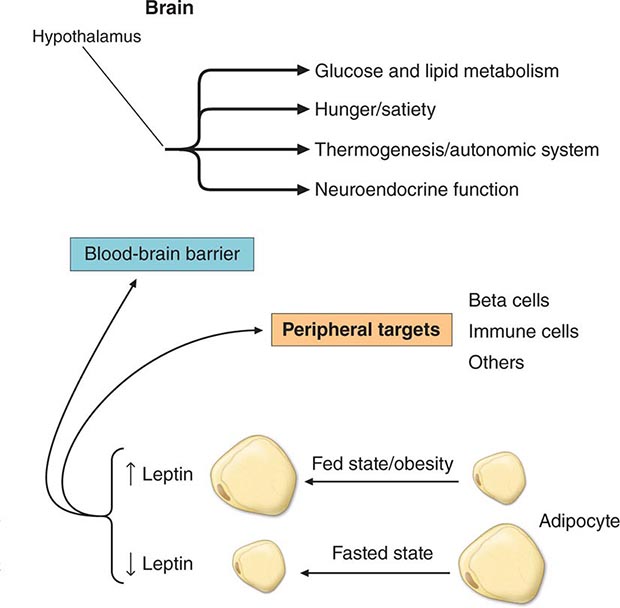
FIGURE 415e-4 The physiologic system regulated by leptin. Rising or falling leptin levels act through the hypothalamus to influence appetite, energy expenditure, and neuroendocrine function and through peripheral sites to influence systems such as the immune system.
Mutations in several other genes cause severe obesity in humans (Table 415e-1); each of these syndromes is rare. Mutations in the gene encoding proopiomelanocortin (POMC) cause severe obesity through failure to synthesize α-MSH, a key neuropeptide that inhibits appetite in the hypothalamus. The absence of POMC also causes secondary adrenal insufficiency due to absence of adrenocorticotropic hormone (ACTH), as well as pale skin and red hair due to absence of α-MSH. Proenzyme convertase 1 (PC-1) mutations are thought to cause obesity by preventing synthesis of α-MSH from its precursor peptide, POMC. α-MSH binds to the type 4 melanocortin receptor (MC4R), a key hypothalamic receptor that inhibits eating. Heterozygous loss-of-function mutations of this receptor account for as much as 5% of severe obesity. Loss of function of MRAP2, a protein required for normal MC4R signaling, has been found in rare cases of severe obesity. These six genetic defects define a pathway through which leptin (by stimulating POMC and increasing α-MSH) restricts food intake and limits weight (Fig. 415e-5). The results of genomewide association studies to identify genetic loci responsible for obesity in the general population have so far been disappointing. More than 40 replicated loci linked to obesity have been identified, but together they account for less than 3% of interindividual variation in BMI. The most replicated of these is a gene named FTO, which is of unknown function, but like many of the other recently described candidates, is expressed in the brain. Because the heritability of obesity is estimated to be 40–70%, it is likely that many more loci remain to be identified. It is possible that epistatic interactions between causative loci or unknown gene-environment interactions explain the poor success at identifying causal loci.
|
SELECTED OBESITY GENES IN HUMANS AND MICE |
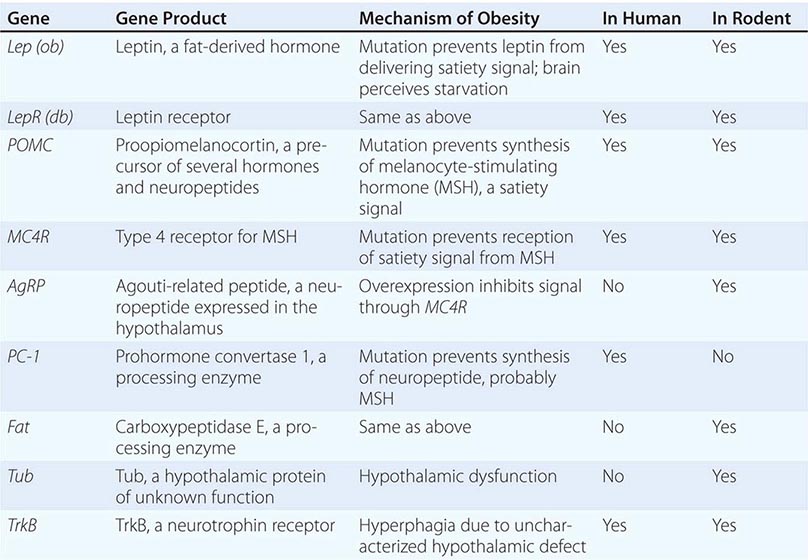
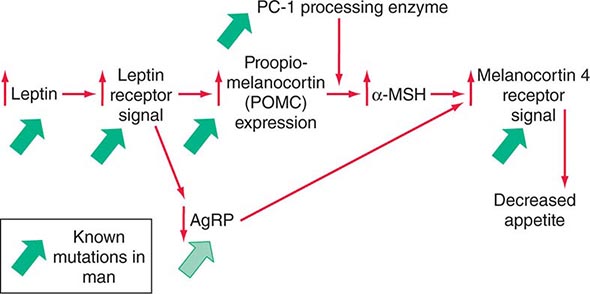
FIGURE 415e-5 A central pathway through which leptin acts to regulate appetite and body weight. Leptin signals through proopiomelanocortin (POMC) neurons in the hypothalamus to induce increased production of α-melanocyte-stimulating hormone (α-MSH), requiring the processing enzyme PC-1 (proenzyme convertase 1). α-MSH acts as an agonist on melanocortin-4 receptors to inhibit appetite, and the neuropeptide AgRp (Agouti-related peptide) acts as an antagonist of this receptor. Mutations that cause obesity in humans are indicated by the solid green arrows.
In addition to these human obesity genes, studies in rodents reveal several other molecular candidates for hypothalamic mediators of human obesity or leanness. The tub gene encodes a hypothalamic peptide of unknown function; mutation of this gene causes late-onset obesity. The fat gene encodes carboxypeptidase E, a peptide-processing enzyme; mutation of this gene is thought to cause obesity by disrupting production of one or more neuropeptides. AgRP is coexpressed with NPY in arcuate nucleus neurons. AgRP antagonizes α-MSH action at MC4 receptors, and its overexpression induces obesity. In contrast, a mouse deficient in the peptide MCH, whose administration causes feeding, is lean.
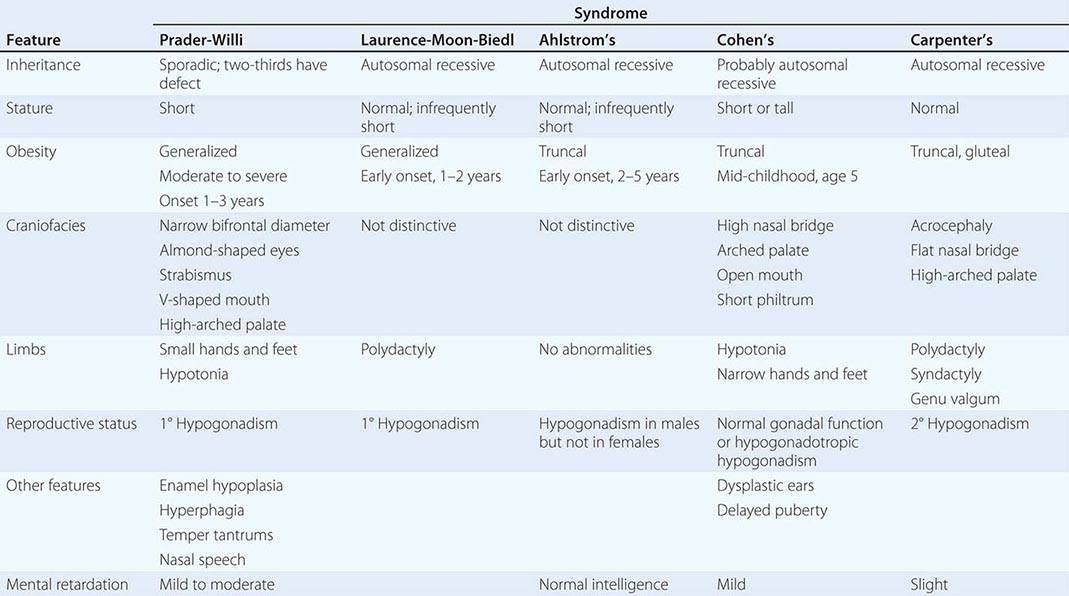
A number of complex human syndromes with defined inheritance are associated with obesity (Table 415e-2). Although specific genes have limited definition at present, their identification will likely enhance our understanding of more common forms of human obesity. In the Prader-Willi syndrome, a multigenic neurodevelopmental disorder, obesity coexists with short stature, mental retardation, hypogonadotropic hypogonadism, hypotonia, small hands and feet, fish-shaped mouth, and hyperphagia. Most patients have reduced expression of imprinted paternally inherited genes encoded in the 15q11-13 chromosomal region. Reduced expression of Snord116, a small nucleolar RNA highly expressed in hypothalamus, may be an important cause of defective hypothalamic function in this disorder. Bardet-Biedl syndrome (BBS) is a genetically heterogeneous disorder characterized by obesity, mental retardation, retinitis pigmentosa, diabetes, renal and cardiac malformations, polydactyly, and hypogonadotropic hypogonadism. At least 12 genetic loci have been identified, and most of the encoded proteins form two multiprotein complexes that are involved in ciliary function and microtubule-based intracellular transport. Some evidence suggests that mutations might disrupt leptin receptor trafficking in key hypothalamic neurons, causing leptin resistance.
|
A COMPARISON OF SYNDROMES OF OBESITY—HYPOGONADISM AND MENTAL RETARDATION |
Other Specific Syndromes Associated with Obesity • CUSHING’S SYNDROME Although obese patients commonly have central obesity, hypertension, and glucose intolerance, they lack other specific stigmata of Cushing’s syndrome (Chap. 406). Nonetheless, a potential diagnosis of Cushing’s syndrome is often entertained. Cortisol production and urinary metabolites (17OH steroids) may be increased in simple obesity. Unlike in Cushing’s syndrome, however, cortisol levels in blood and urine in the basal state and in response to corticotropin-releasing hormone (CRH) or ACTH are normal; the overnight 1-mg dexamethasone suppression test is normal in 90%, with the remainder being normal on a standard 2-day low-dose dexamethasone suppression test. Obesity may be associated with excessive local reactivation of cortisol in fat by 11β-hydroxysteroid dehydrogenase 1, an enzyme that converts inactive cortisone to cortisol.
HYPOTHYROIDISM The possibility of hypothyroidism should be considered, but it is an uncommon cause of obesity; hypothyroidism is easily ruled out by measuring thyroid-stimulating hormone (TSH). Much of the weight gain that occurs in hypothyroidism is due to myxedema (Chap. 405).
INSULINOMA Patients with insulinoma often gain weight as a result of overeating to avoid hypoglycemic symptoms (Chap. 420). The increased substrate plus high insulin levels promote energy storage in fat. This can be marked in some individuals but is modest in most.
CRANIOPHARYNGIOMA AND OTHER DISORDERS INVOLVING THE HYPOTHALAMUS Whether through tumors, trauma, or inflammation, hypothalamic dysfunction of systems controlling satiety, hunger, and energy expenditure can cause varying degrees of obesity (Chap. 402). It is uncommon to identify a discrete anatomic basis for these disorders. Subtle hypothalamic dysfunction is probably a more common cause of obesity than can be documented using currently available imaging techniques. Growth hormone (GH), which exerts lipolytic activity, is diminished in obesity and is increased with weight loss. Despite low GH levels, insulin-like growth factor (IGF) I (somatomedin) production is normal, suggesting that GH suppression may be a compensatory response to increased nutritional supply.
Pathogenesis of Common Obesity Obesity can result from increased energy intake, decreased energy expenditure, or a combination of the two. Thus, identifying the etiology of obesity should involve measurements of both parameters. However, it is difficult to perform direct and accurate measurements of energy intake in free-living individuals; and the obese, in particular, often underreport intake. Measurements of chronic energy expenditure are possible using doubly labeled water or metabolic chamber/rooms. In subjects at stable weight and body composition, energy intake equals expenditure. Consequently, these techniques allow assessment of energy intake in free-living individuals. The level of energy expenditure differs in established obesity, during periods of weight gain or loss, and in the pre- or postobese state. Studies that fail to take note of this phenomenon are not easily interpreted.
There is continued interest in the concept of a body weight “set point.” This idea is supported by physiologic mechanisms centered around a sensing system in adipose tissue that reflects fat stores and a receptor, or “adipostat,” that is in the hypothalamic centers. When fat stores are depleted, the adipostat signal is low, and the hypothalamus responds by stimulating hunger and decreasing energy expenditure to conserve energy. Conversely, when fat stores are abundant, the signal is increased, and the hypothalamus responds by decreasing hunger and increasing energy expenditure. The recent discovery of the ob gene, and its product leptin, and the db gene, whose product is the leptin receptor, provides important elements of a molecular basis for this physiologic concept (see above).
What Is the Status of Food Intake in Obesity? (Do the Obese Eat More Than the Lean?) This question has stimulated much debate, due in part to the methodologic difficulties inherent in determining food intake. Many obese individuals believe that they eat small quantities of food, and this claim has often been supported by the results of food intake questionnaires. However, it is now established that average energy expenditure increases as individuals get more obese, due primarily to the fact that metabolically active lean tissue mass increases with obesity. Given the laws of thermodynamics, the obese person must therefore eat more than the average lean person to maintain their increased weight. It may be the case, however, that a subset of individuals who are predisposed to obesity have the capacity to become obese initially without an absolute increase in caloric consumption.
What Is the State of Energy Expenditure in Obesity? The average total daily energy expenditure is higher in obese than lean individuals when measured at stable weight. However, energy expenditure falls as weight is lost, due in part to loss of lean body mass and to decreased sympathetic nerve activity. When reduced to near-normal weight and maintained there for a while, (some) obese individuals have lower energy expenditure than (some) lean individuals. There is also a tendency for those who will develop obesity as infants or children to have lower resting energy expenditure rates than those who remain lean. The physiologic basis for variable rates of energy expenditure (at a given body weight and level of energy intake) is essentially unknown.
Another component of thermogenesis, called nonexercise activity thermogenesis (NEAT), has been linked to obesity. It is the thermogenesis that accompanies physical activities other than volitional exercise such as the activities of daily living, fidgeting, spontaneous muscle contraction, and maintaining posture. NEAT accounts for about two-thirds of the increased daily energy expenditure induced by overfeeding. The wide variation in fat storage seen in overfed individuals is predicted by the degree to which NEAT is induced. The molecular basis for NEAT and its regulation is unknown.
Leptin in Typical Obesity The vast majority of obese persons have increased leptin levels but do not have mutations of either leptin or its receptor. They appear, therefore, to have a form of functional “leptin resistance.” Data suggesting that some individuals produce less leptin per unit fat mass than others or have a form of relative leptin deficiency that predisposes to obesity are at present contradictory and unsettled. The mechanism for leptin resistance, and whether it can be overcome by raising leptin levels or combining leptin with other treatments in a subset of obese individuals, is not yet established. Some data suggest that leptin may not effectively cross the blood-brain barrier as levels rise. It is also apparent from animal studies that leptin-signaling inhibitors, such as SOCS3 and PTP1b, are involved in the leptin-resistant state.
PATHOLOGIC CONSEQUENCES OF OBESITY
(See also Chap. 416) Obesity has major adverse effects on health. Obesity is associated with an increase in mortality, with a 50–100% increased risk of death from all causes compared to normal-weight individuals, mostly due to cardiovascular causes. Obesity and overweight together are the second leading cause of preventable death in the United States, accounting for 300,000 deaths per year. Mortality rates rise as obesity increases, particularly when obesity is associated with increased intraabdominal fat (see above). Life expectancy of a moderately obese individual could be shortened by 2–5 years, and a 20- to 30-year-old male with a BMI >45 may lose 13 years of life. It is likely that the degree to which obesity affects particular organ systems is influenced by susceptibility genes that vary in the population.
Insulin Resistance and Type 2 Diabetes Mellitus Hyperinsulinemia and insulin resistance are pervasive features of obesity, increasing with weight gain and diminishing with weight loss (Chap. 422). Insulin resistance is more strongly linked to intraabdominal fat than to fat in other depots. Molecular links between obesity and insulin resistance in fat, muscle, and liver have been sought for many years. Major factors include: (1) insulin itself, by inducing receptor downregulation; (2) free fatty acids that are increased and capable of impairing insulin action; (3) intracellular lipid accumulation; and (4) several circulating peptides produced by adipocytes, including the cytokines TNF-α and IL-6, RBP4, and the “adipokines” adiponectin and resistin, which have altered expression in obese adipocytes and can modify insulin action. Additional mechanisms are obesity-linked inflammation, including infiltration of macrophages into tissues including fat, and induction of the endoplasmic reticulum stress response, which can bring about resistance to insulin action in cells. Despite the prevalence of insulin resistance, most obese individuals do not develop diabetes, suggesting that diabetes requires an interaction between obesity-induced insulin resistance and other factors such as impaired insulin secretion (Chap. 417). Obesity, however, is a major risk factor for diabetes, and as many as 80% of patients with type 2 diabetes mellitus are obese. Weight loss and exercise, even of modest degree, increase insulin sensitivity and often improve glucose control in diabetes.
Reproductive Disorders Disorders that affect the reproductive axis are associated with obesity in both men and women. Male hypogonadism is associated with increased adipose tissue, often distributed in a pattern more typical of females. In men whose weight is >160% ideal body weight (IBW), plasma testosterone and sex hormone–binding globulin (SHBG) are often reduced, and estrogen levels (derived from conversion of adrenal androgens in adipose tissue) are increased (Chap. 411). Gynecomastia may be seen. However, masculinization, libido, potency, and spermatogenesis are preserved in most of these individuals. Free testosterone may be decreased in morbidly obese men whose weight is >200% IBW.
Obesity has long been associated with menstrual abnormalities in women, particularly in women with upper body obesity (Chap. 412). Common findings are increased androgen production, decreased SHBG, and increased peripheral conversion of androgen to estrogen. Most obese women with oligomenorrhea have polycystic ovarian syndrome (PCOS), with its associated anovulation and ovarian hyperandrogenism; 40% of women with PCOS are obese. Most nonobese women with PCOS are also insulin-resistant, suggesting that insulin resistance, hyperinsulinemia, or the combination of the two are causative or contribute to the ovarian pathophysiology in PCOS in both obese and lean individuals. Increasing evidence supports a role for adipokines in mediating a link between obesity and the reproductive dysfunction of PCOS. In obese women with PCOS, weight loss or treatment with insulin-sensitizing drugs often restores normal menses. The increased conversion of androstenedione to estrogen, which occurs to a greater degree in women with lower body obesity, may contribute to the increased incidence of uterine cancer in postmenopausal women with obesity.
Cardiovascular Disease The Framingham Study revealed that obesity was an independent risk factor for the 26-year incidence of cardiovascular disease in men and women (including coronary disease, stroke, and congestive heart failure). The waist-to-hip ratio may be the best predictor of these risks. When the additional effects of hypertension and glucose intolerance associated with obesity are included, the adverse impact of obesity is even more evident. The effect of obesity on cardiovascular mortality in women may be seen at BMIs as low as 25. Obesity, especially abdominal obesity, is associated with an atherogenic lipid profile; with increased low-density lipoprotein cholesterol, very-low-density lipoprotein, and triglyceride; and with decreased high-density lipoprotein cholesterol and decreased levels of the vascular protective adipokine adiponectin (Chap. 421). Obesity is also associated with hypertension. Measurement of blood pressure in the obese requires use of a larger cuff size to avoid artifactual increases. Obesity-induced hypertension is associated with increased peripheral resistance and cardiac output, increased sympathetic nervous system tone, increased salt sensitivity, and insulin-mediated salt retention; it is often responsive to modest weight loss.
Pulmonary Disease Obesity may be associated with a number of pulmonary abnormalities. These include reduced chest wall compliance, increased work of breathing, increased minute ventilation due to increased metabolic rate, and decreased functional residual capacity and expiratory reserve volume. Severe obesity may be associated with obstructive sleep apnea and the “obesity hypoventilation syndrome” with attenuated hypoxic and hypercapnic ventilatory responses. Sleep apnea can be obstructive (most common), central, or mixed and is associated with hypertension. Weight loss (10–20 kg) can bring substantial improvement, as can major weight loss following gastric bypass or restrictive surgery. Continuous positive airway pressure has been used with some success.
Hepatobiliary Disease Obesity is frequently associated with nonalcoholic fatty liver disease (NAFLD), and this association represents one of the most common causes of liver disease in industrialized countries. The hepatic fatty infiltration of NAFLD progresses in a subset to inflammatory nonalcoholic steatohepatitis (NASH) and more rarely to cirrhosis and hepatocellular carcinoma. Steatosis typically improves following weight loss, secondary to diet or bariatric surgery. The mechanism for the association remains unclear. Obesity is associated with enhanced biliary secretion of cholesterol, supersaturation of bile, and a higher incidence of gallstones, particularly cholesterol gallstones (Chap. 369). A person 50% above IBW has about a sixfold increased incidence of symptomatic gallstones. Paradoxically, fasting increases supersaturation of bile by decreasing the phospholipid component. Fasting-induced cholecystitis is a complication of extreme diets.
Cancer Obesity is associated with increased risk of several cancer types, and in addition can lead to poorer treatment outcomes and increased cancer mortality. Obesity in males is associated with higher mortality from cancer of the esophagus, colon, rectum, pancreas, liver, and prostate; obesity in females is associated with higher mortality from cancer of the gallbladder, bile ducts, breasts, endometrium, cervix, and ovaries. Some of the latter may be due to increased rates of conversion of androstenedione to estrone in adipose tissue of obese individuals. Other possible mechanistic links may involve hormones, growth factors, and cytokines whose levels are linked to nutritional state, including insulin, leptin, adiponectin, and IGF-I, as well as activation of signaling pathways linked to both obesity and cancer. It has been estimated that obesity accounts for 14% of cancer deaths in men and 20% in women in the United States.
Bone, Joint, and Cutaneous Disease Obesity is associated with an increased risk of osteoarthritis, no doubt partly due to the trauma of added weight bearing, but potentially linked as well to activation of inflammatory pathways that could promote synovial pathology. The prevalence of gout may also be increased (Chap. 395). One of the skin problems associated with obesity is acanthosis nigricans, manifested by darkening and thickening of the skinfolds on the neck, elbows, and dorsal interphalangeal spaces. Acanthosis reflects the severity of underlying insulin resistance and diminishes with weight loss. Friability of skin may be increased, especially in skinfolds, enhancing the risk of fungal and yeast infections. Finally, venous stasis is increased in the obese.
416 |
Evaluation and Management of Obesity |
More than 66% of U.S. adults are categorized as overweight or obese, and the prevalence of obesity is increasing rapidly in most of the industrialized world. Children and adolescents also are becoming more obese, indicating that the current trends will accelerate over time. Obesity is associated with an increased risk of multiple health problems, including hypertension, type 2 diabetes, dyslipidemia, obstructive sleep apnea, nonalcoholic fatty liver disease, degenerative joint disease, and some malignancies. Thus, it is important for physicians to identify, evaluate, and treat patients for obesity and associated comorbid conditions.
EVALUATION
Physicians should screen all adult patients for obesity and offer intensive counseling and behavioral interventions to promote sustained weight loss. The five main steps in the evaluation of obesity, as described below, are (1) a focused obesity-related history, (2) a physical examination to determine the degree and type of obesity, (3) assessment of comorbid conditions, (4) determination of fitness level, and (5) assessment of the patient’s readiness to adopt lifestyle changes.
The Obesity-Focused History Information from the history should address the following seven questions:
• What factors contribute to the patient’s obesity?
• How is the obesity affecting the patient’s health?
• What is the patient’s level of risk from obesity?
• What does the patient find difficult about managing weight?
• What are the patient’s goals and expectations?
• Is the patient motivated to begin a weight management program?
• What kind of help does the patient need?
Although the vast majority of cases of obesity can be attributed to behavioral factors that affect diet and physical activity patterns, the history may suggest secondary causes that merit further evaluation. Disorders to consider include polycystic ovarian syndrome, hypothyroidism, Cushing’s syndrome, and hypothalamic disease. Drug-induced weight gain also should be considered. Common causes include medications for diabetes (insulin, sulfonylureas, thiazolidinediones); steroid hormones; psychotropic agents; mood stabilizers (lithium); antidepressants (tricyclics, monoamine oxidase inhibitors, paroxetine, mirtazapine); and antiepileptic drugs (valproate, gabapentin, carbamazepine). Other medications, such as nonsteroidal anti-inflammatory drugs and calcium channel blockers, may cause peripheral edema but do not increase body fat.
The patient’s current diet and physical activity patterns may reveal factors that contribute to the development of obesity and may identify behaviors to target for treatment. This type of historic information is best obtained by the combination of a questionnaire and an interview.
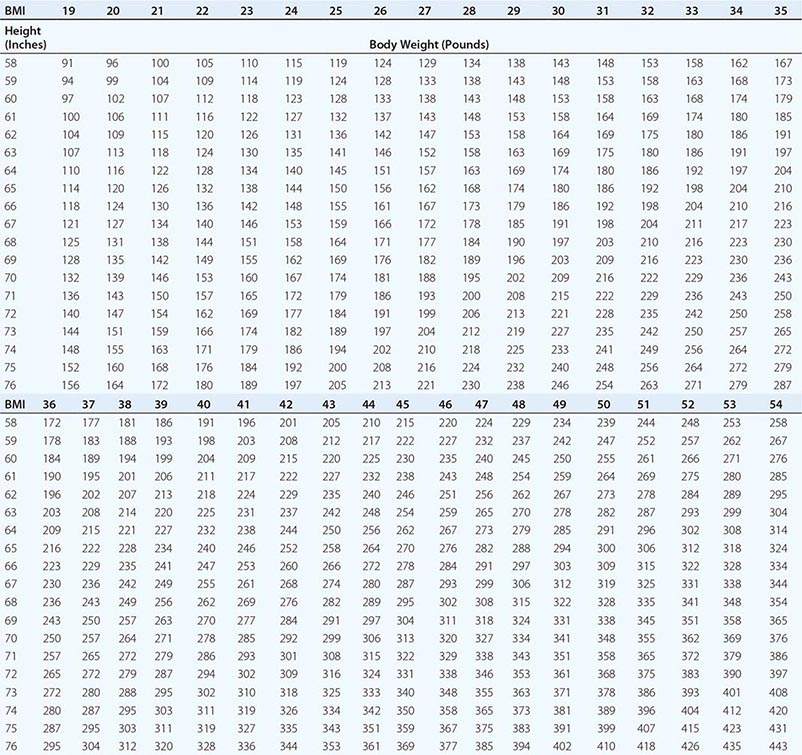
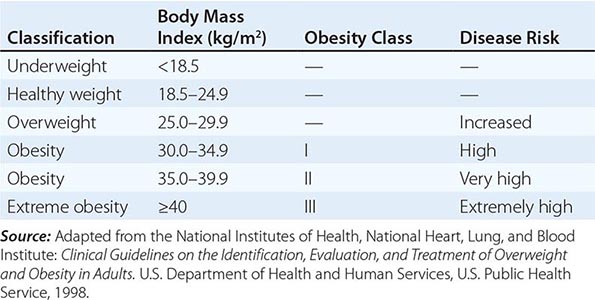
Body Mass Index (BMI) and Waist Circumference Three key anthropometric measurements are important in evaluating the degree of obesity: weight, height, and waist circumference. The BMI, calculated as weight (kg)/height (m)2 or as weight (lbs)/height (inches)2 × 703, is used to classify weight status and risk of disease (Tables 416-1 and 416-2). BMI provides an estimate of body fat and is related to disease risk. Lower BMI thresholds for overweight and obesity have been proposed for the Asia-Pacific region since this population appears to be at risk for glucose and lipid abnormalities at lower body weights.
|
BODY MASS INDEX (BMI) |
|
CLASSIFICATION OF WEIGHT STATUS AND DISEASE RISK |
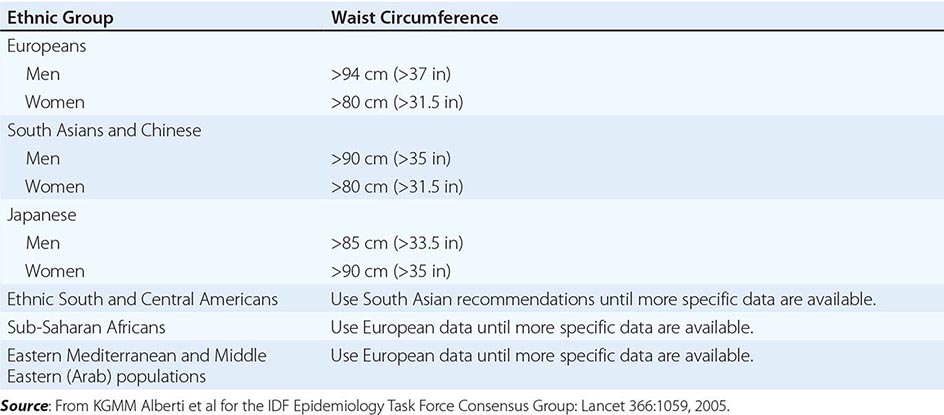
Excess abdominal fat, assessed by measurement of waist circumference or waist-to-hip ratio, is independently associated with a higher risk for diabetes mellitus and cardiovascular disease. Measurement of the waist circumference is a surrogate for visceral adipose tissue and should be performed in the horizontal plane above the iliac crest (Table 416-3).
|
ETHNIC-SPECIFIC CUTPOINT VALUES FOR WAIST CIRCUMFERENCE |
Physical Fitness Several prospective studies have demonstrated that physical fitness, reported by questionnaire or measured by a maximal treadmill exercise test, is an important predictor of all-cause mortality rate independent of BMI and body composition. These observations highlight the importance of taking a physical activity and exercise history during examination as well as emphasizing physical activity as a treatment approach.
Obesity-Associated Comorbid Conditions The evaluation of comorbid conditions should be based on presentation of symptoms, risk factors, and index of suspicion. For all patients, a fasting lipid panel should be performed (total, low-density lipoprotein, and high-density lipoprotein cholesterol and triglyceride levels) and a fasting blood glucose level and blood pressure determined. Symptoms and diseases that are directly or indirectly related to obesity are listed in Table 416-4. Although individuals vary, the number and severity of organ-specific comorbid conditions usually rise with increasing levels of obesity. Patients at very high absolute risk include those with the following: established coronary heart disease; presence of other atherosclerotic diseases, such as peripheral arterial disease, abdominal aortic aneurysm, and symptomatic carotid artery disease; type 2 diabetes; and sleep apnea.
|
OBESITY-RELATED ORGAN SYSTEMS REVIEW |
Assessing the Patient’s Readiness to Change An attempt to initiate lifestyle changes when the patient is not ready usually leads to frustration and may hamper future weight-loss efforts. Assessment includes patient motivation and support, stressful life events, psychiatric status, time availability and constraints, and appropriateness of goals and expectations. Readiness can be viewed as the balance of two opposing forces: (1) motivation, or the patient’s desire to change; and (2) resistance, or the patient’s resistance to change.
A helpful method to begin a readiness assessment is to use the motivational interviewing technique of “anchoring” the patient’s interest and confidence to change on a numerical scale. With this technique, the patient is asked to rate—on a scale from 0 to 10, with 0 being not so important (or confident) and 10 being very important (or confident)—his or her level of interest in and confidence about losing weight at this time. This exercise helps establish readiness to change and also serves as a basis for further dialogue.
|
TREATMENT |
OBESITY |
THE GOAL OF THERAPY
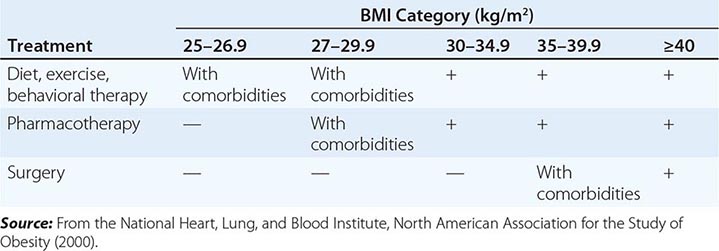
The primary goals of treatment are to improve obesity-related comorbid conditions and to reduce the risk of developing future comorbidities. Information obtained from the history, physical examination, and diagnostic tests is used to determine risk and develop a treatment plan (Fig. 416-1). The decision of how aggressively to treat the patient and which modalities to use is determined by the patient’s risk status, expectations, and available resources. Not all patients who are deemed obese by BMI alone need to be treated, as exemplified by the concepts of obesity paradox or the metabolically healthy obese. However, patients who present with obesity-related comorbidities and who would benefit from weight loss intervention should be managed proactively. Therapy for obesity always begins with lifestyle management and may include pharmacotherapy or surgery, depending on BMI risk category (Table 416-5). Setting an initial weight-loss goal of 8–10% over 6 months is a realistic target.
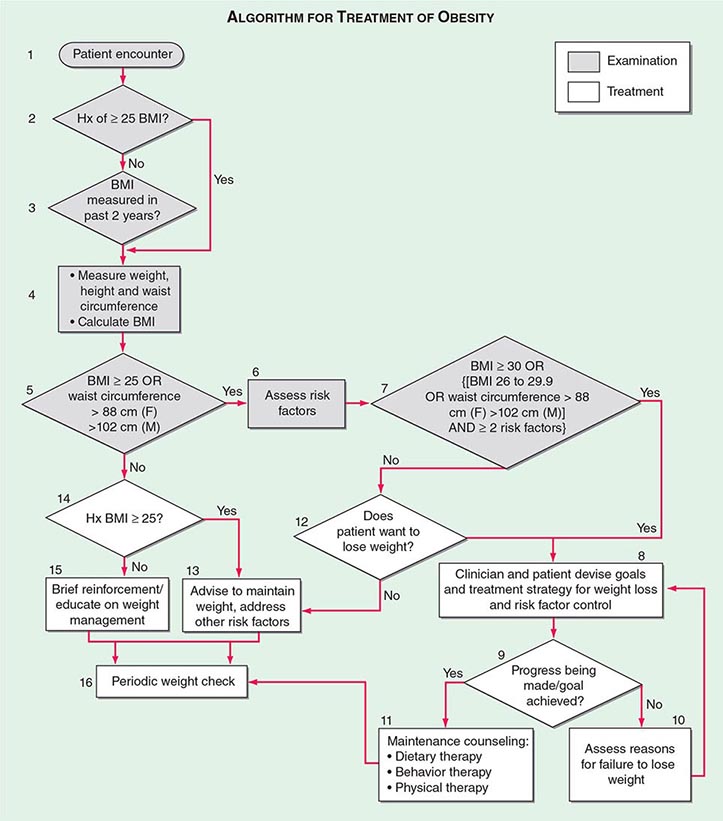
FIGURE 416-1 Algorithm for the treatment of obesity. This algorithm applies only to assessment for overweight and obesity and subsequent decisions based on that assessment. It does not reflect initial overall assessment for other conditions that the physician may wish to perform. BMI, body mass index; Hx, history. (From the National, Heart, Lung, and Blood Institute: Clinical guidelines on the identification, evaluation, and treatment of overweight and obesity in adults: The evidence report. Washington, DC, US Department of Health and Human Services, 1998.)
|
A GUIDE TO OPTING FOR TREATMENT FOR OBESITY |
LIFESTYLE MANAGEMENT
Obesity care involves attention to three essential elements of lifestyle: dietary habits, physical activity, and behavior modification. Because obesity is fundamentally a disease of energy imbalance, all patients must learn how and when energy is consumed (diet), how and when energy is expended (physical activity), and how to incorporate this information into their daily lives (behavioral therapy). Lifestyle management has been shown to result in a modest (typically 3–5 kg) weight loss when compared with no treatment or usual care.
Diet Therapy The primary focus of diet therapy is to reduce overall calorie consumption. Guidelines from the National Heart, Lung, and Blood Institute recommend initiating treatment with a calorie deficit of 500–1000 kcal/d compared with the patient’s habitual diet. This reduction is consistent with a goal of losing ~1–2 lbs per week. The calorie deficit can be instituted through dietary substitutions or alternatives. Examples include choosing smaller portion sizes, eating more fruits and vegetables, consuming more whole-grain cereals, selecting leaner cuts of meat and skimmed dairy products, reducing consumption of fried foods and other foods with added fats and oils, and drinking water instead of sugar-sweetened beverages. It is important that dietary counseling remain patient centered and that the goals set be practical, realistic, and achievable.
The macronutrient composition of the diet will vary with the patient’s preference and medical condition. The 2010 U.S. Department of Agriculture Dietary Guidelines for Americans (Chap. 95e), which focus on health promotion and risk reduction, can be applied to treatment of overweight or obese patients. The recommendations include maintaining a diet rich in whole grains, fruits, vegetables, and dietary fiber; consuming two servings (8 oz) of fish high in omega 3 fatty acids per week; decreasing sodium intake to <2300 mg/d; consuming 3 cups of milk (or equivalent low-fat or fat-free dairy products) per day; limiting cholesterol intake to <300 mg/d; and keeping total fat intake at 20–35% of daily calories and saturated fat intake at <10% of daily calories. Application of these guidelines to specific calorie goals can be found on the website www.choosemyplate.gov. The revised Dietary Reference Intakes for Macronutrients released by the Institute of Medicine recommends that 45–65% of calories come from carbohydrates, 20–35% from fat, and 10–35% from protein. The guidelines also recommend daily fiber intake of 38 g (men) and 25 g (women) for persons over 50 years of age and 30 g (men) and 21 g (women) for those under age 50.
Since portion control is one of the most difficult strategies for patients to manage, the use of pre-prepared products such as meal replacements is a simple and convenient suggestion. Examples include frozen entrees, canned beverages, and bars. Use of meal replacements in the diet has been shown to result in a 7–8% weight loss.
Numerous randomized trials comparing diets of different macronutrient composition (e.g., low-carbohydrate, low-fat, Mediterranean) have shown that weight loss depends primarily on reduction of total caloric intake and adherence to the prescribed diet, not the specific proportions of carbohydrate, fat, and protein in the diet. The macronutrient composition will ultimately be determined by the patient’s taste preferences, cooking style, and culture. However, the patient’s underlying medical problems are also important in guiding the recommended dietary composition. The dietary prescription will vary according to the patient’s metabolic profile and risk factors. A consultation with a registered dietitian for medical nutrition therapy is particularly useful in considering patient preference and treatment of comorbid diseases.
Another dietary approach to consider is based on the concept of energy density, which refers to the number of calories (i.e., amount of energy) a food contains per unit of weight. People tend to ingest a constant volume of food regardless of caloric or macronutrient content. Adding water or fiber to a food decreases its energy density by increasing weight without affecting caloric content. Examples of foods with low-energy density include soups, fruits, vegetables, oatmeal, and lean meats. Dry foods and high-fat foods such as pretzels, cheese, egg yolks, potato chips, and red meat have a high-energy density. Diets containing low-energy-dense foods have been shown to control hunger and thus to result in decreased caloric intake and weight loss.
Occasionally, very low-calorie diets (VLCDs) are prescribed as a form of aggressive dietary therapy. The primary purpose of a VLCD is to promote a rapid and significant (13- to 23-kg) short-term weight loss over a 3- to 6-month period. The proprietary formulas designed for this purpose typically supply ≤800 kcal, 50–80 g of protein, and 100% of the recommended daily intake for vitamins and minerals. According to a review by the National Task Force on the Prevention and Treatment of Obesity, indications for initiating a VLCD include the involvement of well-motivated individuals who are moderately to severely obese (BMI, >30 kg/m2), have failed at more conservative approaches to weight loss, and have a medical condition that would be immediately improved with rapid weight loss. These conditions include poorly controlled type 2 diabetes, hypertriglyceridemia, obstructive sleep apnea, and symptomatic peripheral edema. The risk for gallstone formation increases exponentially at rates of weight loss >1.5 kg/week (3.3 lb/week). Prophylaxis against gallstone formation with ursodeoxycholic acid (600 mg/d) is effective in reducing this risk. Because of the need for close metabolic monitoring, VLCDs usually are prescribed by physicians specializing in obesity care.
Physical Activity Therapy Although exercise alone is only moderately effective for weight loss, the combination of dietary modification and exercise is the most effective behavioral approach for the treatment of obesity. The most important role of exercise appears to be in the maintenance of the weight loss. The 2008 Physical Activity Guidelines for Americans (www.health.gov/paguidelines) recommend that adults should engage in 150 min of moderate-intensity or 75 min a week of vigorous-intensity aerobic physical activity per week, performed in episodes of at least 10 min and preferably spread throughout the week. Focusing on simple ways to add physical activity into the normal daily routine through leisure activities, travel, and domestic work should be suggested. Examples include walking, using the stairs, doing housework and yard work, and engaging in sports. Asking the patient to wear a pedometer or accelerometer to monitor total accumulation of steps or kcal expended as part of the activities of daily living is a useful strategy. Step counts are highly correlated with activity level. Studies have demonstrated that lifestyle activities are as effective as structured exercise programs for improving cardiorespiratory fitness and weight loss. A high level of physical activity (>300 min of moderate-intensity activity per week) is often needed to lose weight and sustain weight loss. These exercise recommendations are daunting to most patients and need to be implemented gradually. Consultation with an exercise physiologist or personal trainer may be helpful.
Behavioral Therapy Cognitive behavioral therapy is used to help change and reinforce new dietary and physical activity behaviors. Strategies include self-monitoring techniques (e.g., journaling, weighing, and measuring food and activity); stress management; stimulus control (e.g., using smaller plates, not eating in front of the television or in the car); social support; problem solving; and cognitive restructuring to help patients develop more positive and realistic thoughts about themselves. When recommending any behavioral lifestyle change, the patient should be asked to identify what, when, where, and how the behavioral change will be performed. The patient should keep a record of the anticipated behavioral change so that progress can be reviewed at the next office visit. Because these techniques are time-consuming to implement, their supervision is often undertaken by ancillary office staff, such as a nurse-clinician or registered dietitian.
PHARMACOTHERAPY
Adjuvant pharmacologic treatments should be considered for patients with a BMI ≥30 kg/m2 or—for patients who have concomitant obesity-related diseases and for whom dietary and physical activity therapy has not been successful—a BMI ≥27 kg/m2. When an antiobesity medication is prescribed, patients should be actively engaged in a lifestyle program that provides the strategies and skills needed to use the drug effectively, since such support increases total weight loss.
Medications for obesity have traditionally fallen into two major categories: appetite suppressants (anorexiants) and gastrointestinal fat blockers. Appetite-suppressing medications have primarily targeted three monoamine receptor systems in the hypothalamus: noradrenergic, dopaminergic, and serotonergic receptors. Two new appetite suppressants were approved by the U.S. Food and Drug Administration (FDA) in 2012: lorcaserin and phentermine/topiramate (PHEN/TPM) extended release. Gastrointestinal fat blockers reduce the absorption of selective macronutrients, such as fat, from the gastrointestinal tract.
Centrally Acting Anorexiant Medications Anorexiants affect satiety (the absence of hunger after eating) and hunger (the biologic sensation that prompts eating). By increasing satiety and decreasing hunger, these agents help patients reduce caloric intake without a sense of deprivation. The target site for the actions of anorexiants is the ventromedial and lateral hypothalamic regions in the central nervous system (Chap. 415e). The biologic effect of these agents on appetite regulation is produced by augmentation of the neurotransmission of three monoamines: norepinephrine; serotonin (5-hydroxytryptamine, or 5-HT); and, to a lesser degree, dopamine. The classic sympathomimetic adrenergic agents (benzphetamine, phendimetrazine, diethylpropion, mazindol, and phentermine) function by stimulating norepinephrine release or by blocking its reuptake. Among the anorexiants, phentermine has been the most commonly prescribed; there is limited long-term data on its effectiveness. A 2002 review of six randomized, placebo-controlled trials of phentermine for weight control found that patients lost 0.6–6.0 additional kilograms of weight over 2–24 weeks of treatment. The most common side effects of the amphetamine-derived anorexiants are restlessness, insomnia, dry mouth, constipation, and increased blood pressure and heart rate.
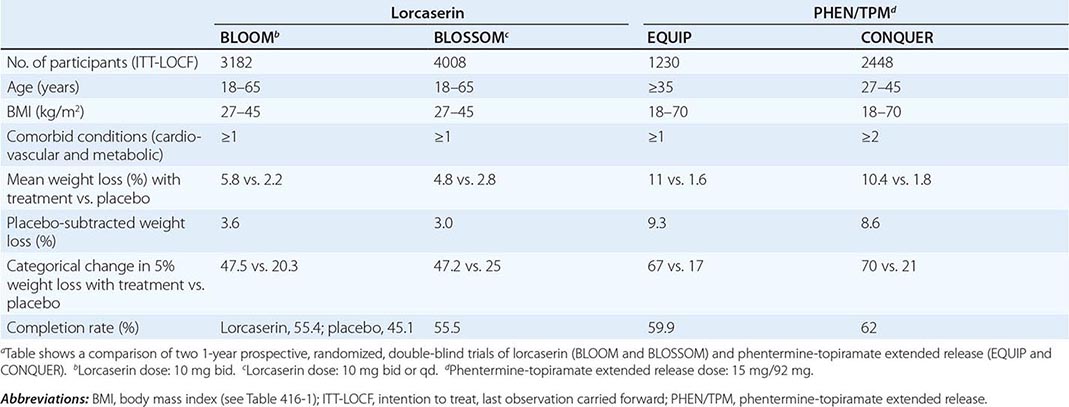
PHEN/TPM is a combination drug that contains a catecholamine releaser (phentermine) and an anticonvulsant (topiramate). Topiramate is approved by the FDA as an anticonvulsant for the treatment of epilepsy and for the prophylaxis of migraine headaches. Weight loss was identified as an unintended side effect of topiramate during clinical trials for epilepsy. The mechanism responsible for weight loss is uncertain but is thought to be mediated through the drug’s modulation of γ-aminobutyric acid receptors, inhibition of carbonic anhydrase, and antagonism of glutamate. PHEN/TPM has undergone two 1-year pivotal randomized, placebo-controlled, double-blind trials of efficacy and safety: EQUIP and CONQUER. In a third study, SEQUEL, 78% of CONQUER participants continued to receive their blinded treatment for an additional year. All participants received diet and exercise counseling. Participant numbers, eligibility, characteristics, and weight loss outcomes are displayed in Table 416-6. Intention-to-treat 1-year placebo-subtracted weight loss for the PHEN/TPM 15-mg/92-mg dose was 9.3% and 8.6%, respectively, in the EQUIP and CONQUER trials. Clinical and statistical dose-dependent improvements were seen in selected cardiovascular and metabolic outcome measurements that were related to the weight loss. The most common adverse events experienced by the drug-randomized group were paresthesias, dry mouth, constipation, dysgeusia, and insomnia. Because of an increased risk of congenital fetal oral-cleft formation from topiramate, the FDA approval of PHEN/TPM stipulated a Risk Evaluation and Mitigation Strategies requirement to educate prescribers about the need for active birth control among women of childbearing age and a contraindication for use during pregnancy.
|
CLINICAL TRIALS FOR WEIGHT LOSS MEDICATIONSa |
Lorcaserin is a selective 5-HT2C receptor agonist with a functional selectivity ~15 times that of 5-HT2A receptors and 100 times that of 5-HT2B receptors. This selectivity is important, since the drug-induced valvulopathy documented with two other serotonergic agents that were removed from the market—fenfluramine and dexfenfluramine—was due to activation of the 5-HT2B receptors expressed on cardiac valvular interstitial cells. By activating the 5-HT2C receptor, lorcaserin is thought to decrease food intake through the pro-opiomelanocortin system of neurons.
Lorcaserin has undergone two randomized, placebo-controlled, double-blind trials for efficacy and safety. Participants were randomized to receive lorcaserin (10 mg bid) or placebo in the BLOOM study and to receive lorcaserin (10 mg bid or qd) or placebo in the BLOSSOM study. All participants received diet and exercise counseling. Participant numbers, eligibility, characteristics, and weight loss outcomes are displayed in Table 416-6. Overweight or obese subjects had at least one coexisting condition (hypertension, dyslipidemia, cardiovascular disease, impaired glucose tolerance, or sleep apnea)—medical conditions that are commonly seen in the office setting. Intention-to-treat 1-year placebo-subtracted weight loss was 3.6% and 3.0%, respectively, in the BLOOM and BLOSSOM trials. Echocardiography was performed at the screening visit and at scheduled time points over the course of the studies. There was no difference in the development of FDA-defined valvulopathy between drug-treated and placebo-treated participants at 1 year or 2 years. Modest statistical improvements consistent with the weight loss were seen in selected cardiovascular and metabolic outcome measurements. The most common adverse events experienced by the drug group were headache, dizziness, and nausea.
In approving both PHEN/TPM and lorcaserin, the FDA introduced a new provision with important clinical relevance: a prescription trial period to assess effectiveness. Response to both medications should be assessed after 3 months of treatment. For lorcaserin, the medication should be discontinued if the patient has not lost at least 5% of body weight by that point. For PHEN/TPM, if the patient has not lost at least 3% of body weight at 3 months, the clinician can either escalate the dose and reassess progress at 6 months or discontinue treatment entirely.
Peripherally Acting Medications Orlistat (XenicalTM) is a synthetic hydrogenated derivative of a naturally occurring lipase inhibitor, lipostatin, that is produced by the mold Streptomyces toxytricini. This drug is a potent, slowly reversible inhibitor of pancreatic, gastric, and carboxylester lipases and phospholipase A2, which are required for the hydrolysis of dietary fat into fatty acids and monoacylglycerols. Orlistat acts in the lumen of the stomach and small intestine by forming a covalent bond with the active site of these lipases. Taken at a therapeutic dose of 120 mg tid, orlistat blocks the digestion and absorption of ~30% of dietary fat. After discontinuation of the drug, fecal fat content usually returns to normal within 48–72 h.
Multiple randomized, double-blind, placebo-controlled studies have shown that, after 1 year, orlistat produces a weight loss of ~9–10%, whereas placebo recipients have a 4–6% weight loss. Because orlistat is minimally (<1%) absorbed from the gastrointestinal tract, it has no systemic side effects. The drug’s tolerability is related to the malabsorption of dietary fat and the subsequent passage of fat in the feces. Adverse gastrointestinal effects, including flatus with discharge, fecal urgency, fatty/oily stool, and increased defecation, are reported in at least 10% of orlistat-treated patients. These side effects generally are experienced early, diminish as patients control their dietary fat intake, and only infrequently cause patients to withdraw from clinical trials. When taken concomitantly, psyllium mucilloid is helpful in controlling orlistat-induced gastrointestinal side effects. Because serum concentrations of the fat-soluble vitamins D and E and β-carotene may be reduced by orlistat treatment, vitamin supplements are recommended to prevent potential deficiencies. Orlistat was approved for over-the-counter use in 2007.
Antiobesity Drugs in Development Two additional medications are currently in development. Bupropion and naltrexone (ContraveTM)—a dopamine and norepinephrine reuptake inhibitor and an opioid receptor antagonist, respectively—are theoretically combined to dampen the motivation/reinforcement that food brings (dopamine effect) and the pleasure/palatability of eating (opioid effect). In the COR-1 randomized, double-blind, placebo-controlled trial, 1742 enrolled participants, who were 18–65 years of age and had BMIs of 30–45 kg/m2, were randomized to receive naltrexone (16 mg/d) plus bupropion (360 mg/d), naltrexone (32 mg/d) plus bupropion (360 mg/d), or placebo. Mean change in body weight for the three groups was 5.0%, 6.1%, and 1.3%, respectively. The most common adverse events were nausea, headache, constipation, dizziness, vomiting, and dry mouth. However, the FDA rejected the drug in 2011 because of cardiovascular concerns and concluded that a large-scale study of the long-term cardiovascular effects of naltrexone would be needed before approval could be considered.
Liraglutide, a glucagon-like peptide 1 receptor agonist currently approved for the treatment of type 2 diabetes, has independent weight loss effects via hypothalamic neural activation causing appetite suppression. In a double-blind, placebo-controlled trial, 564 adults with BMIs of 30–40 kg/m2 were randomized to receive once-daily SC liraglutide (1.2, 1.8, 2.4, or 3.0 mg), placebo, or open-label orlistat (120 mg tid) for 1 year. The liraglutide and placebo recipients were switched to 2.4 mg of liraglutide during the second year and then to 3.0 mg for an additional year. One-year placebo-subtracted mean weight loss was 5.8 kg for liraglutide and 3.8 kg more than those on orlistat. The most common side effects were nausea, vomiting, and change in bowel habits.
SURGERY
Bariatric surgery (Fig. 416-2) can be considered for patients with severe obesity (BMI, ≥40 kg/m2) or for those with moderate obesity (BMI, ≥35 kg/m2) associated with a serious medical condition. Weight loss surgeries have traditionally been classified into three categories on the basis of anatomic changes: restrictive, restrictive malabsorptive, and malabsorptive. More recently, however, the clinical benefits of bariatric surgery in achieving weight loss and alleviating metabolic comorbidities have been attributed largely to changes in the physiologic responses of gut hormones and in adipose tissue metabolism. Metabolic effects resulting from bypassing the foregut include altered responses of ghrelin, glucagon-like peptide 1, peptide YY3-36, and oxyntonodulin. Additional effects on food intake and body weight control may be attributed to changes in vagal signaling. The loss of fat mass, particularly visceral fat, is associated with multiple metabolic, adipokine, and inflammatory changes that include improved insulin sensitivity and glucose disposal; reduced free fatty acid flux; increased adiponectin levels; and decreased interleukin 6, tumor necrosis factor α, and high-sensitivity C-reactive protein levels.
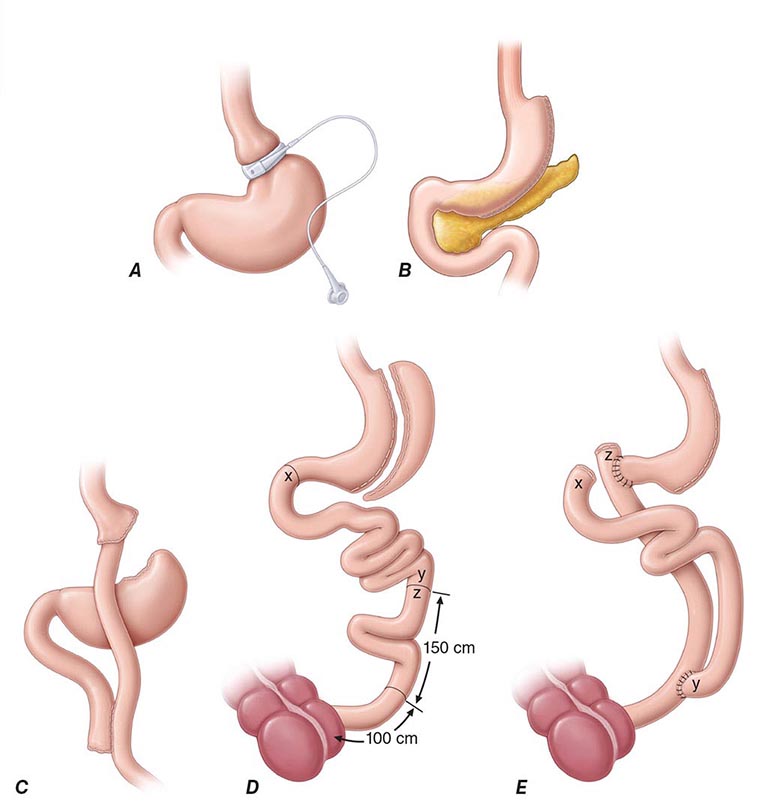
FIGURE 416-2 Bariatric surgical procedures. Examples of operative interventions used for surgical manipulation of the gastrointestinal tract. A. Laparoscopic adjustable gastric banding. B. Laparoscopic sleeve gastrectomy. C. The Roux-en-Y gastric bypass. D. Biliopancreatic diversion with duodenal switch. E. Biliopancreatic diversion. (From ML Kendrick, GF Dakin: Mayo Clin Proc 815:518, 2006; with permission.)
Restrictive surgeries limit the amount of food the stomach can hold and slow the rate of gastric emptying. Laparoscopic adjustable gastric banding is the prototype of this category. The first banding device, the LAP-BAND, was approved for use in the United States in 2001 and the second, the REALIZE band, in 2007. In contrast to previous devices, these bands have diameters that are adjustable by way of their connection to a reservoir that is implanted under the skin. Injection of saline into the reservoir and removal of saline from the reservoir tighten and loosen the band’s internal diameter, respectively, thus changing the size of the gastric opening. The mean percentage of total body weight lost at 5 years is estimated at 20–25%. In laparoscopic sleeve gastrectomy, the stomach is restricted by stapling and dividing it vertically, removing ~80% of the greater curvature, and leaving a slim banana-shaped remnant stomach along the lesser curvature. Weight loss after this procedure is superior to that after laparoscopic adjustable gastric banding.
The three restrictive-malabsorptive bypass procedures combine the elements of gastric restriction and selective malabsorption. These procedures are Roux-en-Y gastric bypass, biliopancreatic diversion, and biliopancreatic diversion with duodenal switch (Fig. 416-2). Roux-en-Y is the most commonly undertaken and most accepted bypass procedure. It may be performed with an open incision or by laparoscopy.
These procedures generally produce a 30–35% average total body weight loss that is maintained in nearly 60% of patients at 5 years. In general, mean weight loss is greater after the combined restrictive-malabsorptive procedures than after the restrictive procedures. Significant improvement in multiple obesity-related comorbid conditions, including type 2 diabetes, hypertension, dyslipidemia, obstructive sleep apnea, quality of life, and long-term cardiovascular events, has been reported. A meta-analysis of controlled clinical trials comparing bariatric surgery versus no surgery showed that surgery was associated with a reduced odds ratio (OR) risk of global mortality (OR = 0.55), cardiovascular death (OR = 0.58), and all-cause mortality (OR = 0.70).
Among the observed improvements in comorbidities, the prevention and treatment of type 2 diabetes resulting from bariatric surgery has garnered the most attention. Fifteen-year data from the Swedish Obese Subjects study demonstrated a marked reduction (i.e., by 78%) in the incidence of type 2 diabetes development among obese patients who underwent bariatric surgery. Several randomized controlled studies have shown greater weight loss and more improved glycemic control at 1 and 2 years among surgical patients than among patients receiving conventional medical therapy. A retrospective cohort study of more than 4000 adults with diabetes found that, overall, 68.2% of patients experienced an initial complete type 2 diabetes remission within 5 years after surgery. However, among these patients, one-third redeveloped type 2 diabetes within 5 years. The rapid improvement seen in diabetes after restrictive-malabsorptive procedures is thought to be due to surgery-specific, weight-independent effects on glucose homeostasis brought about by alteration of gut hormones.
The mortality rate from bariatric surgery is generally <1% but varies with the procedure, the patient’s age and comorbid conditions, and the experience of the surgical team. The most common surgical complications include stomal stenosis or marginal ulcers (occurring in 5–15% of patients) that present as prolonged nausea and vomiting after eating or inability to advance the diet to solid foods. These complications typically are treated by endoscopic balloon dilation and acid suppression therapy, respectively. For patients who undergo laparoscopic adjustable gastric banding, there are no intestinal absorptive abnormalities other than mechanical reduction in gastric size and outflow. Therefore, selective deficiencies are uncommon unless eating habits become unbalanced. In contrast, the restrictive-malabsorptive procedures carry an increased risk for micronutrient deficiencies of vitamin B12, iron, folate, calcium, and vitamin D. Patients with restrictive-malabsorptive procedures require lifelong supplementation with these micronutrients.
417 |
Diabetes Mellitus: Diagnosis, Classification, and Pathophysiology |
Diabetes mellitus (DM) refers to a group of common metabolic disorders that share the phenotype of hyperglycemia. Several distinct types of DM are caused by a complex interaction of genetics and environmental factors. Depending on the etiology of the DM, factors contributing to hyperglycemia include reduced insulin secretion, decreased glucose utilization, and increased glucose production. The metabolic dysregulation associated with DM causes secondary pathophysiologic changes in multiple organ systems that impose a tremendous burden on the individual with diabetes and on the health care system. In the United States, DM is the leading cause of end-stage renal disease (ESRD), nontraumatic lower extremity amputations, and adult blindness. It also predisposes to cardiovascular diseases. With an increasing incidence worldwide, DM will be likely a leading cause of morbidity and mortality in the future.
CLASSIFICATION
DM is classified on the basis of the pathogenic process that leads to hyperglycemia, as opposed to earlier criteria such as age of onset or type of therapy (Fig. 417-1). There are two broad categories of DM, designated type 1 and type 2 (Table 417-1). However, there is increasing recognition of other forms of diabetes in which the pathogenesis is better understood. These other forms of diabetes may share features of type 1 and/or type 2 DM. Both type 1 and type 2 DM are preceded by a phase of abnormal glucose homeostasis as the pathogenic processes progress. Type 1 DM is the result of complete or near-total insulin deficiency. Type 2 DM is a heterogeneous group of disorders characterized by variable degrees of insulin resistance, impaired insulin secretion, and increased glucose production. Distinct genetic and metabolic defects in insulin action and/or secretion give rise to the common phenotype of hyperglycemia in type 2 DM and have important potential therapeutic implications now that pharmacologic agents are available to target specific metabolic derangements. Type 2 DM is preceded by a period of abnormal glucose homeostasis classified as impaired fasting glucose (IFG) or impaired glucose tolerance (IGT).
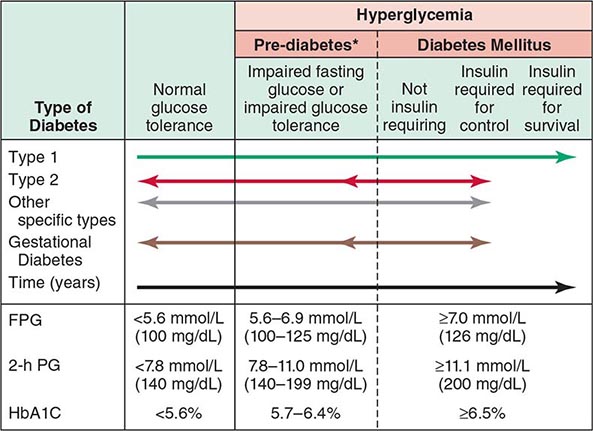
FIGURE 417-1 Spectrum of glucose homeostasis and diabetes mellitus (DM). The spectrum from normal glucose tolerance to diabetes in type 1 DM, type 2 DM, other specific types of diabetes, and gestational DM is shown from left to right. In most types of DM, the individual traverses from normal glucose tolerance to impaired glucose tolerance to overt diabetes (these should be viewed not as abrupt categories but as a spectrum). Arrows indicate that changes in glucose tolerance may be bidirectional in some types of diabetes. For example, individuals with type 2 DM may return to the impaired glucose tolerance category with weight loss; in gestational DM, diabetes may revert to impaired glucose tolerance or even normal glucose tolerance after delivery. The fasting plasma glucose (FPG), the 2-h plasma glucose (PG) after a glucose challenge, and the hemoglobin A1c (HbA1c) for the different categories of glucose tolerance are shown at the lower part of the figure. These values do not apply to the diagnosis of gestational DM. Some types of DM may or may not require insulin for survival. *Some use the term increased risk for diabetes or intermediate hyperglycemia (World Health Organization) rather than prediabetes. (Adapted from the American Diabetes Association, 2014.)
|
ETIOLOGIC CLASSIFICATION OF DIABETES MELLITUS |
Abbreviation: MODY, maturity-onset diabetes of the young.
Source: Adapted from American Diabetes Association: Diabetes Care 37(Suppl 1):S14, 2014.
Two features of the current classification of DM merit emphasis from previous classifications. First, the terms insulin-dependent diabetes mellitus (IDDM) and non-insulin-dependent diabetes mellitus (NIDDM) are obsolete. Because many individuals with type 2 DM eventually require insulin treatment for control of glycemia, the use of the term NIDDM generated considerable confusion. A second difference is that age or treatment modality is not a criterion. Although type 1 DM most commonly develops before the age of 30, an autoimmune beta cell destructive process can develop at any age. It is estimated that between 5 and 10% of individuals who develop DM after age 30 years have type 1 DM. Although type 2 DM more typically develops with increasing age, it is now being diagnosed more frequently in children and young adults, particularly in obese adolescents.
OTHER TYPES OF DM
Other etiologies for DM include specific genetic defects in insulin secretion or action, metabolic abnormalities that impair insulin secretion, mitochondrial abnormalities, and a host of conditions that impair glucose tolerance (Table 417-1). Maturity-onset diabetes of the young (MODY) and monogenic diabetes are subtypes of DM characterized by autosomal dominant inheritance, early onset of hyperglycemia (usually <25 years; sometimes in neonatal period), and impaired insulin secretion (discussed below). Mutations in the insulin receptor cause a group of rare disorders characterized by severe insulin resistance.
DM can result from pancreatic exocrine disease when the majority of pancreatic islets are destroyed. Cystic fibrosis–related DM is an important consideration in that patient population. Hormones that antagonize insulin action can also lead to DM. Thus, DM is often a feature of endocrinopathies such as acromegaly and Cushing’s disease. Viral infections have been implicated in pancreatic islet destruction but are an extremely rare cause of DM. A form of acute onset of type 1 diabetes, termed fulminant diabetes, has been noted in Japan and may be related to viral infection of islets.
GESTATIONAL DIABETES MELLITUS
Glucose intolerance developing during pregnancy is classified as gestational diabetes mellitus (GDM). Insulin resistance is related to the metabolic changes of late pregnancy, and the increased insulin requirements may lead to IGT or diabetes. GDM occurs in ~7% (range 1–14%) of pregnancies in the United States; most women revert to normal glucose tolerance postpartum but have a substantial risk (35–60%) of developing DM in the next 10–20 years. The International Association of the Diabetes and Pregnancy Study Groups and the American Diabetes Association (ADA) recommend that diabetes diagnosed at the initial prenatal visit should be classified as “overt” diabetes rather than GDM. With the rising rates of obesity, the number of women being diagnosed with GDM or overt diabetes is rising worldwide.
EPIDEMIOLOGY AND GLOBAL CONSIDERATIONS
 The worldwide prevalence of DM has risen dramatically over the past two decades, from an estimated 30 million cases in 1985 to 382 million in 2013 (Fig. 417-2). Based on current trends, the International Diabetes Federation projects that 592 million individuals will have diabetes by the year 2035 (see http://www.idf.org/). Although the prevalence of both type 1 and type 2 DM is increasing worldwide, the prevalence of type 2 DM is rising much more rapidly, presumably because of increasing obesity, reduced activity levels as countries become more industrialized, and the aging of the population. In 2013, the prevalence of diabetes in individuals from age 20–79 ranged from 23 to 37% in the 10 countries with the highest prevalence (Tuvalu, Federated States of Micronesia, Marshall Islands, Kiribati, Vanuatu, Cook Islands, Saudi Arabia, Nauru, Kuwait, and Qatar, in descending order of prevalence). The countries with the greatest number of individuals with diabetes in 2013 are China (98.4 million), India (65.1 million), United States (24.4 million), Brazil (11.9 million), and the Russian Federation (10.9 million). Up to 80% of individuals with diabetes live in low-income or medium-income countries. In the most recent estimate for the United States (2012), the Centers for Disease Control and Prevention (CDC) estimated that 9.3% of the population had diabetes (~28% of the individuals with diabetes were undiagnosed; globally, it is estimated that 50% of individuals may be undiagnosed). The CDC estimated that the incidence and prevalence of diabetes doubled from 1990–2008, but appears to have plateaued from 2008–2012. DM increases with age. In 2012, the prevalence of DM in the United Sates was estimated to be 0.2% in individuals age <20 years and 12% in individuals age >20 years. In individuals age >65 years, the prevalence of DM was 26.9%. The prevalence is similar in men and women throughout most age ranges (14% and 11%, respectively, in individuals age >20 years). Worldwide, most individuals with diabetes are between the ages of 40 and 59 years.

FIGURE 417-2 Worldwide prevalence of diabetes mellitus. Global estimate is 382 million individuals with diabetes. Regional estimates of the number of individuals with diabetes (20–79 years of age) are shown (2013). (Used with permission from the IDF Diabetes Atlas, the International Diabetes Federation, 2013.)
There is considerable geographic variation in the incidence of both type 1 and type 2 DM. Scandinavia has the highest incidence of type 1 DM; the lowest incidence is in the Pacific Rim where it is 20- to 30-fold lower. Northern Europe and the United States have an intermediate rate. Much of the increased risk of type 1 DM is believed to reflect the frequency of high-risk human leukocyte antigen (HLA) alleles among ethnic groups in different geographic locations. The prevalence of type 2 DM and its harbinger, IGT, is highest in certain Pacific islands and the Middle East and intermediate in countries such as India and the United States. This variability is likely due to genetic, behavioral, and environmental factors. DM prevalence also varies among different ethnic populations within a given country, with indigenous populations usually having a greater incidence of diabetes than the general population of the country. For example, the CDC estimated that the age-adjusted prevalence of DM in the United States (age >20 years; 2010–2012) was 8% in non-Hispanic whites, 9% in Asian Americans, 13% in Hispanics, 13% in non-Hispanic blacks, and 16% in American-Indian and Alaskan native populations. The onset of type 2 DM occurs, on average, at an earlier age in ethnic groups other than non-Hispanic whites. In Asia, the prevalence of diabetes is increasing rapidly, and the diabetes phenotype appears to be somewhat different from that in the United States and Europe, with an onset at a lower body mass index (BMI) and younger age, greater visceral adiposity, and reduced insulin secretory capacity.
Diabetes is a major cause of mortality, but several studies indicate that diabetes is likely underreported as a cause of death. In the United States, diabetes was listed as the seventh leading cause of death in 2010. A recent estimate suggested that diabetes was responsible for almost 5.1 million deaths or 8% of deaths worldwide in 2013. In 2013, it was estimated that $548 billion or 11% of health care expenditures worldwide were spent on individuals with diabetes.
DIAGNOSIS
Glucose tolerance is classified into three broad categories: normal glucose homeostasis, DM, or impaired glucose homeostasis. Glucose tolerance can be assessed using the fasting plasma glucose (FPG), the response to oral glucose challenge, or the hemoglobin A1c (HbA1c). An FPG <5.6 mmol/L (100 mg/dL), a plasma glucose <140 mg/dL (11.1 mmol/L) following an oral glucose challenge, and an HbA1c <5.7% are considered to define normal glucose tolerance. The International Expert Committee with members appointed by the ADA, the European Association for the Study of Diabetes, and the International Diabetes Federation have issued diagnostic criteria for DM (Table 417-2) based on the following premises: (1) the FPG, the response to an oral glucose challenge (oral glucose tolerance test [OGTT]), and HbA1c differ among individuals, and (2) DM is defined as the level of glycemia at which diabetes-specific complications occur rather than on deviations from a population-based mean. For example, the prevalence of retinopathy in Native Americans (Pima Indian population) begins to increase at an FPG >6.4 mmol/L (116 mg/dL) (Fig. 417-3).
|
CRITERIA FOR THE DIAGNOSIS OF DIABETES MELLITUS |
aRandom is defined as without regard to time since the last meal. bFasting is defined as no caloric intake for at least 8 h. cHemoglobin A1c test should be performed in a laboratory using a method approved by the National Glycohemoglobin Standardization Program and correlated to the reference assay of the Diabetes Control and Complications Trial. Point-of-care hemoglobin A1c should not be used for diagnostic purposes. dThe test should be performed using a glucose load containing the equivalent of 75 g anhydrous glucose dissolved in water, not recommended for routine clinical use.
Note: In the absence of unequivocal hyperglycemia and acute metabolic decompensation, these criteria should be confirmed by repeat testing on a different day.
Source: Adapted from American Diabetes Association: Diabetes Care 37(Suppl 1):S14, 2014.
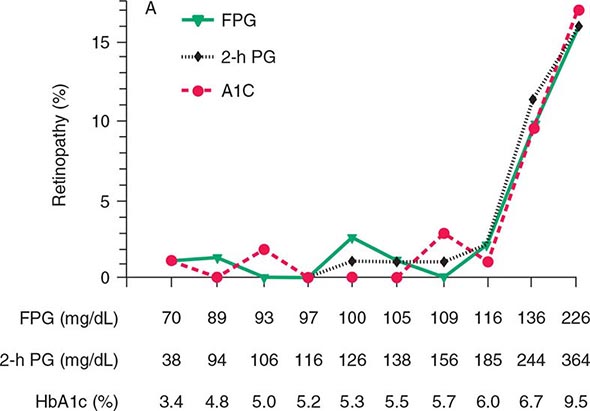
FIGURE 417-3 Relationship of diabetes-specific complication and glucose tolerance. This figure shows the incidence of retinopathy in Pima Indians as a function of the fasting plasma glucose (FPG), the 2-h plasma glucose after a 75-g oral glucose challenge (2-h PG), or the hemoglobin A1c (HbA1c). Note that the incidence of retinopathy greatly increases at a fasting plasma glucose >116 mg/dL, a 2-h plasma glucose of 185 mg/dL, or an HbA1c >6.5%. (Blood glucose values are shown in mg/dL; to convert to mmol/L, divide value by 18.) (Copyright 2002, American Diabetes Association. From Diabetes Care 25[Suppl 1]: S5–S20, 2002.)
An FPG ≥7.0 mmol/L (126 mg/dL), a glucose ≥11.1 mmol/L (200 mg/dL) 2 h after an oral glucose challenge, or an HbA1c ≥6.5% warrants the diagnosis of DM (Table 417-2). A random plasma glucose concentration ≥11.1 mmol/L (200 mg/dL) accompanied by classic symptoms of DM (polyuria, polydipsia, weight loss) is also sufficient for the diagnosis of DM (Table 417-2).
Abnormal glucose homeostasis (Fig. 417-1) is defined as (1) FPG = 5.6–6.9 mmol/L (100–125 mg/dL), which is defined as impaired fasting glucose (IFG); (2) plasma glucose levels between 7.8 and 11 mmol/L (140 and 199 mg/dL) following an oral glucose challenge, which is termed impaired glucose tolerance (IGT); or (3) HbA1c of 5.7–6.4%. An HbA1c of 5.7–6.4%, IFG, and IGT do not identify the same individuals, but individuals in all three groups are at greater risk of progressing to type 2 DM, have an increased risk of cardiovascular disease, and should be counseled about ways to decrease these risks (see below). Some use the terms prediabetes, increased risk of diabetes, or intermediate hyperglycemia (World Health Organization) for this category. These values for the fasting plasma glucose, the glucose following an oral glucose challenge, and HbA1c are continuous variables and not discrete categories. The current criteria for the diagnosis of DM emphasize the HbA1c or the FPG as the most reliable and convenient tests for identifying DM in asymptomatic individuals (however, some individuals may meet criteria for one test but not the other). OGTT, although still a valid means for diagnosing DM, is not often used in routine clinical care.
The diagnosis of DM has profound implications for an individual from both a medical and a financial standpoint. Thus, abnormalities on screening tests for diabetes should be repeated before making a definitive diagnosis of DM, unless acute metabolic derangements or a markedly elevated plasma glucose are present (Table 417-2). These criteria also allow for the diagnosis of DM to be withdrawn in situations when the glucose intolerance reverts to normal.
SCREENING
Widespread use of the FPG or the HbA1c as a screening test for type 2 DM is recommended because (1) a large number of individuals who meet the current criteria for DM are asymptomatic and unaware that they have the disorder, (2) epidemiologic studies suggest that type 2 DM may be present for up to a decade before diagnosis, (3) some individuals with type 2 DM have one or more diabetes-specific complications at the time of their diagnosis, (4) treatment of type 2 DM may favorably alter the natural history of DM, diagnosis of prediabetes should spur efforts for diabetes prevention. The ADA recommends screening all individuals >45 years every 3 years and screening individuals at an earlier age if they are overweight (BMI >25 kg/m2 or ethnically relevant definition for overweight) and have one additional risk factor for diabetes (Table 417-3). In contrast to type 2 DM, a long asymptomatic period of hyperglycemia is rare prior to the diagnosis of type 1 DM. A number of immunologic markers for type 1 DM are becoming available (discussed below), but their routine use outside a clinical trial is discouraged, pending the identification of clinically beneficial interventions for individuals at high risk for developing type 1 DM.
|
RISK FACTORS FOR TYPE 2 DIABETES MELLITUS |
Abbreviations: BMI, body mass index; GDM, gestational diabetes mellitus; HDL, high-density lipoprotein; IFG, impaired fasting glucose; IGT, impaired glucose tolerance.
Source: Adapted from American Diabetes Association: Diabetes Care 37(Suppl 1):S14, 2014.
REGULATION OF GLUCOSE HOMEOSTASIS
OVERALL REGULATION OF GLUCOSE HOMEOSTASIS
Glucose homeostasis reflects a balance between hepatic glucose production and peripheral glucose uptake and utilization. Insulin is the most important regulator of this metabolic equilibrium, but neural input, metabolic signals, and other hormones (e.g., glucagon) result in integrated control of glucose supply and utilization (Fig. 417-4). The organs that regulate glucose and lipids communicate by neural and humoral mechanisms with fat and muscle producing adipokines, myokines, and metabolites that influence liver function. In the fasting state, low insulin levels increase glucose production by promoting hepatic gluconeogenesis and glycogenolysis and reduce glucose uptake in insulin-sensitive tissues (skeletal muscle and fat), thereby promoting mobilization of stored precursors such as amino acids and free fatty acids (lipolysis). Glucagon, secreted by pancreatic alpha cells when blood glucose or insulin levels are low, stimulates glycogenolysis and gluconeogenesis by the liver and renal medulla (Chap. 420). Postprandially, the glucose load elicits a rise in insulin and fall in glucagon, leading to a reversal of these processes. Insulin, an anabolic hormone, promotes the storage of carbohydrate and fat and protein synthesis. The major portion of postprandial glucose is used by skeletal muscle, an effect of insulin-stimulated glucose uptake. Other tissues, most notably the brain, use glucose in an insulin-independent fashion. Factors secreted by skeletal myocytes (irisin), adipocytes (leptin, resistin, adiponectin, etc.), and bone also influence glucose homeostasis.
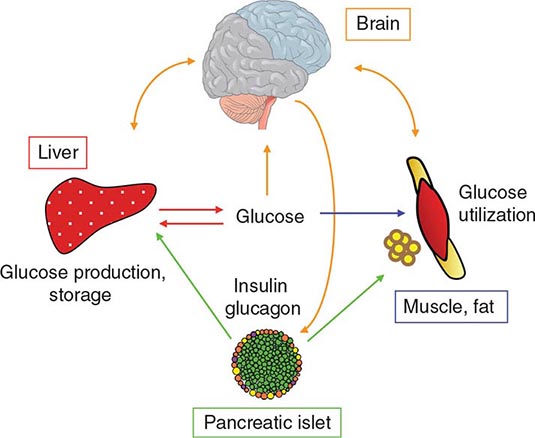
FIGURE 417-4 Regulation of glucose homeostasis. The organs shown contribute to glucose utilization, production, or storage. See text for a description of the communications (arrows), which can be neural or humoral.
INSULIN BIOSYNTHESIS
Insulin is produced in the beta cells of the pancreatic islets. It is initially synthesized as a single-chain 86-amino-acid precursor polypeptide, preproinsulin. Subsequent proteolytic processing removes the amino-terminal signal peptide, giving rise to proinsulin. Proinsulin is structurally related to insulin-like growth factors I and II, which bind weakly to the insulin receptor. Cleavage of an internal 31-residue fragment from proinsulin generates the C peptide and the A (21 amino acids) and B (30 amino acids) chains of insulin, which are connected by disulfide bonds. The mature insulin molecule and C peptide are stored together and co-secreted from secretory granules in the beta cells. Because C peptide is cleared more slowly than insulin, it is a useful marker of insulin secretion and allows discrimination of endogenous and exogenous sources of insulin in the evaluation of hypoglycemia (Chaps. 420 and 113). Pancreatic beta cells co-secrete islet amyloid polypeptide (IAPP) or amylin, a 37-amino-acid peptide, along with insulin. The role of IAPP in normal physiology is incompletely defined, but it is the major component of the amyloid fibrils found in the islets of patients with type 2 diabetes, and an analogue is sometimes used in treating type 1 and type 2 DM. Human insulin is produced by recombinant DNA technology; structural alterations at one or more amino acid residues modify its physical and pharmacologic characteristics (Chap. 418).
INSULIN SECRETION
Glucose is the key regulator of insulin secretion by the pancreatic beta cell, although amino acids, ketones, various nutrients, gastrointestinal peptides, and neurotransmitters also influence insulin secretion. Glucose levels >3.9 mmol/L (70 mg/dL) stimulate insulin synthesis, primarily by enhancing protein translation and processing. Glucose stimulation of insulin secretion begins with its transport into the beta cell by a facilitative glucose transporter (Fig. 417-5). Glucose phosphorylation by glucokinase is the rate-limiting step that controls glucose-regulated insulin secretion. Further metabolism of glucose-6-phosphate via glycolysis generates ATP, which inhibits the activity of an ATP-sensitive K+ channel. This channel consists of two separate proteins: one is the binding site for certain oral hypoglycemics (e.g., sulfonylureas, meglitinides); the other is an inwardly rectifying K+ channel protein (Kir6.2). Inhibition of this K+ channel induces beta cell membrane depolarization, which opens voltage-dependent calcium channels (leading to an influx of calcium) and stimulates insulin secretion. Insulin secretory profiles reveal a pulsatile pattern of hormone release, with small secretory bursts occurring about every 10 min, superimposed upon greater amplitude oscillations of about 80–150 min. Incretins are released from neuroendocrine cells of the gastrointestinal tract following food ingestion and amplify glucose-stimulated insulin secretion and suppress glucagon secretion. Glucagon-like peptide 1 (GLP-1), the most potent incretin, is released from L cells in the small intestine and stimulates insulin secretion only when the blood glucose is above the fasting level. Incretin analogues or pharmacologic agents that prolong the activity of endogenous GLP-1 enhance insulin secretion.
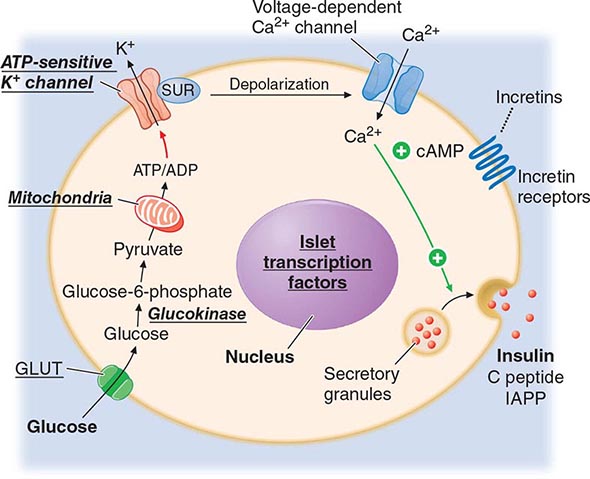
FIGURE 417-5 Mechanisms of glucose-stimulated insulin secretion and abnormalities in diabetes. Glucose and other nutrients regulate insulin secretion by the pancreatic beta cell. Glucose is transported by a glucose transporter (GLUT1 and/or GLUT2 in humans, GLUT2 in rodents); subsequent glucose metabolism by the beta cell alters ion channel activity, leading to insulin secretion. The SUR receptor is the binding site for some drugs that act as insulin secretagogues. Mutations in the events or proteins underlined are a cause of monogenic forms of diabetes. ADP, adenosine diphosphate; ATP, adenosine triphosphate; cAMP, cyclic adenosine monophosphate; IAPP, islet amyloid polypeptide or amylin; SUR, sulfonylurea receptor.
INSULIN ACTION
Once insulin is secreted into the portal venous system, ~50% is removed and degraded by the liver. Unextracted insulin enters the systemic circulation where it binds to receptors in target sites. Insulin binding to its receptor stimulates intrinsic tyrosine kinase activity, leading to receptor autophosphorylation and the recruitment of intracellular signaling molecules, such as insulin receptor substrates (IRS). IRS and other adaptor proteins initiate a complex cascade of phosphorylation and dephosphorylation reactions, resulting in the widespread metabolic and mitogenic effects of insulin. As an example, activation of the phosphatidylinositol-3′-kinase (PI-3-kinase) pathway stimulates translocation of a facilitative glucose transporter (e.g., GLUT4) to the cell surface, an event that is crucial for glucose uptake by skeletal muscle and fat. Activation of other insulin receptor signaling pathways induces glycogen synthesis, protein synthesis, lipogenesis, and regulation of various genes in insulin-responsive cells.
PATHOGENESIS
TYPE 1 DM
Type 1 DM is the result of interactions of genetic, environmental, and immunologic factors that ultimately lead to the destruction of the pancreatic beta cells and insulin deficiency. Type 1 DM, which can develop at any age, develops most commonly before 20 years of age. Worldwide, the incidence of type 1 DM is increasing at the rate of 3–4% per year for uncertain reasons. Type 1 DM results from autoimmune beta cell destruction, and most, but not all, individuals have evidence of islet-directed autoimmunity. Some individuals who have the clinical phenotype of type 1 DM lack immunologic markers indicative of an autoimmune process involving the beta cells and the genetic markers of type 1 DM. These individuals are thought to develop insulin deficiency by unknown, nonimmune mechanisms and may be ketosis prone; many are African American or Asian in heritage. The temporal development of type 1 DM is shown schematically as a function of beta cell mass in Fig. 417-6. Individuals with a genetic susceptibility are thought to have normal beta cell mass at birth but begin to lose beta cells secondary to autoimmune destruction that occurs over months to years. This autoimmune process is thought to be triggered by an infectious or environmental stimulus and to be sustained by a beta cell–specific molecule. In the majority of patients, immunologic markers appear after the triggering event but before diabetes becomes clinically overt. Beta cell mass then begins to decrease, and insulin secretion progressively declines, although normal glucose tolerance is maintained. The rate of decline in beta cell mass varies widely among individuals, with some patients progressing rapidly to clinical diabetes and others evolving more slowly. Features of diabetes do not become evident until a majority of beta cells are destroyed (70–80%). At this point, residual functional beta cells exist but are insufficient in number to maintain glucose tolerance. The events that trigger the transition from glucose intolerance to frank diabetes are often associated with increased insulin requirements, as might occur during infections or puberty. After the initial clinical presentation of type 1 DM, a “honeymoon” phase may ensue during which time glycemic control is achieved with modest doses of insulin or, rarely, insulin is not needed. However, this fleeting phase of endogenous insulin production from residual beta cells disappears and the individual becomes insulin deficient. Many individuals with long-standing type 1 DM produce a small amount of insulin (as reflected by C-peptide production), and some individuals with more than 50 years of type 1 DM have insulin-positive cells in the pancreas at autopsy.
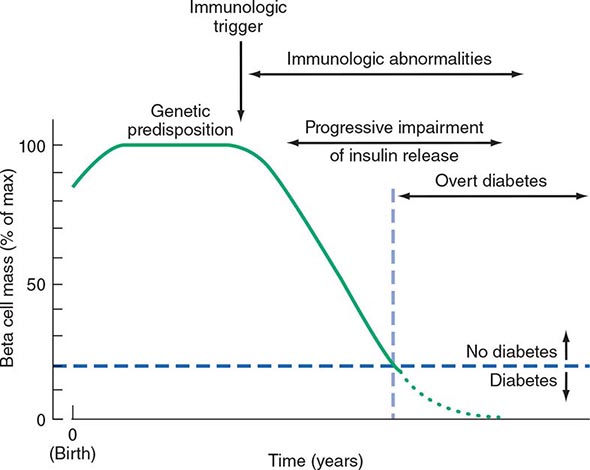
FIGURE 417-6 Temporal model for development of type 1 diabetes. Individuals with a genetic predisposition are exposed to a trigger that initiates an autoimmune process, resulting in a gradual decline in beta cell mass. The downward slope of the beta cell mass varies among individuals and may not be continuous. This progressive impairment in insulin release results in diabetes when ~80% of the beta cell mass is destroyed. A “honeymoon” phase may be seen in the first 1 or 2 years after the onset of diabetes and is associated with reduced insulin requirements. (Adapted from ER Kaufman: Medical Management of Type 1 Diabetes, 6th ed. American Diabetes Association, Alexandria, VA, 2012.)
GENETIC CONSIDERATIONS
![]() Susceptibility to type 1 DM involves multiple genes. The concordance of type 1 DM in identical twins ranges between 40 and 60%, indicating that additional modifying factors are likely involved in determining whether diabetes develops. The major susceptibility gene for type 1 DM is located in the HLA region on chromosome 6. Polymorphisms in the HLA complex account for 40–50% of the genetic risk of developing type 1 DM. This region contains genes that encode the class II major histocompatibility complex (MHC) molecules, which present antigen to helper T cells and thus are involved in initiating the immune response (Chap. 373e). The ability of class II MHC molecules to present antigen is dependent on the amino acid composition of their antigen-binding sites. Amino acid substitutions may influence the specificity of the immune response by altering the binding affinity of different antigens for class II molecules.
Susceptibility to type 1 DM involves multiple genes. The concordance of type 1 DM in identical twins ranges between 40 and 60%, indicating that additional modifying factors are likely involved in determining whether diabetes develops. The major susceptibility gene for type 1 DM is located in the HLA region on chromosome 6. Polymorphisms in the HLA complex account for 40–50% of the genetic risk of developing type 1 DM. This region contains genes that encode the class II major histocompatibility complex (MHC) molecules, which present antigen to helper T cells and thus are involved in initiating the immune response (Chap. 373e). The ability of class II MHC molecules to present antigen is dependent on the amino acid composition of their antigen-binding sites. Amino acid substitutions may influence the specificity of the immune response by altering the binding affinity of different antigens for class II molecules.
Most individuals with type 1 DM have the HLA DR3 and/or DR4 haplotype. Refinements in genotyping of HLA loci have shown that the haplotypes DQA1*0301, DQB1*0302, and DQB1*0201 are most strongly associated with type 1 DM. These haplotypes are present in 40% of children with type 1 DM as compared to 2% of the normal U.S. population. However, most individuals with predisposing haplotypes do not develop diabetes.
In addition to MHC class II associations, genome association studies have identified at least 20 different genetic loci that contribute susceptibility to type 1 DM (polymorphisms in the promoter region of the insulin gene, the CTLA-4 gene, interleukin 2 receptor, CTLA4, and PTPN22, etc.). Genes that confer protection against the development of the disease also exist. The haplotype DQA1*0102, DQB1*0602 is extremely rare in individuals with type 1 DM (<1%) and appears to provide protection from type 1 DM.
Although the risk of developing type 1 DM is increased tenfold in relatives of individuals with the disease, the risk is relatively low: 3–4% if the parent has type 1 DM and 5–15% in a sibling (depending on which HLA haplotypes are shared). Hence, most individuals with type 1 DM do not have a first-degree relative with this disorder.
Pathophysiology Although other islet cell types (alpha cells [glucagon-producing], delta cells [somatostatin-producing], or PP cells [pancreatic polypeptide-producing]) are functionally and embryologically similar to beta cells and express most of the same proteins as beta cells, they are spared from the autoimmune destruction. Pathologically, the pancreatic islets have a modest infiltration of lymphocytes (a process termed insulitis). After beta cells are destroyed, it is thought that the inflammatory process abates and the islets become atrophic. Studies of the autoimmune process in humans and in animal models of type 1 DM (NOD mouse and BB rat) have identified the following abnormalities in the humoral and cellular arms of the immune system: (1) islet cell autoantibodies; (2) activated lymphocytes in the islets, peripancreatic lymph nodes, and systemic circulation; (3) T lymphocytes that proliferate when stimulated with islet proteins; and (4) release of cytokines within the insulitis. Beta cells seem to be particularly susceptible to the toxic effect of some cytokines (tumor necrosis factor α [TNF-α], interferon γ, and interleukin 1 [IL-1]). The precise mechanisms of beta cell death are not known but may involve formation of nitric oxide metabolites, apoptosis, and direct CD8+ T cell cytotoxicity. The islet destruction is mediated by T lymphocytes rather than islet autoantibodies, as these antibodies do not generally react with the cell surface of islet cells and are not capable of transferring DM to animals. Efforts to suppress the autoimmune process at the time of diagnosis of diabetes have largely been ineffective or only temporarily effective in slowing beta cell destruction.
Pancreatic islet molecules targeted by the autoimmune process include insulin, glutamic acid decarboxylase (GAD; the biosynthetic enzyme for the neurotransmitter GABA), ICA-512/IA-2 (homology with tyrosine phosphatases), and a beta cell–specific zinc transporter (ZnT-8). Most of the autoantigens are not beta cell–specific, which raises the question of how the beta cells are selectively destroyed. Current theories favor initiation of an autoimmune process directed at one beta cell molecule, which then spreads to other islet molecules as the immune process destroys beta cells and creates a series of secondary autoantigens. The beta cells of individuals who develop type 1 DM do not differ from beta cells of normal individuals because islets transplanted from a genetically identical twin are destroyed by a recurrence of the autoimmune process of type 1 DM.
Immunologic Markers Islet cell autoantibodies (ICAs) are a composite of several different antibodies directed at pancreatic islet molecules such as GAD, insulin, IA-2/ICA-512, and ZnT-8, and serve as a marker of the autoimmune process of type 1 DM. Assays for autoantibodies to GAD-65 are commercially available. Testing for ICAs can be useful in classifying the type of DM as type 1 and in identifying nondiabetic individuals at risk for developing type 1 DM. ICAs are present in the majority of individuals (>85%) diagnosed with new-onset type 1 DM, in a significant minority of individuals with newly diagnosed type 2 DM (5–10%), and occasionally in individuals with GDM (<5%). ICAs are present in 3–4% of first-degree relatives of individuals with type 1 DM. In combination with impaired insulin secretion after IV glucose tolerance testing, they predict a >50% risk of developing type 1 DM within 5 years. At present, the measurement of ICAs in nondiabetic individuals is a research tool because no treatments have been demonstrated to prevent the occurrence or progression to type 1 DM.
Environmental Factors Numerous environmental events have been proposed to trigger the autoimmune process in genetically susceptible individuals; however, none have been conclusively linked to diabetes. Identification of an environmental trigger has been difficult because the event may precede the onset of DM by several years (Fig. 417-6). Putative environmental triggers include viruses (coxsackie, rubella, enteroviruses most prominently), bovine milk proteins, and nitrosourea compounds. There is increasing interest in the microbiome and type 1 diabetes (Chap. 86e).
Prevention of Type 1 DM A number of interventions have prevented diabetes in animal models. None of these interventions have been successful in preventing type 1 DM in humans. For example, the Diabetes Prevention Trial–Type 1 concluded that administering insulin (IV or PO) to individuals at high risk for developing type 1 DM did not prevent type 1 DM. This is an area of active clinical investigation.
TYPE 2 DM
Insulin resistance and abnormal insulin secretion are central to the development of type 2 DM. Although the primary defect is controversial, most studies support the view that insulin resistance precedes an insulin secretory defect but that diabetes develops only when insulin secretion becomes inadequate. Type 2 DM likely encompasses a range of disorders with common phenotype of hyperglycemia. Most of our current understanding (and the discussion below) of the pathophysiology and genetics is based on studies of individuals of European descent. It is becoming increasing apparent that DM in other ethnic groups (Asian, African, and Latin American) has a somewhat different, but yet undefined, pathophysiology. In general, Latinos have greater insulin resistance and East Asians and South Asians have more beta cell dysfunction, but both defects are present in both populations. East and South Asians appear to develop type 2 DM at a younger age and a lower BMI. In some groups, DM that is ketosis prone (often obese) or ketosis-resistant (often lean) is seen.
GENETIC CONSIDERATIONS
![]() Type 2 DM has a strong genetic component. The concordance of type 2 DM in identical twins is between 70 and 90%. Individuals with a parent with type 2 DM have an increased risk of diabetes; if both parents have type 2 DM, the risk approaches 40%. Insulin resistance, as demonstrated by reduced glucose utilization in skeletal muscle, is present in many nondiabetic, first-degree relatives of individuals with type 2 DM. The disease is polygenic and multifactorial, because in addition to genetic susceptibility, environmental factors (such as obesity, nutrition, and physical activity) modulate the phenotype. The in utero environment also contributes, and either increased or reduced birth weight increases the risk of type 2 DM in adult life. The genes that predispose to type 2 DM are incompletely identified, but recent genome-wide association studies have identified a large number of genes that convey a relatively small risk for type 2 DM (>70 genes, each with a relative risk of 1.06–1.5). Most prominent is a variant of the transcription factor 7–like 2 gene that has been associated with type 2 DM in several populations and with IGT in one population at high risk for diabetes. Genetic polymorphisms associated with type 2 DM have also been found in the genes encoding the peroxisome proliferator–activated receptor γ, inward rectifying potassium channel, zinc transporter, IRS, and calpain 10. The mechanisms by which these genetic loci increase the susceptibility to type 2 DM are not clear, but most are predicted to alter islet function or development or insulin secretion. Although the genetic susceptibility to type 2 DM is under active investigation (it is estimated that <10% of genetic risk is determined by loci identified thus far), it is currently not possible to use a combination of known genetic loci to predict type 2 DM.
Type 2 DM has a strong genetic component. The concordance of type 2 DM in identical twins is between 70 and 90%. Individuals with a parent with type 2 DM have an increased risk of diabetes; if both parents have type 2 DM, the risk approaches 40%. Insulin resistance, as demonstrated by reduced glucose utilization in skeletal muscle, is present in many nondiabetic, first-degree relatives of individuals with type 2 DM. The disease is polygenic and multifactorial, because in addition to genetic susceptibility, environmental factors (such as obesity, nutrition, and physical activity) modulate the phenotype. The in utero environment also contributes, and either increased or reduced birth weight increases the risk of type 2 DM in adult life. The genes that predispose to type 2 DM are incompletely identified, but recent genome-wide association studies have identified a large number of genes that convey a relatively small risk for type 2 DM (>70 genes, each with a relative risk of 1.06–1.5). Most prominent is a variant of the transcription factor 7–like 2 gene that has been associated with type 2 DM in several populations and with IGT in one population at high risk for diabetes. Genetic polymorphisms associated with type 2 DM have also been found in the genes encoding the peroxisome proliferator–activated receptor γ, inward rectifying potassium channel, zinc transporter, IRS, and calpain 10. The mechanisms by which these genetic loci increase the susceptibility to type 2 DM are not clear, but most are predicted to alter islet function or development or insulin secretion. Although the genetic susceptibility to type 2 DM is under active investigation (it is estimated that <10% of genetic risk is determined by loci identified thus far), it is currently not possible to use a combination of known genetic loci to predict type 2 DM.
Pathophysiology Type 2 DM is characterized by impaired insulin secretion, insulin resistance, excessive hepatic glucose production, and abnormal fat metabolism. Obesity, particularly visceral or central (as evidenced by the hip-waist ratio), is very common in type 2 DM (≥80% of patients are obese). In the early stages of the disorder, glucose tolerance remains near-normal, despite insulin resistance, because the pancreatic beta cells compensate by increasing insulin output (Fig. 417-7). As insulin resistance and compensatory hyperinsulinemia progress, the pancreatic islets in certain individuals are unable to sustain the hyperinsulinemic state. IGT, characterized by elevations in postprandial glucose, then develops. A further decline in insulin secretion and an increase in hepatic glucose production lead to overt diabetes with fasting hyperglycemia. Ultimately, beta cell failure ensues. Although both insulin resistance and impaired insulin secretion contribute to the pathogenesis of type 2 DM, the relative contribution of each varies from individual to individual.
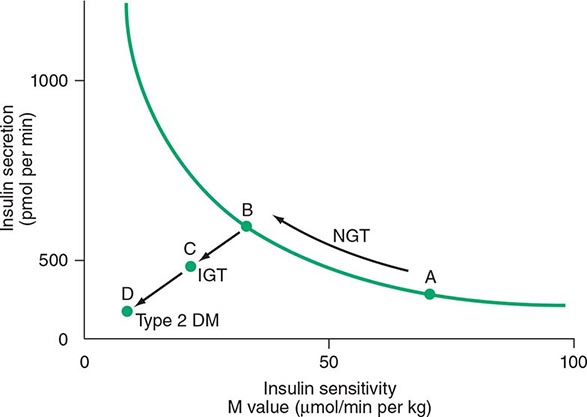
FIGURE 417-7 Metabolic changes during the development of type 2 diabetes mellitus (DM). Insulin secretion and insulin sensitivity are related, and as an individual becomes more insulin resistant (by moving from point A to point B), insulin secretion increases. A failure to compensate by increasing the insulin secretion results initially in impaired glucose tolerance (IGT; point C) and ultimately in type 2 DM (point D). NGT, normal glucose tolerance. (Adapted from SE Kahn: J Clin Endocrinol Metab 86:4047, 2001; RN Bergman, M Ader: Trends Endocrinol Metab 11:351, 2000.)
Metabolic Abnormalities • ABNORMAL MUSCLE AND FAT METABOLISM Insulin resistance, the decreased ability of insulin to act effectively on target tissues (especially muscle, liver, and fat), is a prominent feature of type 2 DM and results from a combination of genetic susceptibility and obesity. Insulin resistance is relative, however, because supranormal levels of circulating insulin will normalize the plasma glucose. Insulin dose-response curves exhibit a rightward shift, indicating reduced sensitivity, and a reduced maximal response, indicating an overall decrease in maximum glucose utilization (30–60% lower than in normal individuals). Insulin resistance impairs glucose utilization by insulin-sensitive tissues and increases hepatic glucose output; both effects contribute to the hyperglycemia. Increased hepatic glucose output predominantly accounts for increased FPG levels, whereas decreased peripheral glucose usage results in postprandial hyperglycemia. In skeletal muscle, there is a greater impairment in nonoxidative glucose usage (glycogen formation) than in oxidative glucose metabolism through glycolysis. Glucose metabolism in insulin-independent tissues is not altered in type 2 DM.
The precise molecular mechanism leading to insulin resistance in type 2 DM has not been elucidated. Insulin receptor levels and tyrosine kinase activity in skeletal muscle are reduced, but these alterations are most likely secondary to hyperinsulinemia and are not a primary defect. Therefore, “postreceptor” defects in insulin-regulated phosphorylation/dephosphorylation appear to play the predominant role in insulin resistance. Abnormalities include the accumulation of lipid within skeletal myocytes, which may impair mitochondrial oxidative phosphorylation and reduce insulin-stimulated mitochondrial ATP production. Impaired fatty acid oxidation and lipid accumulation within skeletal myocytes also may generate reactive oxygen species such as lipid peroxides. Of note, not all insulin signal transduction pathways are resistant to the effects of insulin (e.g., those controlling cell growth and differentiation using the mitogenic-activated protein kinase pathway). Consequently, hyperinsulinemia may increase the insulin action through these pathways, potentially accelerating diabetes-related conditions such as atherosclerosis.
The obesity accompanying type 2 DM, particularly in a central or visceral location, is thought to be part of the pathogenic process (Chap. 415e). In addition to these white fat depots, humans now are recognized to have brown fat, which has much greater thermogenic capacity. Efforts are under way to increase the activity or quantity of brown fat (e.g., a myokine, irisin, may convert white to brown fat). The increased adipocyte mass leads to increased levels of circulating free fatty acids and other fat cell products. For example, adipocytes secrete a number of biologic products (nonesterified free fatty acids, retinol-binding protein 4, leptin, TNF-α, resistin, IL-6, and adiponectin). In addition to regulating body weight, appetite, and energy expenditure, adipokines also modulate insulin sensitivity. The increased production of free fatty acids and some adipokines may cause insulin resistance in skeletal muscle and liver. For example, free fatty acids impair glucose utilization in skeletal muscle, promote glucose production by the liver, and impair beta cell function. In contrast, the production by adipocytes of adiponectin, an insulin-sensitizing peptide, is reduced in obesity, and this may contribute to hepatic insulin resistance. Adipocyte products and adipokines also produce an inflammatory state and may explain why markers of inflammation such as IL-6 and C-reactive protein are often elevated in type 2 DM. In addition, inflammatory cells have been found infiltrating adipose tissue. Inhibition of inflammatory signaling pathways such as the nuclear factor-κB (NF-κB) pathway appears to reduce insulin resistance and improve hyperglycemia in animal models and is being tested in humans.
IMPAIRED INSULIN SECRETION Insulin secretion and sensitivity are interrelated (Fig. 417-7). In type 2 DM, insulin secretion initially increases in response to insulin resistance to maintain normal glucose tolerance. Initially, the insulin secretory defect is mild and selectively involves glucose-stimulated insulin secretion, including a greatly reduced first secretory phase. The response to other nonglucose secretagogues, such as arginine, is preserved, but overall beta function is reduced by as much as 50% at the onset of type 2 DM. Abnormalities in proinsulin processing are reflected by increased secretion of proinsulin in type 2 DM. Eventually, the insulin secretory defect is progressive.
The reason(s) for the decline in insulin secretory capacity in type 2 DM is unclear. The assumption is that a second genetic defect—superimposed upon insulin resistance—leads to beta cell failure. Beta cell mass is decreased by approximately 50% in individuals with long-standing type 2 DM. Islet amyloid polypeptide or amylin, co-secreted by the beta cell, forms the amyloid fibrillar deposit found in the islets of individuals with long-standing type 2 DM. Whether such islet amyloid deposits are a primary or secondary event is not known. The metabolic environment of diabetes may also negatively impact islet function. For example, chronic hyperglycemia paradoxically impairs islet function (“glucose toxicity”) and leads to a worsening of hyperglycemia. Improvement in glycemic control is often associated with improved islet function. In addition, elevation of free fatty acid levels (“lipotoxicity”) and dietary fat may also worsen islet function. Reduced GLP-1 action may contribute to the reduced insulin secretion.
INCREASED HEPATIC GLUCOSE AND LIPID PRODUCTION In type 2 DM, insulin resistance in the liver reflects the failure of hyperinsulinemia to suppress gluconeogenesis, which results in fasting hyperglycemia and decreased glycogen storage by the liver in the postprandial state. Increased hepatic glucose production occurs early in the course of diabetes, although likely after the onset of insulin secretory abnormalities and insulin resistance in skeletal muscle. As a result of insulin resistance in adipose tissue, lipolysis and free fatty acid flux from adipocytes are increased, leading to increased lipid (very-low-density lipoprotein [VLDL] and triglyceride) synthesis in hepatocytes. This lipid storage or steatosis in the liver may lead to nonalcoholic fatty liver disease (Chap. 367e) and abnormal liver function tests. This is also responsible for the dyslipidemia found in type 2 DM (elevated triglycerides, reduced high-density lipoprotein [HDL], and increased small dense low-density lipoprotein [LDL] particles).
Insulin Resistance Syndromes The insulin resistance condition comprises a spectrum of disorders, with hyperglycemia representing one of the most readily diagnosed features. The metabolic syndrome, the insulin resistance syndrome, and syndrome X are terms used to describe a constellation of metabolic derangements that includes insulin resistance, hypertension, dyslipidemia (decreased HDL and elevated triglycerides), central or visceral obesity, type 2 DM or IGT/IFG, and accelerated cardiovascular disease. This syndrome is discussed in Chap. 422.
A number of relatively rare forms of severe insulin resistance include features of type 2 DM or IGT (Table 417-1). Mutations in the insulin receptor that interfere with binding or signal transduction are a rare cause of insulin resistance. Acanthosis nigricans and signs of hyperandrogenism (hirsutism, acne, and oligomenorrhea in women) are also common physical features. Two distinct syndromes of severe insulin resistance have been described in adults: (1) type A, which affects young women and is characterized by severe hyperinsulinemia, obesity, and features of hyperandrogenism; and (2) type B, which affects middle-aged women and is characterized by severe hyperinsulinemia, features of hyperandrogenism, and autoimmune disorders. Individuals with the type A insulin resistance syndrome have an undefined defect in the insulin-signaling pathway; individuals with the type B insulin resistance syndrome have autoantibodies directed at the insulin receptor. These receptor autoantibodies may block insulin binding or may stimulate the insulin receptor, leading to intermittent hypoglycemia.
Polycystic ovary syndrome (PCOS) is a common disorder that affects premenopausal women and is characterized by chronic anovulation and hyperandrogenism (Chap. 412). Insulin resistance is seen in a significant subset of women with PCOS, and the disorder substantially increases the risk for type 2 DM, independent of the effects of obesity.
Prevention Type 2 DM is preceded by a period of IGT or IFG, and a number of lifestyle modifications and pharmacologic agents prevent or delay the onset of DM. Individuals with prediabetes or increased risk of diabetes should be referred to a structured program to reduce body weight and increase physical activity as well as being screened for cardiovascular disease. The Diabetes Prevention Program (DPP) demonstrated that intensive changes in lifestyle (diet and exercise for 30 min/d five times/week) in individuals with IGT prevented or delayed the development of type 2 DM by 58% compared to placebo. This effect was seen in individuals regardless of age, sex, or ethnic group. In the same study, metformin prevented or delayed diabetes by 31% compared to placebo. The lifestyle intervention group lost 5–7% of their body weight during the 3 years of the study. Studies in Finnish and Chinese populations noted similar efficacy of diet and exercise in preventing or delaying type 2 DM. A number of agents, including α-glucosidase inhibitors, metformin, thiazolidinediones, GLP-1 receptor pathway modifiers, and orlistat, prevent or delay type 2 DM but are not approved for this purpose. Individuals with a strong family history of type 2 DM and individuals with IFG or IGT should be strongly encouraged to maintain a normal BMI and engage in regular physical activity. Pharmacologic therapy for individuals with prediabetes is currently controversial because its cost-effectiveness and safety profile are not known. The ADA has suggested that metformin be considered in individuals with both IFG and IGT who are at very high risk for progression to diabetes (age <60 years, BMI ≥35 kg/m2, family history of diabetes in first-degree relative, and women with a history of GDM). Individuals with IFG, IGT, or an HbA1c of 5.7–6.4% should be monitored annually to determine if diagnostic criteria for diabetes are present.
GENETICALLY DEFINED, MONOGENIC FORMS OF DIABETES MELLITUS RELATED TO REDUCED INSULIN SECRETION
Several monogenic forms of DM have been identified. More than 10 different variants of MODY, caused by mutations in genes encoding islet-enriched transcription factors or glucokinase (Fig. 417-5; Table 417-1), are transmitted as autosomal dominant disorders. MODY 1, MODY 3, and MODY 5 are caused by mutations in hepatocyte nuclear transcription factor (HNF) 4α, HNF-1α, and HNF-1β, respectively. As their names imply, these transcription factors are expressed in the liver but also in other tissues, including the pancreatic islets and kidney. These factors most likely affect islet development or the expression of genes important in glucose-stimulated insulin secretion or the maintenance of beta cell mass. For example, individuals with an HNF-1α mutation (MODY 3) have a progressive decline in glycemic control but may respond to sulfonylureas. In fact, some of these patients were initially thought to have type 1 DM but were later shown to respond to a sulfonylurea, and insulin was discontinued. Individuals with a HNF-1β mutation have progressive impairment of insulin secretion and hepatic insulin resistance, and require insulin treatment (minimal response to sulfonylureas). These individuals often have other abnormalities such as renal cysts, mild pancreatic exocrine insufficiency, and abnormal liver function tests. Individuals with MODY 2, the result of mutations in the glucokinase gene, have mild-to-moderate, stable hyperglycemia that does not respond to oral hypoglycemic agents. Glucokinase catalyzes the formation of glucose-6-phosphate from glucose, a reaction that is important for glucose sensing by the beta cells (Fig. 417-5) and for glucose utilization by the liver. As a result of glucokinase mutations, higher glucose levels are required to elicit insulin secretory responses, thus altering the set point for insulin secretion. Studies of populations with type 2 DM suggest that mutations in MODY-associated genes are an uncommon (<5%) cause of type 2 DM. Mutations in mitochondrial DNA are associated with diabetes and deafness.
Transient or permanent neonatal diabetes (onset <12 months of age) occurs. Permanent neonatal diabetes may be caused by several genetic mutations, usually requires treatment with insulin, and phenotypically is similar to type 1 DM. Mutations in the ATP-sensitive potassium channel subunits (Kir6.2 and ABCC8) and the insulin gene (interfere with proinsulin folding and processing) (Fig. 417-5) are the major causes of permanent neonatal diabetes. Although these activating mutations in the ATP-sensitive potassium channel subunits impair glucose-stimulated insulin secretion, these individuals may respond to sulfonylureas and can be treated with these agents. These mutations are often associated with a spectrum of neurologic dysfunction. MODY 4 is a rare variant caused by mutations in the insulin promoter factor (IPF) 1, a transcription factor that regulates pancreatic development and insulin gene transcription. Homozygous inactivating mutations cause pancreatic agenesis, whereas heterozygous mutations may result in DM. Mutations in the transcription factor of GATA6 are the most common cause of pancreatic agenesis. Homozygous glucokinase mutations cause a severe form of neonatal diabetes.
418 |
Diabetes Mellitus: Management and Therapies |
OVERALL GOALS
The goals of therapy for type 1 or type 2 diabetes mellitus (DM) are to (1) eliminate symptoms related to hyperglycemia, (2) reduce or eliminate the long-term microvascular and macrovascular complications of DM (Chap. 419), and (3) allow the patient to achieve as normal a lifestyle as possible. To reach these goals, the physician should identify a target level of glycemic control for each patient, provide the patient with the educational and pharmacologic resources necessary to reach this level, and monitor/treat DM-related complications. Symptoms of diabetes usually resolve when the plasma glucose is <11.1 mmol/L (200 mg/dL), and thus most DM treatment focuses on achieving the second and third goals. This chapter first reviews the ongoing treatment of diabetes in the outpatient setting and then discusses the treatment of severe hyperglycemia, as well as the treatment of diabetes in hospitalized patients.
The care of an individual with either type 1 or type 2 DM requires a multidisciplinary team. Central to the success of this team are the patient’s participation, input, and enthusiasm, all of which are essential for optimal diabetes management. Members of the health care team include the primary care provider and/or the endocrinologist or diabetologist, a certified diabetes educator, a nutritionist, and a psychologist. In addition, when the complications of DM arise, subspecialists (including neurologists, nephrologists, vascular surgeons, cardiologists, ophthalmologists, and podiatrists) with experience in DM-related complications are essential.
ONGOING ASPECTS OF COMPREHENSIVE DIABETES CARE
A number of names are sometimes applied to different approaches to diabetes care, such as intensive insulin therapy, intensive glycemic control, and “tight control.” The current chapter, and other sources, uses the term comprehensive diabetes care to emphasize the fact that optimal diabetes therapy involves more than plasma glucose management and medications. Although glycemic control is central to optimal diabetes therapy, comprehensive diabetes care of both type 1 and type 2 DM should also detect and manage DM-specific complications (Chap. 419) and modify risk factors for DM-associated diseases. The key elements of comprehensive diabetes care are summarized in Table 418-1. In addition to the physical aspects of DM, social, family, financial, cultural, and employment-related issues may impact diabetes care. The International Diabetes Federation (IDF), recognizing that resources available for diabetes care vary widely throughout the world, has issued guidelines for “recommended care” (a well-developed service base and with health care funding systems consuming a significant part of their national wealth), “limited care” (health care settings with very limited resources), and “comprehensive care” (health care settings with considerable resources). This chapter provides guidance for this comprehensive level of diabetes care. The treatment goals for patients with diabetes are summarized in Table 418-2 and should be individualized.
|
GUIDELINES FOR ONGOING, COMPREHENSIVE MEDICAL CARE FOR PATIENTS WITH DIABETES |
Abbreviations: GFR, glomerular filtration rate; HbA1c, hemoglobin A1c.
|
TREATMENT GOALS FOR ADULTS WITH DIABETESa |
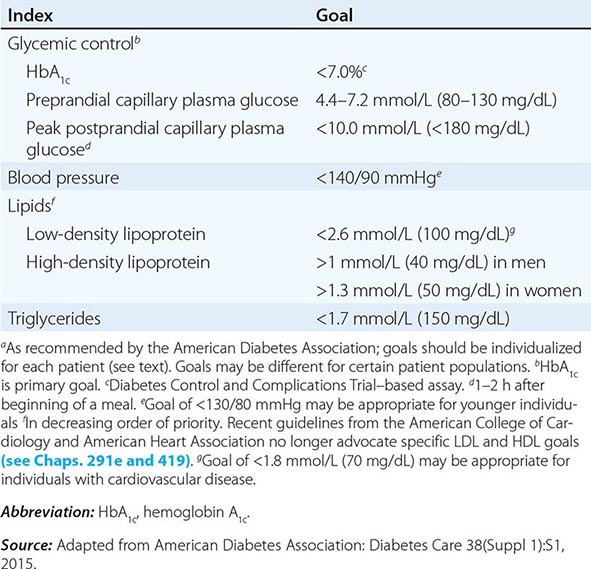
DETECTION AND PREVENTION OF COMPLICATIONS RELATED TO DIABETES
The morbidity and mortality rates of DM-related complications (Chap. 419) can be greatly reduced by timely and consistent surveillance procedures (Table 418-1). These screening procedures are indicated for all individuals with DM, but many individuals with diabetes do not receive comprehensive diabetes care. A comprehensive eye examination should be performed by a qualified optometrist or ophthalmologist. Because many individuals with type 2 DM have had asymptomatic diabetes for several years before diagnosis, the American Diabetes Association (ADA) recommends the following ophthalmologic examination schedule: (1) individuals with type 1 DM should have an initial eye examination within 5 years of diagnosis, (2) individuals with type 2 DM should have an initial eye examination at the time of diabetes diagnosis, (3) women with DM who are pregnant or contemplating pregnancy should have an eye examination prior to conception and during the first trimester, and (4) if eye exam is normal, repeat examination in 2–3 years is appropriate.
PATIENT EDUCATION ABOUT DM, NUTRITION, AND EXERCISE
The patient with type 1 or type 2 DM should receive education about nutrition, exercise, care of diabetes during illness, and medications to lower the plasma glucose. Along with improved compliance, patient education allows individuals with DM to assume greater responsibility for their care. Patient education should be viewed as a continuing process with regular visits for reinforcement; it should not be a process that is completed after one or two visits to a nurse educator or nutritionist. The ADA refers to education about the individualized management plan for the patient as diabetes self-management education (DSME) and diabetes self-management support (DSMS). DSME and DSMS are ways to improve the patient’s knowledge, skills, and abilities necessary for diabetes self-care and should also emphasize psychosocial issues and emotional well-being. More frequent contact between the patient and the diabetes management team (e.g., electronic, telephone) improves glycemic control.
Diabetes Education The diabetes educator is a health care professional (nurse, dietician, or pharmacist) with specialized patient education skills who is certified in diabetes education (e.g., American Association of Diabetes Educators). Education topics important for optimal diabetes care include self-monitoring of blood glucose; urine ketone monitoring (type 1 DM); insulin administration; guidelines for diabetes management during illnesses; prevention and management of hypoglycemia (Chap. 420); foot and skin care; diabetes management before, during, and after exercise; and risk factor–modifying activities.
Psychosocial Aspects Because the individual with DM can face challenges that affect many aspects of daily life, psychosocial assessment and treatment are a critical part of providing comprehensive diabetes care. The individual with DM must accept that he or she may develop complications related to DM. Even with considerable effort, normoglycemia can be an elusive goal, and solutions to worsening glycemic control may not be easily identifiable. The patient should view him- or herself as an essential member of the diabetes care team and not as someone who is cared for by the diabetes management team. Emotional stress may provoke a change in behavior so that individuals no longer adhere to a dietary, exercise, or therapeutic regimen. This can lead to the appearance of either hyper- or hypoglycemia. Eating disorders, including binge eating disorders, bulimia, and anorexia nervosa, appear to occur more frequently in individuals with type 1 or type 2 DM.
Nutrition Medical nutrition therapy (MNT) is a term used by the ADA to describe the optimal coordination of caloric intake with other aspects of diabetes therapy (insulin, exercise, weight loss). Primary prevention measures of MNT are directed at preventing or delaying the onset of type 2 DM in high-risk individuals (obese or with prediabetes) by promoting weight reduction. Medical treatment of obesity is a rapidly evolving area and is discussed in Chap. 416. Secondary prevention measures of MNT are directed at preventing or delaying diabetes-related complications in diabetic individuals by improving glycemic control. Tertiary prevention measures of MNT are directed at managing diabetes-related complications (cardiovascular disease, nephropathy) in diabetic individuals. MNT in patients with diabetes and cardiovascular disease should incorporate dietary principles used in nondiabetic patients with cardiovascular disease. Although the recommendations for all three types of MNT overlap, this chapter emphasizes secondary prevention measures of MNT. Pharmacologic approaches that facilitate weight loss and bariatric surgery should be considered in selected patients (Chaps. 415e and 416).
In general, the components of optimal MNT are similar for individuals with type 1 or type 2 DM and similar to those for the general population (fruits, vegetables, fiber-containing foods, and low fat; Table 418-3). MNT education is an important component of comprehensive diabetes care and should be reinforced by regular patient education. Historically, nutrition education imposed restrictive, complicated regimens on the patient. Current practices have greatly changed, although many patients and health care providers still view the diabetic diet as monolithic and static. For example, MNT now includes foods with sucrose and seeks to modify other risk factors such as hyperlipidemia and hypertension rather than focusing exclusively on weight loss in individuals with type 2 DM. The glycemic index is an estimate of the postprandial rise in the blood glucose when a certain amount of that food is consumed. Consumption of foods with a low glycemic index appears to reduce postprandial glucose excursions and improve glycemic control. Reduced-calorie and nonnutritive sweeteners are useful. Currently, evidence does not support supplementation of the diet with vitamins, antioxidants (vitamin C and E), or micronutrients (chromium) in patients with diabetes.
|
NUTRITIONAL RECOMMENDATIONS FOR ADULTS WITH DIABETES OR PREDIABETESa |
aSee text for differences for patients with type 1 or type 2 diabetes.
Source: Adapted from American Diabetes Association: Diabetes Care 37(Suppl 1):S14, 2014.
The goal of MNT in the individual with type 1 DM is to coordinate and match the caloric intake, both temporally and quantitatively, with the appropriate amount of insulin. MNT in type 1 DM and self-monitoring of blood glucose must be integrated to define the optimal insulin regimen. The ADA encourages patients and providers to use carbohydrate counting or exchange systems to estimate the nutrient content of a meal or snack. Based on the patient’s estimate of the carbohydrate content of a meal, an insulin-to-carbohydrate ratio determines the bolus insulin dose for a meal or snack. MNT must be flexible enough to allow for exercise, and the insulin regimen must allow for deviations in caloric intake. An important component of MNT in type 1 DM is to minimize the weight gain often associated with intensive diabetes management.
The goals of MNT in type 2 DM should focus on weight loss and address the greatly increased prevalence of cardiovascular risk factors (hypertension, dyslipidemia, obesity) and disease in this population. The majority of these individuals are obese, and weight loss is strongly encouraged and should remain an important goal. Hypocaloric diets and modest weight loss (5–7%) often result in rapid and dramatic glucose lowering in individuals with new-onset type 2 DM. Nevertheless, numerous studies document that long-term weight loss is uncommon. MNT for type 2 DM should emphasize modest caloric reduction (low-carbohydrate) and increased physical activity. Increased consumption of soluble, dietary fiber may improve glycemic control in individuals with type 2 DM. Weight loss and exercise improve insulin resistance.
Exercise Exercise has multiple positive benefits including cardiovascular risk reduction, reduced blood pressure, maintenance of muscle mass, reduction in body fat, and weight loss. For individuals with type 1 or type 2 DM, exercise is also useful for lowering plasma glucose (during and following exercise) and increasing insulin sensitivity. In patients with diabetes, the ADA recommends 150 min/week (distributed over at least 3 days) of moderate aerobic physical activity with no gaps longer than 2 days. The exercise regimen should also include resistance training.
Despite its benefits, exercise presents challenges for individuals with DM because they lack the normal glucoregulatory mechanisms (normally, insulin falls and glucagon rises during exercise). Skeletal muscle is a major site for metabolic fuel consumption in the resting state, and the increased muscle activity during vigorous, aerobic exercise greatly increases fuel requirements. Individuals with type 1 DM are prone to either hyperglycemia or hypoglycemia during exercise, depending on the preexercise plasma glucose, the circulating insulin level, and the level of exercise-induced catecholamines. If the insulin level is too low, the rise in catecholamines may increase the plasma glucose excessively, promote ketone body formation, and possibly lead to ketoacidosis. Conversely, if the circulating insulin level is excessive, this relative hyperinsulinemia may reduce hepatic glucose production (decreased glycogenolysis, decreased gluconeogenesis) and increase glucose entry into muscle, leading to hypoglycemia.
To avoid exercise-related hyper- or hypoglycemia, individuals with type 1 DM should (1) monitor blood glucose before, during, and after exercise; (2) delay exercise if blood glucose is >14 mmol/L (250 mg/dL) and ketones are present; (3) if the blood glucose is <5.6 mmol/L (100 mg/dL), ingest carbohydrate before exercising; (4) monitor glucose during exercise and ingest carbohydrate to prevent hypoglycemia; (5) decrease insulin doses (based on previous experience) before exercise and inject insulin into a nonexercising area; and (6) learn individual glucose responses to different types of exercise and increase food intake for up to 24 h after exercise, depending on intensity and duration of exercise. In individuals with type 2 DM, exercise-related hypoglycemia is less common but can occur in individuals taking either insulin or insulin secretagogues.
Despite asymptomatic cardiovascular disease appearing at a younger age in both type 1 and type 2 DM, routine screening for coronary artery disease has not been shown to be effective and is not recommended (Chap. 419). Untreated proliferative retinopathy is a relative contraindication to vigorous exercise, because this may lead to vitreous hemorrhage or retinal detachment.
MONITORING THE LEVEL OF GLYCEMIC CONTROL
Optimal monitoring of glycemic control involves plasma glucose measurements by the patient and an assessment of long-term control by the physician (measurement of hemoglobin A1c [HbA1c] and review of the patient’s self-measurements of plasma glucose). These measurements are complementary: the patient’s measurements provide a picture of short-term glycemic control, whereas the HbA1c reflects average glycemic control over the previous 2–3 months.
Self-Monitoring of Blood Glucose Self-monitoring of blood glucose (SMBG) is the standard of care in diabetes management and allows the patient to monitor his or her blood glucose at any time. In SMBG, a small drop of blood and an easily detectable enzymatic reaction allow measurement of the capillary plasma glucose. Many glucose monitors can rapidly and accurately measure glucose (calibrated to provide plasma glucose value even though blood glucose is measured) in small amounts of blood (3–10 μL) obtained from the fingertip; alternative testing sites (e.g., forearm) are less reliable, especially when the blood glucose is changing rapidly (postprandially). A large number of blood glucose monitors are available, and the certified diabetes educator is critical in helping the patient select the optimal device and learn to use it properly. By combining glucose measurements with diet history, medication changes, and exercise history, the diabetes management team and patient can improve the treatment program.
The frequency of SMBG measurements must be individualized and adapted to address the goals of diabetes care. Individuals with type 1 DM or individuals with type 2 DM taking multiple insulin injections each day should routinely measure their plasma glucose three or more times per day to estimate and select mealtime boluses of short-acting insulin and to modify long-acting insulin doses. Most individuals with type 2 DM require less frequent monitoring, although the optimal frequency of SMBG has not been clearly defined. Individuals with type 2 DM who are taking insulin should use SMBG more frequently than those on oral agents. Individuals with type 2 DM who are on oral medications should use SMBG as a means of assessing the efficacy of their medication and the impact of diet. Because plasma glucose levels fluctuate less in these individuals, one to two SMBG measurements per day (or fewer in patients who are on oral agents or are diet-controlled) may be sufficient. Most measurements in individuals with type 1 or type 2 DM should be performed prior to a meal and supplemented with postprandial measurements to assist in reaching postprandial glucose targets (Table 418-2).
Devices for continuous glucose monitoring (CGM) have been approved by the U.S. Food and Drug Administration (FDA), and others are in various stages of development. These devices do not replace the need for traditional glucose measurements and require calibration with SMBG. This rapidly evolving technology requires substantial expertise on the part of the diabetes management team and the patient. Current CGM systems measure the glucose in interstitial fluid, which is in equilibrium with the blood glucose. These devices provide useful short-term information about the patterns of glucose changes as well as an enhanced ability to detect hypoglycemic episodes. Alarms notify the patient if the blood glucose falls into the hypoglycemic range. Clinical experience with these devices is rapidly growing, and they are most useful in individuals with hypoglycemia unawareness, individuals with frequent hypoglycemia, or those who have not achieved glycemic targets despite major efforts. The utility of CGM in the intensive care unit (ICU) setting remains to be determined.
Assessment of Long-Term Glycemic Control Measurement of glycated hemoglobin (HbA1c) is the standard method for assessing long-term glycemic control. When plasma glucose is consistently elevated, there is an increase in nonenzymatic glycation of hemoglobin; this alteration reflects the glycemic history over the previous 2–3 months, because erythrocytes have an average life span of 120 days (glycemic level in the preceding month contributes about 50% to the HbA1c value). Measurement of HbA1c at the “point of care” allows for more rapid feedback and may therefore assist in adjustment of therapy.
HbA1c should be measured in all individuals with DM during their initial evaluation and as part of their comprehensive diabetes care. As the primary predictor of long-term complications of DM, the HbA1c should mirror, to a certain extent, the short-term measurements of SMBG. These two measurements are complementary in that recent intercurrent illnesses may impact the SMBG measurements but not the HbA1c. Likewise, postprandial and nocturnal hyperglycemia may not be detected by the SMBG of fasting and preprandial capillary plasma glucose but will be reflected in the HbA1c. In standardized assays, the HbA1c approximates the following mean plasma glucose values: an HbA1c of 6% = 7.0 mmol/L (126 mg/dL), 7% = 8.6 mmol/L (154 mg/dL), 8% = 10.2 mmol/L (183 mg/dL), 9% = 11.8 mmol/L (212 mg/dL), 10% = 13.4 mmol/L (240 mg/dL), 11% = 14.9 mmol/L (269 mg/dL), and 12% = 16.5 mmol/L (298 mg/dL). In patients achieving their glycemic goal, the ADA recommends measurement of the HbA1c at least twice per year. More frequent testing (every 3 months) is warranted when glycemic control is inadequate or when therapy has changed. Laboratory standards for the HbA1c test have been established and should be correlated to the reference assay of the Diabetes Control and Complications Trial (DCCT). Clinical conditions such hemoglobinopathies, anemias, reticulocytosis, transfusions, and uremia may interfere with the HbA1c result. The degree of glycation of other proteins, such as albumin, can be used as an alternative indicator of glycemic control when the HbA1c is inaccurate. The fructosamine assay (measuring glycated albumin) reflects the glycemic status over the prior 2 weeks.
PHARMACOLOGIC TREATMENT OF DIABETES
Comprehensive care of type 1 and type 2 DM requires an emphasis on nutrition, exercise, and monitoring of glycemic control but also usually involves glucose-lowering medication(s). This chapter discusses classes of such medications but does not describe every glucose-lowering agent available worldwide. The initial step is to select an individualized, glycemic goal for the patient.
ESTABLISHMENT OF TARGET LEVEL OF GLYCEMIC CONTROL
Because the complications of DM are related to glycemic control, normoglycemia or near-normoglycemia is the desired, but often elusive, goal for most patients. Normalization or near-normalization of the plasma glucose for long periods of time is extremely difficult, as demonstrated by the DCCT and United Kingdom Prospective Diabetes Study (UKPDS). Regardless of the level of hyperglycemia, improvement in glycemic control will lower the risk of diabetes-specific complications (Chap. 419).
The target for glycemic control (as reflected by the HbA1c) must be individualized, and the goals of therapy should be developed in consultation with the patient after considering a number of medical, social, and lifestyle issues. The ADA calls this a patient-centered approach, and other organizations such as the IDF and American Association of Clinical Endocrinologists (AACE) also suggest an individualized glycemic goal. Important factors to consider include the patient’s age and ability to understand and implement a complex treatment regimen, presence and severity of complications of diabetes, known cardiovascular disease (CVD), ability to recognize hypoglycemic symptoms, presence of other medical conditions or treatments that might affect survival or the response to therapy, lifestyle and occupation (e.g., possible consequences of experiencing hypoglycemia on the job), and level of support available from family and friends.
In general, the ADA suggests that the goal is to achieve an HbA1c as close to normal as possible without significant hypoglycemia. In most individuals, the target HbA1c should be <7% (Table 418-2) with a more stringent target for some patients. For instance, the HbA1c goal in a young adult with type 1 DM may be 6.5%. A higher HbA1c goal may be appropriate for the very young or old or in individuals with limited life span or comorbid conditions. For example, an appropriate HbA1c goal in elderly individuals with multiple, chronic illnesses and impaired activities of daily living might be 8.0 or 8.5%. A major consideration is the frequency and severity of hypoglycemia, because this becomes more common with a more stringent HbA1c goal.
More stringent glycemic control (HbA1c of ≤6%) is not beneficial, and may be detrimental, in patients with type 2 DM and a high risk of CVD. Large clinical trials (UKPDS, Action to Control Cardiovascular Risk in Diabetes [ACCORD], Action in Diabetes and Vascular Disease: Preterax and Diamicron MR Controlled Evaluation [ADVANCE], Veterans Affairs Diabetes Trial [VADT]; Chap. 419) have examined glycemic control in type 2 DM in individuals with low risk of CVD, with high risk of CVD, or with established CVD and have found that more intense glycemic control is not beneficial and, in some patient populations, may have a negative impact on some outcomes. These divergent outcomes stress the need for individualized glycemic goals based on the following general guidelines: (1) early in the course of type 2 diabetes when the CVD risk is lower, improved glycemic control likely leads to improved cardiovascular outcome, but this benefit occurs more than a decade after the period of improved glycemic control; (2) intense glycemic control in individuals with established CVD or at high risk for CVD is not advantageous, and may be deleterious, over a follow-up of 3–5 years; an HbA1c goal <7.0% is not appropriate in this population; (3) hypoglycemia in such high-risk populations (elderly, CVD) should be avoided; and (4) improved glycemic control reduces microvascular complications of diabetes (Chap. 419) even if it does not improve macrovascular complications like CVD.
TYPE 1 DIABETES MELLITUS
General Aspects The ADA recommendations for fasting and bedtime glycemic goals and HbA1c targets are summarized in Table 418-2. The goal is to design and implement insulin regimens that mimic physiologic insulin secretion. Because individuals with type 1 DM partially or completely lack endogenous insulin production, administration of basal insulin is essential for regulating glycogen breakdown, gluconeogenesis, lipolysis, and ketogenesis. Likewise, insulin replacement for meals should be appropriate for the carbohydrate intake and promote normal glucose utilization and storage.
Intensive Management Intensive diabetes management has the goal of achieving euglycemia or near-normal glycemia. This approach requires multiple resources, including thorough and continuing patient education, comprehensive recording of plasma glucose measurements and nutrition intake by the patient, and a variable insulin regimen that matches glucose intake and insulin dose. Insulin regimens usually include multiple-component insulin regimens, multiple daily injections (MDIs), or insulin infusion devices (each discussed below).
The benefits of intensive diabetes management and improved glycemic control include a reduction in the microvascular complications of DM and a reduction in diabetes-related complications. From a psychological standpoint, the patient experiences greater control over his or her diabetes and often notes an improved sense of well-being, greater flexibility in the timing and content of meals, and the capability to alter insulin dosing with exercise. In addition, intensive diabetes management prior to and during pregnancy reduces the risk of fetal malformations and morbidity. Intensive diabetes management is encouraged in newly diagnosed patients with type 1 DM because it may prolong the period of C-peptide production, which may result in better glycemic control and a reduced risk of serious hypoglycemia. Although intensive management confers impressive benefits, it is also accompanied by significant personal and financial costs and is therefore not appropriate for all individuals.
Insulin Preparations Current insulin preparations are generated by recombinant DNA technology and consist of the amino acid sequence of human insulin or variations thereof. In the United States, most insulin is formulated as U-100 (100 units/mL). Regular insulin formulated as U-500 (500 units/mL) is available and sometimes useful in patients with severe insulin resistance. Human insulin has been formulated with distinctive pharmacokinetics or genetically modified to more closely mimic physiologic insulin secretion. Insulins can be classified as short-acting or long-acting (Table 418-4). For example, one short-acting insulin formulation, insulin lispro, is an insulin analogue in which the 28th and 29th amino acids (lysine and proline) on the insulin B chain have been reversed by recombinant DNA technology. Insulin aspart and insulin glulisine are genetically modified insulin analogues with properties similar to lispro. All three of the insulin analogues have full biologic activity but less tendency for self-aggregation, resulting in more rapid absorption and onset of action and a shorter duration of action. These characteristics are particularly advantageous for allowing entrainment of insulin injection and action to rising plasma glucose levels following meals. The shorter duration of action also appears to be associated with a decreased number of hypoglycemic episodes, primarily because the decay of insulin action corresponds to the decline in plasma glucose after a meal. Thus, insulin aspart, lispro, or glulisine is preferred over regular insulin for prandial coverage. Insulin glargine is a long-acting biosynthetic human insulin that differs from normal insulin in that asparagine is replaced by glycine at amino acid 21, and two arginine residues are added to the C terminus of the B chain. Compared to neutral protamine Hagedorn (NPH) insulin, the onset of insulin glargine action is later, the duration of action is longer (~24 h), and there is a less pronounced peak. A lower incidence of hypoglycemia, especially at night, has been reported with insulin glargine when compared to NPH insulin. The most recent evidence does not support an association between glargine and increased cancer risk. Insulin detemir has a fatty acid side chain that prolongs its action by slowing absorption and catabolism. Twice-daily injections of glargine or detemir are sometimes required to provide 24-h coverage. Regular and NPH insulin have the native insulin amino acid sequence.
|
PROPERTIES OF INSULIN PREPARATIONSa |
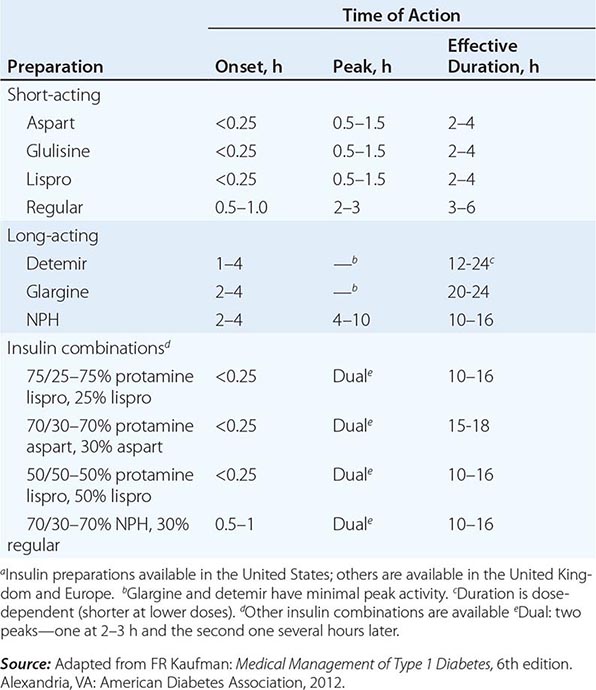
Basal insulin requirements are provided by long-acting (NPH insulin, insulin glargine, or insulin detemir) insulin formulations. These are usually prescribed with short-acting insulin in an attempt to mimic physiologic insulin release with meals. Although mixing of NPH and short-acting insulin formulations is common practice, this mixing may alter the insulin absorption profile (especially the short-acting insulins). For example, lispro absorption is delayed by mixing with NPH. The alteration in insulin absorption when the patient mixes different insulin formulations should not prevent mixing insulins. However, the following guidelines should be followed: (1) mix the different insulin formulations in the syringe immediately before injection (inject within 2 min after mixing); (2) do not store insulin as a mixture; (3) follow the same routine in terms of insulin mixing and administration to standardize the physiologic response to injected insulin; and (4) do not mix insulin glargine or detemir with other insulins. The miscibility of some insulins allows for the production of combination insulins that contain 70% NPH and 30% regular (70/30), or equal mixtures of NPH and regular (50/50). By including the insulin analogue mixed with protamine, several combinations have a short-acting and long-acting profile (Table 418-4). Although more convenient for the patient (only two injections/day), combination insulin formulations do not allow independent adjustment of short-acting and long-acting activity. Several insulin formulations are available as insulin “pens,” which may be more convenient for some patients. Insulin delivery by inhalation has recently been approved but is not yet available. Other insulins, such as one with a duration of action of several days, are under development but are not currently available in the United States.
Insulin Regimens Representations of the various insulin regimens that may be used in type 1 DM are illustrated in Fig. 418-1. Although the insulin profiles are depicted as “smooth,” symmetric curves, there is considerable patient-to-patient variation in the peak and duration. In all regimens, long-acting insulins (NPH, glargine, or detemir) supply basal insulin, whereas regular, insulin aspart, glulisine, or lispro insulin provides prandial insulin. Short-acting insulin analogues should be injected just before (<10 min) or just after a meal; regular insulin is given 30–45 min prior to a meal. Sometimes short-acting insulin analogues are injected just after a meal (gastroparesis, unpredictable food intake).
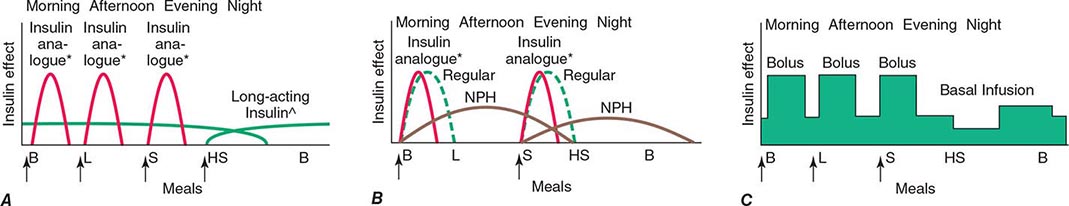
FIGURE 418-1 Representative insulin regimens for the treatment of diabetes. For each panel, the y-axis shows the amount of insulin effect and the x-axis shows the time of day. B, breakfast; HS, bedtime; L, lunch; S, supper. *Lispro, glulisine, or insulin aspart can be used. The time of insulin injection is shown with a vertical arrow. The type of insulin is noted above each insulin curve. A. Multiple-component insulin regimen consisting of long-acting insulin (∧glargine or detemir) to provide basal insulin coverage and three shots of glulisine, lispro, or insulin aspart to provide glycemic coverage for each meal. B. Injection of two shots of long-acting insulin (NPH) and short-acting insulin analogue (glulisine, lispro, insulin aspart [solid red line], or regular insulin [green dashed line]). Only one formulation of short-acting insulin is used. C. Insulin administration by insulin infusion device is shown with the basal insulin and a bolus injection at each meal. The basal insulin rate is decreased during the evening and increased slightly prior to the patient awakening in the morning. Glulisine, lispro, or insulin aspart is used in the insulin pump. (Adapted from H Lebovitz [ed]: Therapy for Diabetes Mellitus. American Diabetes Association, Alexandria, VA, 2004.)
A shortcoming of current insulin regimens is that injected insulin immediately enters the systemic circulation, whereas endogenous insulin is secreted into the portal venous system. Thus, exogenous insulin administration exposes the liver to subphysiologic insulin levels. No insulin regimen reproduces the precise insulin secretory pattern of the pancreatic islet. However, the most physiologic regimens entail more frequent insulin injections, greater reliance on short-acting insulin, and more frequent capillary plasma glucose measurements. In general, individuals with type 1 DM require 0.5–1 U/kg per day of insulin divided into multiple doses, with ~50% of the insulin given as basal insulin.
Multiple-component insulin regimens refer to the combination of basal insulin and bolus insulin (preprandial short-acting insulin). The timing and dose of short-acting, preprandial insulin are altered to accommodate the SMBG results, anticipated food intake, and physical activity. Such regimens offer the patient with type 1 diabetes more flexibility in terms of lifestyle and the best chance for achieving near normoglycemia. One such regimen, shown in Fig. 418-1B, consists of basal insulin with glargine or detemir and preprandial lispro, glulisine, or insulin aspart. The insulin aspart, glulisine, or lispro dose is based on individualized algorithms that integrate the preprandial glucose and the anticipated carbohydrate intake. To determine the meal component of the preprandial insulin dose, the patient uses an insulin-to-carbohydrate ratio (a common ratio for type 1 DM is 1–1.5 units/10 g of carbohydrate, but this must be determined for each individual). To this insulin dose is added the supplemental or correcting insulin based on the preprandial blood glucose (one formula uses 1 unit of insulin for every 2.7 mmol/L [50 mg/dL] over the preprandial glucose target; another formula uses [body weight in kg] × [blood glucose – desired glucose in mg/dL]/1500). An alternative multiple-component insulin regimen consists of bedtime NPH insulin, a small dose of NPH insulin at breakfast (20–30% of bedtime dose), and preprandial short-acting insulin. Other variations of this regimen are in use but have the disadvantage that NPH has a significant peak, making hypoglycemia more common. Frequent SMBG (more than three times per day) is absolutely essential for these types of insulin regimens.
In the past, one commonly used regimen consisted of twice-daily injections of NPH mixed with a short-acting insulin before the morning and evening meals (Fig. 418-1B). Such regimens usually prescribe two-thirds of the total daily insulin dose in the morning (with about two-thirds given as long-acting insulin and one-third as short-acting) and one-third before the evening meal (with approximately one-half given as long-acting insulin and one-half as short-acting). The drawback to such a regimen is that it forces a rigid schedule on the patient, in terms of daily activity and the content and timing of meals. Although it is simple and effective at avoiding severe hyperglycemia, it does not generate near-normal glycemic control in individuals with type 1 DM. Moreover, if the patient’s meal pattern or content varies or if physical activity is increased, hyperglycemia or hypoglycemia may result. Moving the long-acting insulin from before the evening meal to bedtime may avoid nocturnal hypoglycemia and provide more insulin as glucose levels rise in the early morning (so-called dawn phenomenon). The insulin dose in such regimens should be adjusted based on SMBG results with the following general assumptions: (1) the fasting glucose is primarily determined by the prior evening long-acting insulin; (2) the pre-lunch glucose is a function of the morning short-acting insulin; (3) the pre-supper glucose is a function of the morning long-acting insulin; and (4) the bedtime glucose is a function of the pre-supper, short-acting insulin. This is not an optimal regimen for the patient with type 1 DM, but is sometimes used for patients with type 2 DM.
Continuous SC insulin infusion (CSII) is a very effective insulin regimen for the patient with type 1 DM (Fig. 418-1C). To the basal insulin infusion, a preprandial insulin (“bolus”) is delivered by the insulin infusion device based on instructions from the patient, who uses an individualized algorithm incorporating the preprandial plasma glucose and anticipated carbohydrate intake. These sophisticated insulin infusion devices can accurately deliver small doses of insulin (microliters per hour) and have several advantages: (1) multiple basal infusion rates can be programmed to accommodate nocturnal versus daytime basal insulin requirement; (2) basal infusion rates can be altered during periods of exercise; (3) different waveforms of insulin infusion with meal-related bolus allow better matching of insulin depending on meal composition; and (4) programmed algorithms consider prior insulin administration and blood glucose values in calculating the insulin dose. These devices require instruction by a health professional with considerable experience with insulin-infusion devices and very frequent patient interactions with the diabetes management team. Insulin-infusion devices present unique challenges, such as infection at the infusion site, unexplained hyperglycemia because the infusion set becomes obstructed, or diabetic ketoacidosis if the pump becomes disconnected. Because most physicians use lispro, glulisine, or insulin aspart in CSII, the extremely short half-life of these insulins quickly leads to insulin deficiency if the delivery system is interrupted. Essential to the safe use of infusion devices is thorough patient education about pump function and frequent SMBG. Efforts to create a closed-loop system in which data from continuous glucose measurement regulate the insulin infusion rate are under way.
Other Agents That Improve Glucose Control The role of amylin, a 37-amino-acid peptide co-secreted with insulin from pancreatic beta cells, in normal glucose homeostasis is uncertain. However, based on the rationale that patients who are insulin deficient are also amylin deficient, an analogue of amylin (pramlintide) was created and found to reduce postprandial glycemic excursions in type 1 and type 2 diabetic patients taking insulin. Pramlintide injected just before a meal slows gastric emptying and suppresses glucagon but does not alter insulin levels. Pramlintide is approved for insulin-treated patients with type 1 and type 2 DM. Addition of pramlintide produces a modest reduction in the HbA1c and seems to dampen meal-related glucose excursions. In type 1 DM, pramlintide is started as a 15-μg SC injection before each meal and titrated up to a maximum of 30–60 μg as tolerated. In type 2 DM, pramlintide is started as a 60-μg SC injection before each meal and may be titrated up to a maximum of 120 μg. The major side effects are nausea and vomiting, and dose escalations should be slow to limit these side effects. Because pramlintide slows gastric emptying, it may influence absorption of other medications and should not be used in combination with other drugs that slow GI motility. The short-acting insulin given before the meal should initially be reduced to avoid hypoglycemia and then titrated as the effects of the pramlintide become evident. α-Glucosidase inhibitors are sometimes used with insulin in type 1 DM.
TYPE 2 DIABETES MELLITUS
General Aspects The goals of glycemia-controlling therapy for type 2 DM are similar to those in type 1 DM. Whereas glycemic control tends to dominate the management of type 1 DM, the care of individuals with type 2 DM must also include attention to the treatment of conditions associated with type 2 DM (e.g., obesity, hypertension, dyslipidemia, CVD) and detection/management of DM-related complications (Fig. 418-2). Reduction in cardiovascular risk is of paramount importance because this is the leading cause of mortality in these individuals.
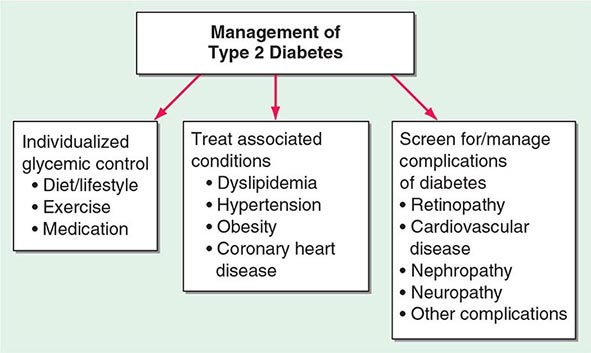
FIGURE 418-2 Essential elements in comprehensive care of type 2 diabetes.
Type 2 DM management should begin with MNT (discussed above). An exercise regimen to increase insulin sensitivity and promote weight loss should also be instituted. Pharmacologic approaches to the management of type 2 DM include oral glucose-lowering agents, insulin, and other agents that improve glucose control; most physicians and patients prefer oral glucose-lowering agents as the initial choice. Any therapy that improves glycemic control reduces “glucose toxicity” to beta cells and improves endogenous insulin secretion. However, type 2 DM is a progressive disorder and ultimately requires multiple therapeutic agents and often insulin in most patients.
Glucose-Lowering Agents Advances in the therapy of type 2 DM have generated oral glucose-lowering agents that target different pathophysiologic processes in type 2 DM. Based on their mechanisms of action, glucose-lowering agents are subdivided into agents that increase insulin secretion, reduce glucose production, increase insulin sensitivity, enhance GLP-1 action, or promote urinary excretion of glucose (Table 418-5). Glucose-lowering agents other than insulin (with the exception of amylin analogue and α-glucosidase inhibitors) are ineffective in type 1 DM and should not be used for glucose management of severely ill individuals with type 2 DM. Insulin is sometimes the initial glucose-lowering agent in type 2 DM.
|
AGENTS USED FOR TREATMENT OF TYPE 1 OR TYPE 2 DIABETES |
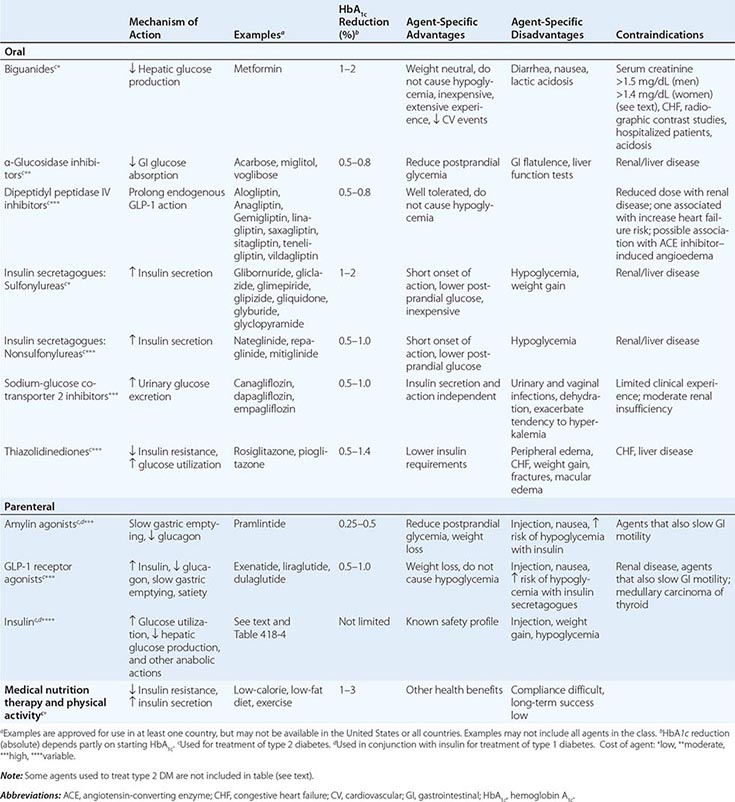
BIGUANIDES Metformin, representative of this class of agents, reduces hepatic glucose production and improves peripheral glucose utilization slightly (Table 418-5). Metformin activates AMP-dependent protein kinase and enters cells through organic cation transporters (polymorphisms of these may influence the response to metformin). Recent evidence indicates that metformin’s mechanism for reducing hepatic glucose production is to antagonize glucagon’s ability to generate cAMP in hepatocytes. Metformin reduces fasting plasma glucose (FPG) and insulin levels, improves the lipid profile, and promotes modest weight loss. An extended-release form is available and may have fewer gastrointestinal side effects (diarrhea, anorexia, nausea, metallic taste). Because of its relatively slow onset of action and gastrointestinal symptoms with higher doses, the initial dose should be low and then escalated every 2–3 weeks based on SMBG measurements. Metformin is effective as monotherapy and can be used in combination with other oral agents or with insulin. The major toxicity of metformin, lactic acidosis, is very rare and can be prevented by careful patient selection. Vitamin B12 levels are ~30% lower during metformin treatment. Metformin should not be used in patients with renal insufficiency (glomerular filtration rate [GFR] <60 mL/min), any form of acidosis, unstable congestive heart failure (CHF), liver disease, or severe hypoxemia. Some feel that that these guidelines are too restrictive and prevent individuals with mild to moderate renal impairment from being safely treated with metformin. The National Institute for Health and Clinical Excellence in the United Kingdom suggests that metformin be used at a GFR >30 mL/min, with a reduced dose when the GFR is <45 mL/min. Metformin should be discontinued in hospitalized patients, in patients who can take nothing orally, and in those receiving radiographic contrast material. Insulin should be used until metformin can be restarted.
INSULIN SECRETAGOGUES—AGENTS THAT AFFECT THE ATP-SENSITIVE K+ CHANNEL Insulin secretagogues stimulate insulin secretion by interacting with the ATP-sensitive potassium channel on the beta cell (Chap. 417). These drugs are most effective in individuals with type 2 DM of relatively recent onset (<5 years) who have residual endogenous insulin production. First-generation sulfonylureas (chlorpropamide, tolazamide, tolbutamide) have a longer half-life, a greater incidence of hypoglycemia, and more frequent drug interactions, and are no longer used. Second-generation sulfonylureas have a more rapid onset of action and better coverage of the postprandial glucose rise, but the shorter half-life of some agents may require more than once-a-day dosing. Sulfonylureas reduce both fasting and postprandial glucose and should be initiated at low doses and increased at 1- to 2-week intervals based on SMBG. In general, sulfonylureas increase insulin acutely and thus should be taken shortly before a meal; with chronic therapy, though, the insulin release is more sustained. Glimepiride and glipizide can be given in a single daily dose and are preferred over glyburide, especially in the elderly. Repaglinide, nateglinide, and mitiglinide are not sulfonylureas but also interact with the ATP-sensitive potassium channel. Because of their short half-life, these agents are given with each meal or immediately before to reduce meal-related glucose excursions.
Insulin secretagogues, especially the longer acting ones, have the potential to cause hypoglycemia, especially in elderly individuals. Hypoglycemia is usually related to delayed meals, increased physical activity, alcohol intake, or renal insufficiency. Individuals who ingest an overdose of some agents develop prolonged and serious hypoglycemia and should be monitored closely in the hospital (Chap. 420). Most sulfonylureas are metabolized in the liver to compounds (some of which are active) that are cleared by the kidney. Thus, their use in individuals with significant hepatic or renal dysfunction is not advisable. Weight gain, a common side effect of sulfonylurea therapy, results from the increased insulin levels and improvement in glycemic control. Some sulfonylureas have significant drug interactions with alcohol and some medications including warfarin, aspirin, ketoconazole, α-glucosidase inhibitors, and fluconazole. A related isoform of ATP-sensitive potassium channels is present in the myocardium and the brain. All of these agents except glyburide have a low affinity for this isoform. Despite concerns that this agent might affect the myocardial response to ischemia and observational studies suggesting that sulfonylureas increase cardiovascular risk, studies have not shown an increased cardiac mortality with glyburide or other agents in this class.
INSULIN SECRETAGOGUES—AGENTS THAT ENHANCE GLP-1 RECEPTOR SIGNALING “Incretins” amplify glucose-stimulated insulin secretion (Chap. 417). Agents that either act as a GLP-1 receptor agonist or enhance endogenous GLP-1 activity are approved for the treatment of type 2 DM (Table 418-5). Agents in this class do not cause hypoglycemia because of the glucose-dependent nature of incretin-stimulated insulin secretion (unless there is concomitant use of an agent that can lead to hypoglycemia—sulfonylureas, etc.). Exenatide, a synthetic version of a peptide initially identified in the saliva of the Gila monster (exendin-4), is an analogue of GLP-1. Unlike native GLP-1, which has a half-life of >5 min, differences in the exenatide amino acid sequence render it resistant to the enzyme that degrades GLP-1 (dipeptidyl peptidase IV [DPP-IV]). Thus, exenatide has prolonged GLP-1-like action and binds to GLP-1 receptors found in islets, the gastrointestinal tract, and the brain. Liraglutide, another GLP-1 receptor agonist, is almost identical to native GLP-1 except for an amino acid substitution and addition of a fatty acyl group (coupled with a γ-glutamic acid spacer) that promote binding to albumin and plasma proteins and prolong its half-life. GLP-1 receptor agonists increase glucose-stimulated insulin secretion, suppress glucagon, and slow gastric emptying. These agents do not promote weight gain; in fact, most patients experience modest weight loss and appetite suppression. Treatment with these agents should start at a low dose to minimize initial side effects (nausea being the limiting one). GLP-1 receptor agonists, available in twice daily, daily, and weekly injectable formulations, can be used as combination therapy with metformin, sulfonylureas, and thiazolidinediones. Some patients taking insulin secretagogues may require a reduction in those agents to prevent hypoglycemia. The major side effects are nausea, vomiting, and diarrhea. Some formulations carry a black box warning from the FDA because of an increased risk of thyroid C-cell tumors in rodents and are contraindicated in individuals with medullary carcinoma of the thyroid or multiple endocrine neoplasia. Because GLP-1 receptor agonists slow gastric emptying, they may influence the absorption of other drugs. Whether GLP-1 receptor agonists enhance beta cell survival, promote beta cell proliferation, or alter the natural history of type 2 DM is not known. Other GLP-1 receptor agonists and formulations are under development.
DPP-IV inhibitors inhibit degradation of native GLP-1 and thus enhance the incretin effect. DPP-IV, which is widely expressed on the cell surface of endothelial cells and some lymphocytes, degrades a wide range of peptides (not GLP-1 specific). DPP-IV inhibitors promote insulin secretion in the absence of hypoglycemia or weight gain and appear to have a preferential effect on postprandial blood glucose. The levels of GLP-1 action in the patient are greater with the GLP-1 receptor agonists than with DPP-IV inhibitors. DPP-IV inhibitors are used either alone or in combination with other oral agents in type 2 DM. Reduced doses should be given to patients with renal insufficiency. Initial concerns about the pancreatic side effects of GLP-1 receptor agonists and DPP-IV inhibitors (pancreatitis, possible premalignant lesions) appear to be unfounded.
α-GLUCOSIDASE INHIBITORS α-Glucosidase inhibitors reduce postprandial hyperglycemia by delaying glucose absorption; they do not affect glucose utilization or insulin secretion (Table 418-5). Postprandial hyperglycemia, secondary to impaired hepatic and peripheral glucose disposal, contributes significantly to the hyperglycemic state in type 2 DM. These drugs, taken just before each meal, reduce glucose absorption by inhibiting the enzyme that cleaves oligosaccharides into simple sugars in the intestinal lumen. Therapy should be initiated at a low dose with the evening meal and increased to a maximal dose over weeks to months. The major side effects (diarrhea, flatulence, abdominal distention) are related to increased delivery of oligosaccharides to the large bowel and can be reduced somewhat by gradual upward dose titration. α-Glucosidase inhibitors may increase levels of sulfonylureas and increase the incidence of hypoglycemia. Simultaneous treatment with bile acid resins and antacids should be avoided. These agents should not be used in individuals with inflammatory bowel disease, gastroparesis, or a serum creatinine >177 μmol/L (2 mg/dL). This class of agents is not as potent as other oral agents in lowering the HbA1c but is unique because it reduces the postprandial glucose rise even in individuals with type 1 DM. If hypoglycemia from other diabetes treatments occurs while taking these agents, the patient should consume glucose because the degradation and absorption of complex carbohydrates will be retarded.
THIAZOLIDINEDIONES Thiazolidinediones (Table 418-5) reduce insulin resistance by binding to the PPAR-γ (peroxisome proliferator–activated receptor γ) nuclear receptor (which forms a heterodimer with the retinoid × receptor). The PPAR-γ receptor is found at highest levels in adipocytes but is expressed at lower levels in many other tissues. Agonists of this receptor regulate a large number of genes, promote adipocyte differentiation, reduce hepatic fat accumulation, and promote fatty acid storage. Thiazolidinediones promote a redistribution of fat from central to peripheral locations. Circulating insulin levels decrease with use of the thiazolidinediones, indicating a reduction in insulin resistance. Although direct comparisons are not available, the two currently available thiazolidinediones appear to have similar efficacy. The prototype of this class of drugs, troglitazone, was withdrawn from the U.S. market after reports of hepatotoxicity and an association with an idiosyncratic liver reaction that sometimes led to hepatic failure. Although rosiglitazone and pioglitazone do not appear to induce the liver abnormalities seen with troglitazone, the FDA recommends measurement of liver function tests prior to initiating therapy.
Rosiglitazone raises low-density lipoprotein (LDL), high-density lipoprotein (HDL), and triglycerides slightly. Pioglitazone raises HDL to a greater degree and LDL a lesser degree but lowers triglycerides. The clinical significance of the lipid changes with these agents is not known and may be difficult to ascertain because most patients with type 2 DM are also treated with a statin.
Thiazolidinediones are associated with weight gain (2–3 kg), a small reduction in the hematocrit, and a mild increase in plasma volume. Peripheral edema and CHF are more common in individuals treated with these agents. These agents are contraindicated in patients with liver disease or CHF (class III or IV). The FDA has issued an alert that rare patients taking these agents may experience a worsening of diabetic macular edema. An increased risk of fractures has been noted in women taking these agents. Thiazolidinediones have been shown to induce ovulation in premenopausal women with polycystic ovary syndrome. Women should be warned about the risk of pregnancy because the safety of thiazolidinediones in pregnancy is not established.
Concerns about increased cardiovascular risk associated with rosiglitazone led to considerable restrictions on its use and to the FDA issuing a “black box” warning in 2007. However, based on new information, the FDA has revised its guidelines and categorizes rosiglitazone similar to other drugs for type 2 DM. Because of a possible increased risk of bladder cancer, pioglitazone is part of an ongoing FDA safety review.
Sodium-Glucose Co-Transporter 2 Inhibitors (SLGT2) These agents (Table 418-5) lower the blood glucose by selectively inhibiting this co-transporter, which is expressed almost exclusively in the proximal, convoluted tubule in the kidney. This inhibits glucose reabsorption, lowers the renal threshold for glucose, and leads to increased urinary glucose excretion. Thus, the glucose-lowering effect is insulin independent and not related to changes in insulin sensitivity or secretion. Because these agents are the newest class to treat type 2 DM (Table 418-5), clinical experience is limited. Due to the increased urinary glucose, urinary or vaginal infections are more common, and the diuretic effect can lead to reduced intravascular volume. As part of the FDA approval of canagliflozin in 2013, postmarketing studies for cardiovascular outcomes and for monitoring bladder and urinary cancer risk are under way.
OTHER THERAPIES FOR TYPE 2 DM
Bile acid–binding resins Evidence indicates that bile acids, by signaling through nuclear receptors, may have a role in metabolism. Bile acid metabolism is abnormal in type 2 DM. The bile acid–binding resin colesevelam has been approved for the treatment of type 2 DM (already approved for treatment of hypercholesterolemia). Because bile acid–binding resins are minimally absorbed into the systemic circulation, how bile acid–binding resins lower blood glucose is not known. The most common side effects are gastrointestinal (constipation, abdominal pain, and nausea). Bile acid–binding resins can increase plasma triglycerides and should be used cautiously in patients with a tendency for hypertriglyceridemia. The role of this class of drugs in the treatment of type 2 DM is not yet defined.
Bromocriptine A formulation of the dopamine receptor agonist bromocriptine (Cycloset) has been approved by the FDA for the treatment of type 2 DM. However, its role in the treatment of type 2 DM is uncertain.
INSULIN THERAPY IN TYPE 2 DM Insulin should be considered as the initial therapy in type 2 DM, particularly in lean individuals or those with severe weight loss, in individuals with underlying renal or hepatic disease that precludes oral glucose-lowering agents, or in individuals who are hospitalized or acutely ill. Insulin therapy is ultimately required by a substantial number of individuals with type 2 DM because of the progressive nature of the disorder and the relative insulin deficiency that develops in patients with long-standing diabetes. Both physician and patient reluctance often delay the initiation of insulin therapy, but glucose control and patient well-being are improved by insulin therapy in patients who have not reached the glycemic target.
Because endogenous insulin secretion continues and is capable of providing some coverage of mealtime caloric intake, insulin is usually initiated in a single dose of long-acting insulin (0.3–0.4 U/kg per day), given in the evening (NPH) or just before bedtime (NPH, glargine, detemir). Because fasting hyperglycemia and increased hepatic glucose production are prominent features of type 2 DM, bedtime insulin is more effective in clinical trials than a single dose of morning insulin. Glargine given at bedtime has less nocturnal hypoglycemia than NPH insulin. Some physicians prefer a relatively low, fixed starting dose of long-acting insulin (5–15 units) or a weight-based dose (0.2 units/kg). The insulin dose may then be adjusted in 10% increments as dictated by SMBG results. Both morning and bedtime long-acting insulin may be used in combination with oral glucose-lowering agents. Initially, basal insulin may be sufficient, but often prandial insulin coverage with multiple insulin injections is needed as diabetes progresses (see insulin regimens used for type 1 DM). Other insulin formulations that have a combination of short-acting and long-acting insulin (Table 418-4) are sometimes used in patients with type 2 DM because of convenience but do not allow independent adjustment of short-acting and long-acting insulin dose and often do not achieve the same degree of glycemic control as basal/bolus regimens. In selected patients with type 2 DM, insulin-infusion devices may be considered.
CHOICE OF INITIAL GLUCOSE-LOWERING AGENT The level of hyperglycemia and the patient’s individualized goal (see “Establishment of Target Level of Glycemic Control”) should influence the initial choice of therapy. Assuming that maximal benefit of MNT and increased physical activity has been realized, patients with mild to moderate hyperglycemia (FPG <11.1–13.9 mmol/L [200–250 mg/dL]) often respond well to a single, oral glucose-lowering agent. Patients with more severe hyperglycemia (FPG >13.9 mmol/L [250 mg/dL]) may respond partially but are unlikely to achieve normoglycemia with oral monotherapy. A stepwise approach that starts with a single agent and adds a second agent to achieve the glycemic target can be used (see “Combination therapy with glucose-lowering agents,” below). Insulin can be used as initial therapy in individuals with severe hyperglycemia (FPG <13.9–16.7 mmol/L [250–300 mg/dL]) or in those who are symptomatic from the hyperglycemia. This approach is based on the rationale that more rapid glycemic control will reduce “glucose toxicity” to the islet cells, improve endogenous insulin secretion, and possibly allow oral glucose-lowering agents to be more effective. If this occurs, the insulin may be discontinued.
Insulin secretagogues, biguanides, α-glucosidase inhibitors, thiazolidinediones, GLP-1 receptor agonists, DPP-IV inhibitors, SLGT2 inhibitors, and insulin are approved for monotherapy of type 2 DM. Although each class of oral glucose-lowering agents has advantages and disadvantages (Table 418-5), certain generalizations apply: (1) insulin secretagogues, biguanides, GLP-1 receptor agonists, and thiazolidinediones improve glycemic control to a similar degree (1–2% reduction in HbA1c) and are more effective than α-glucosidase inhibitors, DPP-IV inhibitors, and SLGT2 inhibitors; (2) assuming a similar degree of glycemic improvement, no clinical advantage to one class of drugs has been demonstrated; any therapy that improves glycemic control is likely beneficial; (3) insulin secretagogues, GLP-1 receptor agonists, DPP-IV inhibitors, α-glucosidase inhibitors, and SLGT2 inhibitors begin to lower the plasma glucose immediately, whereas the glucose-lowering effects of the biguanides and thiazolidinediones are delayed by weeks; (4) not all agents are effective in all individuals with type 2 DM; (5) biguanides, α-glucosidase inhibitors, GLP-1 receptor agonists, DPP-IV inhibitors, thiazolidinediones, and SLGT2 inhibitors do not directly cause hypoglycemia; (6) most individuals will eventually require treatment with more than one class of oral glucose-lowering agents or insulin, reflecting the progressive nature of type 2 DM; and (7) durability of glycemic control is slightly less for glyburide compared to metformin or rosiglitazone.
Considerable clinical experience exists with metformin and sulfonylureas because they have been available for several decades. It is assumed that the α-glucosidase inhibitors, GLP-1 agonists, DPP-IV inhibitors, thiazolidinediones, and SLGT2 inhibitors will reduce DM-related complications by improving glycemic control, but long-term data are not yet available. The thiazolidinediones are theoretically attractive because they target a fundamental abnormality in type 2 DM, namely insulin resistance. However, all of these agents are currently more costly than metformin and sulfonylureas.
Treatment algorithms by several professional societies (ADA/European Association for the Study of Diabetes [EASD], IDF, AACE) suggest metformin as initial therapy because of its efficacy, known side effect profile, and low cost (Fig. 418-3). Metformin’s advantages are that it promotes mild weight loss, lowers insulin levels, and improves the lipid profile slightly. Based on SMBG results and the HbA1c, the dose of metformin should be increased until the glycemic target is achieved or maximum dose is reached. If metformin is not tolerated, then initial therapy with an insulin secretagogue or DPP-IV inhibitor is reasonable.
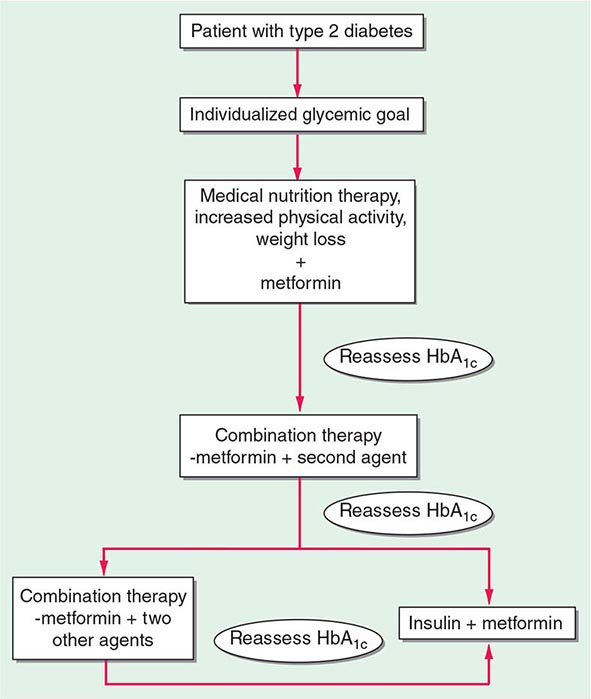
FIGURE 418-3 Glycemic management of type 2 diabetes. See text for discussion of treatment of severe hyperglycemia or symptomatic hyperglycemia. Agents that can be combined with metformin include insulin secretagogues, thiazolidinediones, α-glucosidase inhibitors, DPP-IV inhibitors, GLP-1 receptor agonists, SLGT2 inhibitors, and insulin. HbA1c, hemoglobin HbA1c.
COMBINATION THERAPY WITH GLUCOSE-LOWERING AGENTS A number of combinations of therapeutic agents are successful in type 2 DM (metformin + second oral agent, metformin + GLP-1 receptor agonist, or metformin + insulin), and the dosing of agents in combination is the same as when the agents are used alone. Because mechanisms of action of the first and second agents should be different, the effect on glycemic control is usually additive. There are little data to support the choice of one combination over another combination. Medication costs vary considerably (Table 418-5), and this often factors into medication choice. Several fixed-dose combinations of oral agents are available, but evidence that they are superior to titration of single agent to a maximum dose and then addition of a second agent is lacking. If adequate control is not achieved with the combination of two agents (based on reassessment of the HbA1c every 3 months), a third oral agent or basal insulin should be added (Fig. 418-3). Treatment approaches vary considerably from country to country. For example, α-glucosidase inhibitors are used commonly in South Asian patients (Indian), but infrequently in the United States or Europe. Whether this reflects an underlying difference in the disease or physician preference is not clear.
Treatment with insulin becomes necessary as type 2 DM enters the phase of relative insulin deficiency (as seen in long-standing DM) and is signaled by inadequate glycemic control with one or two oral glucose-lowering agents. Insulin alone or in combination should be used in patients who fail to reach the glycemic target. For example, a single dose of long-acting insulin at bedtime is often effective in combination with metformin. In contrast, insulin secretagogues have little utility once insulin therapy is started. Experience using incretin therapies and insulin is limited. As endogenous insulin production falls further, multiple injections of long-acting and short-acting insulin regimens are necessary to control postprandial glucose excursions. These insulin regimens are identical to the long-acting and short-acting combination regimens discussed above for type 1 DM. Because the hyperglycemia of type 2 DM tends to be more “stable,” these regimens can be increased in 10% increments every 2–3 days using the fasting blood glucose results. Weight gain and hypoglycemia are the major adverse effects of insulin therapy. The daily insulin dose required can become quite large (1–2 units/kg per day) as endogenous insulin production falls and insulin resistance persists. Individuals who require >1 unit/kg per day of long-acting insulin should be considered for combination therapy with metformin or a thiazolidinedione. The addition of metformin or a thiazolidinedione can reduce insulin requirements in some individuals with type 2 DM, while maintaining or even improving glycemic control. Insulin plus a thiazolidinedione promotes weight gain and is associated with peripheral edema. Addition of a thiazolidinedione to a patient’s insulin regimen may necessitate a reduction in the insulin dose to avoid hypoglycemia. Patients requiring large doses of insulin (>200 units/day) can be treated with a more concentrated form of insulin, U-500.
EMERGING THERAPIES
Whole pancreas transplantation (performed concomitantly with a renal transplant) may normalize glucose tolerance and is an important therapeutic option in type 1 DM with end-stage renal disease, although it requires substantial expertise and is associated with the side effects of immunosuppression. Pancreatic islet transplantation has been plagued by limitations in pancreatic islet supply and graft survival and remains an area of clinical investigation. Many individuals with long-standing type 1 DM still produce very small amounts of insulin or have insulin-positive cells within the pancreas. This suggests that beta cells may slowly regenerate but are quickly destroyed by the autoimmune process. Thus, efforts to suppress the autoimmune process and to stimulate beta cell regeneration are being tested both at the time of diagnosis and in years after the diagnosis of type 1 DM. Closed-loop pumps that infuse the appropriate amount of insulin in response to changing glucose levels are potentially feasible now that CGM technology has been developed. Bi-hormonal pumps that deliver both insulin and glucagon are under development. New therapies under development for type 2 DM include activators of glucokinase, inhibitors of 11 β-hydroxysteroid dehydrogenase-1, GPR40 agonists, monoclonal antibodies to reduce inflammation, and salsalate.
Bariatric surgery for obese individuals with type 2 DM has shown considerable promise, sometimes with dramatic resolution of the diabetes or major reductions in the needed dose of glucose-lowering therapies (Chap. 416). Several large, unblinded clinical trials have demonstrated a much greater efficacy of bariatric surgery compared to medical management in the treatment of type 2 DM; the durability of the diabetes reversal or improvement is uncertain. The ADA clinical guidelines state that bariatric surgery should be considered in individuals with DM and a body mass index >35 kg/m2.
ADVERSE EFFECTS OF THERAPY FOR DIABETES MELLITUS
As with any therapy, the benefits of efforts directed toward glycemic control must be balanced against the risks of treatment (Table 418-5). Side effects of intensive treatment include an increased frequency of serious hypoglycemia, weight gain, increased economic costs, and greater demands on the patient. In the DCCT, quality of life was very similar in the intensive and standard therapy groups. The most serious complication of therapy for DM is hypoglycemia, and its treatment with oral glucose or glucagon injection is discussed in Chap. 420. Severe, recurrent hypoglycemia warrants examination of treatment regimen and glycemic goal for the individual patient. Weight gain occurs with most (insulin, insulin secretagogues, thiazolidinediones) but not all (metformin, α-glucosidase inhibitors, GLP-1 receptor agonists, DPP-IV inhibitors) therapies. The weight gain is partially due to the anabolic effects of insulin and the reduction in glucosuria. As a result of recent controversies about the optimal glycemic goal and concerns about safety, the FDA now requires information about the cardiovascular safety profile as part of its evaluation of new treatments for type 2 DM.
ACUTE DISORDERS RELATED TO SEVERE HYPERGLYCEMIA
Individuals with type 1 or type 2 DM and severe hyperglycemia (>16.7 mmol/L [300 mg/dL]) should be assessed for clinical stability, including mentation and hydration. Depending on the patient and the rapidity and duration of the severe hyperglycemia, an individual may require more intense and rapid therapy to lower the blood glucose. However, many patients with poorly controlled diabetes and hyperglycemia have few symptoms. The physician should assess if the patient is stable or if diabetic ketoacidosis or a hyperglycemic hyperosmolar state should be considered. Ketones, an indicator of diabetic ketoacidosis, should be measured in individuals with type 1 DM when the plasma glucose is >16.7 mmol/L (300 mg/dL), during a concurrent illness, or with symptoms such as nausea, vomiting, or abdominal pain. Blood measurement of β-hydroxybutyrate is preferred over urine testing with nitroprusside-based assays that measure only acetoacetate and acetone.
Diabetic ketoacidosis (DKA) and hyperglycemic hyperosmolar state (HHS) are acute, severe disorders directly related to diabetes. DKA was formerly considered a hallmark of type 1 DM, but also occurs in individuals who lack immunologic features of type 1 DM and who can sometimes subsequently be treated with oral glucose-lowering agents (these obese individuals with type 2 DM are often of Hispanic or African-American descent). HHS is primarily seen in individuals with type 2 DM. Both disorders are associated with absolute or relative insulin deficiency, volume depletion, and acid-base abnormalities. DKA and HHS exist along a continuum of hyperglycemia, with or without ketosis. The metabolic similarities and differences in DKA and HHS are highlighted in Table 418-6. Both disorders are associated with potentially serious complications if not promptly diagnosed and treated.
|
LABORATORY VALUES IN DIABETIC KETOACIDOSIS (DKA) AND HYPERGLYCEMIC HYPEROSMOLAR STATE (HHS) (REPRESENTATIVE RANGES AT PRESENTATION) |
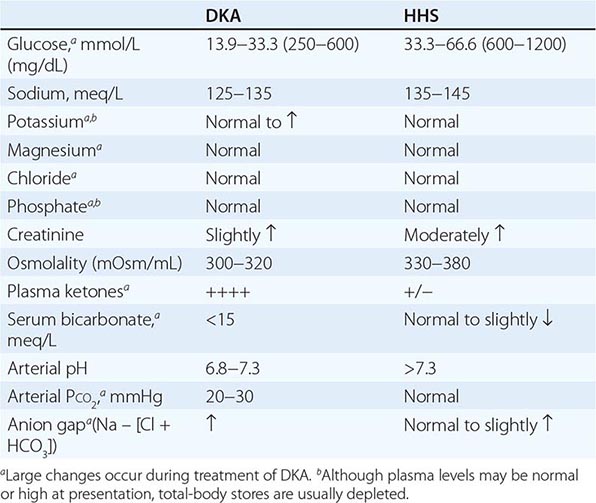
DIABETIC KETOACIDOSIS
Clinical Features The symptoms and physical signs of DKA are listed in Table 418-7 and usually develop over 24 h. DKA may be the initial symptom complex that leads to a diagnosis of type 1 DM, but more frequently, it occurs in individuals with established diabetes. Nausea and vomiting are often prominent, and their presence in an individual with diabetes warrants laboratory evaluation for DKA. Abdominal pain may be severe and can resemble acute pancreatitis or ruptured viscus. Hyperglycemia leads to glucosuria, volume depletion, and tachycardia. Hypotension can occur because of volume depletion in combination with peripheral vasodilatation. Kussmaul respirations and a fruity odor on the patient’s breath (secondary to metabolic acidosis and increased acetone) are classic signs of the disorder. Lethargy and central nervous system depression may evolve into coma with severe DKA but should also prompt evaluation for other reasons for altered mental status (e.g., infection, hypoxemia). Cerebral edema, an extremely serious complication of DKA, is seen most frequently in children. Signs of infection, which may precipitate DKA, should be sought on physical examination, even in the absence of fever. Tissue ischemia (heart, brain) can also be a precipitating factor. Omission of insulin because of an eating disorder, mental health disorders, or an unstable psychosocial environment may sometimes be a factor precipitating DKA.
|
MANIFESTATIONS OF DIABETIC KETOACIDOSIS |
Abbreviation: UTI, urinary tract infection.
Pathophysiology DKA results from relative or absolute insulin deficiency combined with counterregulatory hormone excess (glucagon, catecholamines, cortisol, and growth hormone). Both insulin deficiency and glucagon excess, in particular, are necessary for DKA to develop. The decreased ratio of insulin to glucagon promotes gluconeogenesis, glycogenolysis, and ketone body formation in the liver, as well as increases in substrate delivery from fat and muscle (free fatty acids, amino acids) to the liver. Markers of inflammation (cytokines, C-reactive protein) are elevated in both DKA and HHS
The combination of insulin deficiency and hyperglycemia reduces the hepatic level of fructose-2,6-bisphosphate, which alters the activity of phosphofructokinase and fructose-1,6-bisphosphatase. Glucagon excess decreases the activity of pyruvate kinase, whereas insulin deficiency increases the activity of phosphoenolpyruvate carboxykinase. These changes shift the handling of pyruvate toward glucose synthesis and away from glycolysis. The increased levels of glucagon and catecholamines in the face of low insulin levels promote glycogenolysis. Insulin deficiency also reduces levels of the GLUT4 glucose transporter, which impairs glucose uptake into skeletal muscle and fat and reduces intracellular glucose metabolism.
Ketosis results from a marked increase in free fatty acid release from adipocytes, with a resulting shift toward ketone body synthesis in the liver. Reduced insulin levels, in combination with elevations in catecholamines and growth hormone, increase lipolysis and the release of free fatty acids. Normally, these free fatty acids are converted to triglycerides or very-low-density lipoprotein (VLDL) in the liver. However, in DKA, hyperglucagonemia alters hepatic metabolism to favor ketone body formation, through activation of the enzyme carnitine palmitoyltransferase I. This enzyme is crucial for regulating fatty acid transport into the mitochondria, where beta oxidation and conversion to ketone bodies occur. At physiologic pH, ketone bodies exist as ketoacids, which are neutralized by bicarbonate. As bicarbonate stores are depleted, metabolic acidosis ensues. Increased lactic acid production also contributes to the acidosis. The increased free fatty acids increase triglyceride and VLDL production. VLDL clearance is also reduced because the activity of insulin-sensitive lipoprotein lipase in muscle and fat is decreased. Hypertriglyceridemia may be severe enough to cause pancreatitis.
DKA is often precipitated by increased insulin requirements, as occurs during a concurrent illness (Table 418-7). Failure to augment insulin therapy often compounds the problem. Complete omission or inadequate administration of insulin by the patient or health care team (in a hospitalized patient with type 1 DM) may precipitate DKA. Patients using insulin-infusion devices with short-acting insulin may develop DKA, because even a brief interruption in insulin delivery (e.g., mechanical malfunction) quickly leads to insulin deficiency.
Laboratory Abnormalities and Diagnosis The timely diagnosis of DKA is crucial and allows for prompt initiation of therapy. DKA is characterized by hyperglycemia, ketosis, and metabolic acidosis (increased anion gap) along with a number of secondary metabolic derangements (Table 418-6). Occasionally, the serum glucose is only minimally elevated. Serum bicarbonate is frequently <10 mmol/L, and arterial pH ranges between 6.8 and 7.3, depending on the severity of the acidosis. Despite a total-body potassium deficit, the serum potassium at presentation may be mildly elevated, secondary to the acidosis. Total-body stores of sodium, chloride, phosphorus, and magnesium are reduced in DKA but are not accurately reflected by their levels in the serum because of hypovolemia and hyperglycemia. Elevated blood urea nitrogen (BUN) and serum creatinine levels reflect intravascular volume depletion. Interference from acetoacetate may falsely elevate the serum creatinine measurement. Leukocytosis, hypertriglyceridemia, and hyperlipoproteinemia are commonly found as well. Hyperamylasemia may suggest a diagnosis of pancreatitis, especially when accompanied by abdominal pain. However, in DKA the amylase is usually of salivary origin and thus is not diagnostic of pancreatitis. Serum lipase should be obtained if pancreatitis is suspected.
The measured serum sodium is reduced as a consequence of the hyperglycemia (1.6-mmol/L [1.6-meq] reduction in serum sodium for each 5.6-mmol/L [100-mg/dL] rise in the serum glucose). A normal serum sodium in the setting of DKA indicates a more profound water deficit. In “conventional” units, the calculated serum osmolality (2 × [serum sodium + serum potassium] + plasma glucose [mg/dL]/18 + BUN/2.8) is mildly to moderately elevated, although to a lesser degree than that found in HHS (see below).
In DKA, the ketone body, β-hydroxybutyrate, is synthesized at a threefold greater rate than acetoacetate; however, acetoacetate is preferentially detected by a commonly used ketosis detection reagent (nitroprusside). Serum ketones are present at significant levels (usually positive at serum dilution of ≥1:8). The nitroprusside tablet, or stick, is often used to detect urine ketones; certain medications such as captopril or penicillamine may cause false-positive reactions. Serum or plasma assays for β-hydroxybutyrate are preferred because they more accurately reflect the true ketone body level.
The metabolic derangements of DKA exist along a spectrum, beginning with mild acidosis with moderate hyperglycemia evolving into more severe findings. The degree of acidosis and hyperglycemia do not necessarily correlate closely because a variety of factors determine the level of hyperglycemia (oral intake, urinary glucose loss). Ketonemia is a consistent finding in DKA and distinguishes it from simple hyperglycemia. The differential diagnosis of DKA includes starvation ketosis, alcoholic ketoacidosis (bicarbonate usually >15 meq/L), and other forms of increased anion-gap acidosis (Chap. 66).
|
DIABETIC KETOACIDOSIS |
The management of DKA is outlined in Table 418-8. After initiating IV fluid replacement and insulin therapy, the agent or event that precipitated the episode of DKA should be sought and aggressively treated. If the patient is vomiting or has altered mental status, a nasogastric tube should be inserted to prevent aspiration of gastric contents. Central to successful treatment of DKA is careful monitoring and frequent reassessment to ensure that the patient and the metabolic derangements are improving. A comprehensive flow sheet should record chronologic changes in vital signs, fluid intake and output, and laboratory values as a function of insulin administered.
|
MANAGEMENT OF DIABETIC KETOACIDOSIS |
Abbreviations: CXR, chest x-ray; ECG, electrocardiogram.
Source: Adapted from M Sperling, in Therapy for Diabetes Mellitus and Related Disorders, American Diabetes Association, Alexandria, VA, 1998; and AE Kitabchi et al: Diabetes Care 32:1335, 2009.
After the initial bolus of normal saline, replacement of the sodium and free water deficit is carried out over the next 24 h (fluid deficit is often 3–5 L). When hemodynamic stability and adequate urine output are achieved, IV fluids should be switched to 0.45% saline depending on the calculated volume deficit. The change to 0.45% saline helps to reduce the trend toward hyperchloremia later in the course of DKA. Alternatively, initial use of lactated Ringer’s IV solution may reduce the hyperchloremia that commonly occurs with normal saline.
A bolus of IV (0.1 units/kg) short-acting insulin should be administered immediately (Table 418-8), and subsequent treatment should provide continuous and adequate levels of circulating insulin. IV administration is preferred (0.1 units/kg of regular insulin per hour) because it ensures rapid distribution and allows adjustment of the infusion rate as the patient responds to therapy. In mild episodes of DKA, short-acting insulin can be used SC. IV insulin should be continued until the acidosis resolves and the patient is metabolically stable. As the acidosis and insulin resistance associated with DKA resolve, the insulin infusion rate can be decreased (to 0.05–0.1 units/kg per hour). Long-acting insulin, in combination with SC short-acting insulin, should be administered as soon as the patient resumes eating, because this facilitates transition to an outpatient insulin regimen and reduces length of hospital stay. It is crucial to continue the insulin infusion until adequate insulin levels are achieved by administering long-acting insulin by the SC route. Even relatively brief periods of inadequate insulin administration in this transition phase may result in DKA relapse.
Hyperglycemia usually improves at a rate of 4.2–5.6 mmol/L (75–100 mg/dL) per hour as a result of insulin-mediated glucose disposal, reduced hepatic glucose release, and rehydration. The latter reduces catecholamines, increases urinary glucose loss, and expands the intravascular volume. The decline in the plasma glucose within the first 1–2 h may be more rapid and is mostly related to volume expansion. When the plasma glucose reaches 13.9 mmol/L (250 mg/dL), glucose should be added to the 0.45% saline infusion to maintain the plasma glucose in the 8.3–13.9 mmol/L (150–250 mg/dL) range, and the insulin infusion should be continued. Ketoacidosis begins to resolve as insulin reduces lipolysis, increases peripheral ketone body use, suppresses hepatic ketone body formation, and promotes bicarbonate regeneration. However, the acidosis and ketosis resolve more slowly than hyperglycemia. As ketoacidosis improves, β-hydroxybutyrate is converted to acetoacetate. Ketone body levels may appear to increase if measured by laboratory assays that use the nitroprusside reaction, which only detects acetoacetate and acetone. The improvement in acidosis and anion gap, a result of bicarbonate regeneration and decline in ketone bodies, is reflected by a rise in the serum bicarbonate level and the arterial pH. Depending on the rise of serum chloride, the anion gap (but not bicarbonate) will normalize. A hyperchloremic acidosis (serum bicarbonate of 15–18 mmol/L [15–18 meq/L]) often follows successful treatment and gradually resolves as the kidneys regenerate bicarbonate and excrete chloride.
Potassium stores are depleted in DKA (estimated deficit 3–5 mmol/kg [3–5 meq/kg]). During treatment with insulin and fluids, various factors contribute to the development of hypokalemia. These include insulin-mediated potassium transport into cells, resolution of the acidosis (which also promotes potassium entry into cells), and urinary loss of potassium salts of organic acids. Thus, potassium repletion should commence as soon as adequate urine output and a normal serum potassium are documented. If the initial serum potassium level is elevated, then potassium repletion should be delayed until the potassium falls into the normal range. Inclusion of 20–40 meq of potassium in each liter of IV fluid is reasonable, but additional potassium supplements may also be required. To reduce the amount of chloride administered, potassium phosphate or acetate can be substituted for the chloride salt. The goal is to maintain the serum potassium at >3.5 mmol/L (3.5 meq/L).
Despite a bicarbonate deficit, bicarbonate replacement is not usually necessary. In fact, theoretical arguments suggest that bicarbonate administration and rapid reversal of acidosis may impair cardiac function, reduce tissue oxygenation, and promote hypokalemia. The results of most clinical trials do not support the routine use of bicarbonate replacement, and one study in children found that bicarbonate use was associated with an increased risk of cerebral edema. However, in the presence of severe acidosis (arterial pH <7.0), the ADA advises bicarbonate (50 mmol/L [meq/L] of sodium bicarbonate in 200 mL of sterile water with 10 meq/L KCl per hour for 2 h until the pH is >7.0). Hypophosphatemia may result from increased glucose usage, but randomized clinical trials have not demonstrated that phosphate replacement is beneficial in DKA. If the serum phosphate is <0.32 mmol/L (1 mg/dL), then phosphate supplement should be considered and the serum calcium monitored. Hypomagnesemia may develop during DKA therapy and may also require supplementation.
With appropriate therapy, the mortality rate of DKA is low (<1%) and is related more to the underlying or precipitating event, such as infection or myocardial infarction. Venous thrombosis, upper gastrointestinal bleeding, and acute respiratory distress syndrome occasionally complicate DKA. The major nonmetabolic complication of DKA therapy is cerebral edema, which most often develops in children as DKA is resolving. The etiology of and optimal therapy for cerebral edema are not well established, but overreplacement of free water should be avoided.
Following treatment, the physician and patient should review the sequence of events that led to DKA to prevent future recurrences. Foremost is patient education about the symptoms of DKA, its precipitating factors, and the management of diabetes during a concurrent illness. During illness or when oral intake is compromised, patients should (1) frequently measure the capillary blood glucose; (2) measure urinary ketones when the serum glucose is >16.5 mmol/L (300 mg/dL); (3) drink fluids to maintain hydration; (4) continue or increase insulin; and (5) seek medical attention if dehydration, persistent vomiting, or uncontrolled hyperglycemia develop. Using these strategies, early DKA can be prevented or detected and treated appropriately on an outpatient basis.
HYPERGLYCEMIC HYPEROSMOLAR STATE
Clinical Features The prototypical patient with HHS is an elderly individual with type 2 DM, with a several-week history of polyuria, weight loss, and diminished oral intake that culminates in mental confusion, lethargy, or coma. The physical examination reflects profound dehydration and hyperosmolality and reveals hypotension, tachycardia, and altered mental status. Notably absent are symptoms of nausea, vomiting, and abdominal pain and the Kussmaul respirations characteristic of DKA. HHS is often precipitated by a serious, concurrent illness such as myocardial infarction or stroke. Sepsis, pneumonia, and other serious infections are frequent precipitants and should be sought. In addition, a debilitating condition (prior stroke or dementia) or social situation that compromises water intake usually contributes to the development of the disorder.
Pathophysiology Relative insulin deficiency and inadequate fluid intake are the underlying causes of HHS. Insulin deficiency increases hepatic glucose production (through glycogenolysis and gluconeogenesis) and impairs glucose utilization in skeletal muscle (see above discussion of DKA). Hyperglycemia induces an osmotic diuresis that leads to intravascular volume depletion, which is exacerbated by inadequate fluid replacement. The absence of ketosis in HHS is not understood. Presumably, the insulin deficiency is only relative and less severe than in DKA. Lower levels of counterregulatory hormones and free fatty acids have been found in HHS than in DKA in some studies. It is also possible that the liver is less capable of ketone body synthesis or that the insulin/glucagon ratio does not favor ketogenesis.
Laboratory Abnormalities and Diagnosis The laboratory features in HHS are summarized in Table 418-6. Most notable are the marked hyperglycemia (plasma glucose may be >55.5 mmol/L [1000 mg/dL]), hyperosmolality (>350 mosmol/L), and prerenal azotemia. The measured serum sodium may be normal or slightly low despite the marked hyperglycemia. The corrected serum sodium is usually increased (add 1.6 meq to measured sodium for each 5.6-mmol/L [100-mg/dL] rise in the serum glucose). In contrast to DKA, acidosis and ketonemia are absent or mild. A small anion-gap metabolic acidosis may be present secondary to increased lactic acid. Moderate ketonuria, if present, is secondary to starvation.
|
TREATMENT |
HYPERGLYCEMIC HYPEROSMOLAR STATE |
Volume depletion and hyperglycemia are prominent features of both HHS and DKA. Consequently, therapy of these disorders shares several elements (Table 418-8). In both disorders, careful monitoring of the patient’s fluid status, laboratory values, and insulin infusion rate is crucial. Underlying or precipitating problems should be aggressively sought and treated. In HHS, fluid losses and dehydration are usually more pronounced than in DKA due to the longer duration of the illness. The patient with HHS is usually older, more likely to have mental status changes, and more likely to have a life-threatening precipitating event with accompanying comorbidities. Even with proper treatment, HHS has a substantially higher mortality rate than DKA (up to 15% in some clinical series).
Fluid replacement should initially stabilize the hemodynamic status of the patient (1–3 L of 0.9% normal saline over the first 2–3 h). Because the fluid deficit in HHS is accumulated over a period of days to weeks, the rapidity of reversal of the hyperosmolar state must balance the need for free water repletion with the risk that too rapid a reversal may worsen neurologic function. If the serum sodium is >150 mmol/L (150 meq/L), 0.45% saline should be used. After hemodynamic stability is achieved, the IV fluid administration is directed at reversing the free water deficit using hypotonic fluids (0.45% saline initially, then 5% dextrose in water [D5W]). The calculated free water deficit (which averages 9–10 L) should be reversed over the next 1–2 days (infusion rates of 200–300 mL/h of hypotonic solution). Potassium repletion is usually necessary and should be dictated by repeated measurements of the serum potassium. In patients taking diuretics, the potassium deficit can be quite large and may be accompanied by magnesium deficiency. Hypophosphatemia may occur during therapy and can be improved by using KPO4 and beginning nutrition.
As in DKA, rehydration and volume expansion lower the plasma glucose initially, but insulin is also required. A reasonable regimen for HHS begins with an IV insulin bolus of 0.1 unit/kg followed by IV insulin at a constant infusion rate of 0.1 unit/kg per hour. If the serum glucose does not fall, increase the insulin infusion rate by twofold. As in DKA, glucose should be added to IV fluid when the plasma glucose falls to 13.9 mmol/L (250 mg/dL), and the insulin infusion rate should be decreased to 0.05–0.1 unit/kg per hour. The insulin infusion should be continued until the patient has resumed eating and can be transferred to a SC insulin regimen. The patient should be discharged from the hospital on insulin, although some patients can later switch to oral glucose-lowering agents.
MANAGEMENT OF DIABETES IN A HOSPITALIZED PATIENT
Virtually all medical and surgical subspecialties are involved in the care of hospitalized patients with diabetes. Hyperglycemia, whether in a patient with known diabetes or in someone without known diabetes, appears to be a predictor of poor outcome in hospitalized patients. General anesthesia, surgery, infection, or concurrent illness raises the levels of counterregulatory hormones (cortisol, growth hormone, catecholamines, and glucagon) and cytokines that may lead to transient insulin resistance and hyperglycemia. These factors increase insulin requirements by increasing glucose production and impairing glucose utilization and thus may worsen glycemic control. The concurrent illness or surgical procedure may lead to variable insulin absorption and also prevent the patient with DM from eating normally and, thus, may promote hypoglycemia. Glycemic control should be assessed on admission using the HbA1c. Electrolytes, renal function, and intravascular volume status should be assessed as well. The high prevalence of CVD in individuals with DM (especially in type 2 DM) may necessitate preoperative cardiovascular evaluation (Chap. 419).
The goals of diabetes management during hospitalization are near-normoglycemia, avoidance of hypoglycemia, and transition back to the outpatient diabetes treatment regimen. Upon hospital admission, frequent glycemic monitoring should begin, as should planning for diabetes management after discharge. Glycemic control appears to improve the clinical outcomes in a variety of settings, but optimal glycemic goals for the hospitalized patient are incompletely defined. In a number of cross-sectional studies of patients with diabetes, a greater degree of hyperglycemia was associated with worse cardiac, neurologic, and infectious outcomes. In some studies, patients who do not have preexisting diabetes but who develop modest blood glucose elevations during their hospitalization appear to benefit from achieving near-normoglycemia using insulin treatment. However, a large randomized clinical trial (Normoglycemia in Intensive Care Evaluation Survival Using Glucose Algorithm Regulation [NICE-SUGAR]) of individuals in the ICU (most of whom were receiving mechanical ventilation) found an increased mortality rate and a greater number of episodes of severe hypoglycemia with very strict glycemic control (target blood glucose of 4.5–6 mmol/L or 81–108 mg/dL) compared to individuals with a more moderate glycemic goal (mean blood glucose of 8 mmol/L or 144 mg/dL). Currently, most data suggest that very strict blood glucose control in acutely ill patients likely worsens outcomes and increases the frequency of hypoglycemia. The ADA suggests the following glycemic goals for hospitalized patients: (1) in critically ill patients: glucose of 7.8–10.0 mmol/L or 140–180 mg/dL; (2) in non–critically ill patients: premeal glucose <7.8 mmol/L (140 mg/dL) and at other times blood glucose <10 mmol/L (180 mg/dL).