CHAPTER 9 Endosonography
Key Points
2 Technical aspects
2.1 Introduction
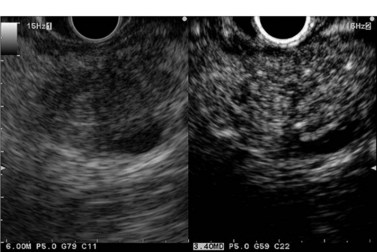
The resolving power of an ultrasound probe is directly proportional to the frequency emitted: with a frequency of 7.5 MHz, widely used in EUS, the spatial resolution is in the order of 1 mm. On the other hand, the depth of field that can be analyzed is inversely proportional to the frequency used (Table 1).
| Frequency (MHz) | Depth of field (cm) |
|---|---|
| 7.5 | 5–6 |
| 12 | 3 |
| 20 | 1.5 |
| 30 | 1 |
2.2 Equipment
Two types of ultrasound technique are used in endoscopic ultrasound.
2.2.1 Radial imaging
Radial imaging provides 360° ultrasound images perpendicular to the axis of the endoscope.
This technique has many advantages, namely:
 Rotating mechanical: this is the oldest type (developed in the early 1980s). It is used increasingly rarely and Doppler studies are not possible.
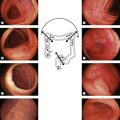
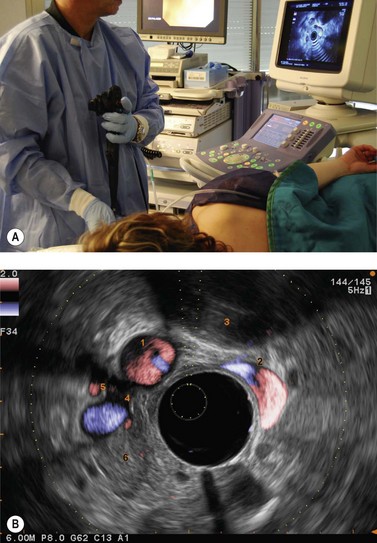
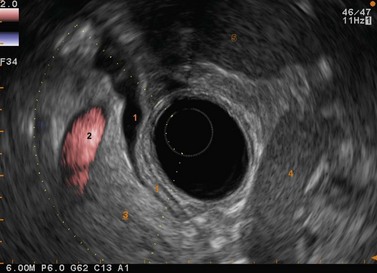
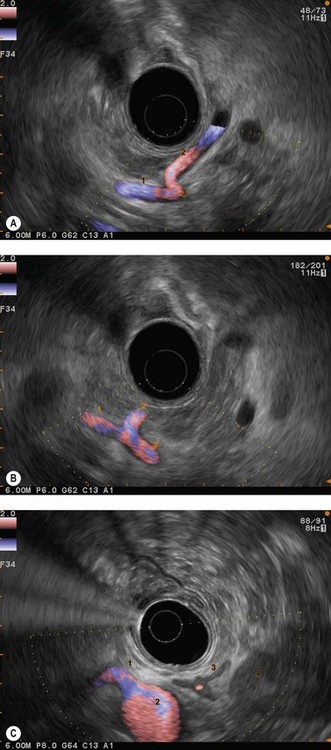
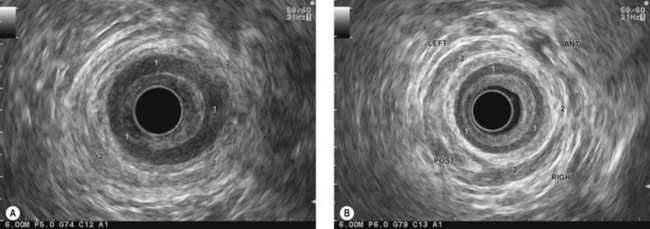
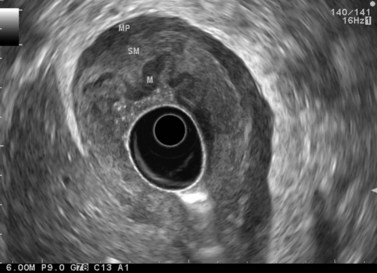
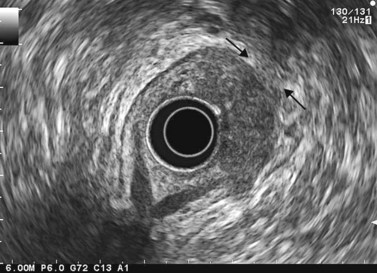
 Electronic in B-mode. The three companies that manufacture echoendoscopes supply this type of apparatus. The endoscopic view is either end-viewing (Pentax, Fig. 2A, or Fujinon, Fig. 2B), or oblique-forward (Olympus, Fig. 2C). The instruments produce several frequencies (5–12 MHz) and thus allow Doppler studies and power Doppler sonography. The latest instruments, which are connected to very sophisticated ultrasound consoles, allow contrast harmonic ultrasound after intravenous injection of ultrasound contrast agents.
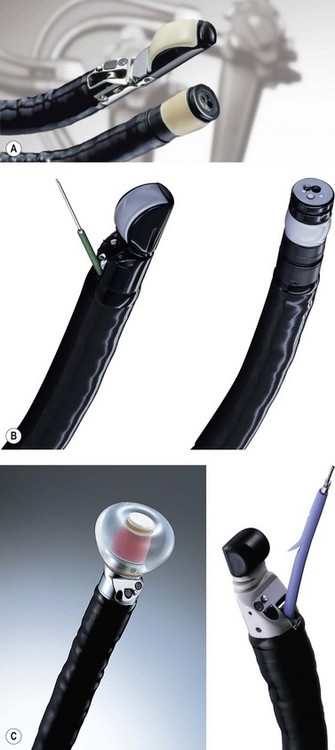
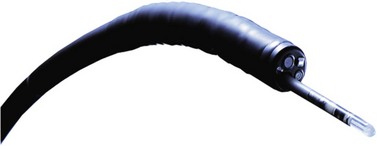
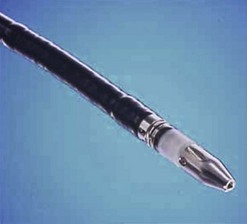
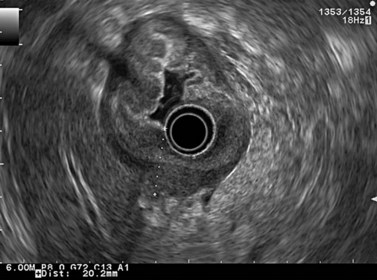
Figure 3 Olympus high frequency (mechanical radial) miniprobe (30 MHz) used through a standard gastroscope.
2.2.2 Curved linear array (Fig. 2)
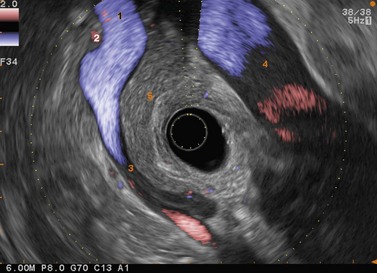
The ultrasound image obtained in electronic B mode is a sagittal image (Figs 5, 6) provided by an electronic transducer. The plane of the image is parallel to the axis of the endoscope.
The main advantage of this technique is the ability to carry out intra- or transmural EUS-guided FNA (Fig. 7) as the path of the needle to the target can be followed in real time on the ultrasound image.
As a result of this option, therapeutic EUS uses echoendoscopes with a large operating channel.
Two types of instrument use this technique: video-echoendoscopes and rigid probes.
2.4 How to position the patient, doctor, and console
2.4.1 Patient position
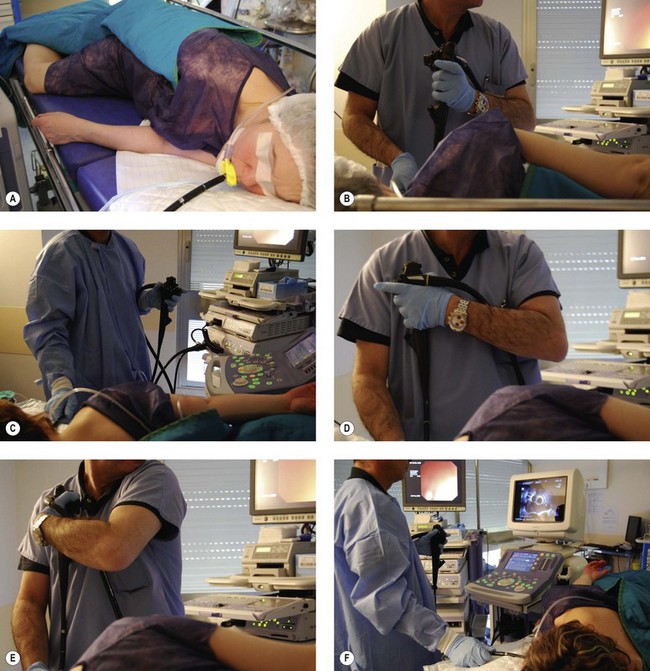
2.4.2 Examiner’s position
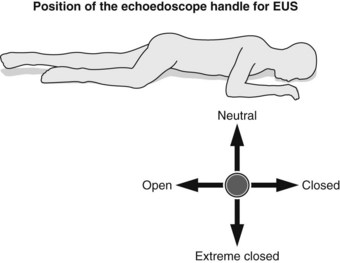
2.4.3 Position of the echoendoscope handle
Definitions concerning the position of the echoendoscope handle:
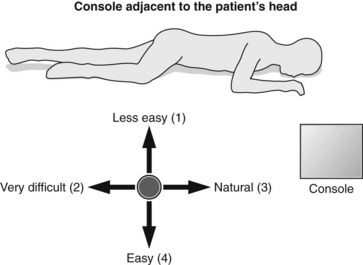
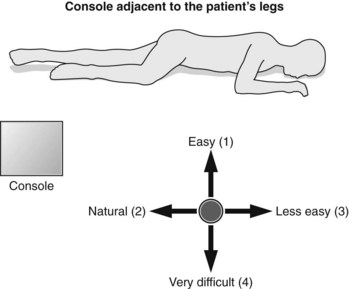
2.4.4 Console position


 Otherwise, it is best to position the console beside the patient’s legs, since this facilitates pancreaticobiliary and rectal examination (Fig. 12) in which the extreme closed position is rarely used and since this does not complicate esophageal or mediastinal examination; on the contrary, the right side of the screen corresponds well to the right part of the patient’s mediastinum and the left side of the screen to the left part of the patient’s mediastinum.
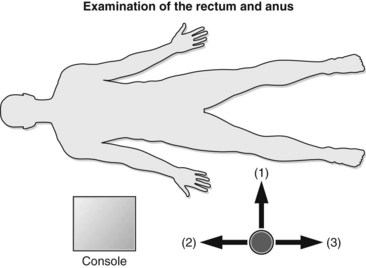
3 General EUS examination technique
3.1 General technique
 Warning!
3.2 Examination technique using miniprobes
4 EUS-guided FNA
4.1 Indications and contraindications
There is a broad range of indications for EUS-FNA and these are outlined in Box 2.
4.1.2 Needles
The needles are disposable and designed for single use.
Box 4 Needles
4.2 General aspects
EUS-FNA requires adequate sedation or general anesthesia and patient monitoring for at least 4–6 h afterwards. Many factors influence the success of EUS-FNA (Box 5).
 Warning!
The latest generation Olympus and Pentax echoendoscopes have an elevator and are therefore easier to handle than older echoendoscopes, because the angle of passage through the digestive wall to the target can be adjusted. This is particularly useful for lesions that are difficult to access, notably those of the uncinate process, for lesions remote from the digestive wall (more than 15 mm away), or for very small lesions (≤1 cm in diameter). The Fujinon echoendoscope has a virtual target line (Fig. 7C) that shows the operator the path the needle will take. The exit angle of the needle is very shallow and is comparable, without an elevator, to that provided by Olympus and Pentax instruments when used with their elevators.
4.4 Pancreatic cancer biopsy
The biopsy procedure must be stopped if blood is aspirated into the syringe.
4.6 Lymph node biopsy
4.7 Difficult biopsies
 Clinical Tip
4.8 Renal cancer metastases and endocrine tumor
The biopsy technique for a pancreatic mass suspected of being an endocrine tumor or a renal cancer metastasis must be different as regards the suction force exerted. Make several back and forth movements without suction, then lightly aspirate using a 2 cc syringe for 1–2 s. Cells from this type of cancer, which are very fragile, thus remain analyzable. This also lowers the risk of post-biopsy hematoma (see Fig. 138) associated with these hypervascular tumors.
4.9 Complications of EUS-FNA
 Warning!
5 How to examine tumors of the esophagus and mediastinum
5.1 General points
5.3 Special features of linear examination
5.3.2 Examination of the celiac region
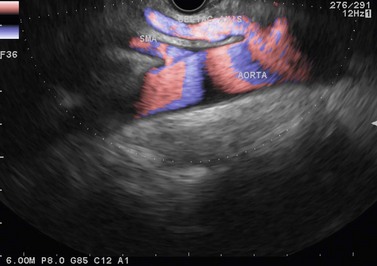
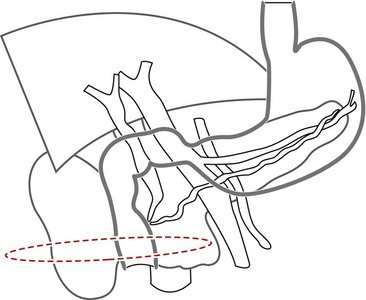
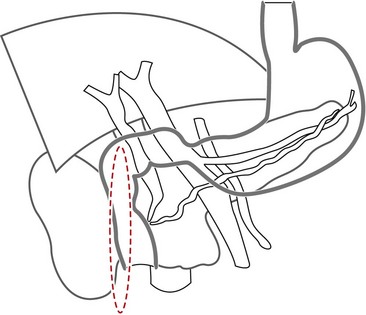
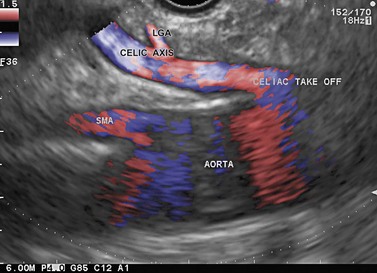
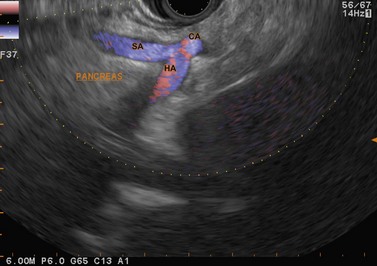
The celiac region is examined by inserting from the cardia, where the aorta should be located longitudinally, then descending 3–6 cm along the vertical lesser curve, along the aorta with small clockwise and anti-clockwise movements of the endoscope handle, since the celiac trunk often takes off laterally from the anterior face of the aorta. After locating the origin of the celiac trunk, follow it to the origin of the left gastric artery (see Fig. 52) which can be seen climbing vertically along the stomach then as far as the bifurcation of the hepatic artery and the splenic artery (see Fig. 52). The upper margin of the pancreatic body appears 1 cm below this bifurcation (see Fig. 53). The celiac lymph nodes are sometimes located in this bifurcation, sometimes along the lateral sides of the celiac trunk, which is examined by turning the endoscope handle clockwise and anti-clockwise in front of its origin. The left gastric lymph nodes are closer to the stomach along the left gastric artery, which is examined by following it upwards while withdrawing the echoendoscope from its origin at the celiac trunk.
5.3.3 Examination of the posterior mediastinum with linear instruments
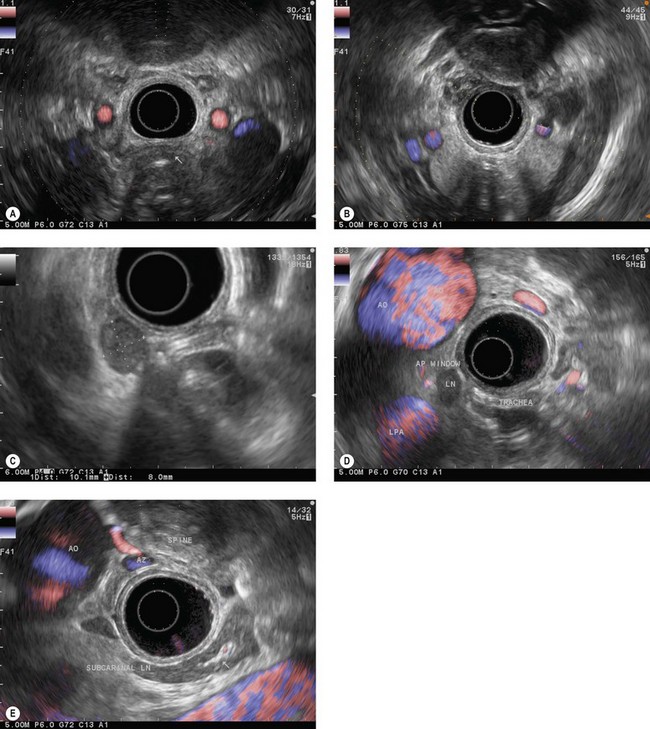
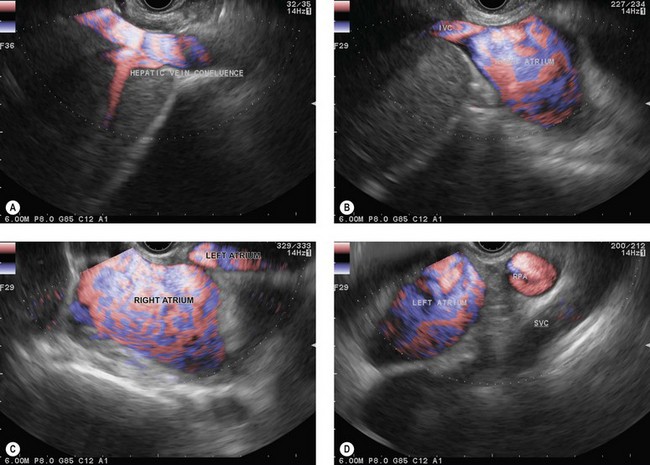
The endoscope is then brought up to the cardia (40 cm from the incisors), following the aorta longitudinally. At this point the suprahepatic venous confluence at the inferior vena cava (Fig. 14A) and the dome of the liver, which is located around it, can be observed by turning the handle clockwise and anti-clockwise, then climbing along the inferior vena cava as far as the right atrium (Fig. 14B). When the right atrium disappears on withdrawal of the endoscope (35 cm from the incisors), the left atrium (Fig. 14C) can be examined by making small clockwise or anti-clockwise turns of the handle, and the endoscope is brought up along the central part of the left atrium (the largest part) as far as its upper margin (28–30 cm from the incisors). On withdrawal, the subcarinal region then appears and the screen shows, below the transducer, from top to bottom, the air present in the trachea and carina, the subcarinal region, the right pulmonary artery in cross-section (Fig. 14D) and the upper part of the left atrium. Turning the handle clockwise and anti-clockwise then allows all the subcarinal lymph nodes (Fig. 14E) to be examined (the right group, which is close to the large azygos vein, the central group between the esophagus and the right pulmonary artery, and the left group near the descending aorta).
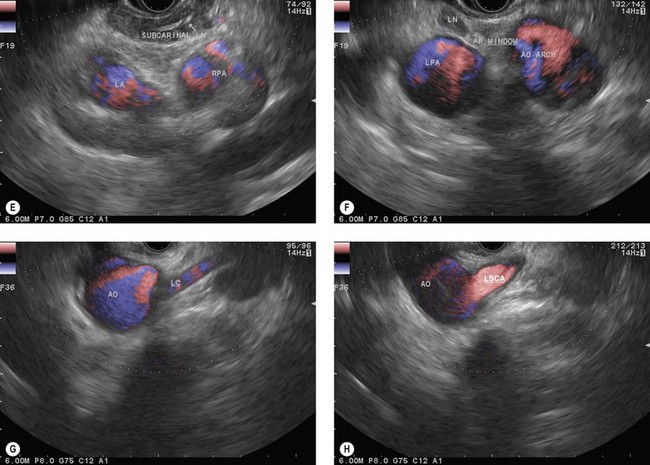
With maximum up angulation, withdrawing the endoscope 1–2 cm and turning the handle anti-clockwise, the aortopulmonary window (region IVL) will become visible between the aortic arch, round in section, at the top of the screen, and the left pulmonary artery, round in section, at the bottom of the screen (Fig. 14F).
Continuing withdrawal of the endoscope reveals the supraaortic (left paratracheal and para-esophageal) region with the left common carotid artery (Fig. 14G) and the left subclavian artery (Fig. 14H), then the origin of the left vertebral artery and the left retroclavicular lymph node region, finally, above the left thyroid lobe.
6 How to examine the stomach
6.2 Examination of the stomach with a radial instrument
For malignant or suspected malignant tumor disease, the examination begins in the duodenum, as for pancreaticobiliary examination, looking for retropancreatic and interaortocaval metastatic adenopathy, particularly at the base of the posterior segment of the hepatic pedicle. Returning into the bulb allows examination of the preportal (pyloric) hepatic chain. Moving into the stomach allows examination of the left gastric, celiac and cardiac lymph node regions. Each part of the stomach should be examined systematically, the antrum, body and fundus, to be sure you have examined the lymph node areas adjacent to these regions. The liver is the key landmark anteriorly, the pancreas is the key landmark posteriorly, the spleen for the greater curve, and the lesser curve can be readily located at the junction between the posterior and anterior walls (Fig. 15).
The key to success when performing EUS of the gastric wall is to try to obtain a study of the layers of the wall so that they are perpendicular to the ultrasonic beam (Fig. 1). EUS is not possible across the whole circumference of the stomach simultaneously. In other words, once the anomaly to be examined has been located roughly on one wall of the stomach, focus on this anomaly so that the layers of the wall over and below the anomaly, but also at its edges, are clearly individualized. It is only by proceeding in this manner that you can be sure that the EUS abnormalities are real and not due to an ‘oblique image’ which may be misinterpreted (overlapping of several structures creating false images that suggest serosal involvement of a tumor or wrongly attributing the anomaly to a layer other than the one in which it is actually located). Examination of the fundus is sometimes difficult when the lesion in question is small. It is sometimes easier to perform the examination without instillation of water, after aspirating all the air present. It is sometimes necessary to work with the echoendoscope in retroflexion to visualize the anomaly if it is small. Examination of the body of the stomach is easy, and examination of the antrum is equally easy for the horizontal portion. On the other hand, examination of the incisura is more problematic. The best solution is to inflate the balloon immediately upstream of the pylorus, maintaining maximum up angulation, to check that the gallbladder is facing the anterior side, which means that the lesser curve is then at the bottom of the screen and the greater curve at the top. Once this has been confirmed, withdrawal of the echoendoscope, with the balloon inflated and up angulation, usually means that it can remain perpendicular to the lesser curve, whether in the horizontal portion, the incisura itself or the vertical portion immediately above the incisura. Examination of an immediate prepyloric lesion is difficult because it is often impossible to avoid oblique images of the pylorus itself which will give the impression that there is a submucosal tumor in the muscle layer. This is a frequent cause of false positive results for stromal tumors. This type of error obviously occurs only with small tumors, since large tumors are usually clearly visible, regardless of the image plane used.
7 How to examine the pancreaticobiliary region
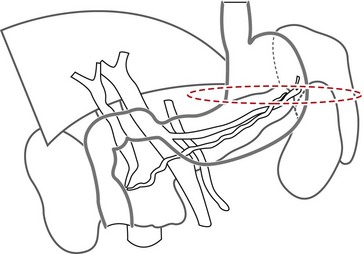
7.1 Essential anatomic knowledge for correctly performing a pancreaticobiliary examination
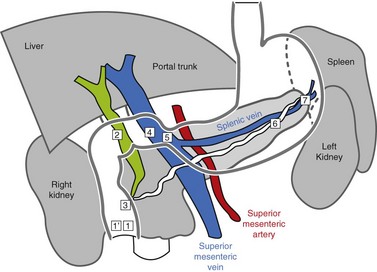
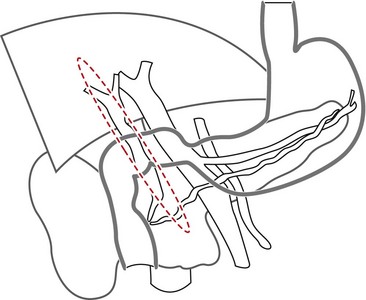
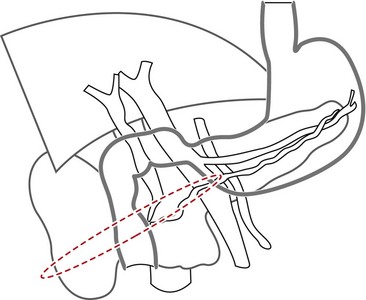
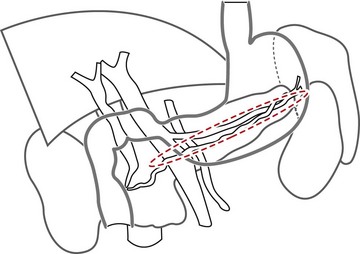
Familiarity with the celiac and mesenteric anatomy is required:
 Clinical Tip
7.2 Radial EUS pancreaticobiliary examination
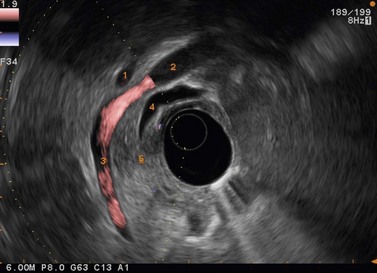
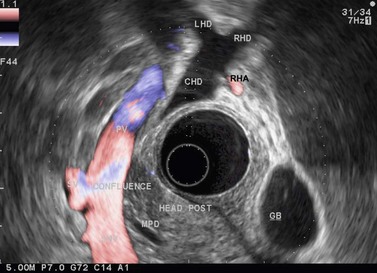
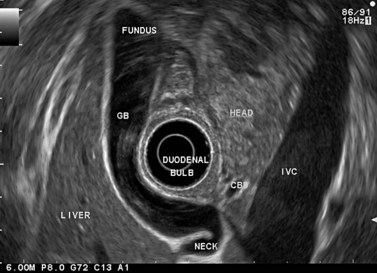
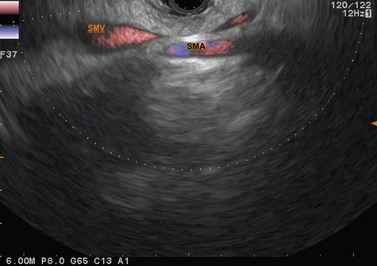
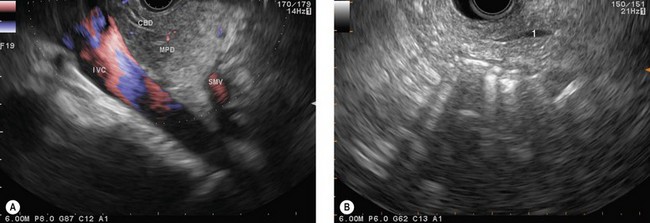
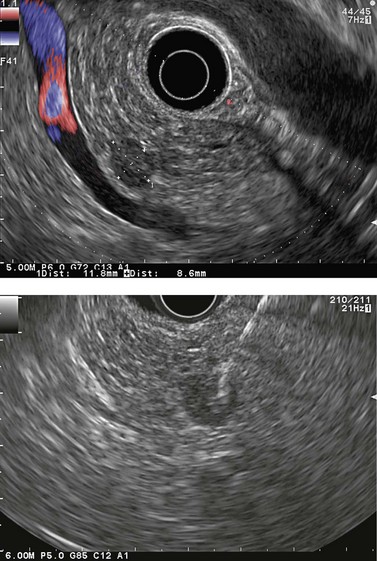
The vascular structures are the anatomical landmarks for the examination of the pancreaticobiliary region (Fig. 16).
Box 9 Pancreaticobiliary and duodenal examination with a radial instrument
7.2.1 Examination of the pancreatic head and the common bile duct
There are three ways of examining the head of the pancreas and the common bile duct:
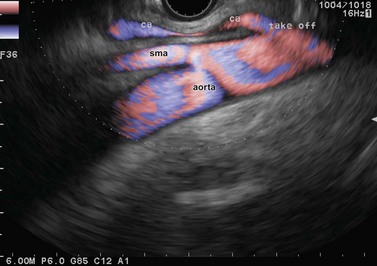
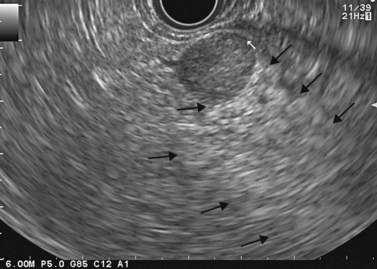
By withdrawal of the instrument (Fig. 19), with maximum up angulation, and turning the handle anti-clockwise, which advances the tip into the inferior duodenal angle bringing it upright (Fig. 20), you can see in succession at the top of the screen or the top and right: the aorta (Fig. 21), in a longitudinal image, then the superior mesenteric artery, also in a longitudinal image (to the left on the screen), and the left renal vein in a transverse image between the aorta to the rear and the superior mesenteric artery over and to the front. By withdrawing the echoendoscope a little more, turning anti-clockwise, with up angulation, this image is replaced by a image through the inferior vena cava (Fig. 22), which, like the aorta, occupies the top right of the screen, above the duodenum, the superior mesenteric artery being replaced by the superior mesenteric vein and the mesenteric-portal vein confluence. The segment of the pancreatic head adjacent to the duodenum, between the duodenum, inferior vena cava and superior mesenteric vein, corresponds to the uncinate process of the pancreas then to the posterior segment of the pancreatic head when the echoendoscope is retracted above the ampulla of Vater region. This region is located by the termination of the bile and pancreatic ducts but also by the junction between the two echogenically different regions of the pancreatic head (Fig. 23), present in 75% of patients. These are the hypoechoic right posterior juxta-duodenal area corresponding to the ventral pancreas, and the more echogenic left anterior juxta-mesenteric region corresponding to the dorsal pancreas.
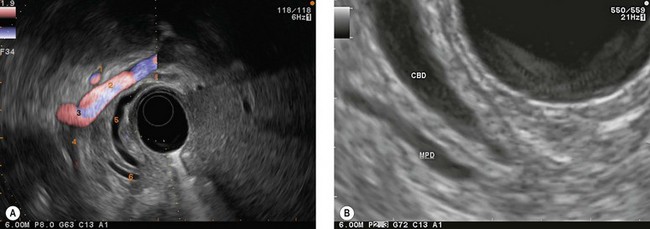
The secret of pancreaticobiliary examination is, while continuing to withdraw the endoscope, to obtain a long view of the mesenteric-portal vein confluence and the common bile duct (Figs 24, 25), which is the non-vascular ductal structure located closest to the duodenal wall. If you obtain an image lengthwise through the common bile duct and the mesenteric-portal vein confluence, what appears on the left of the screen is in fact at the front left, what is on the right of the screen is at the back left, what is at the top corresponds to the hepatic hilum and the liver, and what is at the bottom corresponds to the ampulla of Vater region. The segment of the pancreas between the duodenum and the superior mesenteric vein and the mesenteric-portal vein confluence is the posterior segment of the head.
The ampulla of Vater region can be examined in several ways: the simplest is to push the endoscope gently, following the common bile duct, once it has been brought into vertical view during the initial withdrawal of the instrument (Fig. 26). When trying to follow the common bile duct, turn the echoendoscope handle gently clockwise from the open position to the neutral position while pushing the instrument. Once you can see the bile duct close to the duodenal wall (Figs 27, 28) slight up angulation should be added which causes the bile duct to disappear and the terminal main pancreatic duct to appear (Fig. 29). The ampulla of Vater is then visible between 8 and 9 o’clock in contact with the balloon (Figs 28, 30, 31). An important point to note is that the ampulla is not satisfactorily visible until the bile duct disappears into the duodenal wall.
There is another way of visualizing the ampulla of Vater, but it is fairly difficult because the echoendoscope tends to withdraw rather too quickly during the maneuver. It involves starting from the long position with the handle in the neutral position and withdrawing the echoendoscope with up angulation, turning the handle anti-clockwise, or angulation to the left, which amounts to the same. After visualizing the superior mesenteric vessels in longitudinal section, at the point when the mesenteric vein appears on the screen (Fig. 22), the termination of the main pancreatic duct is usually visible in contact with the duodenal wall (Fig. 29), which means that the ampulla of Vater is exactly over the transducer. Stop withdrawing and advance again slightly so that you can see the last cm of the pancreatic duct along with its penetration point in the duodenal wall, which is then an indication of the presence of the ampulla of Vater between 8 and 9 o’clock on the duodenal circumference (Figs 30, 31).
If the superior duodenal angle is compliant (rarely the case in slim patients under 40, or in very thin patients of any age), the bile duct can be followed (Fig. 35) to the ampulla of Vater, advancing the endoscope by turning the handle clockwise, with neutral angulation then adding up angulation.
 The simplest way is to start from a neutral handle position, in the duodenal bulb, and advance the echoendoscope, keeping the gallbladder or liver above the balloon and observing the appearance of the common bile duct. At this point, rather than turning the handle clockwise to advance to the second part of the duodenum, turn the handle anti-clockwise to the open position and push the instrument against the superior duodenal angle. You can then see the bile duct running toward the liver: this is the common hepatic duct (Fig. 36) and the superior biliary confluence, often intersected at this point by the right hepatic artery.
 If this method is ineffective, you can push the echoendoscope to the long position in the second part of the duodenum and carry out specific withdrawal (Fig. 32). Once the ampulla of Vater has been visualized at 6 o’clock, release right angulation and partially release up angulation, and continue withdrawal of the echoendoscope, with the handle in the closed position.
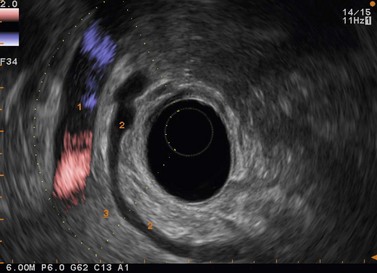
The common bile duct appears horizontal under the duodenum (Figs 37A, 37B). The cystic duct joins the common bile duct from below if you continue withdrawal very gently by adjusting the path of the common hepatic duct, keeping it horizontal by means of up angulation under the duodenum, aiming at the liver which is on the left of the screen. The vessel in this image, which is parallel to the common bile duct visible below it, is the inferior vena cava.
This also allows examination of the gallbladder (Fig. 38), which is to the left of the screen between the liver and the duodenum, turning the handle anti-clockwise from the neutral position and adding up angulation. The gallbladder fundus is at the top of the screen in this image, and the neck level with the balloon with its characteristic hook shape. The cystic duct can be followed from the gallbladder neck to the hepatic duct.
This view, which visualizes the portal vein below the transducer (Fig. 39), shows the anterior and superior segment of the pancreatic head between the bulb wall and the anterior side of the splenoportal vein confluence. At this point there is usually a bifurcation between the hepatic artery and the gastroduodenal artery, which can be followed to the rear of the bulb wall (i.e. below the bulb wall on the screen) by making back and forth movements advancing then withdrawing the endoscope, with up angulation, handle in the closed position (Figs 40, 41).
7.2.2 Examination of the pancreatic neck and body
If you continue progressive withdrawal of the echoendoscope, with the balloon very inflated, into the bulb, inverting the pylorus, you will see the pancreatic neck between the pylorus and the anterior side of the splenoportal confluence, below and to the right of the balloon. The landmark which indicates that you are opposite the neck is the superior mesenteric artery which is then visualized below the mesenteric-portal vein confluence (Figs 42, 43), in a transverse image. The main pancreatic duct in the neck is visible between the duodenal wall and the portal confluence.
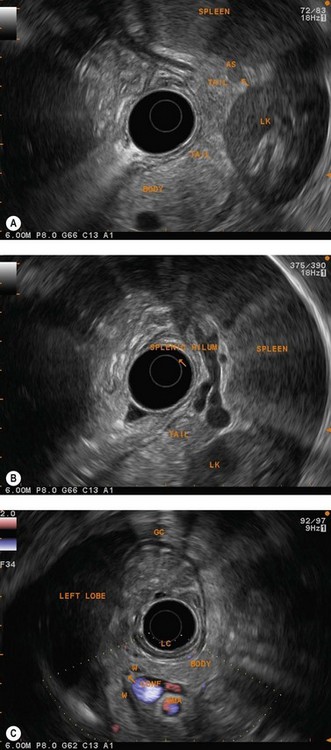
Entering the stomach, continuing to retract the instrument, with the handle in the neutral position and up angulation, usually positions the instrument in the middle of the gastric body (between 45 and 50 cm from the incisors), over the pancreatic body (Figs 44, 45), with the handle in the neutral position. If you angulate to the right and slightly down, the echoendoscope is pressed against the posterior side of the stomach, which usually allows the left portion of the pancreatic body and tail to be examined, along with the splenic vein (Fig. 46). If you angulate up, this usually places the echoendoscope along the vertical part of the lesser curve, and this allows the right part of the pancreatic body to be examined at its junction with the neck (Fig. 47).
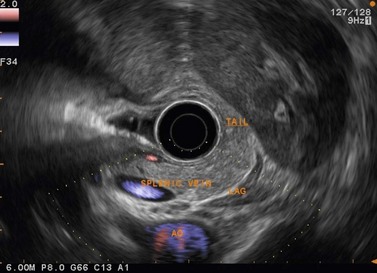
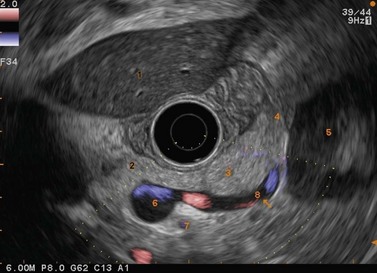
Changing from one of these positions to the other is usually done by slightly withdrawing the echoendoscope 1–2 cm to examine the left side of the pancreatic body and tail (Figs 48, 49A,B) and slightly advancing the endoscope 2 cm to visualize the right segment of the pancreatic body and neck (Fig. 49C). Apply slight up or neutral angulation when descending to the neck, and neutral or slight down and right angulation when withdrawing the echoendoscope to examine the pancreatic tail.
An important point is that it is as easy to examine the whole of the neck, body and tail, including the angle of the main pancreatic duct (Fig. 49C), through the stomach in women (shorter stomach) as it is difficult to visualize the neck and the junction between the neck and the head through the stomach in men. The junction between the neck and the head can thus be visualized (50 cm from the incisors) under the transducer through the bulb (Fig. 42), with the balloon very inflated pulling on the pylorus, with maximum up angulation, and with the handle in the closed position.
The celiac region can be examined immediately above the neck by withdrawing the instrument 1 cm, with maximum up angulation, and the handle in the neutral position (Fig 50A,B). An alternative method of examining the celiac region is to follow the aorta from the cardia, descending along the lesser gastric curve (Fig. 50C).
7.3 Linear EUS pancreaticobiliary examination
Box 10 Examination of the pancreaticobiliary region with a linear instrument
7.3.2 Examination of the neck and body-tail segment of the pancreas
There are two approaches to pancreaticobiliary examination through the stomach:
7.3.3 Transduodenal examination of the pancreaticobiliary region
The gallbladder (Fig. 59) is easy to observe through the duodenal bulb by turning the endoscope handle anti-clockwise. Once it has been visualized, the common bile duct can be located by advancing the endoscope slightly into the duodenal bulb and applying clockwise rotation. The common bile duct then appears between the duodenum and the right hepatic artery and the mesenteric-portal vein confluence (Fig. 60). If you continue to advance the endoscope, maintaining clockwise rotation, you will follow the common bile duct to the rear of the pancreatic head (Fig. 61) then see it enter the pancreatic head (Figs 62, 63) and terminate at the ampulla of Vater in the duodenum (Fig. 64). The appearance of the main pancreatic duct (Fig. 62) will have been observed in parallel, and can be followed in the same movement (Fig. 63) to its termination at the ampulla (Fig. 64). The reverse maneuver from the ampullary region, i.e. withdrawing the endoscope gently with anti-clockwise rotation, is sufficient to follow the bile duct as far as the hilum (Fig. 65). An alternative method of examining the common bile duct is to put the endoscope in the long position over the ampulla of Vater, then retract it progressively, maintaining maximum up angulation, pressed against the ampullary region and turning the handle clockwise. In this way the uncinate process can be seen located within the angle between the inferior vena cava and the superior mesenteric vein, below and behind the end of the main pancreatic duct and CBD (Fig. 66A). When the endoscope has reached the short position, you will see the termination of the pancreatic duct appear first (Fig. 66B), then the termination of the common bile duct, which can be followed for 2 or 3 cm (Fig. 67), i.e. along its intrapancreatic path.
8 How to examine the anorectal region
Box 11 Examination of the rectum
8.1 Anatomy
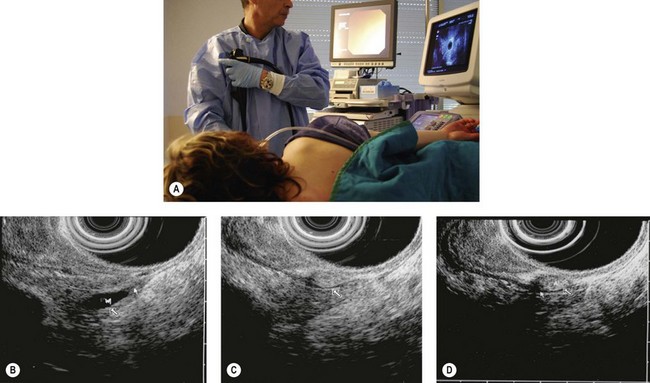
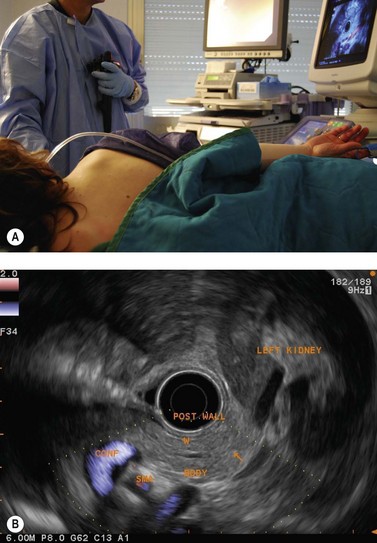
The patient is examined either supine or in left lateral decubitus. It is advisable to position the US console near the patient’s head so the examiner is therefore standing alongside the patient’s right thigh (Fig. 12).
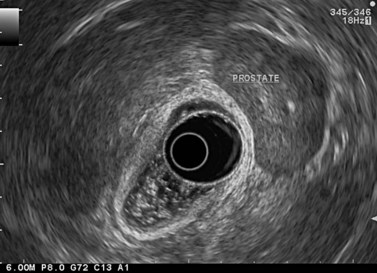
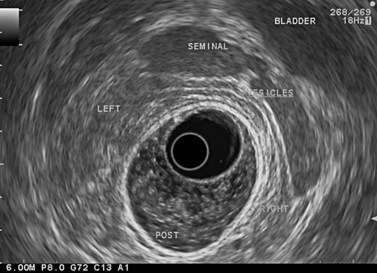
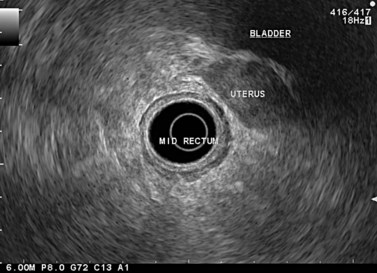
The urogenital organs are the preferred landmarks for examination of the anorectal region for the lower and middle rectum, if the endoscope handle is held in the open position facing the console screen. The prostate (Fig. 68) and the seminal vesicles (Fig. 69) on the one hand, and the vagina (Fig. 70), cervix uteri and uterus on the other, are usually positioned at the top right of the screen, while the sacrum and coccyx are at the bottom left.
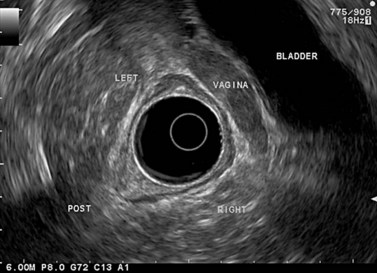
In a woman, the rectovaginal septum separates the vagina from the anterior wall of the lower rectum; it continues upwards between the posterior vaginal fornix, which is behind the cervix uteri, and the lower part of the middle rectum, then upwards between the uterus (Fig. 71), also called the neck of the uterus, and the upper part of the middle rectum. The recto-uterine pouch, which is located to the rear of the uterus, begins above the rectovaginal septum.
8.2 Anorectal examination
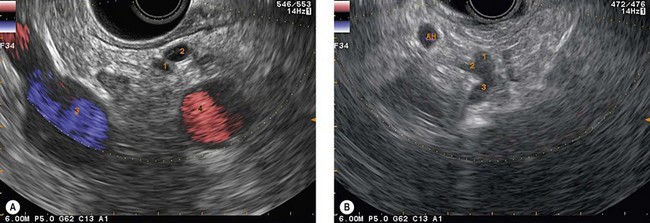
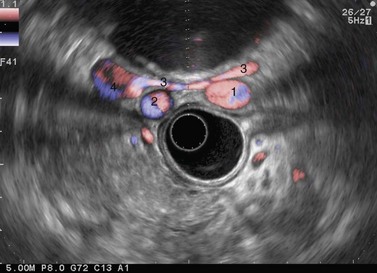
Examination of the lymph nodes in cancer of the rectum or anal canal should begin at the rectosigmoid junction, which should be reached while avoiding viewing the rectum endoscopically. To achieve this, about 100 cc of water should be instilled into the rectum to flatten the upper part of the rectum and advance the echoendoscope, moving progressively from the open position to the closed position, following the rectal curve revealed. Examination of the lymph nodes therefore begins over the sacral promontory where the spine is visualized at the front along with the vascular structures (Fig. 72), which bifurcate and continue along the withdrawal path of the instrument to the lower rectum, advancing and withdrawing again whenever a round hypoechoic structure appears so as to clearly differentiate a lymph node from a vascular structure: the latter can be followed for a short distance and has a Doppler signal.
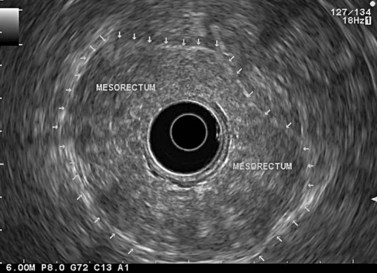
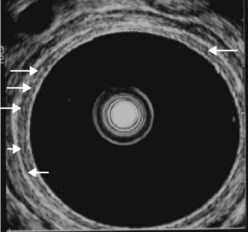
The instrument is therefore retracted progressively with anti-clockwise rotation moving from the closed to the open handle position on the way down from the upper rectum to the middle and lower rectum. The mesorectum and its external margin (the fascia recti) is clearly visible in patients when it is sufficiently fatty (Fig. 73).
The internal sphincter consists of a clearly visible, circular, hypoechoic band at least 2–3 mm thick (Fig. 74), in the anal canal. The striated external sphincter is less visible; over the anorectal junction and the lower part of the rectum, there is a longitudinal strip which surrounds the anorectal junction from the rear and extends anteriorly along both sides of the anorectal junction (Fig. 74). This is the puborectalis portion of the levator ani and forms a circular sling around the internal sphincter (Fig. 75A). The sphincter anatomy is easy to locate in men (Fig. 75B) and more difficult in women, since the anterior side of the circular striated sphincter is usually fairly short.
9 Ultrasound terminology
9.1 Structure of the digestive wall and basis for interpretation in digestive oncology
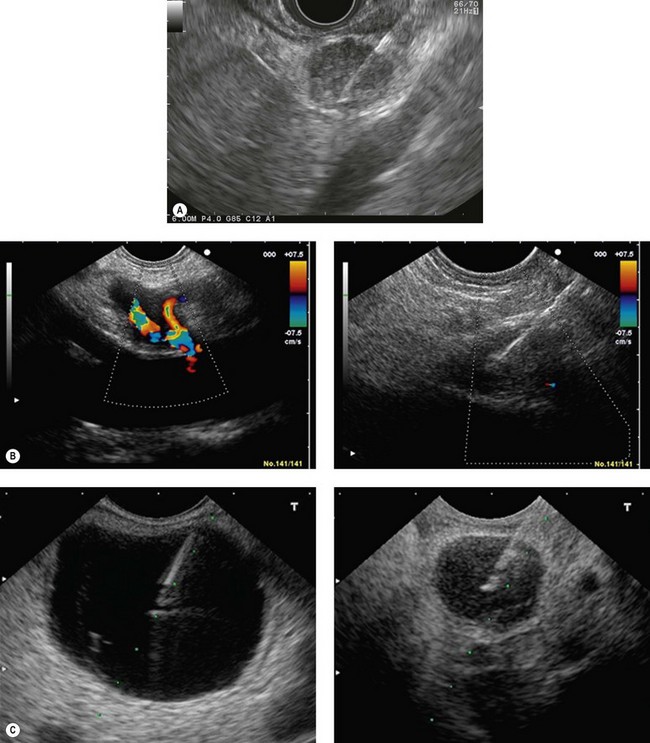
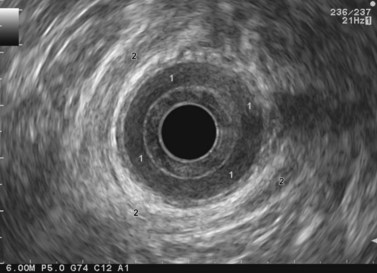
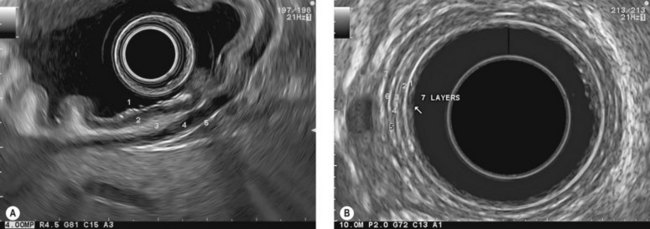
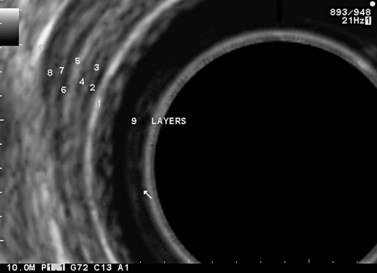
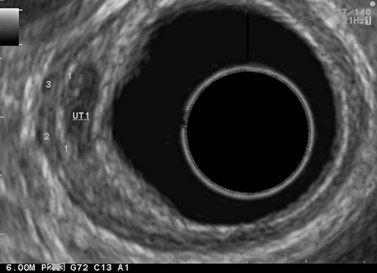
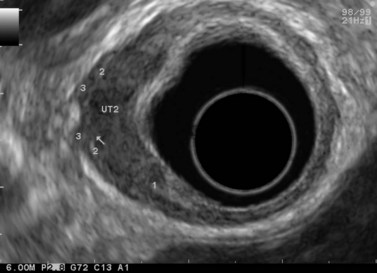
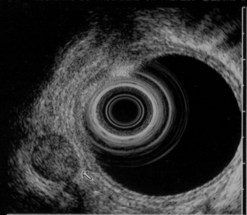
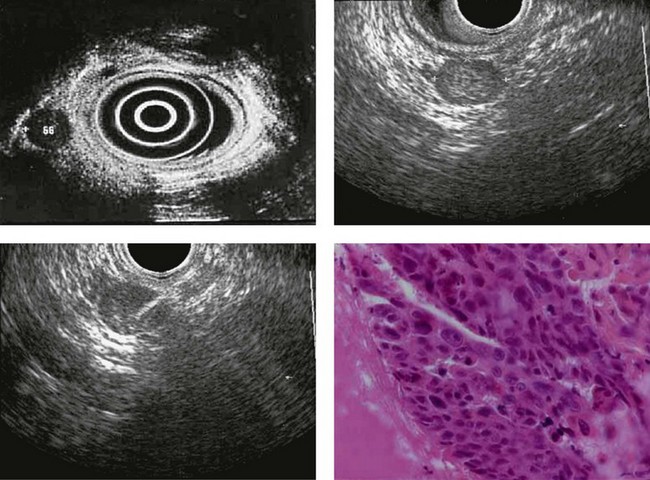
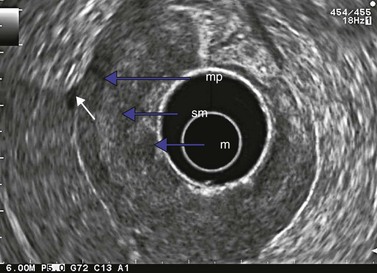
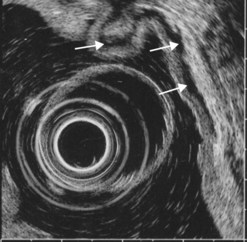
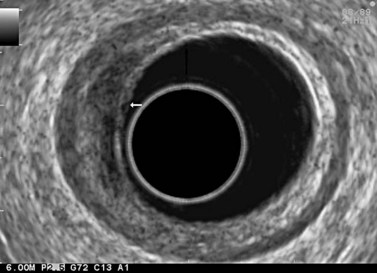
At a frequency of 5, 7.5 or 12 MHz, endosonography shows that the wall of the esophagus, stomach, duodenum, rectum and colon consists of five layers (alternately hyper- and hypoechoic) (Fig. 1). Seven layers can sometimes be visualized, particularly in the rectum but also sometimes in the stomach and proximal esophagus in normal individuals (Fig. 76), or in the lower esophagus, particularly in those with a primary motor disorder such as achalasia. The significance of these layers has been determined by in vivo but mainly in ex-vivo studies and is now clearly established.
9.1.1 Wall with five layers (Fig. 76A)
9.1.3 Wall with nine layers
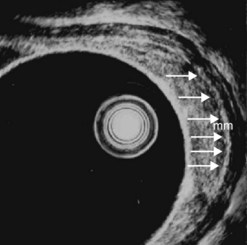
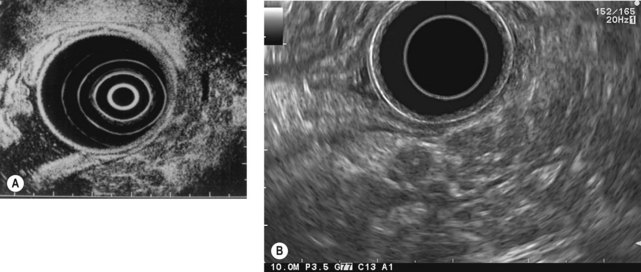
By using (Fig. 77) very high frequency miniprobes (20 and especially 30 MHz) and the zoom on electronic radial 10 MHz instrument (Fig. 78), nine concentric layers can be visualized in the gut wall in the esophagus, but also the stomach.
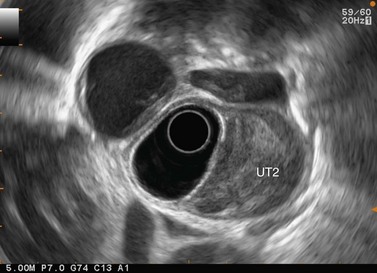
9.3 T1 tumor
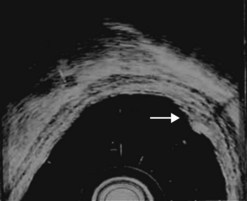
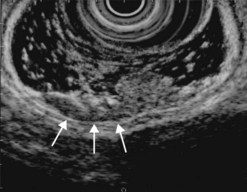
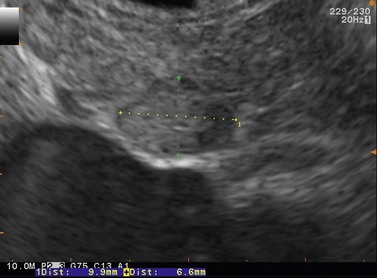
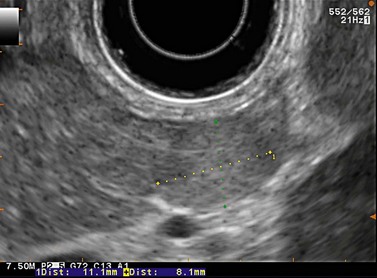
A tumor that leaves all or part of the echogenic middle third layer intact (in a five- or seven-layer wall) is a T1 tumor (Fig. 79), i.e. a superficial tumor. With the frequencies currently in use (5–12 MHz), it is impossible to distinguish within the T1 category between a tumor located in the mucosa (T1m), which has a generally very low risk of lymph node involvement regardless of the organ affected, and a T1 tumor which has already invaded the submucosa (T1sm). These have a distinctly poorer prognosis as there is a significant risk of lymph node involvement, which varies depending on the tumor site (Table 2), degree of differentiation and the presence of lymphovascular invasion.

From an endosonographic perspective, with regard to the esophagus and stomach, tumors eligible for curative endoscopic treatment are conventionally those that have not infiltrated the muscularis mucosae (hypoechoic fourth layer), if it has been correctly located in the nine layers visualized using a very high frequency miniprobe (preferably 30 MHz) (Figs 77, 80).
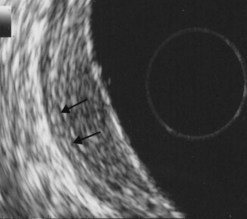
9.4 T2 tumor
In a wall with five or seven layers, a cancer accompanied by the disappearance of the echogenic middle third layer but leaving the echogenic peripheral fifth layer (or the echogenic peripheral seventh layer in a wall with seven layers) intact theoretically corresponds to a T2 cancer (a cancer that has invaded the muscularis propria) (Figs 81, 82). In 10% of cases, a cancer accompanied by the disappearance of the echogenic middle third layer (submucosa) is overstaged as T2 when it is really a T1 cancer because the submucosa can be entirely invaded by the tumor, without the muscle layer being involved (sm3).
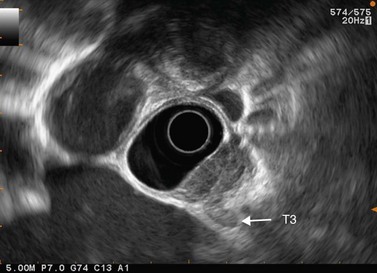
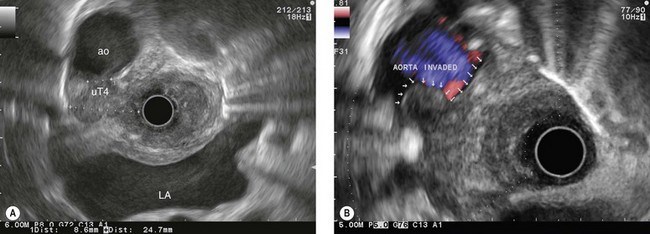
9.5 T3 and T4 tumor
In a wall with five or seven layers, the disappearance of the fifth or the seventh layer corresponds to a T3 tumor (Fig. 83). In such cases T2 tumors are overstaged as T3 in 5–10% of cases. A tumor is staged T4 when the cancer is invading a neighboring organ.
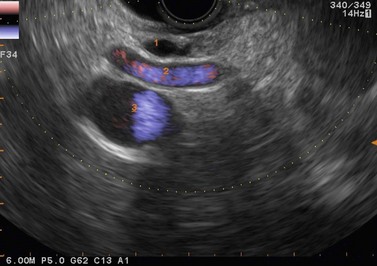
9.6 Regional lymph nodes
9.6.1 Lymph node appearances
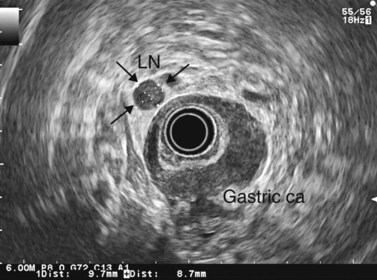
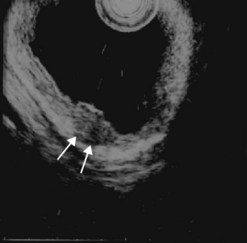
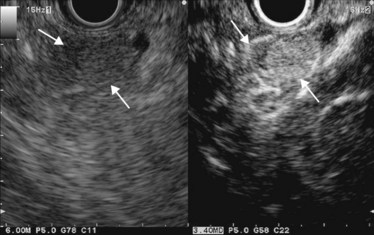
Metastatic lymph nodes usually appear as round, hypoechoic, finely heterogeneous, spherical structures, i.e. round in all planes and with a well-defined border (Fig. 84). They are sometimes more echogenic (Fig. 85), but this is observed only if the tumor itself is relatively echogenic, since the echostructure of the metastatic lymph node is comparable with that of the primary tumor. They are sometimes very hypoechoic and even anechoic, but in this case their echostructure is also comparable with that of the primary tumor. The presence of readily identifiable lymph nodes in areas that are usually unaffected is an important indicator of malignancy in these lymph nodes, particularly if the lymph node area in question drains directly from the primary tumor (usually on the same side, particularly in the mediastinum). Silicosis (as regards the posterior mediastinum) and some lymph node diseases such as sarcoidosis, histoplasmosis, lymph node tuberculosis or malignant non-Hodgkin’s lymphomas may be accompanied by lymph node anomalies affecting numerous subdiaphragmatic or posterior mediastinal areas, thus mimicking massive lymph node involvement where associated with esophageal, stomach or lung cancer. It is very rare for a digestive tract or lung cancer to coexist with a lymph node disease causing massive enlargement of the peridigestive lymph nodes, but the possibility should not be disregarded.
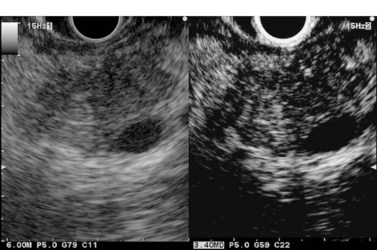
9.6.2 Lymph node size
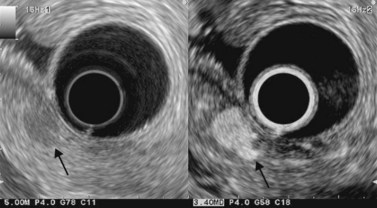
Very small non-metastatic lymph nodes (reactive or physiological) may be either very hypoechoic, homogeneous, with a distinct border, but are flat (not spherical). They are usually relatively hyperechoic, oval, but not spherical (flat) or triangular, and they are more echogenic than the primary tumor. The presence of calcification, particularly in the subcarinal region and hepatic pedicle, is a sign of benign disease, when the calcifications remain central and are not disorganized. The presence of a linear hyperechoic band (known as a lymph node sinus) in the middle of the lymph node (Fig. 13E) or apparently aiming towards the center of the lymph node (Fig. 86) from its periphery is also a sign of benign disease when a lymph node is enlarged. The interpretation of this phenomenon is that the cause of the enlargement has not had the effect of disrupting the lymph node architecture as an invasive tumor would do. This obviously does not exclude the presence of micrometastasis.
9.7 EUS-FNA
The advent of fine-needle biopsy and EUS-FNA (Fig. 87) has totally altered the debate concerning the specificity of endosonographic appearances of lymph nodes for a diagnosis of malignancy, regardless of whether they are peri-esophageal posterior mediastinal or perigastric and in particular celiac or perirectal lymph nodes. The diagnostic accuracy of EUS-FNA of accessible lymph nodes is 90%, which is clearly higher than that obtained by analysis of the EUS morphological features, which varies from 60% to 75% depending on the cancer examined. This improvement in the diagnostic accuracy is related to an improvement in specificity, which is close to 100%. The positive predictive value of malignancy is therefore close to 100%. On the other hand, the sensitivity of EUS-FNA depends on the diameter of the lymph node examined. It is approximately 70% for lymph nodes measuring less than 10 mm in short axis, whereas it is more than 90% for lymph nodes measuring ≥10 mm. This lack of sensitivity explains the negative predictive value for malignancy (ability of the method to strictly exclude a malignant diagnosis) which is approximately 75% (50% when the short axis diameter is <10 mm, 80% when it is ≥10 mm). In other words, when EUS-FNA of a lymph node measuring <10 mm does not yield any evidence of malignancy, there is a 50% chance that this is true, whereas when it yields evidence of malignancy, this is almost always the case. In some locations, the sensitivity and specificity of the EUS image of a spherical hypoechoic lymph node measuring >1 cm and with a distinct border, are greater for a diagnosis of malignancy than the result of EUS-guided FNA; this applies mainly to lymph nodes in the celiac region when they are associated with esophageal cancer.
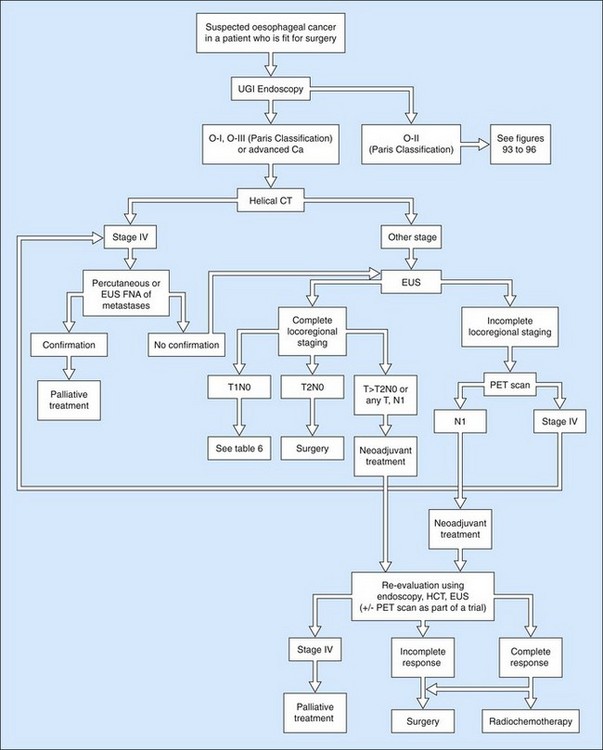
10 Endosonography in gastrointestinal oncology
10.2 Assessment of GI cancers prior to neoadjuvant therapy or surgery
Endosonography is not equally useful for all tumors and its role can be separated into two parts:
10.3 Esophageal cancer
Box 12 Esophageal cancer
10.3.1 Performance
Overall, the diagnostic accuracy of endosonography for parietal involvement is 85% (Figs 79, 81–83, 88), whereas the diagnostic accuracy for lymph node involvement is 80%. The diagnostic accuracy is comparable from one T stage to another, although it is not quite as good for stage T2.
The role of endosonography in relation to CT of the chest and abdomen is now well established. CT scanning is used to assess for any hepatic and pulmonary metastases, while endosonography is used for assessment of locoregional involvement if there is no evidence of distant metastases. The role of positron emission tomography (PET scan) is not yet clear, however, owing to its cost and accessibility and to the results of studies of its advantages compared with helical CT and EUS, it makes sense to limit its use to prospective trials or cases in which it is impossible to carry out a full assessment by EUS (Fig. 89).
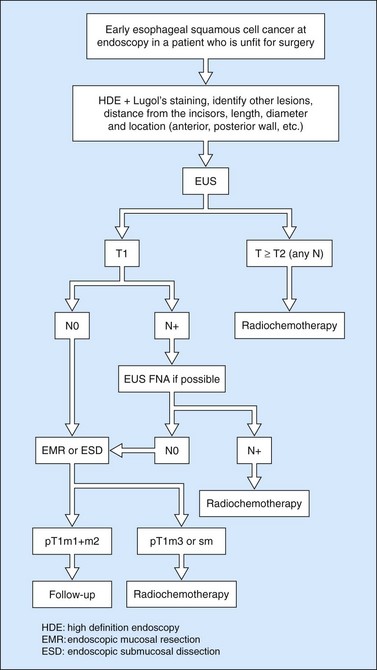
10.3.2 Squamous HGD and early esophageal squamous cell cancers
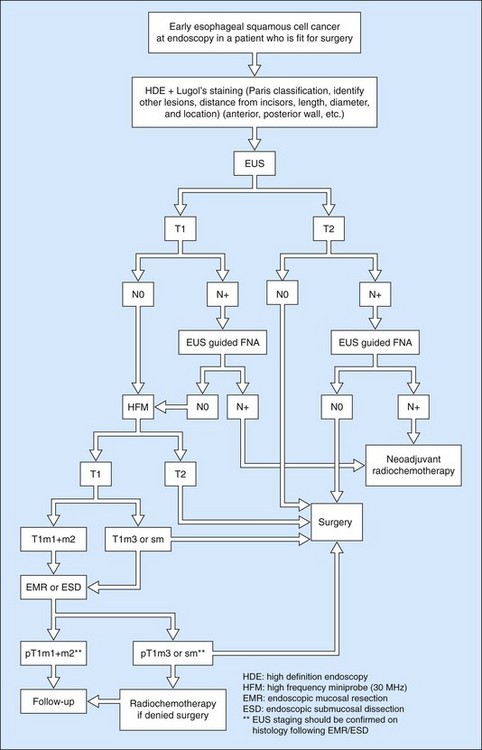
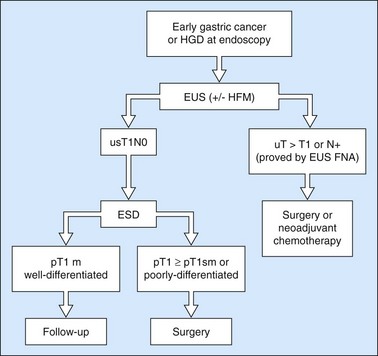
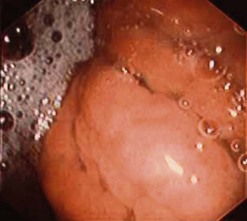
Owing to the advent of very high frequency miniprobes, the muscularis mucosae can now be visualized in a high percentage of significant cases. If this technique is applied to a squamous cell cancer with an endoscopic appearance of a flat tumor, it yields a diagnostic accuracy of 85% for detecting infiltration confined to the mucosa, accessible to curative endoscopic mucosal resection (0–3% of metastatic lymph node involvement in this type of cancer). Diagnostic errors are almost always overestimates (demonstration of involvement of the submucosa when the muscularis mucosae has not been infiltrated), related to peritumoral inflammation. Standard EUS should be performed routinely to confirm that the tumor is T1 (the submucosa has not been infiltrated) and N0 (with no apparently metastatic lymph nodes in the peridigestive region). If the patient is operable, he or she may be referred to a practitioner with experience of very high frequency miniprobes once the tumor has been classified as usT1N0 using a standard echoendoscope, so that only usT1mN0 patients are offered endoscopic mucosal resection (EMR) or endoscopic mucosal dissection (ESD) (Figs 90–92), since these techniques are not without significant complications. The use of very high frequency miniprobes is clearly essential before the use of photodynamic therapy and radiofrequency ablation for the treatment of high-grade dysplasia and intramucosal carcinoma with visible lesions, since these destructive techniques do not yield histological confirmation (as after EMR or ESD) of the effectiveness of the treatment. Figures 93 and 94 show the indications of EUS for early squamous cell cancers.
10.4 Gastric cancer
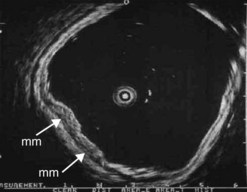
Figure 98 Same patient as Figure 79. Early uT1m2 gastric cancer visualized with the 30 MHz Olympus high frequency miniprobe. mm: muscularis mucosae.
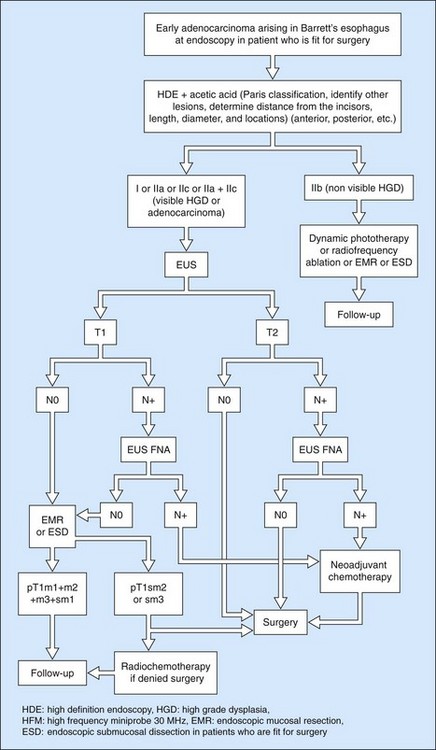
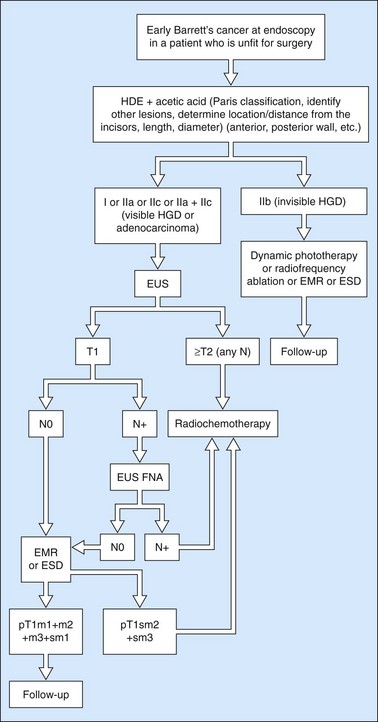
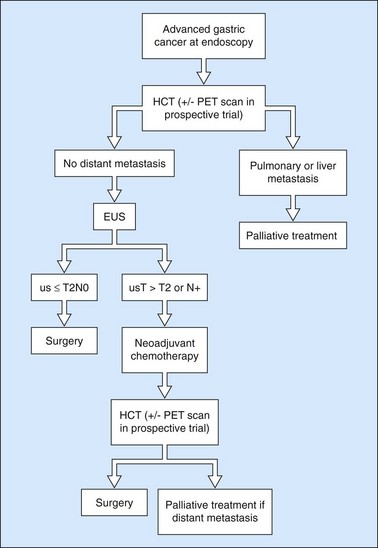
Since the advent of preoperative neoadjuvant therapy, the use of EUS after CT is far commoner (Figs 101, 102) in order to select patients who may be immediately operable (usT2N0M0) and those who should receive neoadjuvant treatment (Fig. 93) (us T >T2 or any T N+).
10.4.1 Junctional/cardia cancers
Junctional cancer has two features which complicate management compared to other stomach cancers:
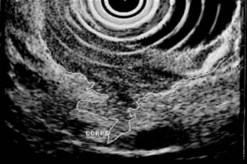
10.4.2 Linitis plastica
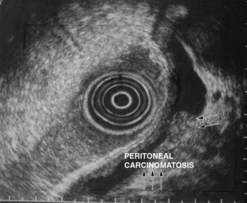
Linitis plastica is often difficult to diagnose (>50% of cases are missed) with endoscopy and biopsies. The entirely characteristic endosonographic appearance of this disease makes EUS the best diagnostic technique (Figs 103, 104). Besides its role in the differential diagnosis of benign hypertrophic gastritis (Figs 105, 106) and linitis plastica, gastric endosonography is capable of detecting minimal ascites which indicates peritoneal carcinosis, undetected by other imaging techniques (Fig. 104). It is also useful for demonstrating infiltration of adjacent organs, in particular the corporeo-caudal region of the pancreas (usually between 45 and 50 cm from the incisors facing the posterior side), or the transverse mesocolon (under the pancreatic body facing the horizontal greater antral curve). The same applies for detecting submucosal involvement upwards to the esophagus or downwards to the duodenal bulb. The results of EUS FNA for the diagnosis of linitis plastica are poor (sensitivity <30%).
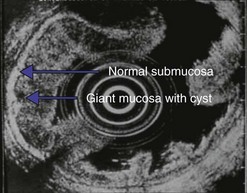
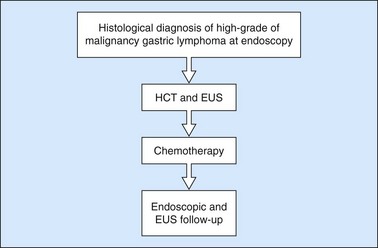
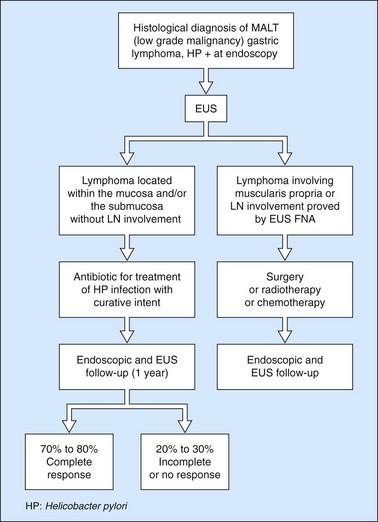
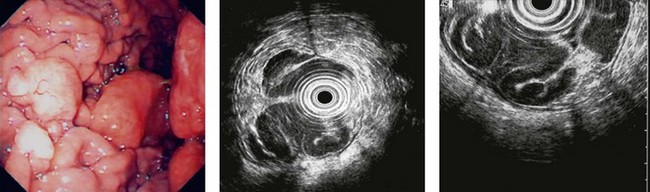
10.4.3 Gastric lymphomas (Figs 107, 108)
There are several EUS features (Figs 109–111) of gastric lymphomas: flat, large folds, nodular or polypoid, or infiltrated pseudolinitis. None of these features are specific for the diagnosis, despite what was initially described. The diagnosis of lymphoma is a histological diagnosis obtained easily from biopsies performed during endoscopy. The main benefit of endosonography is thus in assessing locoregional involvement. Endosonography is very effective for this purpose with a diagnostic accuracy in the order of 90% for T staging and 80% for N staging. In low-malignancy MALT lymphoma, endosonography is the most reliable predictor of a response to Helicobacter pylori eradication. In addition to the efficacy of antibiotic treatment on H. pylori eradication, two pre-therapeutic endosonographic criteria are highly predictive of a good response, and these are infiltration confined to the mucosa or the superficial part of the submucosa (tumor thickness <5 mm) and the absence of lymph node involvement detectable by EUS. If both these criteria are met, the response rate (complete remission) 18 months after successful H. pylori eradication is 70–80%.
10.5 Rectal cancer
10.5.1 Parietal involvement
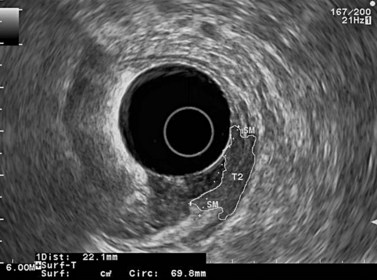
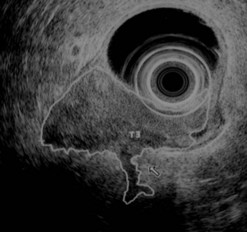
The diagnostic accuracy of endosonography for the parietal involvement of rectal cancers according to the TNM classification varies from 75–95%. It is in the order of 95% for T1 tumors (Figs 112, 113), 75% for T2 tumors (Fig. 114), 90% for T3 tumors (Fig. 115) and 95% for T4 tumors. The distinction between a T1 tumor and greater involvement (T2 to T4) is 95%. The distinction between a tumor located in the wall (T1, T2) and a tumor that has reached the fat or an adjacent organ (T3, T4) is 90%.
10.5.2 Lymph node involvement
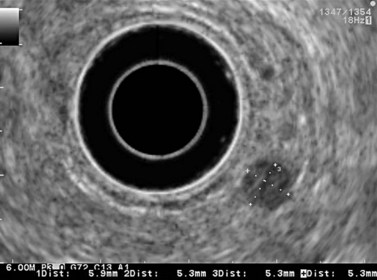
Lymph node involvement is correctly predicted in 70% of cases (Fig. 116). Round (splenical) shape, hypoechogenic, well demarcated, >5 mm in smaller diameter are criteria suggesting malignancy.
10.5.3 In summary
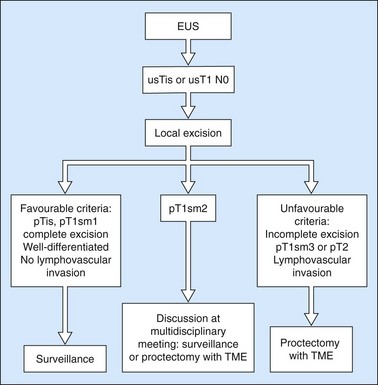
Endosonography is significantly superior to clinical examination and CT for assessing parietal and lymph node involvement. Comparisons have also shown that endosonography is superior to MRI for assessing the spread of localized tumors to the wall, equivalent for assessing the spread of advanced tumors (T3)), and equally sensitive for assessing lymph node involvement. Furthermore, EUS FNA can be carried out if necessary (which improves the specificity of the method). MRI seems to be more accurate than EUS in case of T4 cancer of the upper rectum. The management of early rectal cancer is summarized in Figure 117. Actually, since the last 2 years, the management of advanced rectal cancer has changed because of the better efficacy of the neo-adjuvant chemoradiation therapy in comparison with radiotherapy alone. The indications of neoadjuvant chemo-radiation therapy have dramatically increased. Any rectal cancer which is staged by EUS or MRI as T >T2 receives neoadjuvant chemoradiation therapy whatever the circumferential margin is more or less than 1 mm. Moreover, any lymph node visualized by EUS or MRI leads to chemoradiation therapy. Thus, the specific indications of MRI (i.e. to determine the circumferential margins of the rectal cancer staged as T3 using EUS) have now disappeared.
10.6 Anal cancer
The depth of the involvement of the anal canal and the rectal wall and the presence of metastatic lymph nodes around the rectum are major prognostic factors as regards the response to radiotherapy or radiochemotherapy. Anorectal endosonography should be considered essential for the treatment of patients with squamous cell cancer of the anal canal (Figs 118, 119); it has, in fact, been shown that endosonographic staging (T1 no invasion of the rectal muscle layer or the internal sphincter, T2 invasion of the rectal muscle layer or the internal sphincter, T3 invasion of the peri-rectal fat or the striated sphincter, T4 invasion of the vagina or rectovaginal septum, invasion of the prostate) is a significantly better predictor of response to treatment than the use of the clinical TNM classification. EUS is particularly useful for cT1 or cT2 tumors in the clinical UICC classification as 20–30% of these tumors are classified uT3 by endosonography. Furthermore, the sensitivity of endosonography for detecting N1 invaded lymph nodes (perirectal) is significantly superior to clinical examination (UICC classification). Finally, EUS FNA can easily be performed if necessary (in contrast with CT, MRI and PET scans).
10.7 Post-therapeutic monitoring of digestive cancers
Post-therapeutic monitoring has been shown to be clearly advantageous in rectal cancer after surgery and probably advantageous for cancers which have not been treated surgically (anal canal or lymphoma). Its value is debatable after neoadjuvant treatment of esophageal cancers. Generally speaking, the post-therapeutic monitoring of digestive cancers treated medically is far more difficult than pre-therapeutic assessment or the post-therapeutic monitoring of cancers after surgery, since residual parietal and peridigestive anomalies detected by EUS are common and they are particularly difficult to interpret (scar or recurrence) (Fig. 120). This underlines the importance of sending these patients to referral centers with experience in this form of monitoring.
11 Pancreatic disease
11.2 Diagnosis and assessment of locorectional involvement in pancreatic cancer
11.2.1 How does EUS perform in the diagnosis of pancreatic cancers?
The sensitivity of EUS in the diagnosis of pancreatic cancers exceeds 95%, even for small cancers (Fig. 121) with a diameter of 2 cm or less (these cancers are rare but unfortunately represent the vast majority of cancers curable by surgical resection). These small cancers are not detectable by MDCT in 30% of cases because they remain isodense after the injection of contrast medium.
Nevertheless, subject to the results of current studies on the use of contrast media (Box 13) and elastography (Box 14), two new methods of tissue characterization whose results are promising, none of the EUS characteristics of pancreatic masses has a sufficient positive or negative predictive value for satisfactorily discriminating between a malignant tumor and an area of pancreatitis. It has, moreover, been shown that in the case of chronic advanced pancreatitis or after a recent episode of severe acute pancreatitis, EUS may miss a pancreatic cancer.
Box 13 Contrast-enhanced EUS
In CEH-EUS
In summary, EUS, combined if necessary with FNA, is essential for the diagnosis of pancreatic cancer when imaging methods (MDCT and MRI) do not provide any certainty (see Fig. 132).
11.2.2 How does EUS perform in the assessment of locoregional involvement in pancreatic cancers?
Definition


In summary
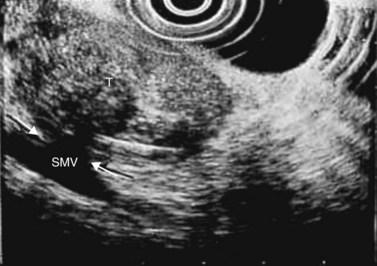
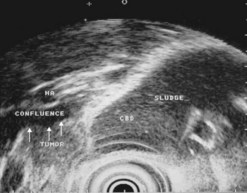
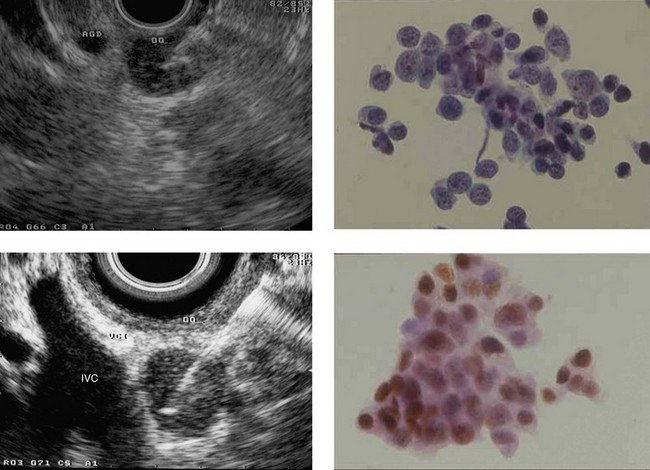
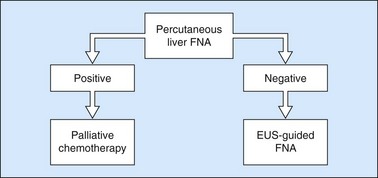
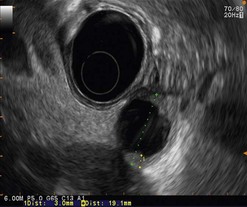
Figure 130 EUS-guided FNA (22 G needle) of a small (12 mm) subcapsular liver metastasis in segment II.

11.2.3 Indications and results of EUS-FNA of solid pancreatic masses
The validated indications of EUS-FNA are:
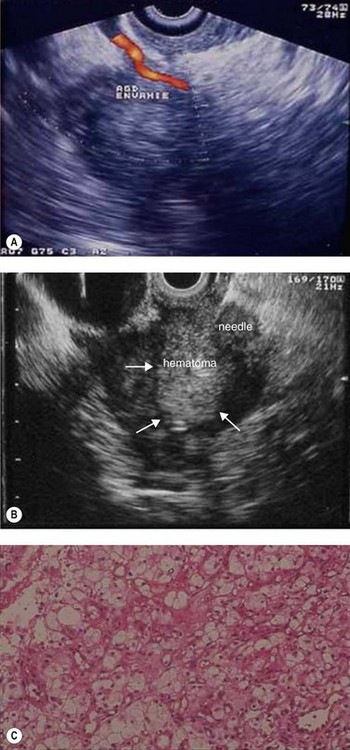
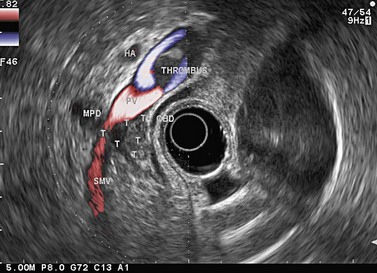
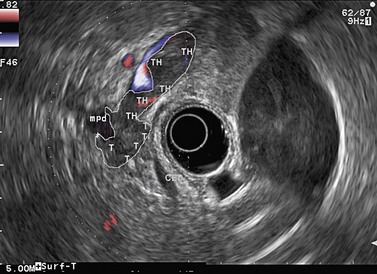
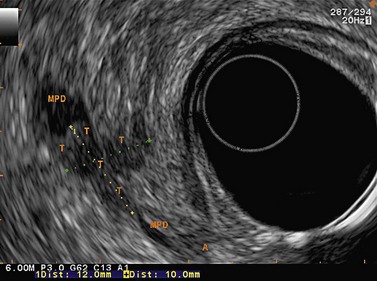
Figure 141 Same patient as Figure 140. TH, portal vein thrombosis, T, tumor, MPD, main pancreatic duct.
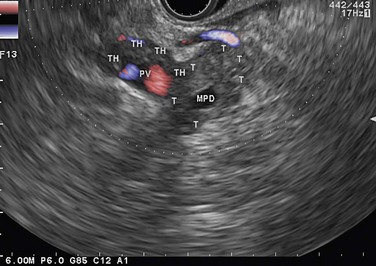
Figure 143 Same patient as Figure 140 seen with linear scope. Note the tumor (T) involving the main pancreatic duct (MPD) and portal vein (PV) with portal vein thrombosis (TH).
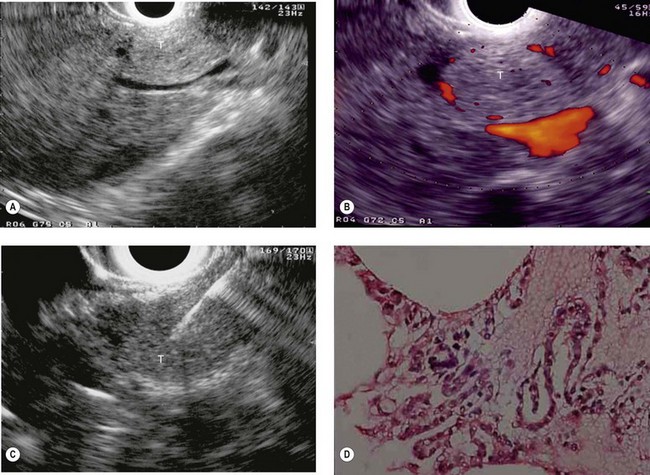
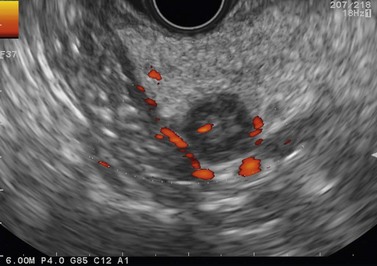
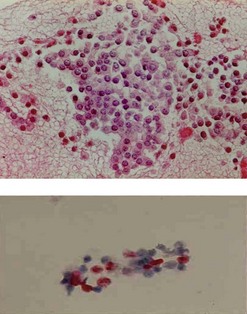
Figure 147 Same patient as in Figures 145 and 146. The cell block demonstrated positive immunohistochemical staining with chromogranin A (upper image) consistent with a neuroendocrine tumor. Immunohistochemical quantification of the proliferation marker KI 67 evaluated at 20% on liquid phase cytology suggesting a small malignant endocrine cancer (lower image), which was confirmed on histology of the resected specimen.
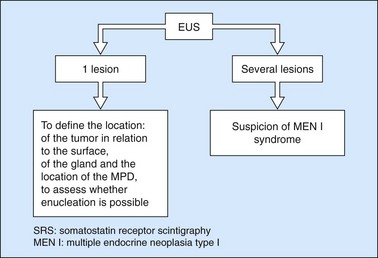
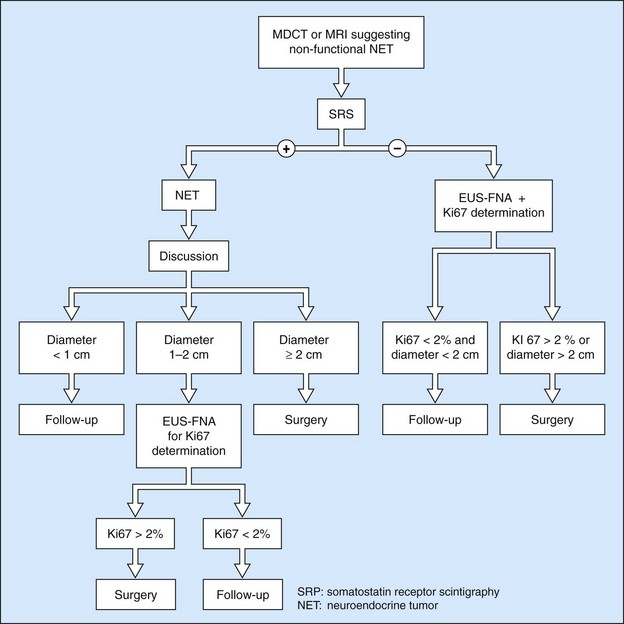
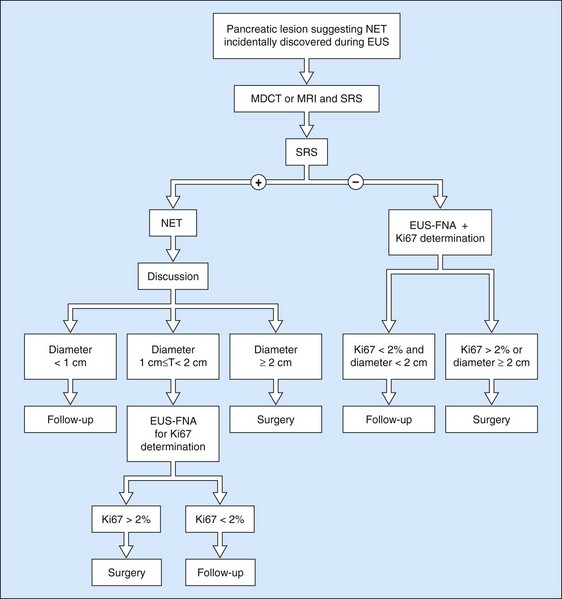
11.3 Pancreatic neuroendocrine tumors
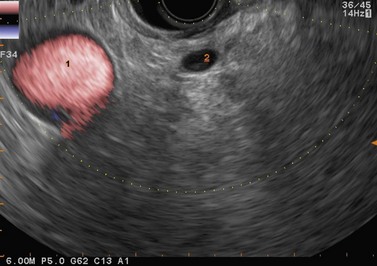
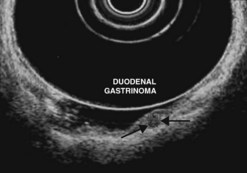
Ever since the 1980s, EUS has been the reference examination for determining the preoperative location of secretory endocrine tumors potentially of pancreatic or duodenal origin, and in particular the two commonest forms, insulinoma and gastrinoma. When the method is performed by an experienced EUS operator, the diagnostic accuracy of the method for locating pancreatic gastrinomas or insulinomas exceeds 90%, whereas in combination with somatostatin receptor scintigraphy, its sensitivity is 90% for duodenal gastrinomas (Figs 149–157).
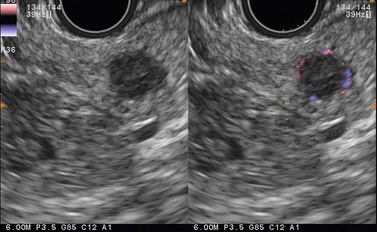
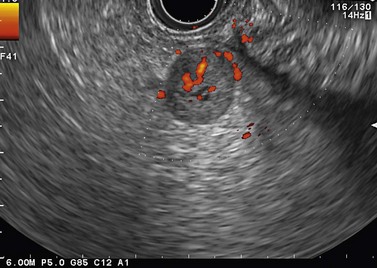
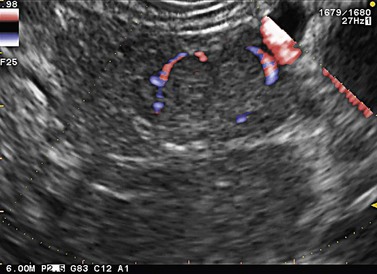
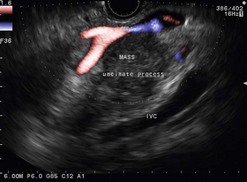
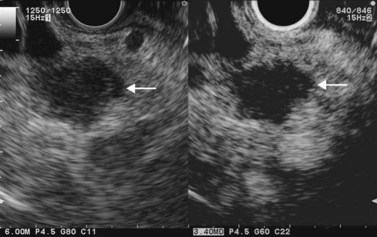
The detection threshold of a pancreatic endocrine tumor by EUS is approximately 2 mm. EUS is capable of locating almost 80% of pancreatic endocrine tumors in patients with multiple endocrine neoplasia type I. An endocrine tumor is typically round or oval with a distinct boundary, hypoechoic, very homogeneous, surrounded by a very thin hypoechoic ring (Fig. 149). It yields peripheral signal enhancement, indicating hypervascularization. In Doppler energy imaging, it is laced with small vessels that penetrate it (Figs 150, 151); it is a very pretty tumor. It is sometimes isoechoic (Fig. 152) with the parenchyma, and difficult to locate. Its echostructure is more homogeneous than the adjacent parenchyma and it can then be located by peripheral signal enhancement (Fig. 153) or by peripheral vascularization (Figs 154, 155). It is sometimes heterogeneous, with partial attenuation of the ultrasound beam indicating areas of fibrosis. There are sometimes small calcifications. Sometimes it is cystic. If it is large, multiple rather central small cystic areas are fairly common. If it is small and cystic, the antral cystic area accounts for the majority of the tumor volume, the tumor being confined to the wall of the cyst which is fleshy, homogeneous (Figs 157, 158), and covered with small vessels on Doppler energy imaging.
EUS FNA is very effective, with a sensitivity close to 100% using immunohistochemistry. It is the standard examination for confirming a diagnosis of non-functional endocrine tumor when it has been discovered by chance and in the absence of somatostatin receptor scintigraphy. The histoprognosis based on EUS-FNA correlates well with that obtained by resection. The opportunity for immunohistochemical quantification of the proliferation marker Ki67 and the mitotic index is very helpful when decision-making is difficult. The role of EUS and EUS FNA in the management of pancreatic endocrine tumors is summarized in Figures 159–161.
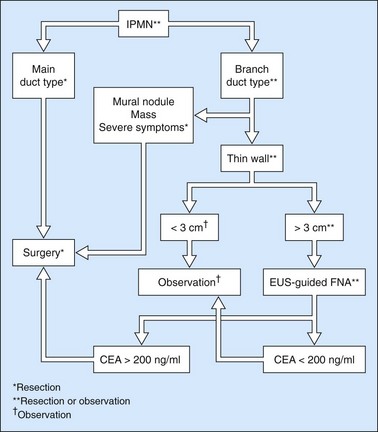
11.4 Cystic pancreatic tumors
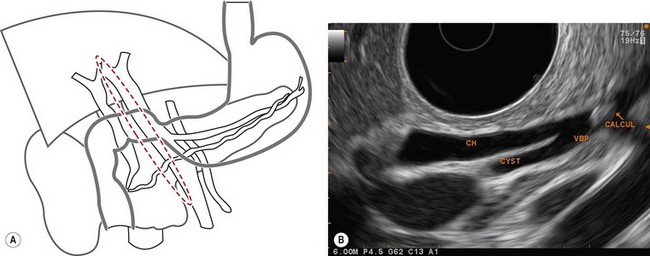
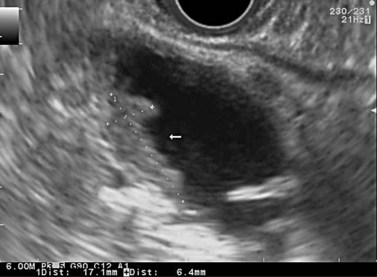
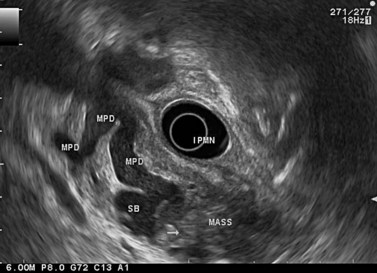
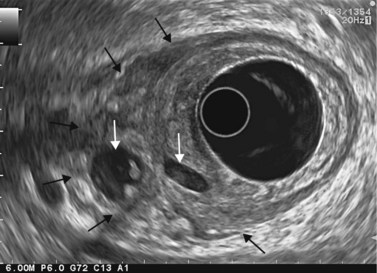
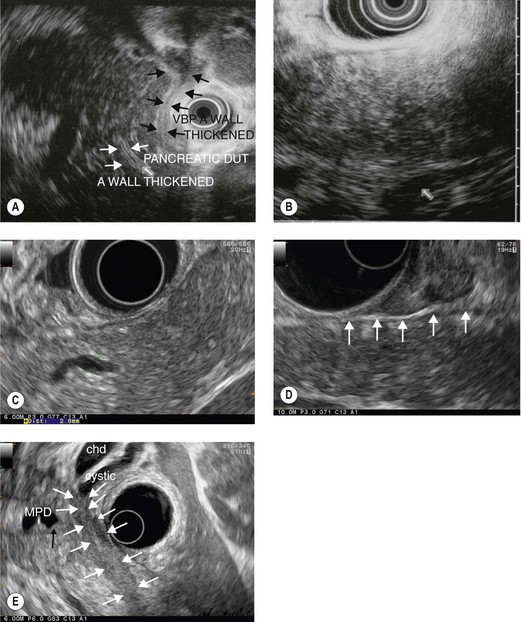
EUS is very useful for examining cystic lesions of the pancreas when their nature has not been clarified by a combination of percutaneous ultrasound and spiral CT or MRI with MRCP. It facilitates the diagnosis of serous cystadenomas (Fig. 162) if it reveals microcysts in an apparently solid tumor (Fig. 163) or in a predominantly macrocystic tumor (these are macrocystic serous cystadenomas (Fig. 164), the frequency of which is probably greatly underestimated). EUS facilitates the diagnosis of mucinous cystadenoma if it detects parietal thickening and thick septa (Fig. 165), or eggshell calcifications (Figs 166, 167A), the presence of a solid component or a mural nodule (Fig. 167B,C) developed from the wall or septal thickening, or if the cyst contents are thick (Fig. 168) or have a fluid-fluid level (Figs 166, 167). It confirms the diagnosis of cystadenocarcinoma if it detects invasion of the adjacent parenchyma from a tumoral solid component or a tumoral thickening of the cyst wall (Fig. 169). It is very effective in the diagnosis of intraductal papillary-mucinous neoplasia of the pancreas, whether it is the form located in the main duct where diagnosis is fairly easy (Figs 170–173) or the form located in the secondary ducts when it shows several fluid images (Fig. 174A–D), distributed through all or part of the pancreatic gland, adjacent to the pancreatic duct, duct-shaped (much longer than it is wide), with or without clearly visible communication with the pancreatic duct with or without dependent droplets of mucus (Fig. 174E). The diagnosis is confirmed when mucus is identified emerging from the major or accessory papilla (Figs 175, 176).
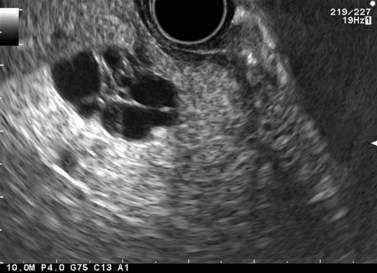
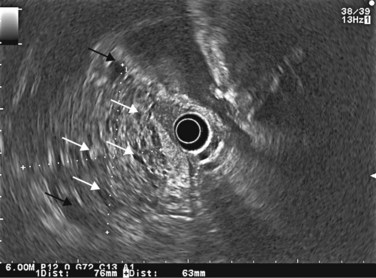
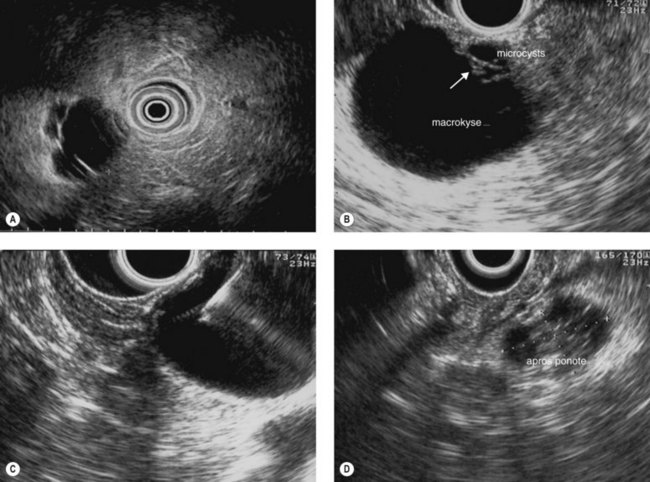
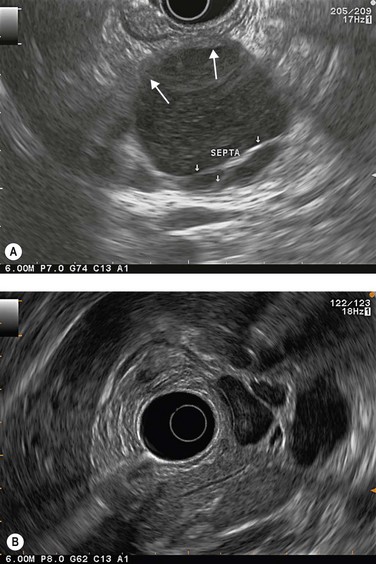
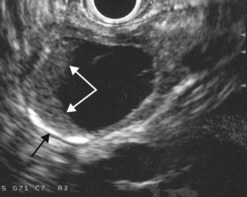
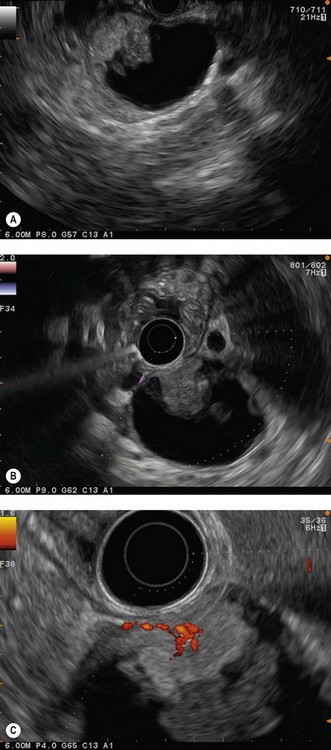
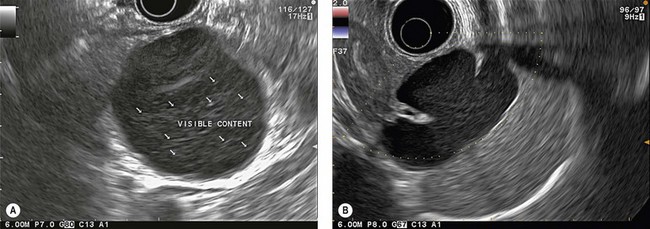
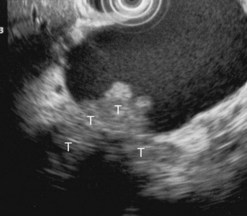
Figure 169 Mucinous cystadenoma with solid component with invasion of the adjacent pancreatic parenchyma (T).
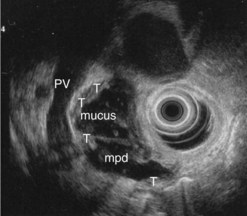
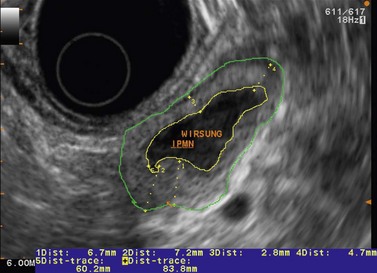
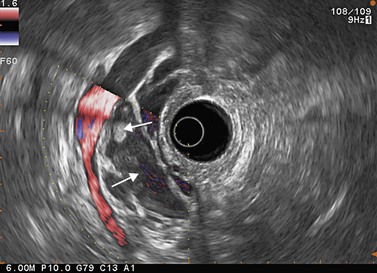
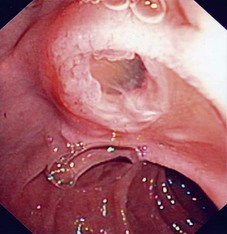
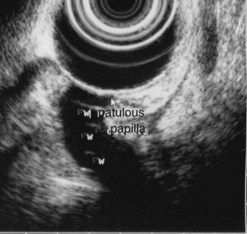
Figure 176 Same patient: EUS image of the patulous papilla and the dilated main pancreatic duct (w).
When diagnostic uncertainty persists as regards the mucinous or non-mucinous nature of a cystic tumor, or when diagnostic doubt persists between a mucinous cystadenoma and a pseudocyst, it is then useful to carry out FNA of the cystic fluid, with a very low risk of spread along the path, to allow a biochemical analysis (Table 3) (amylase and lipase) and a study of tumor markers (CEA is the most discriminating, while CA 19–9 and CA 72–4 are less effective).
Table 3 Reassessment of the value of biochemical and tumor markers in cyst fluid in the diagnosis of 130 cystic lesions of the pancreas
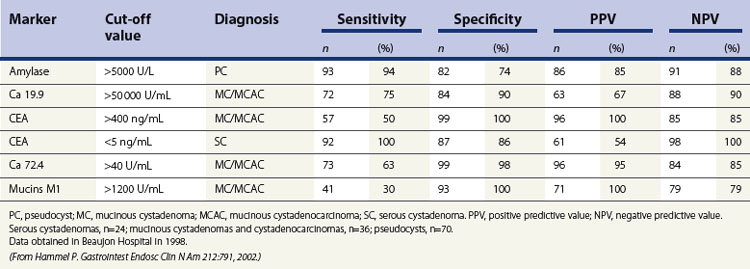
Cytology is helpful in 40–50% of cases, and more effective if liquid phase cytology is used, particularly if there is a nodule to biopsy (sensitivity >80%). The combination of the EUS appearance and the information yielded by biochemical study, cytology and tumor markers can predict the nature of the cystic lesion in 90% of cases. In the specific case of intraductal papillary-mucinous neoplasia of the pancreas, besides its diagnostic contribution which is now rivalled very effectively by MRI with MRCP, EUS is essential for the management of these patients since it has been demonstrated that it is by combining all these imaging techniques that a real picture can be obtained of the longitudinal spread of the disease to guide resection, and of the degree of malignancy. The degree of malignancy is correlated with the extent of parietal thickening in the main duct (Figs 170, 172) or in the secondary ducts and with the presence of a mural nodule (Figs 171, 173, 177), two components that are detected better by EUS than by MDCT and MRI. An MPD diameter >10 mm, parietal thickening >3 mm and a mural nodule height >5 mm are highly predictive of severe dysplasia (Figs 172, 173, 177). In the branch duct type, a diameter <3 cm and the absence of parietal thickening and a mural nodule are highly predictive of low-grade dysplasia. Obviously, the presence of a mass is highly suggestive of invasive carcinoma (Fig. 178).
11.5 Chronic pancreatitis (alcoholic or hereditary)
Although ultrasound and CT scanning has long been used routinely to diagnose chronic calcifying pancreatitis, ERCP remained until recently the gold standard for the diagnosis of early chronic pancreatitis (non-calcifying), using a classification of main duct and secondary duct anomalies (Cambridge classification). Several studies in the 1990s showed that EUS, by virtue of its resolving power on pancreatic parenchyma and the pancreatic ducts, correlated well with pancreatographic anomalies to diagnose the absence of chronic pancreatitis and to diagnose moderate to severe chronic pancreatitis (Fig. 179). On the other hand, correlation was poor for the diagnosis of minor chronic pancreatitis and uncertainty concerning the specificity of minor EUS anomalies (fewer than five criteria) was normal for almost 10 years.
EUS (Box 15) is, in fact, more sensitive than ERCP since almost 70% of chronic alcoholic patients with symptoms of pancreatic disease and who had minor EUS anomalies and normal retrograde pancreatography, eventually had a definite pancreatographic diagnosis of chronic pancreatitis (after 3–5 years). The EUS criteria for a diagnosis of chronic pancreatitis are summarized in Box 15. An alternative method of defining chronic pancreatitis is to use the Rosemont criteria. These criteria were developed by an international consensus panel which was convened in Rosemont, Illinois (Box 16).
Box 15 EUS criteria for the diagnosis of chronic pancreatitis
Box 16
Rosemont classification for chronic pancreatitis
Diagnosis of chronic pancreatitis using Rosemont criteria
Normal
| Terminology | Definition |
|---|---|
| Hyperechoic foci with shadowing | Echogenic structures ≥2 mm in length and width that shadow. |
| Lobularity | Well circumscribed, ≥5 mm structures with enhancing rim and relatively echo-poor center. |
| With honeycombing | Contiguous ≥3 lobules. |
| Without honeycombing | Non-contiguous lobules. |
| Hyperechoic foci without shadowing | Echogenic structures foci ≥2 mm in both length and width with no shadowing. |
| Cysts | Anechoic, rounded/elliptical structures with or without septations. |
| Stranding | Hyperechoic lines of ≥3 mm in at least two different directions with respect to the imaged plane. |
| MPD calculi | Echogenic structure(s) within MPD with acoustic shadowing. |
| Irregular MPD contour | Uneven or irregular outline and ecstatic course. |
| Dilated side branches | Three or more tubular anechoic structures each measuring ≥1 mm in width, budding from the MPD. |
| MPD dilation | ≥3.5 mm body or ≥1.5 mm tail. |
| Hyperechoic MPD margin | Echogenic, distinct structure greater than 50% of entire MPD in the body and tail. |
From: Catalano MF, Sahai A, Levy M, et al EUS-based criteria for the diagnosis of chronic pancreatitis: the Rosemont classification. Gastrointest Endosc 69(7):1251–1261, 2009.
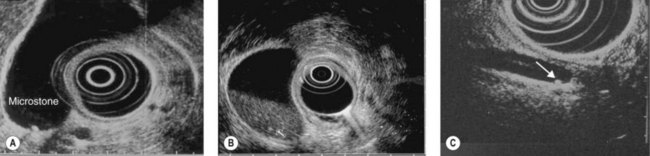
In patients with duodenal stenosis, EUS is the standard examination for diagnosing cystic dystrophy of the duodenal wall developed on aberrant pancreas (Fig. 180), which is the leading cause of symptomatic duodenal stenosis in alcoholic chronic pancreatitis. This complication, which often goes unrecognized because it is incorrectly interpreted in cross sectional imaging, is observed in 5–10% of cases of alcoholic chronic pancreatitis and is more frequent with a clinical picture of severe pancreatitis in terms of pain, weight loss and vomiting. EUS is also useful if retrograde pancreatography shows a filling limit in a duct downstream of an area of segmental acute pancreatitis, when it can detect a stone that is not yet calcified, invisible to MDCT, at the junction between the normal pancreatic duct and the diseased area (Fig. 181).
11.6 Acute pancreatitis
11.6.1 Acute biliary pancreatitis
EUS has clearly been established as the most accurate technique for identifying an unrecognized biliary cause, which accounts for almost half of all acute cases of pancreatitis of indeterminate origin at the initial assessment. Its sensitivity for the diagnosis of gallbladder microlithiasis in the absence of stones detectable on ultrasound exceeds 90% (Fig. 182) and it is significantly superior to the microscopic study of bile collected by duodenal intubation after cholecystokinin stimulation. EUS is also, as we shall see in the chapter on biliary disease, the standard method for the diagnosis of stones in the common bile duct which are known to be present in one-quarter of all cases after acute biliary pancreatitis (Fig. 182C). EUS is therefore particularly useful before laparoscopic cholecystectomy after mild or moderate acute biliary pancreatitis to ensure the common bile duct is unobstructed. To detect gallbladder microlithiasis, EUS should be performed if possible within 48 h of acute pancreatitis so that fasting will not distort the interpretation of any sludge visualized in the gallbadder. If the examination is performed some time after the episode of acute pancreatitis, it is better to wait for about 2 weeks after resuming eating so that interpretation of the images of the gallbladder are really informative.
11.6.2 Chronic pancreatitis
EUS is, as we have seen, extremely sensitive for the diagnosis of early non-calcifying chronic pancreatitis which is the second highest cause of acute pancreatitis of indeterminate origin (Fig. 179). Since the consequences of edematous acute pancreatitis for the parenchyma are different from the aspect of chronic pancreatitis, there is no reason to delay EUS in a patient with unexplained acute pancreatitis. In severe acute pancreatitis with parenchymatous necrosis, the lesions may persist for several months or even years, and it is usually impossible to make a diagnosis of the etiology of pancreatitis.
11.6.3 Acute pancreatitis of tumoral origin
EUS is the most sensitive technique for diagnosing a small tumor causing an episode of obstructive acute pancreatitis (Fig. 121), and it is also the standard examination for the diagnosis of IPMN, now a very classic etiology which should be investigated routinely in patients with unexplained acute pancreatitis, particularly if there has been recurrent acute pancreatitis.
11.7 Autoimmune pancreatitis
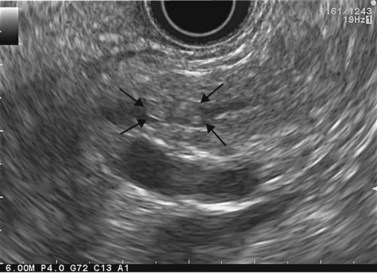
Finally, EUS strongly suggests a diagnosis of autoimmune pancreatitis when it shows a diffuse, very great increase in the volume (’sausage shaped’)of the pancreatic gland, which usually has a hypoechoic (Fig. 183A) or heterogeneous hypoechoic ‘salt and pepper’ (Fig. 183B) echostructure, along with a pancreatic duct that is invisible or visible only in places; this aspect is known as ductitis, with hypoechoic (Fig. 183C) or hyperechoic (Fig. 183A) thickening of the wall in the areas where it is invisible or at the junction between an area where it is visible and one where it is invisible, and this is probably specific to this disease. Hypoechoic peripheral rim (Fig. 183D) when observed is also specific. Significant hypoechoic thickening of the bile duct wall (Fig. 183A), particularly in its distal section, is further evidence of an autoimmune origin, given the frequency of an association between autoimmune pancreatitis and autoimmune cholangitis in Mayo Clinic type I AIP. EUS FNA can yield additional support for the autoimmune nature of the disease. EUS FNA is essential if the autoimmune pancreatitis is localized to the pancreatic head, causing a picture of pseudotumoral pancreatitis with obstructive jaundice and a large cephalic mass (Fig. 137). Generally speaking, Mayo Clinic type II AIP is not well classified using HISORt classification, because of the lack of increased level of IgG 4 in the serum, absence of IgG4 plasmocytes in the biopsy specimen of the pancreas and of the papilla and difficulty to obtain typical histology of AIP using 19 G Tru-Cut EUS-guided biopsy. Typical EUS features of AIP including ductitis could be an additional criterion helpful for the diagnosis of Mayo Clinic type II AIP.
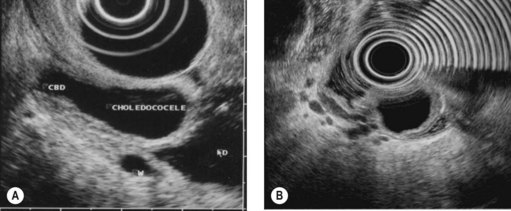
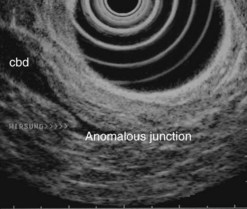
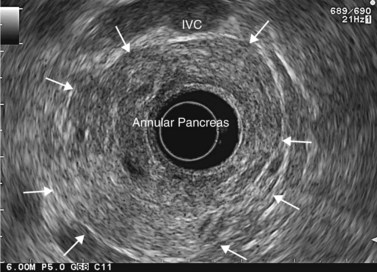
11.8 Embryological anomalies
Finally, EUS is very effective for the diagnosis of congenital pancreaticobiliary anomalies, whether for choledochocele (Fig. 184), pancreas divisum (Fig. 185), as EUS is equivalent to MRI with MRCP, or rarer anomalies such as an anomalous junction of the pancreatobiliary duct (Fig. 186) or an annular pancreas (Fig. 187).