The American Diabetes Association (ADA) defines DM as follows:
 Prediabetes: glucose levels > nl but not high enough to meet the criteria for dx DM
PE
Diabetic Retinopathy
Diabetic Neuropathy
Diabetic Nephropathy
Foot Ulcers
Neuropathic Arthropathy (Charcot’s Joints)
Necrobiosis Lipoidica Diabeticorum
TABLE 5-1
General Comparison of the Two Types of Diabetes Mellitus
| Type 1 | Type 2 | |
| Previous terminology | Insulin-dependent diabetes mellitus (IDDM), type I, juvenile-onset diabetes | Non–insulin-dependent diabetes mellitus, type II, adult-onset diabetes |
| Age at onset | Usually <30 yr, particularly childhood and adolescence, but any age | Usually >40 yr, but any age |
| Genetic predisposition | Moderate; environmental factors required for expression; 35%-50% concordance in monozygotic twins; several candidate genes proposed | Strong; 6%-90% concordance in monozygotic twins; many candidate genes proposed; some genes identified in maturity-onset diabetes of the young |
| Human leukocyte antigen associations | Linkage to DQA and DQB, influenced by DRB (3 and 4) (DR2 protective) | None known |
| Other associations | Autoimmune; Graves’ disease, Hashimoto’s thyroiditis, vitiligo, Addison’s disease, pernicious anemia | Heterogeneous group, ongoing subclassification based on identification of specific pathogenic processes and genetic defects |
| Precipitating and risk factors | Largely unknown; microbial, chemical, dietary, other | Age, obesity (central), sedentary lifestyle, previous gestational diabetes |
| Findings at diagnosis | 85%-90% of patients have one and usually more autoantibodies to ICA512/Ia-2/IA-2β, GAD65, insulin (IAA) | Possibly complications (microvascular or macrovascular) caused by significant preceding asymptomatic period |
| Endogenous insulin levels | Low or absent | Usually present (relative deficiency), early hyperinsulinemia |
| Insulin resistance | Only with hyperglycemia | Mostly present |
| Prolonged fast | Hyperglycemia, ketoacidosis | Euglycemia |
| Stress, withdrawal of insulin | Ketoacidosis | Nonketotic hyperglycemia, occasionally ketoacidosis |
GAD, glutamic acid decarboxylase; IA-2/IA-2β, tyrosine phosphatases; IAA, insulin autoantibodies, ICA, islet cell antibody; ICA512, islet cell autoantigen 512 (fragment of IA-2).
From Andreoli TE (ed): Cecil Essentials of Medicine, 6th ed. Philadelphia, Saunders, 2005.
Detection and DX of Gestational DM (GDM)
 OGTT
OGTT Women with GDM should be screened for diabetes 6 to 12 wk post partum.
Lab Screening in Diabetics
 Screening for diabetic retinopathy: Alb/Cr ratio (microalb) in a random spot urine collection or by 24-hr urine collection for alb, CrCl
 Dx of microalbuminuria (30-299 mg/24 hr) should be based on 2 to 3 ↑ levels within a 3- to 6-mo period because of marked variability in day-to-day alb excretion
 Labs in DM: HBA1c, urine microalbumin, fasting lipid panel, serum Cr, and electrolytes; TSH, vitamin B12 level, IgA TTG Ab (for celiac disease screen) in type 1 DM
 Daily monitoring with glucose test strips: type 1 DM and pregnant women on insulin ≥3 ×/day. T2 DM not on insulin, 1-2×/day
Treatment
1. Diabetic Ketoacidosis
Diagnosis
PE
 Evidence of dehydration (tachycardia, hypotension, dry mucous membranes, sunken eyeballs, poor skin turgor)
 Clouding of mental status
 Tachypnea w/air hunger (Kussmaul’s respiration)
 Fruity breath odor (caused by acetone)
TABLE 5-2
Oral Antidiabetic Agents and Monotherapy
| Sulfonylureas | Biguanides | α-Glucosidase Inhibitors | Incretin Mimetics | Meglitinides | Dipeptidyl Peptidase-4 Inhibitor | |
| Generic name | Glimepiride, glyburide, glipizide, chlorpropamide, tolbutamide | Metformin | Acarbose, miglitol | Exanatide, liraglutide | Repaglinide, nateglinide | Sitagliptin, linagliptin, saxagliptin |
| Mode of action | ↑↑ Pancreatic insulin secretion chronically | ↓↓HGP; ↓ peripheral IR; ↓ intestinal glucose absorption | Delays PP digestion of carbohydrates and absorption of glucose | ↑ Insulin secretion | ↑↑ Pancreatic insulin secretion acutely | Potentiates insulin synthesis and release |
| Preferred patient type | Diagnosis age >30 yr, lean, diabetes <5 yr, insulinopenic | Overweight, IR, fasting hyperglycemia, dyslipidemia | PP hyperglycemia | Type 2 DM | PP hyperglycemia, insulinopenic | |
| Therapeutic effects | ||||||
| ↓ HBA1c∗ (%) | 1-2 | 1-2 | 0.5-1 | ↓ HBA1c by 0.7 -0.9 | 1-2 | ↓ HBA1c by 0.5% |
| ↓ FPG∗ (mg/dL) | 50-70 | 50-80 | 15-30 | 40-80 | ||
| ↓ PPG∗ (mg/dL) | ≈90 | 80 | 40-50 | 30 | ||
| Insulin levels | ↑ | — | — | ↑ | ||
| Weight | ↑ | —/↓ | — | ↑ | ||
| Lipids | — | ↓ LDL ↓↓TG |
— | |||
| Side effects | Hypoglycemia | Diarrhea, lactic acidosis | Abdominal pain, flatulence, diarrhea | Nausea, headache, diarrhea | Hypoglycemia (low risk) | |
| Dose(s)/day | 1-3 | 2-3 | 1-3 | Variable from daily to weekly | 1-4+ | 1 |
| Maximum daily dose (mg) | Depends on agent | 2550 | 150 (<60-kg BW) 300 (>60-kg BW) |
16 (repaglinide) 360 (nateglinide) |
100 | |
| Range/dose (mg) | Depends on agent | 500-1000 | 25-50 (<60-kg BW) 25-100 (>60-kg BW) |
0.5-4 (repaglinide) 60, 120 (nateglinide) |
50-100 | |
| Optimal administration time | ≈30 min premeal (some with food, others on empty stomach) | With meal | With first bite of meal | Preferably <15 (0-30 min) before meals (omit if no meal) | ||
| Main site of metabolism/excretion | Hepatic/renal, fecal | Not metabolized/renal | Only 2% absorbed/fecal | Renal | Hepatic/fecal |

HGP, Hepatic glucose production; IR, insulin resistance; PP, postprandial; PPG, postprandial plasma glucose.
∗ Values combined from numerous studies; values are also dose dependent.
From Andreoli TE (ed): Cecil Essentials of Medicine, 6th ed. Philadelphia, Saunders, 2005.
TABLE 5-3
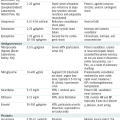
Types of Insulin
| Preparation | Brand | Onset (hr) | Peak (hr) | Duration (hr) | Route |
| Insulin aspart | NovoLog† | <0.25 | 1-3 | 3-5 | SC |
| Insulin aspart protamine/insulin aspart | NovoLog Mix 70/30† | <0.25 | 1-4 | 24 | SC |
| Insulin detemir | Levemir‡ | 1 | None | 24 | SC |
| Insulin glargine | Lantus† | 1.1 | None | ≥24 | SC |
| Insulin glulisine | Apidra† | ≤0.25 | 1 | 2-4 | SC, IV§ |
| Insulin lispro | Humalog† | <0.25 | 1 | 3.5-4.5 | SC |
| Insulin lispro protamine/insulin lispro | Humalog Mix 75/25† | ≤0.25 | 0.5-1.5 | 24 | SC |
| Humalog Mix 50/50† | ≤0.25 | 1 | 16 | SC | |
| Insulin injection regular (R) | Humulin R∗ | 0.5 | 2-4 | 6-8 | SC, IM, IV |
| Novolin R‡ | 0.5 | 2.5-5 | 8 | SC, IM, IV | |
| Insulin isophane suspension (NPH)/regular insulin (R) | Humulin 70/30∗ | 0.5 | 2-12 | 24 | SC |
| Humulin 50/50∗ | 0.5 | 3-5 | 24 | SC | |
| Novolin 70/30‡ | 0.5 | 2-12 | 24 | SC | |
| Insulin isophane suspension (NPH) | Humulin N∗ | 1-2 | 6-12 | 18-24 | SC |
| Novolin N‡ | 1.5 | 4-12 | 24 | SC |
Injectable insulins listed are available in a concentration of 100 units/mL; Humulin R, in a concentration of 500 unit/mL for SC injection only, is available by prescription from Lilly for insulin-resistant patients who are hospitalized or under close medical supervision.
∗ Recombinant (using E. coli).
† Recombinant human insulin analogue (using E. coli).
‡ Recombinant (using S. cerevisiae).
§ IV to be used in a clinical setting under proper medical supervision.
From Ferri FF: Ferri’s Clinical Advisor 2010. Philadelphia, Mosby, 2010.
TABLE 5-4
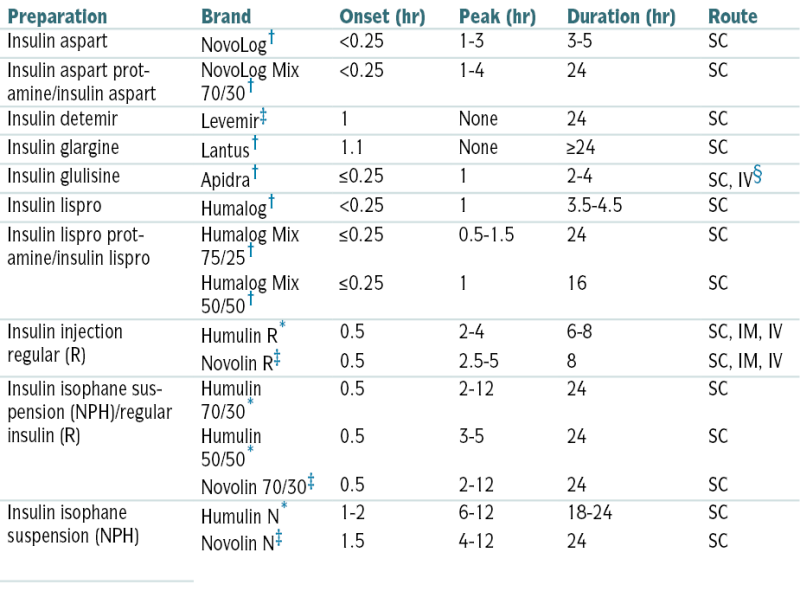
Regular Insulin (SC) Sliding Scale
| Finger Stick Blood Glucose | Mild Scale | Moderate Scale | Aggressive Scale |
| <60 | 1 amp (25 g) D50 or orange juice, call MD | 1 amp D50 or orange juice, call MD | 1 amp D50 or orange juice, call MD |
| 60-150 | No insulin | No insulin | No insulin |
| 151-200 | No insulin | 3 units | 4 units |
| 201-250 | 2 units | 5 units | 6 units |
| 251-300 | 4 units | 7 units | 10 units |
| 301-350 | 6 units | 9 units | 12 units |
| 351-400 | 8 units | 11 units | 15 units |
| >400 | 10 units, call physician | 13 units, call physician | 18 units, call physician |
From Nguyen TC, Abilez OJ (eds): Practical Guide to the Care of the Surgical Patient: The Pocket Scalpel. Philadelphia, Mosby, 2009.
 Lipemia retinalis in some pts
 Possible evidence of precipitating factors (infected wound, pneumonia)
 Abd tenderness in some pts
Labs
 Glucose level is generally >250 mg/dL; urine and serum ketones (+) (usually 7-10 mmol/L).
 ABGs reveal acidosis: arterial pH usually <7.30 w/Pco2 >40 mm Hg.
 Serum electrolytes:
 CBC w/diff, U/A, urine and blood cultures to r/o infectious precipitating factor
 Serum Ca2+, Mg2+, and PO4-3; plasma PO4-3and Mg2+ levels may be significantly depressed and should be rechecked within 24 hr because they may ↓ further w/correction of DKA.
 ↑ BUN and Cr secondary to significant dehydration
 Amylase, LFTs should be checked in pts w/abd pain.
Imaging
Treatment
 Fluid replacement (the usual deficit is 6-8 L), insulin Rx, electrolyte replacement
2. Hyperosmolar Non-Ketotic Coma, Honk
Definition
Etiology
 Infections, 20% to 25% (e.g., pneumonia, UTI, sepsis)
 New or previously unrecognized diabetes (30%-50%)
 Reduction or omission of diabetic medication
 Stress (MI, CVA)
 Drugs: diuretics (dehydration), phenytoin, diazoxide (impaired insulin secretion)
Diagnosis
H&P
 Evidence of extreme dehydration (poor skin turgor, sunken eyeballs, dry mucous membranes)
 Neurologic defects (reversible hemiplegia, focal seizures)
 Orthostatic hypotension, tachycardia
 Evidence of precipitating factors (pneumonia, infected skin ulcer)
 Coma (25% of pts), delirium
Labs
 Hyperglycemia: serum glucose usually >600 mg/dL
 Hyperosmolarity: serum osmolarity usually >340 mOsm/L
 Serum Na+: may be ↓, nl, or ↑; if nl or ↑, the pt is severely dehydrated because glucose draws fluid from intracellular space = ↓ serum Na+; the corrected Na+ can be obtained by the serum Na+ concentration by ↑ 1.6 mEq/dL for every 100 mg/dL ↓ in the serum glucose level above nl.
 Serum K+: may be ↓, nl, or ↑; regardless of the initial serum level, the total body deficit is approximately 5 to 15 mEq/kg.
 Serum bicarbonate: usually >12 mEq/L (average is 17 mEq/L)
 Arterial pH: usually >7.2 (average is 7.26). Both serum bicarbonate and arterial pH may be lower if lactic acidosis is present.
 ↑ BUN: Azotemia (prerenal) is usually present (BUN generally ranges from 60-90 mg/dL).
 ↓ PO4-3: hypophosphatemia (average deficit is 70-140 mM)
 ↓ Ca2+: hypocalcemia (average deficit is 50-100 mEq)
 ↓ Mg2+: hypomagnesemia (average deficit is 50-100 mEq)
 CBC w/diff, U/A, blood and urine cultures should be performed to r/o infectious etiology.
Treatment
 Vigorous IV fluid replacement, electrolyte replacement, insulin Rx (see Fig. 5-1)
B. Hypoglycemia
Definition
 Presence of sx
 ↓ Plasma glucose level in symptomatic pt
Etiology
 Reactive hypoglycemia
 Fasting hypoglycemia
 Iatrogenic or drug-induced: hypoglycemic drugs, excessive insulin replacement, factitious, ethanol-induced hypoglycemia
Diagnosis
 When the plasma glucose level is ↓ (e.g., fasting state), the plasma insulin level should also be ↓. Any pt presenting w/fasting hypoglycemia of unexplained cause should have the following tests drawn during the hypoglycemic episode (Table 5-5):
 Factitious hypoglycemia should be considered, especially if the pt has ready access to insulin or oral hypoglycemic agents (e.g., medical or paramedical personnel, family members who are diabetic or in the medical profession).
 Pancreatic islet cell neoplasms (insulinomas) are usually small (<3 cm), single, insulin-producing adenomas. Measurement of inappropriately serum insulin levels despite ↓ plasma glucose level after prolonged fasting (24-72 ↑ hr) is pathognomonic of these neoplasms.
TABLE 5-5
Hypoglycemia in Nondiabetic Pt. Laboratory Differentiation of Factitious Hypoglycemia and Insulinoma
| Lab | Insulinoma | Exogenous Insulin | Oral Hypoglycemic Agents (Sulfonylurea/Meglitinides) |
| Plasma glucose | ↓ | ↓ | ↓ |
| Serum insulin | ↑ | ↑↑ | ↑ |
| Plasma and urine sulfonylureas/meglitinides | Absent | Absent | Present |
| C-peptide | ↑ | N/↓ | ↑ |

Treatment
 Variable, depending on etiology of hypoglycemia
C. Anterior Pituitary Disorders
1. Hypopituitarism
Etiology
 Pituitary tumors
 Pituitary apoplexy caused by hemorrhage or infarction of the pituitary gland
 Pituitary radiation Rx
 Empty sella syndrome w/enlargement of the sella turcica and flattening of the pituitary gland (from extension of the subarachnoid space and filling of CSF into the sella turcica)
 Infiltrative disease including sarcoidosis, hemochromatosis, histiocytosis X, Wegener’s granulomatosis, and lymphocytic hypophysitis
 Infection (TB, mycosis, and syphilis)
 Head trauma
 Internal carotid artery aneurysm
Diagnosis
H&P
 Mass effect → headaches, visual field disturbances
 Corticotropin deficiency
 Thyrotropin deficiency
 Gonadotropin deficiency
 GH deficiency
 Hyperprolactinemia
 Vasopressin deficiency
Baseline Labs
 Corticotropin deficiency:
 Thyrotropin deficiency:
 Gonadotropin deficiency:
 GH deficiency:
Imaging
 MRI of pituitary
Treatment
 Hormone replacement Rx and surgery, irradiation, or medications in pts w/pituitary tumors
 Acute situations such as adrenal crisis and myxedema coma are discussed separately.
 Long-term Rx: lifelong and requires the following hormone replacement Rx:
TABLE 5-6
Tests of Pituitary Insufficiency
| Hormone | Test | Interpretation |
| Growth hormone (GH) | Insulin tolerance test: Regular insulin (0.05-0.15 U/kg) is given IV and blood is drawn at −30, 0, 30, 45, 60, and 90 min for measurement of glucose and GH. | If hypoglycemia occurs (glucose <40 mg/dL), GH should increase to >5 μg/L.∗ |
| Arginine-GHRH test: GHRH 1 μg/kg IV bolus followed by 30-min infusion of l-arginine (30 g) | Normal response is GH > 4.1 μg/L. | |
| Glucagon test: 1 mg IM with GH measurements at 0, 60, 90,120, 150 and 180 min | Normal response is GH >3 μg/L. | |
| Adrenocorticotropic hormone (ACTH) | Insulin tolerance test: Regular insulin (0.05-0.15 U/kg) is given IV and blood is drawn at −30, 0, 30, 45, 60, and 90 min for measurement of glucose and cortisol. | If hypoglycemia occurs (glucose <40 mg/dL), cortisol should increase by >7 μg/dL or to >20 μg/dL. |
| CRH test: 1 μg/kg ovine CRH IV at 8 am with blood samples drawn at 0, 15, 30, 60, 90, 120 min for measurement of ACTH and cortisol | In most normal individuals, the basal ACTH increases twofold to fourfold and reaches a peak (20-100 pg/mL). ACTH responses may be delayed in cases of hypothalamic dysfunction. Cortisol levels usually reach 20-25 μg/dL. | |
| Metyrapone test: Metyrapone (30 mg/kg to max 2 g) at midnight with measurements of plasma 11-deoxycortisol and cortisol at 8 am. ACTH can also be measured. A 3-day test is also available. Basal cortisol should be >5-6 μg/dL before test. | A normal response is 11-deoxycortisol >7.5 μg/dL or ACTH >75 pg/mL. Plasma cortisol should fall below 4 μg/dL to ensure an adequate response. | |
| ACTH stimulation test: ACTH 1-24 (cosyntropin), 0.25 mg IM or IV. Cortisol is measured at 0, 30, and 60 min. | A normal response is cortisol >18 μg/dL. In suspected hypothalamic-pituitary deficiency, a low-dose (1-μg) test may be more sensitive. | |
| Thyroid-stimulating hormone (TSH) | Basal thyroid function tests: free T4, free T3, TSH | Low free thyroid hormone levels in the setting of TSH levels that are not appropriately increased. |
| Luteinizing hormone (LH), follicle-stimulating hormone (FSH) | Basal levels of LH, FSH, testosterone, estrogen | Basal LH and FSH should be increased in postmenopausal women. Low testosterone levels in conjunction with low or low-normal LH and FSH are consistent with gonadotropin deficiency. |
| GnRH test: GnRH (100 μg) IV with measurements of serum LH and FSH at 0, 30, and 60 min | In most normal persons, LH should increase by 10 IU/L and FSH by 2 IU/L. Normal responses are variable, and repeated stimulation may be required. | |
| Clomiphene test: Clomiphene citrate (100 mg) is given orally for 5 days. Serum LH and FSH are measured on days 0, 5, 7, 10, and 13. | A 50% increase should occur in LH and FSH, usually by day 5. | |
| Multiple hormones | Combined anterior pituitary test: GHRH (1 μg/kg), CRH (1 μg/kg), GnRH (100 μg) are given sequentially IV. Blood samples are drawn at −30, 15, 30, 60, 90, and 120 min for measurements of GH, ACTH, LH, and FSH. | Combined or individual releasing hormone responses must be evaluated in the context of basal hormone values and may not be diagnostic (see text). |
∗ Values are with polyclonal assays.
From Goldman L, Schafer AI (eds): Goldman’s Cecil Medicine, 24th ed. Philadelphia, Saunders, 2012.
 TSH deficiency: levothyroxine 0.05 to 0.15 mg/day
 GH deficiency: GH is generally not used in adults; however, it can be given at 0.04 to 0.08 mg/kg/day SC in children.
2. Anterior Pituitary Hyperfunction Secondary to Pituitary Neoplasms
 Pituitary adenomas are classified by their size (macroadenomas ≥10 mm) and function
H&P
Prolactinomas
 Females: galactorrhea, amenorrhea, oligomenorrhea with anovulation, infertility
 Estrogen deficiency leading to hirsutism, ↓ vaginal lubrication, osteopenia
 Males: ↓ libido or hypogonadism
GH-Secreting Pituitary Adenoma: Acromegaly
 Coarse facial features, oily skin, prognathism, carpal tunnel syndrome
 Osteoarthritis, hx of ↑ hat, glove, or shoe size, visual field deficits
Corticotropin-Secreting Pituitary Adenoma: Cushing’s Disease
 Truncal obesity, round facies (moon face)
 Dorsocervical fat accumulation (buffalo hump), hirsutism, acne, menstrual disorders
 HTN, striae, bruising, thin skin, hyperglycemia
Thyrotropin-Secreting Pituitary Adenoma
 Sx: thyrotoxicosis, goiter, visual impairment
Diagnosis
Prolactinoma
 ↑ PRL levels are correlated with tumor size.
 Level >200 ng/mL is diagnostic, with levels of 100 to 200 ng/mL being equivocal.
Acromegaly
 First screening tests are the measurement of serum IGF-1 ↑, postprandial serum GH, and TRH stimulation test.
 Follow with an OGTT.
 Failure to suppress serum GH to <2 ng/mL with an oral load of 100 g glucose is considered conclusive.
 A GH-releasing hormone level >300 ng/mL is indicative of an ectopic source of GH.
Cushing’s Disease
 Nl or slightly ↑ corticotropin levels ranging from 20 to 200 pg/mL
 Level <10 pg/mL usually indicates an autonomously secreting adrenal tumor.
 Level >200 pg/mL suggests an ectopic corticotropin-secreting neoplasm.
 Cushing’s disease can be assessed by absence of cortisol suppression with the low-dose dexamethasone test but with the presence of cortisol suppression after the high-dose test.
 24-hr urine collection should demonstrate an ↑ level of cortisol excretion.
Thyrotropin-Secreting Pituitary Adenoma
 Highly sensitive thyrotropin assays, which evaluate the presence of thyrotoxicosis, are among the ways to detect a thyrotropin-secreting tumor.
 Free α subunit is secreted by >80% of tumors, with the ratio of the α subunit to thyrotropin <1.
 With central resistance to thyroid hormone, the ratio is <1.
 ↑ serum levels of both T3 and T4
Imaging
 MRI of the pituitary and hypothalamus
 CT scan only when MRI is unavailable or is otherwise contraindicated
Treatment
Surgery
 Selective transsphenoidal resection of the adenoma is used for acromegaly, Cushing’s disease, and thyrotropin-secreting pituitary adenomas.
 RadioRx is reserved for pts who have not responded to surgical Rx and who still have sx of the adenoma.
 Bilateral adrenalectomy is performed in pts with Cushing’s disease after failure of other therapies; complications requiring lifelong hormone replacement or Nelson’s syndrome may occur.
RadioRx
 Generally reserved for pts who have not responded to surgical Rx
 Used with varying degrees of success in all the different pituitary adenomas
Medical
Prolactinoma

Acromegaly
 Octreotide
Cushing’s Disease
 Ketoconazole, which inhibits the cytochrome P-450 enzymes involved in steroid biosynthesis, is effective in managing mild to moderate disease in daily oral doses of 600 to 1200 mg.
 Metyrapone and aminoglutethimide can be used to control hypersecretion of cortisol but are generally used when preparing a pt for surgery or while waiting for a response to radioRx.
Thyrotropin-Secreting Pituitary Adenoma
 Ablative Rx with either radioactive iodide or surgery
 Octreotide
D. Fluid Hemostasis Disorders
1. Diabetes Insipidus (DI)
Definition
Etiology
Central (Neurogenic) DI
 Idiopathic
 Neoplasms of brain or pituitary fossa (craniopharyngiomas, metastatic neoplasms from breast or lung)
 Post-therapeutic neurosurgical procedures (e.g., hypophysectomy)
 Head trauma (e.g., basal skull fx)
 Granulomatous disorders (sarcoidosis or TB)
 Histiocytosis (Hand-Schüller-Christian disease, eosinophilic granuloma)
 Familial (autosomal dominant)
 Other: interventricular hemorrhage, aneurysms, meningitis, postencephalitis, MS
Nephrogenic DI
 Drugs: lithium, amphotericin B, demeclocycline, methoxyflurane anesthesia
 Familial: X-linked
 Metabolic: hypercalcemia or hypokalemia
 Other: sarcoidosis, amyloidosis, pyelonephritis, polycystic disease, sickle cell disease, postobstructive condition
Diagnosis
H&P
 Polyuria: urinary volumes ranging from 2.5 to 6 L/day
 Polydipsia (predilection for cold or iced drinks)
 Neurologic manifestations (seizures, headaches, visual field defects)
 Evidence of volume contractions
Labs
 ↓ Urine specific gravity (≤1.005)
 ↓ Urine osmolality (usually <200 mOsm/kg) even in the presence of high serum osmolality
 Hypernatremia, plasma osmolarity, hypercalcemia, hypokalemia
 Water deprivation test confirms dx.
Imaging
 MRI of the brain if neurogenic DI is confirmed
Treatment
 Central DI: desmopressin acetate (DDAVP)
 Nephrogenic DI: adequate hydration, low-Na+ diet and chlorothiazide to induce mild Na+ depletion, amiloride 5 mg PO bid initially
2. Syndrome of Inappropriate Antidiuretic Hormone (SIADH, SIAD) Secretion
Etiology
 Neoplasm: lung, oropharynx, stomach, duodenum, pancreas, brain, thymus, bladder, prostate, endometrium, mesothelioma, lymphoma, Ewing’s sarcoma
 Pulmonary disorders: pneumonia, aspergillosis, pulmonary abscess, TB, bronchiectasis, emphysema, CF, status asthmaticus, respiratory failure associated w/positive-pressure breathing
 Intracranial disease: trauma, neoplasms, infections (meningitis, encephalitis, brain abscess), hemorrhage, hydrocephalus, MS, GBS
 Postoperative period: surgical stress, ventilators w/positive pressure, anesthetic agents
 Drugs: nicotine, chlorpropamide, thiazide diuretics, vasopressin, desmopressin, oxytocin, chemotherapeutic agents (vincristine, vinblastine, cyclophosphamide), carbamazepine, phenothiazines, MAOIs, tricyclic antidepressants, narcotics, nicotine, clofibrate, haloperidol, SSRIs, NSAIDs
 Other: acute intermittent porphyria, myxedema, psychosis, delirium tremens, ACTH deficiency (hypopituitarism), general anesthesia, endurance exercise
Diagnosis
H&P
 Delirium, lethargy, and seizures may be present if the hyponatremia is severe or of rapid onset.
 Manifestations of the underlying disease may be evident (e.g., fever from an infectious process or headaches and visual field defects from an intracranial mass).
 ↓ DTR and extensor plantar responses may occur w/severe hyponatremia.
 The pt is generally normovolemic or slightly hypervolemic; edema is absent.
Labs
 Demonstration through laboratory evaluation of excessive secretion of ADH in absence of appropriate osmotic or physiologic stimuli. Labs reveal
 For diagnostic purposes, pt should have nl thyroid, adrenal, and cardiac function and no recent or concurrent use of diuretics.
Imaging
 CXR: r/o neoplasm, pneumonia
Treatment
 In emergency situations (seizures, coma), SIADH can be treated w/combination of
 The rapidity of correction varies according to the degree of hyponatremia and if the hyponatremia is acute or chronic; in general, the serum Na+ concentration should be corrected only halfway to nl in the initial 24 hr. A prudent approach is to ↑ serum Na+ concentration by <0.5 mEq/L/hr and to limit the total ↑ to 8 to 12 mmol/L during the first 24 hr.
 Close monitoring of the rate of correction (every 2-3 hr) is recommended to avoid overcorrection. In pts w/hyponatremia of chronic duration, correction of serum Na+ level by >12 mmol/L during a period of 24 hr = ↑ risk of osmotic demyelination.
 Conivaptan (20-40 mg/day IV) and tolvaptan (15 mg PO initially) are selective arginine vasopressin (AVP) antagonists useful in selected hospitalized pts w/moderate to severe hyponatremia. Potential problems associated w/their use are infusion site reactions (50% of pts) and risk of osmotic demyelination if serum Na+ levels are corrected too rapidly.
Long-term Rx
 Depending on the underlying cause, fluid restriction may be needed indefinitely. Monthly monitoring of electrolytes is recommended in pts w/chronic SIADH.
 Demeclocycline 300 to 600 mg PO bid: useful in pts w/chronic SIADH (e.g., secondary to neoplasm), but use w/caution in pts w/hepatic disease; side effects include nephrogenic DI and photosensitivity. This medication is also very expensive.
E. Thyroid Disorders
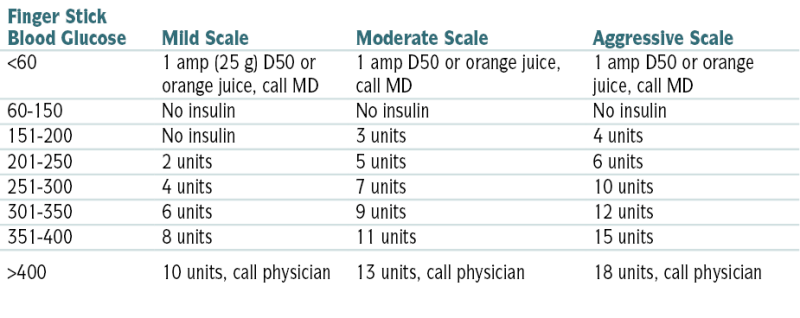
1. Interpretation of Thyroid Function Studies
FIGURE 5-2 Diagnostic approach to thyroid testing. N, normal.
TABLE 5-7
Findings in Thyroid Function Tests in Various Clinical Conditions
| Condition | T4 | FT4I | T3 | FT3I | TSH | TSI | TRH Stimulation |
| Hyperthyroidism | |||||||
| Graves’ disease | ↑ | ↑ | ↑ | ↑ | ↓ | + | ↓ |
| Toxic nodular goiter | ↑ | ↑ | ↑ | ↑ | ↓ | − | ↓ |
| Pituitary TSH-secreting tumors | ↑ | ↑ | ↑ | ↑ | ↑ | − | ↓ |
| T3 thyrotoxicosis | N | N | ↑ | ↑ | ↓ | +, − | ↓ |
| T4 thyrotoxicosis | ↑ | ↑ | N | N | ↓ | +, − | ↓ |
| Hypothyroidism | |||||||
| Primary | ↓ | ↓ | ↓ | ↓ | ↑ | +, − | ↑ |
| Secondary | ↓ | ↓ | ↓ | ↓ | ↓, N | − | ↓ |
| Tertiary | ↓ | ↓ | ↓ | ↓ | ↓, N | − | N |
| Peripheral unresponsiveness | ↑, N | ↑, N | ↑, N | ↑ | ↑, N | − | N, ↑ |
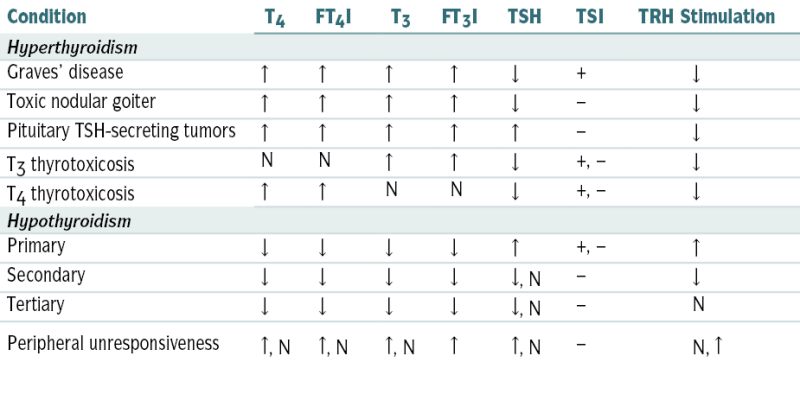
-, variable; FT3I, free T3 index; FT4I, free T4 index; TSI, thyroid-stimulating immunoglobulin.
From Tilton RC, Barrows A: In Hohnadel DC, Reiss R (eds): Clinical Laboratory Medicine. St. Louis, Mosby, 1992.
2. Hyperthyroidism
Etiology
 Graves’ disease (diffuse toxic goiter): 80% to 90% of all cases of hyperthyroidism
 Toxic multinodular goiter (Plummer’s disease)
 Toxic adenoma
 Iatrogenic and factitious
 Transient hyperthyroidism (subacute thyroiditis, Hashimoto’s thyroiditis)
 Rare causes: hypersecretion of TSH (e.g., pituitary neoplasms), struma ovarii, ingestion of large amount of iodine in a pt w/preexisting thyroid hyperplasia or adenoma (Jod-Basedow phenomenon), hydatidiform mole, carcinoma of thyroid, amiodarone Rx
Diagnosis
H&P
 Tachycardia, tremor, hyperreflexia, anxiety, irritability, emotional lability, panic attacks, heat intolerance, sweating, appetite, diarrhea, weight loss, menstrual dysfunction (oligomenorrhea, amenorrhea). The presentation may be different in elderly pts (see later).
 Pts w/Graves’ disease may present w/exophthalmos, lid retraction, lid lag (Graves’ ophthalmopathy). The following signs and sx of ophthalmopathy may be present: blurring of vision, photophobia, lacrimation, double vision, deep orbital pressure. Clubbing of fingers associated w/periosteal new bone formation in other skeletal areas (Graves’ acropachy) and pretibial myxedema may also be noted.
Labs (Fig. 5-3)
 ↑ Free T4
 ↑ Free T3: generally not necessary for dx
 ↓ TSH (unless hyperthyroidism is a result of the rare hypersecretion of TSH from a pituitary adenoma in which case ↑ TSH)
 Thyroid Abs useful in selected cases to differentiate Graves’ disease from toxic multinodular goiter (absent thyroid Abs)
Imaging
 24-hr RAIU is useful to distinguish hyperthyroidism from iatrogenic thyroid hormone synthesis (thyrotoxicosis factitia) and from thyroiditis.
 An overactive thyroid = ↑ uptake, whereas iatrogenic thyroid ingestion and painless or subacute thyroiditis = nl or ↓ uptake.
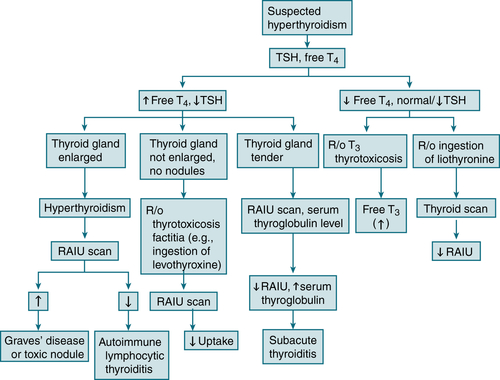
FIGURE 5-3 Diagnostic algorithm for hyperthyroidism.
 The RAIU results also vary w/the etiology of the hyperthyroidism:
Treatment
 Antithyroid drugs (thionamides): methimazole inhibits thyroid hormone synthesis by blocking production of thyroid peroxidase. Adjunctive Rx to alleviate α-adrenergic sx of hyperthyroidism involves propranolol 20 to 40 mg PO q6h; dosage is gradually ↑ until sx are controlled.
 RAI is the Rx of choice for pts >21 yr of age who have not achieved remission after 1 yr of antithyroid drug Rx.
 Subtotal thyroidectomy is indicated in obstructing goiters, in any pt who refuses RAI and cannot be adequately managed w/antithyroid medications (e.g., pts w/toxic adenoma or toxic multinodular goiter), and in pregnant pts who cannot be adequately managed w/antithyroid medication or develop side effects to them.
Clinical Pearl
 Elderly hyperthyroid pts may have only subtle signs (weight loss, tachycardia, fine skin, brittle nails). This form is known as apathetic hyperthyroidism and is manifested by lethargy rather than with hyperkinetic activity. An enlarged thyroid gland may be absent. Coexisting medical disorders (most commonly cardiac disease) may also mask the sx. These pts often have unexplained CHF or new-onset AF.
3. Thyroid Storm
Diagnosis
 Tremor, tachycardia/tachyarrhythmias, fever (as high as 105.8° F)
 Sweating, diarrhea, vasodilatation
 Lid lag, lid retraction, proptosis, goiter
 Change in mental status (psychosis, coma, seizures)
 Other: precipitating factors (infection, trauma), CHF, hepatosplenomegaly, jaundice
Labs
 ↑ Free T4, ↓ TSH
Treatment
 Replace fluid deficit aggressively (daily fluid requirement may reach 6 L); use solutions containing glucose and add multivitamins to the hydrating solution.
 Propylthiouracil (PTU) 800 mg initially (PO/NG tube)/PR, then 200 to 300 mg PO/PR q6h (allergy PTU, methimazole 80-100 mg PO/PR followed by 40 mg PO/PR q8h).
 Inhibition of stored thyroid hormone from the gland:
 Suppression of peripheral effects of thyroid hormone: β-adrenergic blockers: Administer propranolol 80 to 120 mg PO q4 to 6h. Propranolol may also be given IV 1 mg/min for 2 to 10 min under continuous ECG and blood pressure monitoring. β-Adrenergic blockers must be used with caution in pts with severe CHF or bronchospasm. Cardioselective β-blockers (e.g., esmolol or metoprolol) may be more appropriate for pts with bronchospasm, but these pts must be closely monitored for exacerbation of bronchospasm because these agents lose their cardioselectivity at ↑ doses.
 Control of fever with acetaminophen 325 to 650 mg q4h; avoid aspirin because it displaces thyroid hormone from its binding protein
 Rx of any precipitating factors (e.g., abx if infection is strongly suspected)
4. Hypothyroidism
Etiology
 Primary hypothyroidism >90% of the cases
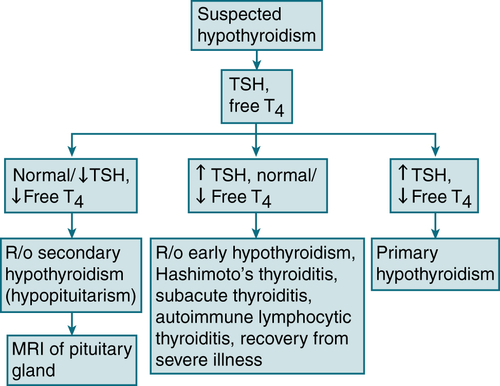
FIGURE 5-4 Diagnostic algorithm for hypothyroidism.
Diagnosis
H&P
 Skin: dry, coarse, thick, cool, sallow (yellow color caused by carotenemia); nonpitting edema in skin of eyelids and hands (myxedema) secondary to infiltration of SC tissues by a hydrophilic mucopolysaccharide substance
 Hair: brittle and coarse; loss of outer third of eyebrows
 Facies: dulled expression, thickened tongue, thick, slow-moving lips
 Thyroid gland: may or may not be palpable (depending on the cause of the hypothyroidism)
 Heart sounds: distant, possible pericardial effusion
 Pulse: bradycardia
 Neurologic: delayed relaxation phase of the DTRs, cerebellar ataxia, hearing impairment, poor memory, peripheral neuropathies w/paresthesia
 Musculoskeletal: carpal tunnel syndrome, muscle stiffness, weakness
Labs (see Table 5-7; Fig. 5-4)
 TSH: ↑ TSH may be nl if pt has secondary or tertiary hypothyroidism, pt is receiving dopamine or corticosteroids, or the level is obtained after severe illness.
 ↓ Free T4
 Other common laboratory abnlities: hyperlipidemia, hyponatremia, and anemia
 Antimicrosomal and antithyroglobulin Ab titers: useful only when autoimmune thyroiditis is suspected as the cause of the hypothyroidism
Treatment
 Levothyroxine 25 to 100 μg/day, depending on pt’s age and severity of the disease. The dose may be ↑ every 6 to 8 wk, depending on the clinical response and serum TSH level. Elderly pts and pts w/CAD should be started w/12.5 to 25 μg/day (higher doses may precipitate angina).
Clinical Pearls
 Periodic monitoring of TSH level is an essential part of Rx. Pts should be evaluated w/office visit and TSH levels every 6 to 8 wk until the pt is clinically euthyroid and the TSH level is normalized.
 For monitoring Rx in pts w/central hypothyroidism, measurement of serum free T4 level rather than TSH is appropriate; it should be maintained in the upper half of the nl range.
5. Subclinical Hypothyroidism
 Frequency: 10% to 15% of elderly
 Labs: ↑ serum TSH and a nl free T4 level
 Associated with an ↑ risk of CHD events (particularly in those with a TSH concentration of ≥10 mU/L)
 Rx: Levothyroxine if TSH ≥10 mU/L and with presence of goiter or thyroid autoantibodies
6. Myxedema Coma
 This is a life-threatening complication of hypothyroidism.
Etiology
 Decompensation of hypothyroidism secondary to
Diagnosis
H&P
 Profound lethargy or coma
 Hypothermia (rectal temperature <35° C [<95° F]); often missed by using ordinary thermometers graduated only to 34.5° C
 Bradycardia, hypotension (secondary to circulatory collapse)
 Delayed relaxation phase of DTR, areflexia
 Myxedema facies
 Alopecia, macroglossia, ptosis, periorbital edema, nonpitting edema, doughy skin
 Bladder dystonia and distention
Labs
 ↑↑ TSH (if primary hypothyroidism), ↓ free T4
Treatment
 Levothyroxine 5 to 8 μg/kg (300-500 μg) IV infused over 15 min, then 100 μg IV q24h.
 Glucocorticoids should also be administered until coexistent adrenal insufficiency can be r/o → hydrocortisone hemisuccinate 100 mg IV bolus, followed by 50 mg IV q12h or 25 mg IV q6h until initial plasma cortisol level is confirmed nl.
 IV hydration w/D5NS
7. Thyroiditis
Classification and Etiology
 Hashimoto’s thyroiditis (autoimmune)
 Painful subacute thyroiditis (follows URI): subacute thyroiditis, giant cell thyroiditis, de Quervain’s thyroiditis, subacute granulomatous thyroiditis, pseudogranulomatous thyroiditis
 Painless postpartum thyroiditis: subacute lymphocytic thyroiditis
 Suppurative thyroiditis (infectious etiology thus febrile with nuchal rigidity/erythema)
 Riedel’s thyroiditis (slowly enlarging hard mass): fibrous thyroiditis
Labs
 TSH, free T4: may be nl, ↓, ↑
 ↑ WBC with left shift occurs with subacute and suppurative thyroiditis.
 Antimicrosomal Abs (>90%), Hashimoto’s thyroiditis, (65%) silent thyroiditis
 Serum thyroglobulin levels ↑ subacute and silent thyroiditis, factitious hyperthyroidism (↓or absent serum thyroglobulin level)
Imaging
 24 hr RAIU: Graves’ disease (↑ RAIU), thyroiditis (nl or ↓ RAIU)
Treatment
 If hypothyroid: levothyroxine 25 to 50 μg/day initially and monitor TSH q 6 to 8wk
 Control sx of hyperthyroidism: β-blocker (e.g., propranolol 20-40 mg PO q6h)
 If pain → NSAIDs, if refractory → prednisone 20 to 40 mg qd
 If suppurative thyroiditis → IV abx and drain abscess
8. Evaluation of Thyroid Nodule
Epidemiology and Risk Factors for Malignancy
 Incidence of thyroid nodules ↑ after age 45 yr, more frequently in women
 ↑ Risk malignancy: nodule ≥2 cm, regional lymphadenopathy, fixation to adjacent tissues, age <40 yr, sx of local invasion (dysphagia, hoarseness, neck pain, male sex, family hx of thyroid cancer or polyposis [Gardner syndrome]), rapid growth during levothyroxine Rx
W/up, Labs/Imaging
 FNA biopsy best diagnostic study; accuracy can be >90%
 TSH, T4, and serum thyroglobulin levels
 Serum calcitonin if suspect medullary carcinoma of the thyroid/family hx
 Thyroid U/S to evaluate size, composition (solid vs. cystic), and dimensions
 Thyroid scan with technetium-99m pertechnetate, iodine-123, or iodine-131 in selected pts (Fig. 5-5)
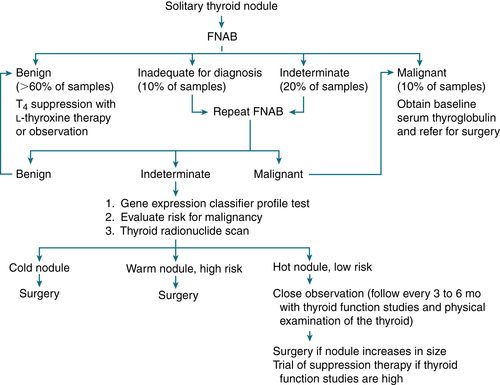
FIGURE 5-5 Diagnostic evaluation of solitary thyroid nodule in euthyroid patient. High risk for malignancy: nodule >2 cm, age <40 years, male sex, regional lymphadenopathy, fixation to adjacent tissues, history of previous head and neck irradiation.
9. Thyroid Carcinoma
 Papillary carcinoma
 Follicular carcinoma
TABLE 5-8
Characteristics of Thyroid Cancers
| Type of Cancer | Percentage of Thyroid Cancers (%) | Age of Onset (yr) | Treatment | Prognosis |
| Papillary | 80 | 40-80 | Thyroidectomy, followed by radioactive iodine ablation | Good |
| Follicular | 15 | 45-80 | Thyroidectomy, followed by radioactive iodine ablation | Fair to good |
| Medullary | 3 | 20-50 | Thyroidectomy and central compartment lymph node dissection | Fair |
| Anaplastic | 1 | 50-80 | Isthmusectomy followed by palliative x-ray treatment | Poor |
| Lymphoma | 1 | 25-70 | X-ray therapy and/or chemotherapy | Fair |
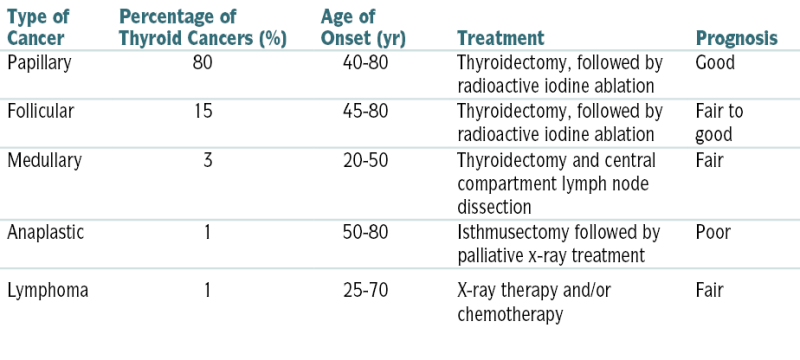
From Andreoli TE, Benjamin IJ, Griggs RC, Wing EJ: Andreoli and Carpenter’s Cecil Essentials of Medicine, 8th ed. Philadelphia, Saunders, 2010.
 Anaplastic carcinoma
 MTC:
MTC:H&P
 Presence of thyroid nodule/painless swelling
 Most common type (50%-60%) is papillary carcinoma.
 Median age at dx: 45 to 50 yr; female 3:1
 Hoarseness and cervical lymphadenopathy
W/up
 FNA biopsy; thyroid function studies are generally nl.
 Thyroid U/S, thyroid scanning with iodine-123 or technetium-99m
Treatment
 Thyroidectomy
F. Calcium Homeostasis Disorders
2. Hypercalcemia
Etiology
 Malignant disease (20%-30% of cancers), 4 types:
 Hyperparathyroidism bone resorption, GI absorption, and renal absorption from
 Granulomatous disorders → GI absorption (e.g., sarcoidosis)
 Paget’s disease → bone resorption (seen only during periods of immobilization)
 Vitamin D intoxication, milk-alkali syndrome → GI absorption
 Thiazides → renal absorption
 Other causes: familial hypocalciuric hypercalcemia, thyrotoxicosis, adrenal insufficiency, prolonged immobilization, vitamin A intoxication, recovery from acute kidney injury (AKI), lithium administration, pheochromocytoma, SLE
Diagnosis
H&P
 GI: constipation, anorexia, N/V, pancreatitis, ulcers
 CNS: confusion, obtundation, psychosis, lassitude, depression, coma
 GU: nephrolithiasis, renal insufficiency, polyuria, ↓ urine-concentrating ability (nephrogenic DI), nocturia, nephrocalcinosis
 Other: HTN, metastatic calcifications, band keratopathy, pruritus
 Most pts are asymptomatic at the time of dx.
Hx
 FHx of hypercalcemia such as MEN syndromes or familial hypocalciuric hypercalcemia (the latter is a benign autosomal dominant condition of ↑ serum Ca2+, ↓ urinary Ca2+, ↓ fractional excretion of Ca2+ [generally <1%], and a nl PTH → parathyroidectomy not indicated)
 Inquire about intake of milk and antacids (milk-alkali syndrome), intake of thiazides, lithium, large doses of vitamins A or D.
 Inquire whether pt has any bone pain (MM, metastatic disease) or abd pain (pancreatitis, PUD).
PE
 Look for evidence of primary neoplasm (e.g., breast, lung).
 Check eyes for evidence of band keratopathy (found in medial and lateral margin of the cornea).
Labs (Fig. 5-6)
 Initial labs: serum Ca2+, alb, PO4-3, Mg, alk phos, electrolytes, BUN, Cr, PTH, and 24-hr urine Ca2+ collection. In pts w/abnl alb levels, it is important to measure the serum level of ionized Ca2+ to correct for the abnl alb. If the ionized Ca2+ is not available, the total Ca2+ can be corrected for a low alb level by adding 0.8 mg/dL to the total Ca2+ level for every 1.0 g/dL of serum alb below the level of 3.5 g/dL.
 If the hx suggests ↓ intake of vitamin D (e.g., in food faddists w/intake of megadoses of fat-soluble vitamins), check serum vitamin D level (1,25-dihydroxyvitamin D).
 The iPTH distinguishes primary hyperparathyroidism from hypercalcemia caused by malignant disease when the serum Ca level is >12 mg/dL.
 ↑↑ Urinary cyclic AMP = primary hyperparathyroidism, although certain nonparathyroid malignant neoplasms also produce levels of urinary cyclic AMP.
 ↑ PTHrP = hypercalcemia-associated malignant neoplasms.
Imaging
 Bone survey may show evidence of subperiosteal bone resorption (suggesting PTH excess).
 Parathyroid localization w/technetium-99m sestamibi: high sensitivity and specificity for single adenomas
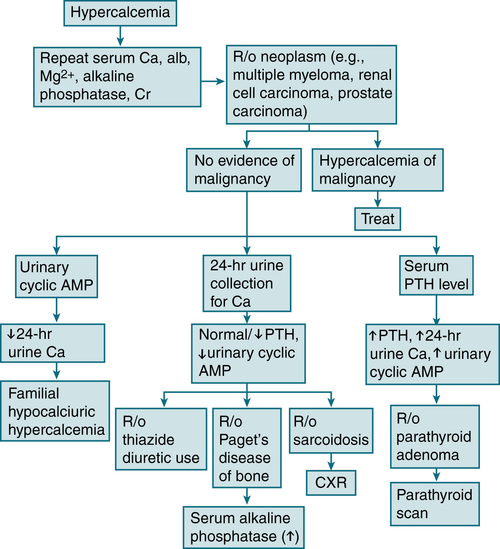
FIGURE 5-6 Diagnostic algorithm for hypercalcemia. (From Ravel R: Clinical Laboratory Medicine, 6th ed. St. Louis, Mosby, 1995.)
Treatment
Acute Severe Hypercalcemia (serum Ca ≥13 mg/dL or symptomatic pt)
 Vigorous IV hydration w/NS. Usual administration rate is 200 to 500 mL/hr, depending on the baseline level of dehydration, renal function, and the CV and mental status of the pt.
 NS infusion = inhibition of proximal tubular Na+ and Ca2+ reabsorption → increased delivery of Na+ and water to distal nephron → ↑ urinary Ca2+ excretion
 IV bisphosphonates to inhibit osteoclast bone resorption: zoledronate (4 mg IV over a 15-min period in a solution of 50 mL of NS or D5W). In pts with impaired kidney function can use denosumab to ↓ osteoclast mediated bone resorption
 PO4-3 repletion: Hypophosphatemia occurs in most pts w/hypercalcemia due to cancer. Serum PO4-3 level should be kept in the range of 2.5 to 3 mg/dL. Serum phosphorus and Cr levels should be closely monitored. PO4-3 replacement should be PO (e.g., 250 mg Neutra-Phos PO qid until serum phosphorus level is >3.0 mg/dL).
 Loop diuretics (e.g., furosemide 20-40 mg IV) can worsen dehydration and should not be administered until full hydration has been achieved. Thiazide diuretics are contraindicated because they will stimulate rather than inhibit renal Ca reabsorption.
3. Hypocalcemia
Etiology
 Renal insufficiency: hypocalcemia caused by
 Hypoalbuminemia: Each ↓ in serum alb (g/L) will ↓ serum Ca by 0.8 mg/dL but will not change free (ionized) Ca.
 Vitamin D deficiency
 Malabsorption (most common cause)
 Hypomagnesemia: hypocalcemia caused by
 Pancreatitis, hyperphosphatemia, osteoblastic mets: Hypocalcemia is secondary to Ca deposits (bone, abd).
 Pseudohypoparathyroidism: autosomal recessive, short stature, shortening of metacarpal bones, obesity, mental retardation. The hypocalcemia is secondary to congenital end-organ resistance to PTH.
 Idiopathic hypoparathyroidism, surgical removal of parathyroids (e.g., neck surgery)
 Hungry bones syndrome: rapid transfer of Ca from plasma into bones after removal of a parathyroid tumor
 Sepsis
 Massive blood transfusion (as a result of EDTA and calcium chelation in blood)
Diagnosis
H&P
 Neuromuscular irritability
 Tetany, paresthesias, myopathy, seizures, muscle spasm or weakness
 Psychiatric disturbances: psychosis, depression, impaired cognitive function
 Soft tissue calcifications, ocular cataracts
 CV: arrhythmias, CHF, QT interval, hypotension
Labs (Table 5-9 and Fig. 5-7)
 Serum alb: to r/o hypoalbuminemia
 BUN, Cr: to r/o renal failure
 Serum Mg: to r/o severe hypomagnesemia
 Serum PO4-3, alk phos: to differentiate hypoparathyroidism from vitamin D deficiency
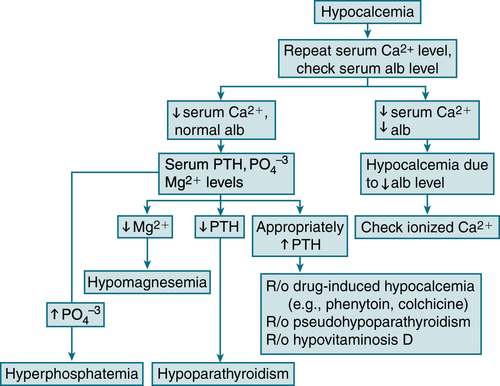
FIGURE 5-7 Diagnostic algorithm for hypocalcemia. (From Ferri FF: Ferri’s Best Test: A Practical Guide to Clinical Laboratory Medicine and Diagnostic Imaging, 2nd ed. Philadelphia, Mosby, 2010.)
TABLE 5-9
Laboratory Differential Diagnosis of Hypocalcemia
| Diagnosis | Plasma Tests | Urine Tests | Comments | ||||||||
| Ca | PO4 | PTH | 25(OH)D | 1,25(OH)2D | cAMP | cAMP After PTH | TmP/GFR | TmP/GFR After PTH | Ca | ||
| Hypoparathyroidism | ↓ | ↑ | N/↓ | N | ↓ | ↓ | ↑↑ | ↓ | ↓↓ | N/↓ | Deficiency of PTH |
| Pseudohypoparathyroidism | |||||||||||
| Type I | ↓ | ↑ | ↑↑ | N | ↓ | ↓ | NC | ↑ | ↑ | N/↓ | Resistance to PTH; patients may have Albright’s hereditary osteodystrophy and resistance to multiple hormones |
| Type II | ↓ | N | ↑↑ | N | ↓ | ↓ | ↑ | ↑ | ↑ | N/↓ | Renal resistance to cAMP |
| Vitamin D deficiency | ↓ | N/↓ | ↑↑ | ↓↓ | N/↓ | ↑ | ↑ | ↓ | ↓ | ↓↓ | Deficient supply (e.g., nutrition) or absorption (e.g., pancreatic insufficiency) of vitamin D |
| Vitamin D–dependent rickets | |||||||||||
| Type I | ↓ | N/↓ | ↑↑ | N | ↓ | ↑ | ↓ | ↓ | ↓↓ | Deficient activity of renal 25(OH)D-1α-hydroxylase | |
| Type II | ↓ | N/↓ | ↑↑ | N | ↑↑ | ↑ | ↓ | ↓↓ | Resistance to 1,25(OH)2D | ||
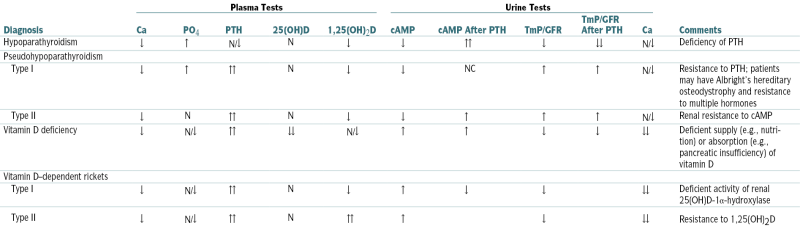
(OH)D, hydroxycholecalciferol D; OH2D, dihydroxycholecalciferol; TmP, renal threshold for phosphorus.
From Moore WT, Eastman RC: Diagnostic Endocrinology, 2nd ed. St. Louis, Mosby, 1996.
 Serum PTH
Treatment
 Acute, severe symptomatic hypocalcemia caused by hypoparathyroidism or vitamin D deficiency: Give a slow IV bolus (over 15 min) of 10 to 30 mL of a 10% Ca gluconate solution followed by an infusion of 4 g Ca gluconate in 500 mL D5W over 4 hr (1 g Ca gluconate = 10 mL 10% Ca gluconate).
 Hypoalbuminemia
 Hypomagnesemia: Correct the Mg deficiency.
 Chronic hypocalcemia caused by hypoparathyroidism or vitamin D deficiency
 Chronic hypocalcemia caused by renal failure
G. Adrenal Gland Disorders
1. Cushing’s Syndrome
Etiology
 Iatrogenic from chronic glucocorticoid Rx (most common) (↓ ACTH, ↑ cortisol)
 Pituitary ACTH excess (Cushing’s disease) (↑ ACTH, ↑ cortisol)
 Adrenal neoplasms (30%) (↓ ACTH, ↑ cortisol)
 Ectopic ACTH production (neoplasms of lung, pancreas, kidney, thyroid, thymus; 10%) (↑↑ ACTH, ↑↑ cortisol)
Diagnosis
H&P
 HTN
HTN
 Hirsutism, menstrual irregularities, hypogonadism
 Skin fragility, ecchymoses, red-purple abd striae, acne, poor wound healing, hair loss, facial plethora, hyperpigmentation (when there is ACTH excess)
 Psychosis, emotional lability, paranoia
 Muscle wasting w/proximal myopathy
Labs

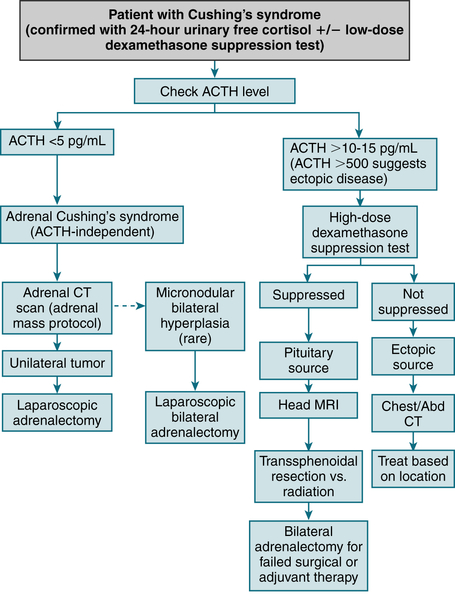
FIGURE 5-8 Clinical diagnosis and management of Cushing’s syndrome. (From Cameron AM: Current Surgical Therapy, 10th ed. Philadelphia, Saunders, 2011.)
Imaging
 CT scan of adrenal glands: indicated in suspected adrenal Cushing’s syndrome
 MRI of pituitary gland w/gadolinium: indicated in suspected pituitary Cushing’s syndrome
Treatment
 Pituitary adenoma: Transsphenoidal microadenomectomy is the Rx of choice in adults. Pituitary irradiation is reserved for pts not cured by transsphenoidal surgery. In children, pituitary irradiation may be considered initial Rx because 85% of children are cured by radiation. Stereotactic radioRx (photon knife or gamma knife) is effective and exposes the surrounding neuronal tissues to less irradiation than in conventional radioRx. Total bilateral adrenalectomy is reserved for pts not cured by transsphenoidal surgery or pituitary irradiation.
 Adrenal neoplasm: surgical resection of the affected adrenal; glucocorticoid replacement for approximately 9 to 12 mo after the surgery to allow time for the contralateral adrenal to recover from its prolonged suppression
 Bilateral micronodular or macronodular adrenal hyperplasia: bilateral total adrenalectomy
 Ectopic ACTH: surgical resection of the ACTH-secreting neoplasm; control of cortisol excess w/metyrapone, aminoglutethimide, mifepristone, or ketoconazole; control of the mineralocorticoid effects of cortisol and 11-deoxycorticosteroid w/spironolactone. Bilateral adrenalectomy is a rational approach to pts w/indolent, unresectable tumors.
2. Primary Adrenocortical Insufficiency (Addison’s Disease)
Etiology
 Autoimmune destruction of the adrenals (80% of cases)
 TB (15% of cases)
 Carcinomatous destruction of the adrenals
 Adrenal hemorrhage (anticoagulants, trauma, coagulopathies, pregnancy, sepsis); adrenal infarction (arteritis, thrombosis)
 AIDS (adrenal insufficiency develops in 30% of pts w/advanced AIDS)
 Other: sarcoidosis, amyloidosis, postoperative, fungal infection, megestrol acetate Rx, etomidate Rx
Diagnosis
H&P
 Hyperpigmentation, hypotension, generalized weakness, amenorrhea, and loss of axillary hair in female pts
Labs (Fig. 5-9)
 Perform rapid ACTH (cosyntropin) test: 250 μg ACTH by IV push; measure cortisol level at 0, 30, 60 min. Cortisol level <18 μg/dL at 30 min or 60 min suggests adrenal insufficiency. Measure plasma ACTH level: ↑ level indicates primary adrenal insufficiency, nl/↓ level indicates secondary adrenal insufficiency.
 ↑ K+, ↓ Na+ and Cl−, ↓ glucose, ↑ BUN/Cr ratio (prerenal azotemia), mild normocytic normochromic anemia, neutropenia, lymphocytosis, eosinophilia (significant dehydration may mask the hyponatremia and anemia), ↓ 24-hr urinary cortisol, 17-OHCS, and 17-KS and ↑ ACTH (if primary adrenocortical insufficiency)
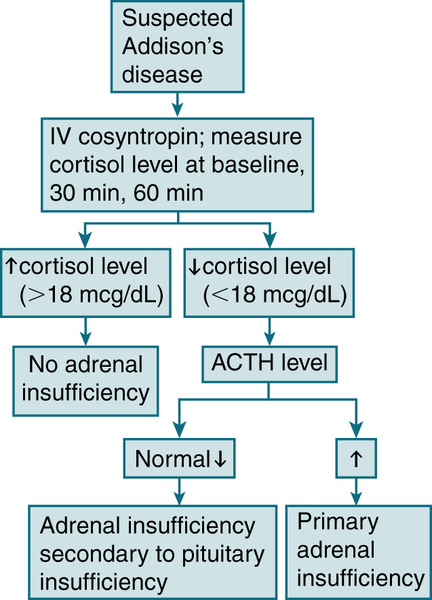
FIGURE 5-9 Diagnostic algorithm for adrenal insufficiency (Addison’s disease). (From Ferri FF: Ferri’s Best Test: A Practical Guide to Clinical Laboratory Medicine and Diagnostic Imaging, 2nd ed. Philadelphia, Mosby, 2010.)
Treatment
Chronic Adrenocortical Insufficiency
 Hydrocortisone, 15 to 20 mg PO q AM and 5 to 10 mg in late afternoon or prednisone 5 mg in AM and 2.5 mg at hs
 Oral fludrocortisone 0.05 to 0.20 mg/day (if the pt has primary adrenocortical insufficiency). The dose is adjusted on the basis of the serum Na+ level and the presence of postural hypotension or marked orthostasis.
 Monitor serum electrolytes, VS, and BW periodically: Advise liberal Na+ intake.
 Pts should be instructed to ↑ glucocorticoid replacement in times of stress and to receive parenteral glucocorticoids if diarrhea or vomiting occurs.
Addisonian Crisis
 Acute complications of adrenal insufficiency characterized by circulatory collapse, dehydration, N/V, hypoglycemia, and hyperkalemia
 Draw plasma cortisol level; do not delay Rx until confirming lab results are obtained.
 Administer hydrocortisone 50 to 100 mg IV q6h for 24 hr; if pt shows good clinical response, gradually taper dosage and change to PO maintenance dose (usually prednisone, 7.5 mg/day).
 Provide adequate volume replacement w/D5NS solution until hypotension, dehydration, and hypoglycemia are completely corrected. Large volumes (2-3 L) may be necessary in the first 2 to 3 hr to correct the volume deficit and hypoglycemia and to avoid further hyponatremia.
 Identify and correct any precipitating factor (e.g., sepsis, hemorrhage).
3. Disorders of Mineralocorticoid Secretion
a. Hypoaldosteronism
Etiology
 Hyporeninemic hypoaldosteronism (renin-angiotensin dependent): ↓ aldosterone production as a result of ↓ renin production; pt has renal disease secondary to various factors (e.g., DM, interstitial nephritis, MM).
 Hyperreninemic hypoaldosteronism (renin-angiotensin independent): Renin production by the kidneys is intact; defect is in aldosterone biosynthesis or in the action of angiotensin II. Common causes are meds (ACEIs, heparin), lead poisoning, aldosterone enzyme defects, and severe illness.
H&P
 HTN, muscle weakness, cardiac arrhythmias
Diagnosis
Labs
 ↑ K+, nl or ↓ Na+
 Hyperchloremic metabolic acidosis (caused by the absence of hydrogen-secreting action of aldosterone)
 ↑ BUN and Cr (secondary to renal disease)
 Hyperglycemia (DM is common in these pts)
W/up
 Measurement of PRA after 4 hr of upright posture can differentiate hyporeninemic from hyperreninemic causes. Nl/↓ renin levels = renin-angiotensin dependent, ↑ renin levels = renin-angiotensin independent.
 Renin-aldosterone stimulation test
Treatment
 Low-K diet with liberal Na intake (≥4 g of NaCl/day)
 Avoidance of ACEIs and K+-sparing diuretics
 Judicious use of fludrocortisone (0.05 to 0.1 mg PO every morning) in pts with aldosterone deficiency associated with deficiency of adrenal glucocorticoid hormones
 Furosemide 20 to 40 mg qd to correct hyperkalemia of hyporeninemic hypoaldosteronism
b. Hyperaldosteronism (Conn’s syndrome)
Etiology
 Aldosterone-producing adenoma (>60%)
 Idiopathic hyperaldosteronism (>30%)
 Glucocorticoid-suppressible hyperaldosteronism (<1%)
Diagnosis
 24-hr urine test for aldosterone and K+ levels (K+ >40 mEq and aldosterone >15 μg)
 The renin-aldosterone stimulation test (posture test) to differentiate idiopathic hyperaldosteronism (IHA) from aldosterone-producing adenoma (APA). Pts with APA have a ↓ in aldosterone levels at 4 hr, whereas pts with IHA have an ↑ in aldosterone levels.
 As a screening test for primary aldosteronism, an ↑ plasma aldosterone-renin ratio (ARR), drawn randomly from pts taking hypertensive drugs, is predictive of primary aldosteronism. ARR is calculated by dividing plasma aldosterone (mg/dL) by PRA (mg/mL/hr). ARR >100 is considered ↑.
 Bilateral adrenal vein sampling (AVS) may be done to localize APA when adrenal CT scan is equivocal. In APA, ipsilateral/contralateral aldosterone level is >10:1, and ipsilateral venous aldosterone concentration is very high (>1000 ng/dL).
H&P
 If significant hypokalemia: muscle cramping, weakness, paresthesias
 HTN
HTN Polyuria, polydipsia
Labs
 Routine labs can be suggestive but are not diagnostic of primary aldosteronism. Common abnlities are
Imaging
 Adrenal CT scans (with 3-mm cuts) or MRI to localize neoplasm
 Adrenal scanning with iodocholesterol (NP-59) or 6-β-iodomethyl-19-norcholesterol after dexamethasone suppression. The uptake of tracer is ↑ in those with aldosteronoma and absent in those with IHA and adrenal carcinoma.
Treatment
 Low-Na+diet
 Control of BP and hypokalemia with spironolactone, amiloride, or ACEIs
 Surgery (unilateral adrenalectomy) for APA
H. Pheochromocytoma
Definition
Diagnosis
H&P
 HTN: sustained (55%) or paroxysmal (45%)
 Headache (80%): paroxysmal, described as “pounding” and severe
 Palpitations (70%): w/ or w/o tachycardia
 Hyperhidrosis (60%): most evident during paroxysmal attacks of HTN
 PE may be entirely nl if done in a sx-free interval; during a paroxysm, there is ↑↑ BP, profuse sweating, visual disturbances (caused by hypertensive retinopathy), dilated pupils (secondary to catecholamine excess), paresthesias in the LEs (caused by severe vasoconstriction), tremor, tachycardia.
Labs
 Plasma-free metanephrines show ↑ normetanephrines >2.5 pmol/mL or ↑ metanephrine >1.4 pmol/mL.
 24-hr urine collection for metanephrines reveals ↑ metanephrines.
 Clonidine suppression test: Used to distinguish between levels of plasma norepinephrine caused by release from sympathetic nerves and those from pheo. A ↓ (<50%) in plasma NE levels after clonidine administration is nl, whereas persistent ↑ = pheochromocytoma.
Imaging
 Abd CT (88% sensitivity): useful in locating pheochromocytomas >0.5 inch in diameter (90%-95% accurate); >90 % of pheos arise in adrenal medulla
 MRI: 100% sensitivity
 Scintigraphy w/131I-MIBG: 100% sensitivity. NE analogue localizes in adrenergic tissue; useful in locating extra-adrenal pheochromocytomas.
 6-[18F]Fluorodopamine PET: used when biochemical test results are + but other imaging cannot locate the tumor
Treatment
 Preoperative stabilization w/combination of phenoxybenzamine, β-blocker, metyrosine, and liberal fluid and salt intake starting 10 to 14 days before surgery
 HTN crisis preoperatively and intraoperatively controlled w/phentolamine 2 to 5 mg IV q1-2h PRN or nitroprusside used in combination w/β-adrenergic blockers
I. Carcinoid Syndrome
 Sx complex characterized by paroxysmal vasomotor disturbances, diarrhea, and bronchospasm resulting from amines and peptides (serotonin, bradykinin, histamine) produced by tumors arising from neuroendocrine cells
 Located in appendix (40%), small bowel (20%; 15% in the ileum), rectum (15%), bronchi (12%), esophagus, stomach, colon (10%), ovary, biliary tract, pancreas (3%)
Diagnosis
H&P
 Cutaneous flushing (75%-90%)
 Red-purple flushes starting in the face, then spreading to the neck and upper trunk
 The flushing episodes last from a few minutes to hr (longer lasting flushes may be associated w/bronchial carcinoids).
 Dizziness, tachycardia, and hypotension may be associated w/the cutaneous flushing.
 Diarrhea (>70%): often associated w/abd bloating and audible peristaltic rushes
 Intermittent bronchospasm (25%)
 Facial telangiectasia
 Tricuspid insufficiency, pulmonic stenosis from carcinoid heart lesions
Labs
 ↑ 24-hr urinary 5-hydroxyindoleacetic acid (5-HIAA)
 Biochemical screening can also be done w/plasma chromogranin A.
Imaging
 CXR: to detect bronchial carcinoids
 CT of abd to detect liver mets
 Iodine-123–labeled somatostatin (123I-SS) scintigraphy
Treatment
 Surgical resection
 Octreotide or lanreotide for flushing and diarrhea
 Interferon α may be used as an additive Rx when sx persist.
 Percutaneous embolization and ligation of the hepatic artery can ↓ the bulk of the tumor in the liver and provide palliative Rx of tumors w/hepatic mets.
J. Multiple Endocrine Neoplasia
Classification
MEN I (Wermer’s Syndrome)
 Possible associated conditions:
 Clinical manifestations:
MEN II (Sipple’s Syndrome, MEN IIA)
 Clinical manifestations:
 Relatives of affected persons should be screened to detect medullary carcinoma at an early stage; screening can be accomplished with
MEN III (Multiple Mucosal Neuroma Syndrome, MEN IIB)
 Clinical manifestations: