Electrophoresis Techniques
At the conclusion of this chapter, the reader should be able to:
• Define the term electrophoresis.
• Describe the electrophoresis technique.
• Identify the fractions into which serum proteins can be divided by electrophoresis.
• Describe the characteristics of immunoelectrophoresis.
• Explain the features of immunofixation electrophoresis.
• Discuss the clinical applications of immunoelectrophoresis.
• Compare immunoelectrophoresis and immunofixation electrophoresis.
• Compare capillary electrophoresis and microchip capillary electrophoresis.
• Describe two electrophoresis separation methods.
• Analyze a case study related to the results of serum protein electrophoresis.
• Correctly answer case study related multiple choice questions.
• Be prepared to participate in a discussion of critical thinking questions.
• Describe the principle of the immunofixation electrophoresis procedure.
Electrophoresis
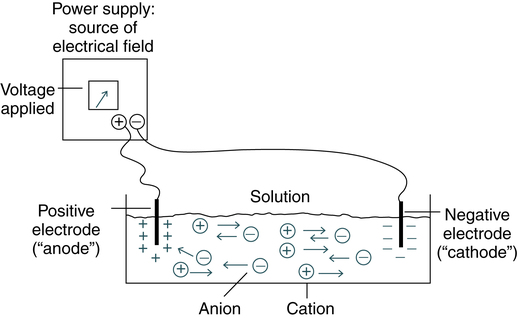
The electrical field is applied to a solution with oppositely charged electrodes. Charged particles in this solution begin to migrate. Positively charged particles (cations) move to the negatively charged (−) electrode; negatively charged particles (anions) migrate to the positively charged (+) electrode (Fig. 11-1).
Serum proteins are often separated by electrophoresis. Serum electrophoresis results in the separation of proteins into five fractions using cellulose acetate as a support medium (Fig. 11-2). This separation is based on the rate of migration of these individual components in an electrical field.
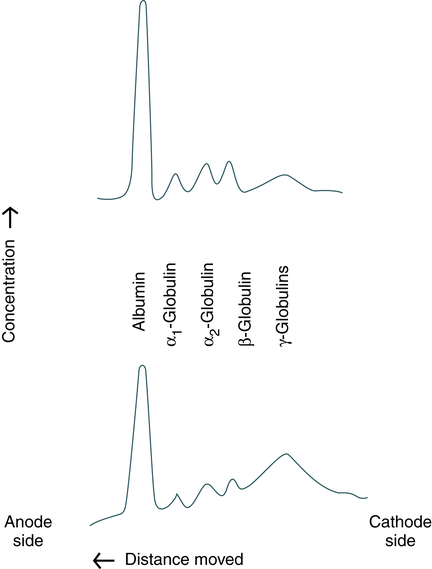
Upper profile, Distribution characteristic of healthy people. (From Kaplan LA, Pesce AJ: Clinical chemistry: theory, analysis, correlation, ed 5, St Louis, 2010, Mosby.)
Electrophoresis is a versatile analytic technique. Immunoglobulins are separated by electrophoresis using agarose as a support medium. The immunologic applications of electrophoresis include identification of monoclonal proteins in serum or urine, immunoelectrophoresis, and various blotting techniques (see Chapter 14).
Immunoelectrophoresis
Passive Immunodiffusion Procedures
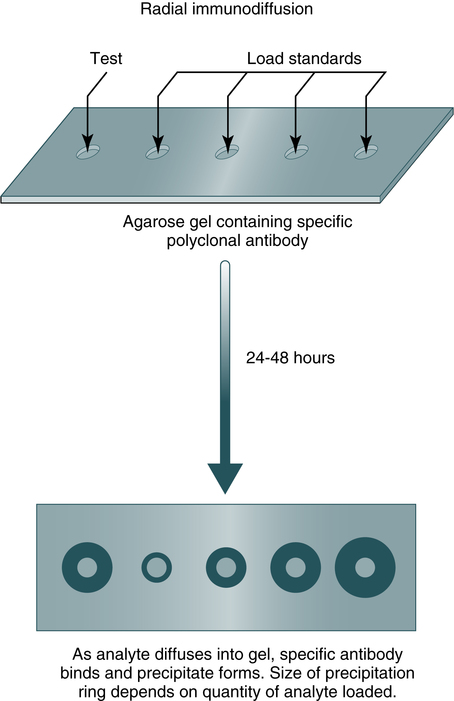
Immunodiffusion is a laboratory method for the quantitative study of antibodies (e.g., radial immunodiffusion [RID]) and rocket electrophoresis or for identifying antigens (e.g., Ouchterlony technique). Single diffusion preceded radial immunodiffusion. In the single diffusion procedure, antigen was layered on top of a gel medium and, as the antigen moved down into the gel, precipitation occurred and migrated down a tube in proportion to the amount of antigen present. In radial immunodiffusion (RID) (Fig. 11-3), antibody is uniformly distributed in the gel medium and antigen is added to a well cut into the gel. As the antigen diffuses from the well, the antigen-antibody combination occurs in changing proportions until the zone of equivalence is reached and a stable lattice network is formed in the gel. The area of the visible ring is compared with standard concentrations of antigens. A variation of this principle is rocket immunoelectrophoresis (Fig. 11-4).
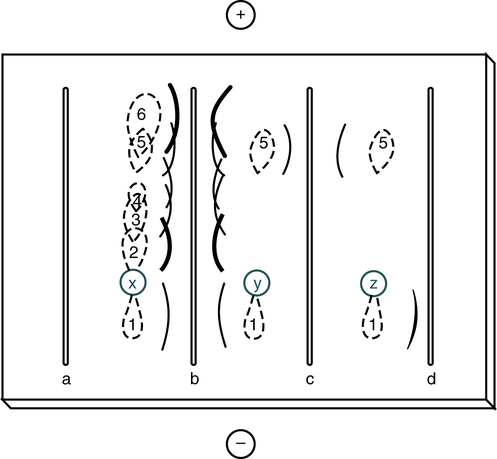
Sample wells are punched in the agar-agarose, sample is applied, and electrophoresis is carried out to separate the proteins in the sample. Antiserum is loaded into the troughs and the gel is incubated in a moist chamber at 4° C (39° F) for 24 to 72 hours. Track x represents the shape of the protein zones after electrophoresis; tracks y and z show the reaction of proteins 5 and 1 with their specific antisera in troughs c and d. Antiserum against proteins 1 through 6 is present in trough b. (From Burtis CA, Ashwood ER, Bruns DB: Tietz fundamentals of clinical chemistry, ed 6, St Louis, 2008, Saunders.)
The classic Ouchterlony double diffusion technique (Fig. 11-5). performed on a gel medium is used to detect the presence of antibodies and determine their specificity by visualization of lines of identity, or precipitin lines. The reaction of antigen-antibody combination occurs by means of diffusion. The size and position of precipitin bands provide information regarding equivalence or antibody excess. Proteins are differentiated not only by their electrophoretic mobility, but also by their diffusion coefficient and antibody specificity. Although double immunodiffusion produces a separate precipitation band for each antigen-antibody system in a mixture, it is often difficult to determine all the components in a complex mixture.
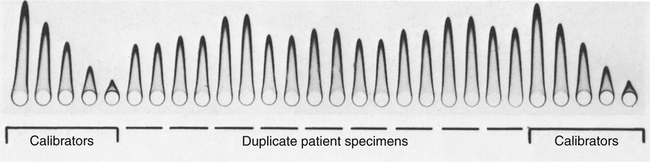
Patient samples were applied in duplicate. Calibrators were placed at opposite ends of the plate. (From Burtis CA, Ashwood ER, Bruns DB: Tietz fundamentals of clinical chemistry, ed 6, St Louis, 2008, Saunders.)
Principle
Each line represents one specific protein (Fig. 11-6). Proteins are thus differentiated by their diffusion coefficient and antibody specificity as well as electrophoretic mobility. Antibody diffuses as a uniform band parallel to the antibody trough. If the proteins are homogeneous or of like composition, the antigen diffuses in a circle and the antigen-antibody precipitation line resembles a segment, or arc, of a circle. If the antigen is heterogeneous or not uniform in composition, the antigen-antibody line assumes an elliptical shape. One arc of precipitation forms for each constituent in the antigen mixture. This technique can be used to resolve the protein of normal serum into 25 to 40 distinct precipitation bands. The exact number depends on the strength and specificity of the antiserum used.
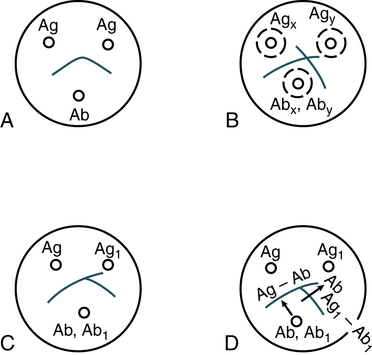
A, Reaction of identity. B, Reaction of nonidentity. C, Reaction of partial identity. D, Scheme for spur formation. Ab, Antibody; Ag, antigen. (From Burtis CA, Ashwood ER, Bruns DB: Tietz fundamentals of clinical chemistry, ed 6, St. Louis, 2008, Saunders.)
Abnormal Appearance of Precipitin Bands
The size and position of precipitin bands provide the same type of information regarding equivalence or antigen-antibody excess as double immunodiffusion systems. The position and shape of precipitin bands in the IEP assay of serum are relatively stable and reproducible; almost any deviation is abnormal (Fig. 11-7). These abnormalities can be detected by evaluating the following features of the precipitin bands:
• Position of the band in relation to electrophoretically identified protein fractions
• Position of the band between the antigen well and antibody trough
• Distortion of the curvature or arc formation
Comparison of Techniques
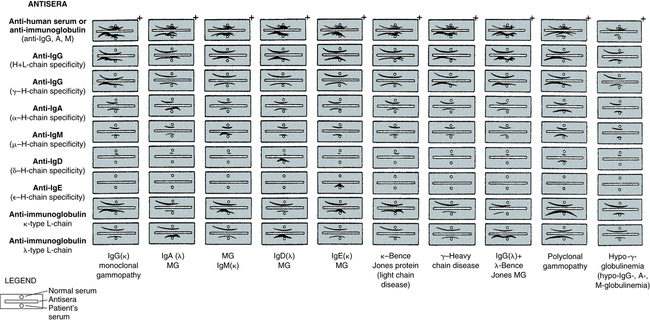
Immunofixation electrophoresis can be optimized to give greater sensitivity and resolution than IEP. IFE should be reserved for anomalous proteins, which are difficult to characterize by IEP. These include small bands, such as those exhibited in the early stages of monoclonal gammopathies or L-chain disease, and any multiple, closely spaced bands. The results of IFE are easier to interpret than those of IEP because interpretation is based on examination of a precipitate pattern directly analogous to routine electrophoresis; IFE does not depend on detecting slight deviations in the shape of a precipitin arc (Fig. 11-8; Table 11-1).
Table 11-1
Comparison of Immunoelectrophoresis and Immunofixation Electrophoresis
| Feature | IEP | IFE |
| Ease of use | Easy | More complex |
| Sensitivity | Less sensitive | More sensitive |
| Monoclonal gammopathies | Better for typing large monoclonal gammopathies | Used for difficult to characterize anomalous proteins |
| Interpretation | Challenging | Easier |
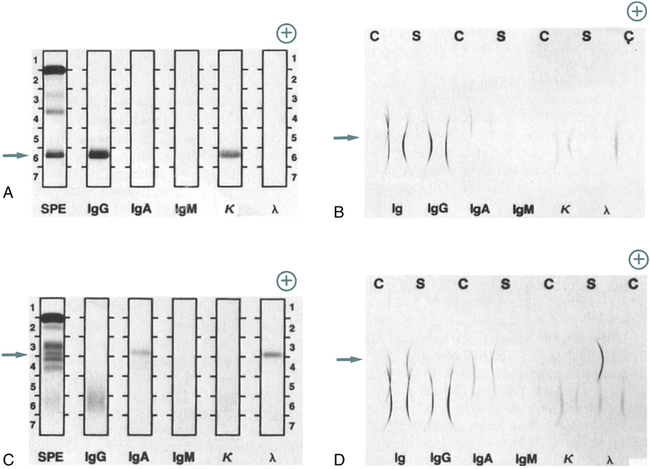
A, Patient specimen with an IgG (κ) monoclonal protein, as identified by IFE. Note the position of the monoclonal protein (arrow). After electrophoresis, each track except serum protein electrophoresis (SPE) is reacted with its respective antiserum; then, all tracks are stained to visualize the respective protein bands. Immunoglobulins G, A, and M (IgG, IgA, IgM); kappa (κ); and lambda (λ) indicate antiserum used on each track. B, Same specimen as in A, with proteins identified by IEP. Note the position of the monoclonal protein (arrow). Normal control (C) and patient sera (S) are alternated. After electrophoresis, antiserum is added to each trough, as indicated by the labels Ig, IgG, IgA, IgM, κ, and λ. The antisera react with separated proteins in the specimens to form precipitates in the shape of arcs. The IgG and κ arcs are shorter and thicker than those in the normal control, showing the presence of the IgG (κ) monoclonal protein. The concentrations of IgA, IgM, and λ light chains also are reduced. C, Patient specimen with an IgA (λ) monoclonal protein identified by the IFE procedure, as described in A. D, Same specimen as in C, with proteins identified by IEP, as described in B. The abnormal IgA and λ arcs for the patient specimen indicate an elevated concentration of a monoclonal IgA (λ) protein. All separations were performed with the Beckman paragon system. (From Burtis CA, Ashwood ER, Bruns DB: Tietz fundamentals of clinical chemistry, ed 6, St Louis, 2008, Saunders.)
Capillary Electrophoresis
In capillary electrophoresis (CE) the classic separation techniques of zone electrophoresis, isotachophoresis, isoelectric focusing, and gel electrophoresis are performed in small-bore (10- to 100-µm), fused silica capillary tubes, 20 to 200 cm in length (Box 11-1). The CE method is efficient, sensitive, and rapid. High electrical field strengths are used to separate molecules based on differences in charge, size, and hydrophobicity. Sample introduction is accomplished by immersing the end of the capillary into a sample vial and applying pressure, vacuum, or voltage.
Conventional CE revolutionized DNA analysis and was vital to the Human Genome Project. Microchip CE is still in the early stages of development but has demonstrated distinct advantages compared with traditional CE (Table 11-2).
Table 11-2
Comparison of Traditional Capillary Electrophoresis and Microchip Capillary Electrophoresis
| Feature | Conventional CE | Microchip CE |
| Separation channels | Mainly silica, single capillary or capillary array | Glass or polymer |
| Separation media | Buffers, gels, sieving polymers, microparticles | Buffers, sieving polymers, microparticles |
| Speed of analysis | Fast (typically minutes) | Very fast (typically seconds) |
| Integration | Difficult to connect capillaries | Easy to integrate multiple functions (e.g., PCR CE) |
| Potential for growth | Relatively mature | Emerging technology with potential for new designs and applications |
PCR, Polymerase chain reaction.
Adapted from Li SFY, Kricka LJ: Clinical analysis by microchip capillary electrophoresis, Clin Chem 52:42, 2006.
CASE STUDY
History and Physical Examination
| Hematology | Patient’s Results | Reference Range |
| Hemoglobin | 12.5 g/dL | 12-16.0 g/dL |
| Hematocrit | 42% | 36%-45% |
| Mean corpuscular volume | 100 fL | 80-96 fL |
| Total leukocyte count | 13.5 × 10⁹/L | 4.5-11.0 × 10⁹/L |
| Platelets | 95.0 × 10⁹/L | 150-450 × 109/L |
| Coagulation—Prothrombin Time | 17 sec | 10-14 sec |
| Urinalysis | ||
| Occult blood | 1+ | Negative |
| Bilirubin | Moderate | Negative |
| Clinical Chemistry | ||
| Bilirubin | 2.5 mg/dL | 0.3-1.2 mg/dL |
| Liver enzymes (alanine aminotransferase [ALT]) | 55 IU/L | 10-35 IU/L |
| Total protein | 5.5 g/dL | 6.4-8.3 g/dL |
| Albumin | 2.5 g/dL | 3.9-5.g/dL |
• Serum protein electrophoresis interpretation—normal electrophoretic migration
• Decreased prealbumin, alpha lipoprotein, and transferrin levels
• α2-Macroglobulin level—markedly increased
• Questionable increase in IgG and IgA because of a diffuse increase in background staining in the beta and gamma immunoglobulin regions
 for discussion of the answers to these questions.
 Immunofixation Electrophoresis Procedure
 for the procedural protocol, sources of error, and clinical applications.
Chapter Highlights
• Serum electrophoresis results in the separation of proteins into five fractions on cellulose acetate based on the rate of migration of these individual components in an electrical field.
• Immunoelectrophoresis (IEP) involves the electrophoresis of serum or urine, followed by immunodiffusion. Proteins are differentiated by electrophoretic mobility and by their diffusion coefficient and antibody specificity.
• Immunofixation electrophoresis (IFE) has two stages, agarose gel protein electrophoresis and immunoprecipitation.
• Capillary electrophoresis (CE) and microchip CE are important techniques for the study of various immunoglobulins.