[level-membership-for-internal-medicine-category]
PART 10: Disorders of the Cardiovascular System
SECTION 1 |
INTRODUCTION TO CARDIOVASCULAR DISORDERS |
264 |
Approach to the Patient with Possible Cardiovascular Disease |
THE MAGNITUDE OF THE PROBLEM
Cardiovascular diseases comprise the most prevalent serious disorders in industrialized nations and are a rapidly growing problem in developing nations (Chap. 266e). Age-adjusted death rates for coronary heart disease have declined by two-thirds in the last four decades in the United States, reflecting the identification and reduction of risk factors as well as improved treatments and interventions for the management of coronary artery disease, arrhythmias, and heart failure. Nonetheless, cardiovascular diseases remain the most common causes of death, responsible for 35% of all deaths, almost 1 million deaths each year. Approximately one-fourth of these deaths are sudden. In addition, cardiovascular diseases are highly prevalent, diagnosed in 80 million adults, or ~35% of the adult population. The growing prevalence of obesity (Chap. 416), type 2 diabetes mellitus (Chap. 417), and metabolic syndrome (Chap. 422), which are important risk factors for atherosclerosis, now threatens to reverse the progress that has been made in the age-adjusted reduction in the mortality rate of coronary heart disease.
For many years cardiovascular disease was considered to be more common in men than in women. In fact, the percentage of all deaths secondary to cardiovascular disease is higher among women (43%) than among men (37%) (Chap. 6e). In addition, although the absolute number of deaths secondary to cardiovascular disease has declined over the past decades in men, this number has actually risen in women. Inflammation, obesity, type 2 diabetes mellitus, and the metabolic syndrome appear to play more prominent roles in the development of coronary atherosclerosis in women than in men. Coronary artery disease (CAD) is more frequently associated with dysfunction of the coronary microcirculation in women than in men. Exercise electrocardiography has a lower diagnostic accuracy in the prediction of epicardial obstruction in women than in men.
NATURAL HISTORY
Cardiovascular disorders often present acutely, as in a previously asymptomatic person who develops an acute myocardial infarction (Chap. 295), or a previously asymptomatic patient with hypertrophic cardiomyopathy (Chap. 287), or with a prolonged QT interval (Chap. 277) whose first clinical manifestation is syncope or even sudden death. However, the alert physician may recognize the patient at risk for these complications long before they occur and often can take measures to prevent their occurrence. For example, a patient with acute myocardial infarction will often have had risk factors for atherosclerosis for many years. Had these risk factors been recognized, their elimination or reduction might have delayed or even prevented the infarction. Similarly, a patient with hypertrophic cardiomyopathy may have had a heart murmur for years and a family history of this disorder. These findings could have led to an echocardiographic examination, recognition of the condition, and appropriate therapy long before the occurrence of a serious acute manifestation.
Patients with valvular heart disease or idiopathic dilated cardiomyopathy, by contrast, may have a prolonged course of gradually increasing dyspnea and other manifestations of chronic heart failure that is punctuated by episodes of acute deterioration only late in the course of the disease. Understanding the natural history of various cardiac disorders is essential for applying appropriate diagnostic and therapeutic measures to each stage of the condition, as well as for providing the patient and family with the likely prognosis.
CARDIAC SYMPTOMS
The symptoms caused by heart disease result most commonly from myocardial ischemia, disturbance of the contraction and/or relaxation of the myocardium, obstruction to blood flow, or an abnormal cardiac rhythm or rate. Ischemia, which is caused by an imbalance between the heart’s oxygen supply and demand, is manifest most frequently as chest discomfort (Chap. 19), whereas reduction of the pumping ability of the heart commonly leads to fatigue and elevated intravascular pressure upstream of the failing ventricle. The latter results in abnormal fluid accumulation, with peripheral edema (Chap. 50) or pulmonary congestion and dyspnea (Chap. 47e). Obstruction to blood flow, as occurs in valvular stenosis, can cause symptoms resembling those of myocardial failure (Chap. 279). Cardiac arrhythmias often develop suddenly, and the resulting symptoms and signs—palpitations (Chap. 52), dyspnea, hypotension, and syncope (Chap. 27)—generally occur abruptly and may disappear as rapidly as they develop.
Although dyspnea, chest discomfort, edema, and syncope are cardinal manifestations of cardiac disease, they occur in other conditions as well. Thus, dyspnea is observed in disorders as diverse as pulmonary disease, marked obesity, and anxiety (Chap. 47e). Similarly, chest discomfort may result from a variety of noncardiac and cardiac causes other than myocardial ischemia (Chap. 19). Edema, an important finding in untreated or inadequately treated heart failure, also may occur with primary renal disease and in hepatic cirrhosis (Chap. 50). Syncope occurs not only with serious cardiac arrhythmias but in a number of neurologic conditions as well (Chap. 27). Whether heart disease is responsible for these symptoms frequently can be determined by carrying out a careful clinical examination (Chap. 267), supplemented by noninvasive testing using electrocardiography at rest and during exercise (Chap. 268), echocardiography, roentgenography, and other forms of myocardial imaging (Chap. 270e).
Myocardial or coronary function that may be adequate at rest may be insufficient during exertion. Thus, dyspnea and/or chest discomfort that appear during activity are characteristic of patients with heart disease, whereas the opposite pattern, i.e., the appearance of these symptoms at rest and their remission during exertion, is rarely observed in such patients. It is important, therefore, to question the patient carefully about the relation of symptoms to exertion.
Many patients with cardiovascular disease may be asymptomatic both at rest and during exertion but may present with an abnormal physical finding such as a heart murmur, elevated arterial pressure, or an abnormality of the electrocardiogram (ECG) or imaging test. It is important to assess the global risk of CAD in asymptomatic individuals, using a combination of clinical assessment and measurement of cholesterol and its fractions, as well as other biomarkers, such as C-reactive protein, in some patients (Chap. 291e). Since the first clinical manifestation of CAD may be catastrophic—sudden cardiac death, acute myocardial infarction, or stroke in previous asymptomatic persons—it is mandatory to identify those at high risk of such events and institute further testing and preventive measures.
DIAGNOSIS
As outlined by the New York Heart Association (NYHA), the elements of a complete cardiac diagnosis include the systematic consideration of the following:
1. The underlying etiology. Is the disease congenital, hypertensive, ischemic, or inflammatory in origin?
2. The anatomic abnormalities. Which chambers are involved? Are they hypertrophied, dilated, or both? Which valves are affected? Are they regurgitant and/or stenotic? Is there pericardial involvement? Has there been a myocardial infarction?
3. The physiologic disturbances. Is an arrhythmia present? Is there evidence of congestive heart failure or myocardial ischemia?
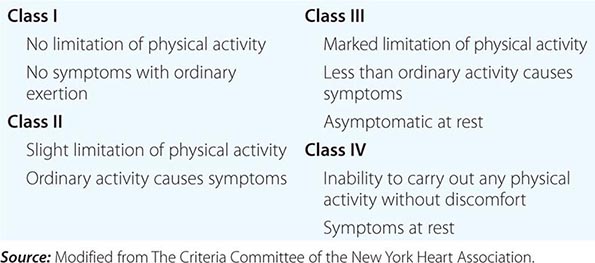
4. Functional disability. How strenuous is the physical activity required to elicit symptoms? The classification provided by the NYHA has been found to be useful in describing functional disability (Table 264-1).
|
NEW YORK HEART ASSOCIATION FUNCTIONAL CLASSIFICATION |
One example may serve to illustrate the importance of establishing a complete diagnosis. In a patient who presents with exertional chest discomfort, the identification of myocardial ischemia as the etiology is of great clinical importance. However, the simple recognition of ischemia is insufficient to formulate a therapeutic strategy or prognosis until the underlying anatomic abnormalities responsible for the myocardial ischemia, e.g., coronary atherosclerosis or aortic stenosis, are identified and a judgment is made about whether other physiologic disturbances that cause an imbalance between myocardial oxygen supply and demand, such as severe anemia, thyrotoxicosis, or supraventricular tachycardia, play contributory roles. Finally, the severity of the disability should govern the extent and tempo of the workup and strongly influence the therapeutic strategy that is selected.
The establishment of a correct and complete cardiac diagnosis usually commences with the history and physical examination (Chap. 267). Indeed, the clinical examination remains the basis for the diagnosis of a wide variety of disorders. The clinical examination may then be supplemented by five types of laboratory tests: (1) ECG (Chap. 268), (2) noninvasive imaging examinations (chest roentgenogram, echocardiogram, radionuclide imaging, computed tomographic imaging, positron emission tomography, and magnetic resonance imaging) (Chap. 270e), (3) blood tests to assess risk (e.g., lipid determinations, C-reactive protein [Chap. 291e]) or cardiac function (e.g., brain natriuretic peptide [BNP] [Chap. 279]), (4) occasionally specialized invasive examinations (i.e., cardiac catheterization and coronary arteriography [Chap. 272]), and (5) genetic tests to identify monogenic cardiac diseases (e.g., hypertrophic cardiomyopathy [Chap. 287], Marfan’s syndrome [Chap. 427], and abnormalities of cardiac ion channels that lead to prolongation of the QT interval and an increase in the risk of sudden death [Chap. 276]). These tests are becoming more widely available.
FAMILY HISTORY
In eliciting the history of a patient with known or suspected cardiovascular disease, particular attention should be directed to the family history. Familial clustering is common in many forms of heart disease. Mendelian transmission of single-gene defects may occur, as in hypertrophic cardiomyopathy (Chap. 287), Marfan’s syndrome (Chap. 427), and sudden death associated with a prolonged QT syndrome (Chap. 277). Premature coronary disease and essential hypertension, type 2 diabetes mellitus, and hyperlipidemia (the most important risk factors for CAD) are usually polygenic disorders. Although familial transmission may be less obvious than in the monogenic disorders, it is helpful in assessing risk and prognosis in polygenic disorders, as well. Familial clustering of cardiovascular diseases not only may occur on a genetic basis but also may be related to familial dietary or behavior patterns, such as excessive ingestion of salt or calories and cigarette smoking.
ASSESSMENT OF FUNCTIONAL IMPAIRMENT
When an attempt is made to determine the severity of functional impairment in a patient with heart disease, it is helpful to ascertain the level of activity and the rate at which it is performed before symptoms develop. Thus, it is not sufficient to state that the patient complains of dyspnea. The breathlessness that occurs after running up two long flights of stairs denotes far less functional impairment than do similar symptoms that occur after taking a few steps on level ground. Also, the degree of customary physical activity at work and during recreation should be considered. The development of two-flight dyspnea in a well-conditioned marathon runner may be far more significant than the development of one-flight dyspnea in a previously sedentary person. The history should include a detailed consideration of the patient’s therapeutic regimen. For example, the persistence or development of edema, breathlessness, and other manifestations of heart failure in a patient who is receiving optimal doses of diuretics and other therapies for heart failure (Chap. 279) is far graver than are similar manifestations in the absence of treatment. Similarly, the presence of angina pectoris despite treatment with optimal doses of multiple antianginal drugs (Chap. 293) is more serious than it is in a patient on no therapy. In an effort to determine the progression of symptoms, and thus the severity of the underlying illness, it may be useful to ascertain what, if any, specific tasks the patient could have carried out 6 months or 1 year earlier that he or she cannot carry out at present.
ELECTROCARDIOGRAM
(See also Chap. 268) Although an ECG usually should be recorded in patients with known or suspected heart disease, with the exception of the identification of arrhythmias, conduction abnormalities, ventricular hypertrophy, and acute myocardial infarction, it generally does not establish a specific diagnosis. The range of normal electrocardiographic findings is wide, and the tracing can be affected significantly by many noncardiac factors, such as age, body habitus, and serum electrolyte concentrations. In general, electrocardiographic changes should be interpreted in the context of other abnormal cardiovascular findings.
ASSESSMENT OF THE PATIENT WITH A HEART MURMUR
(Fig. 264-1) The cause of a heart murmur can often be readily elucidated from a systematic evaluation of its major attributes: timing, duration, intensity, quality, frequency, configuration, location, and radiation when considered in the light of the history, general physical examination, and other features of the cardiac examination, as described in Chap. 267.
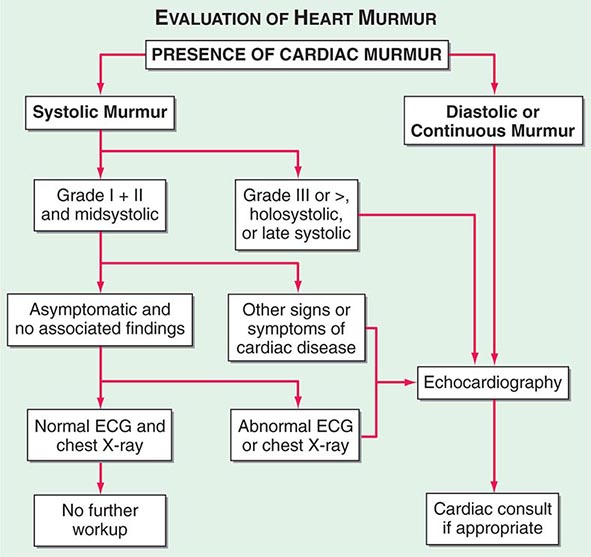
FIGURE 264-1 Approach to the evaluation of a heart murmur. ECG, electrocardiogram. (From RA O’Rourke, in Primary Cardiology, 2nd ed, E Braunwald, L Goldman [eds]. Philadelphia, Saunders, 2003.)
The majority of heart murmurs are midsystolic and soft (grades I–II/VI). When such a murmur occurs in an asymptomatic child or young adult without other evidence of heart disease on clinical examination, it is usually benign and echocardiography generally is not required. By contrast, two-dimensional and Doppler echocardiography (Chap. 270e) are indicated in patients with loud systolic murmurs (grades ≥III/VI), especially those that are holosystolic or late systolic, and in most patients with diastolic or continuous murmurs.
PITFALLS IN CARDIOVASCULAR MEDICINE
Increasing subspecialization in internal medicine and the perfection of advanced diagnostic techniques in cardiology can lead to several undesirable consequences. Examples include the following:
1. Failure by the noncardiologist to recognize important cardiac manifestations of systemic illnesses. For example, the presence of mitral stenosis, patent foramen ovale, and/or transient atrial arrhythmia should be considered in a patient with stroke, or the presence of pulmonary hypertension and cor pulmonale should be considered in a patient with scleroderma or Raynaud’s syndrome. A cardiovascular examination should be carried out to identify and estimate the severity of the cardiovascular involvement that accompanies many noncardiac disorders.
2. Failure by the cardiologist to recognize underlying systemic disorders in patients with heart disease. For example, hyperthyroidism should be considered in an elderly patient with atrial fibrillation and unexplained heart failure, and Lyme disease should be considered in a patient with unexplained fluctuating atrioventricular block. A cardiovascular abnormality may provide the clue critical to the recognition of some systemic disorders. For example, an unexplained pericardial effusion may provide an early clue to the diagnosis of tuberculosis or a neoplasm.
3. Overreliance on and overutilization of laboratory tests, particularly invasive techniques, for the evaluation of the cardiovascular system. Cardiac catheterization and coronary arteriography (Chap. 272) provide precise diagnostic information that may be crucial in developing a therapeutic plan in patients with known or suspected CAD. Although a great deal of attention has been directed to these examinations, it is important to recognize that they serve to supplement, not supplant, a careful examination carried out with clinical and noninvasive techniques. A coronary arteriogram should not be performed in lieu of a careful history in patients with chest pain suspected of having ischemic heart disease. Although coronary arteriography may establish whether the coronary arteries are obstructed and to what extent, the results of the procedure by themselves often do not provide a definitive answer to the question of whether a patient’s complaint of chest discomfort is attributable to coronary atherosclerosis and whether or not revascularization is indicated.
Despite the value of invasive tests in certain circumstances, they entail some small risk to the patient, involve discomfort and substantial cost, and place a strain on medical facilities. Therefore, they should be carried out only if the results can be expected to modify the patient’s management.
DISEASE PREVENTION AND MANAGEMENT
The prevention of heart disease, especially of CAD, is one of the most important tasks of primary care health givers as well as cardiologists. Prevention begins with risk assessment, followed by attention to lifestyle, such as achieving optimal weight, physical activity, and smoking cessation, and then aggressive treatment of all abnormal risk factors, such as hypertension, hyperlipidemia, and diabetes mellitus (Chap. 417).
After a complete diagnosis has been established in patients with known heart disease, a number of management options are usually available. Several examples may be used to demonstrate some of the principles of cardiovascular therapeutics:
1. In the absence of evidence of heart disease, the patient should be clearly informed of this assessment and not be asked to return at intervals for repeated examinations. If there is no evidence of disease, such continued attention may lead to the patient’s developing inappropriate concern about the possibility of heart disease.
2. If there is no evidence of cardiovascular disease but the patient has one or more risk factors for the development of ischemic heart disease (Chap. 293), a plan for their reduction should be developed and the patient should be retested at intervals to assess compliance and efficacy in risk reduction.
3. Asymptomatic or mildly symptomatic patients with valvular heart disease that is anatomically severe should be evaluated periodically, every 6 to 12 months, by clinical and noninvasive examinations. Early signs of deterioration of ventricular function may signify the need for surgical treatment before the development of disabling symptoms, irreversible myocardial damage, and excessive risk of surgical treatment (Chap. 283).
4. In patients with CAD (Chap. 293), available practice guidelines should be considered in the decision on the form of treatment (medical, percutaneous coronary intervention, or surgical revascularization). Mechanical revascularization may be employed too frequently in the United States and too infrequently in Eastern Europe and developing nations. The mere presence of angina pectoris and/or the demonstration of critical coronary arterial narrowing at angiography should not reflexively evoke a decision to treat the patient by revascularization. Instead, these interventions should be limited to patients with CAD whose angina has not responded adequately to medical treatment or in whom revascularization has been shown to improve the natural history (e.g., acute coronary syndrome or multivessel CAD with left ventricular dysfunction).
265e |
Basic Biology of the Cardiovascular System |
THE BLOOD VESSEL
VASCULAR ULTRASTRUCTURE
Blood vessels participate in homeostasis on a moment-to-moment basis and contribute to the pathophysiology of diseases of virtually every organ system. Hence, an understanding of the fundamentals of vascular biology furnishes a foundation for understanding the normal function of all organ systems and many diseases. The smallest blood vessels—capillaries—consist of a monolayer of endothelial cells apposed to a basement membrane, adjacent to occasional smooth-muscle-like cells known as pericytes (Fig. 265e-1A). Unlike larger vessels, pericytes do not invest the entire microvessel to form a continuous sheath. Arteries typically have a trilaminar structure (Fig. 265e-1B–E). The intima consists of a monolayer of endothelial cells continuous with those of the capillaries. The middle layer, or tunica media, consists of layers of smooth-muscle cells; in veins, the media can contain just a few layers of smooth-muscle cells (Fig. 265e-1B). The outer layer, the adventitia, consists of looser extracellular matrix with occasional fibroblasts, mast cells, and nerve terminals. Larger arteries have their own vasculature, the vasa vasorum, which nourishes the outer aspects of the tunica media. The adventitia of many veins surpasses the intima in thickness.
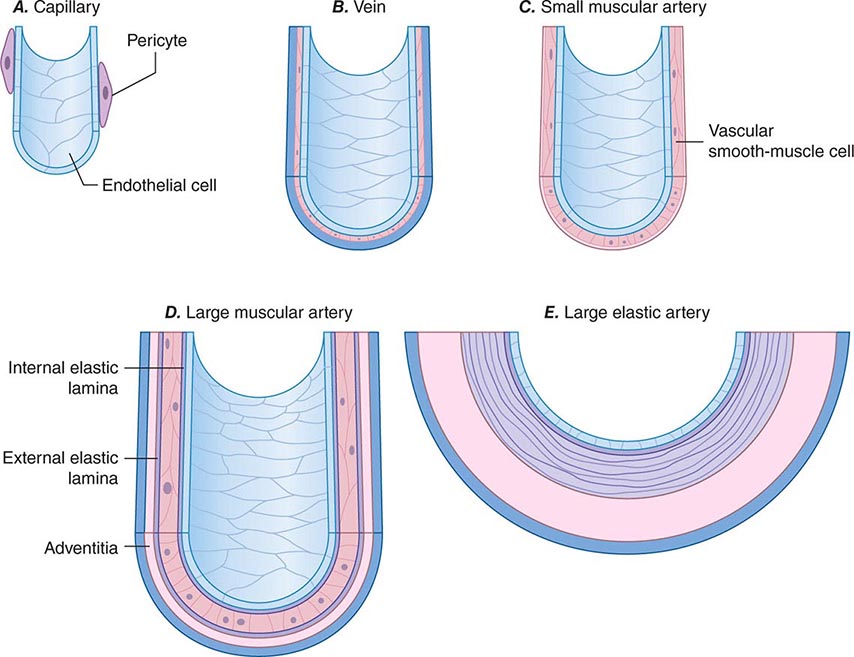
FIGURE 265e-1 Schematics of the structures of various types of blood vessels. A. Capillaries consist of an endothelial tube in contact with a discontinuous population of pericytes. B. Veins typically have thin medias and thicker adventitias. C. A small muscular artery features a prominent tunica media. D. Larger muscular arteries have a prominent media with smooth-muscle cells embedded in a complex extracellular matrix. E. Larger elastic arteries have cylindrical layers of elastic tissue alternating with concentric rings of smooth-muscle cells.
The tone of muscular arterioles regulates blood pressure and flow through various arterial beds. These smaller arteries have a relatively thick tunica media in relation to the adventitia (Fig. 265e-1C). Medium-size muscular arteries similarly contain a prominent tunica media (Fig. 265e-1D); atherosclerosis commonly affects this type of muscular artery. The larger elastic arteries have a much more structured tunica media consisting of concentric bands of smooth-muscle cells, interspersed with strata of elastin-rich extracellular matrix sandwiched between layers of smooth-muscle cells (Fig. 265e-1E). Larger arteries have a clearly demarcated internal elastic lamina that forms the barrier between the intima and the media. An external elastic lamina demarcates the media of arteries from the surrounding adventitia.
ORIGIN OF VASCULAR CELLS
The intima in human arteries often contains occasional resident smooth-muscle cells beneath the monolayer of vascular endothelial cells. The embryonic origin of smooth-muscle cells in various types of artery differs. Some upper-body arterial smooth-muscle cells derive from the neural crest, whereas lower-body arteries generally recruit smooth-muscle cells from neighboring mesodermal structures during development. Derivatives of the proepicardial organ, which gives rise to the epicardial layer of the heart, contribute to the vascular smooth-muscle cells of the coronary arteries. Bone marrow–derived endothelial progenitors may aid repair of damaged or aging arteries. In addition, multipotent vascular stem cells resident in vessel walls may give rise to the smooth-muscle cells that accumulate in injured or atheromatous arteries (Chaps. 88, 89e, and 90e).
VASCULAR CELL BIOLOGY
Endothelial Cell The key cell of the vascular intima, the endothelial cell, has manifold functions in health and disease. The endothelium forms the interface between tissues and the blood compartment. It therefore must regulate the entry of molecules and cells into tissues in a selective manner. The ability of endothelial cells to serve as a selectively permeable barrier fails in many vascular disorders, including atherosclerosis, hypertension, and renal disease. This dysregulation of permeability also occurs in pulmonary edema and other situations of “capillary leak.”
The endothelium also participates in the local regulation of blood flow and vascular caliber. Endogenous substances produced by endothelial cells such as prostacyclin, endothelium-derived hyperpolarizing factor, nitric oxide (NO), and hydrogen peroxide (H2O2) provide tonic vasodilatory stimuli under physiologic conditions in vivo (Table 265e-1). Impaired production or excess catabolism of NO impairs this endothelium-dependent vasodilator function and may contribute to excessive vasoconstriction in various pathologic situations. Measurement of flow-mediated dilatation can assess endothelial vasodilator function in humans (Fig. 265e-2). By contrast, endothelial cells also produce potent vasoconstrictor substances such as endothelin in a regulated fashion. Excessive production of reactive oxygen species, such as superoxide anion (O2–), by endothelial or smooth-muscle cells under pathologic conditions (e.g., excessive exposure to angiotensin II), can promote local oxidative stress and inactivate NO.
|
ENDOTHELIAL FUNCTIONS IN HEALTH AND DISEASE |
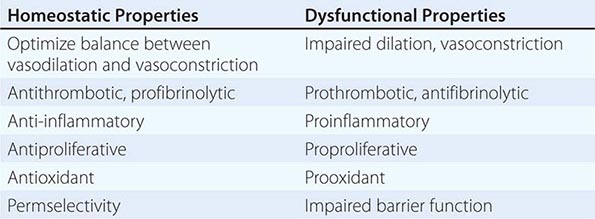
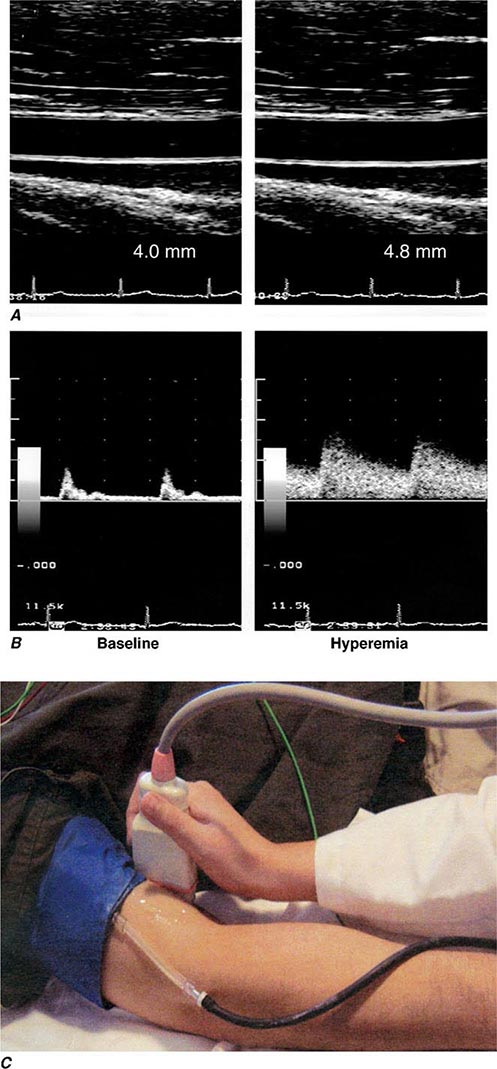
FIGURE 265e-2 Assessment of endothelial function in vivo using blood pressure cuff occlusion and release. Upon deflation of the cuff, an ultrasound probe monitors changes in diameter (A) and blood flow (B) of the brachial artery (C). (Reproduced with permission of J. Vita, MD.)
The endothelial monolayer contributes critically to inflammatory processes involved in normal host defenses and pathologic states. The normal endothelium resists prolonged contact with blood leukocytes; however, when activated by bacterial products such as endotoxin or by proinflammatory cytokines released during infection or injury, endothelial cells express an array of leukocyte adhesion molecules that bind various classes of leukocytes. The endothelial cells appear to recruit selectively different classes of leukocytes in different pathologic conditions. The gamut of adhesion molecules and chemokines generated during acute bacterial infection tends to recruit granulocytes. In chronic inflammatory diseases such as tuberculosis and atherosclerosis, endothelial cells express adhesion molecules that favor the recruitment of mononuclear leukocytes that characteristically accumulate in these conditions.
The endothelium also dynamically regulates thrombosis and hemostasis. NO, in addition to its vasodilatory properties, can limit platelet activation and aggregation. Like NO, prostacyclin produced by endothelial cells under normal conditions not only provides a vasodilatory stimulus but also antagonizes platelet activation and aggregation. Thrombomodulin expressed on the surface of endothelial cells binds thrombin at low concentrations and inhibits coagulation through activation of the protein C pathway, inactivating clotting factors Va and VIIIa and thus combating thrombus formation. The surface of endothelial cells contains heparan sulfate glycosaminoglycans that furnish an endogenous antithrombotic coating to the vasculature. Endothelial cells also participate actively in fibrinolysis and its regulation. They express receptors for plasminogen and plasminogen activators and produce tissue-type plasminogen activator. Through local generation of plasmin, the normal endothelial monolayer can promote the lysis of nascent thrombi.
When activated by inflammatory cytokines, bacterial endotoxin, or angiotensin II, for example, endothelial cells can produce substantial quantities of the major inhibitor of fibrinolysis, plasminogen activator inhibitor 1 (PAI-1). Thus, in pathologic circumstances, the endothelial cell may promote local thrombus accumulation rather than combat it. Inflammatory stimuli also induce the expression of the potent procoagulant tissue factor, a contributor to disseminated intravascular coagulation in sepsis.
Endothelial cells also participate in the pathophysiology of a number of immune-mediated diseases. Lysis of endothelial cells mediated by complement provides an example of immunologically mediated tissue injury. The presentation of foreign histocompatibility complex antigens by endothelial cells in solid-organ allografts can promote allograft arteriopathy. In addition, immune-mediated endothelial injury may contribute in some patients with thrombotic thrombocytopenic purpura and patients with hemolytic-uremic syndrome. Thus, in addition to the involvement of innate immune responses, endothelial cells participate actively in both humoral and cellular limbs of the immune response.
Endothelial cells regulate growth of subjacent smooth-muscle cells. Heparan sulfate glycosaminoglycans elaborated by endothelial cells can inhibit smooth-muscle proliferation. In contrast, when exposed to various injurious stimuli, endothelial cells can elaborate growth factors and chemoattractants, such as platelet-derived growth factor, that can promote the migration and proliferation of vascular smooth-muscle cells. Dysregulated elaboration of these growth-stimulatory molecules may promote smooth-muscle accumulation in atherosclerotic lesions.
Vascular Smooth-Muscle Cell The vascular smooth-muscle cell, the major cell type of the media layer of blood vessels, also contributes actively to vascular pathobiology. Contraction and relaxation of smooth-muscle cells at the level of the muscular arteries controls blood pressure and, hence, regional blood flow and the afterload experienced by the left ventricle (see below). The vasomotor tone of veins, which is governed by smooth-muscle cell tone, regulates the capacitance of the venous tree and influences the preload experienced by both ventricles. Smooth-muscle cells in the adult vessel seldom replicate in the absence of arterial injury or inflammatory activation. Proliferation and migration of arterial smooth-muscle cells, associated with functional modulation characterized by lower content of contractile proteins and greater production of extracellular matrix macromolecules, can contribute to the development of arterial stenoses in atherosclerosis, arteriolar remodeling that can sustain and propagate hypertension, and the hyperplastic response of arteries injured by percutaneous intervention. In the pulmonary circulation, smooth-muscle migration and proliferation contribute decisively to the pulmonary vascular disease that gradually occurs in response to sustained high-flow states such as left-to-right shunts. Such pulmonary vascular disease provides a major obstacle to the management of many patients with adult congenital heart disease. Among other mediators, microRNAs have emerged as powerful regulators of this transition, offering new targets for intervention.
Smooth-muscle cells secrete the bulk of vascular extracellular matrix. Excessive production of collagen and glycosaminoglycans contributes to the remodeling and altered functions and biomechanics of arteries affected by hypertension or atherosclerosis. In larger elastic arteries, the elastin synthesized by smooth-muscle cells serves to maintain not only normal arterial structure, but also hemodynamic function. The ability of the larger arteries, such as the aorta, to store the kinetic energy of systole promotes tissue perfusion during diastole. Arterial stiffness associated with aging or disease, as manifested by a widening pulse pressure, increases left ventricular afterload and portends a poor outcome.
Like endothelial cells, vascular smooth-muscle cells do not merely respond to vasomotor or inflammatory stimuli elaborated by other cell types but can themselves serve as a source of such stimuli. For example, when exposed to bacterial endotoxin or other proinflammatory stimuli, smooth-muscle cells can elaborate cytokines and other inflammatory mediators. Like endothelial cells, upon inflammatory activation, arterial smooth-muscle cells can produce prothrombotic mediators such as tissue factor, the antifibrinolytic protein PAI-1, and other molecules that modulate thrombosis and fibrinolysis. Smooth-muscle cells also elaborate autocrine growth factors that can amplify hyperplastic responses to arterial injury.
Vascular Smooth-Muscle Cell Function Vascular smooth-muscle cells govern vessel tone. Those cells contract when stimulated by a rise in intracellular calcium concentration by calcium influx through the plasma membrane and by calcium release from intracellular stores (Fig. 265e-3). In vascular smooth-muscle cells, voltage-dependent L-type calcium channels open with membrane depolarization, which is regulated by energy-dependent ion pumps such as the Na+,K+-ATPase pump and ion channels such as the Ca2+-sensitive K+ channel. Local changes in intracellular calcium concentration, termed calcium sparks, result from the influx of calcium through the voltage-dependent calcium channel and are caused by the coordinated activation of a cluster of ryanodine-sensitive calcium release channels in the sarcoplasmic reticulum (see below). Calcium sparks directly augment intracellular calcium concentration and indirectly increase intracellular calcium concentration by activating chloride channels. In addition, calcium sparks reduce smooth-muscle contractility by activating large-conductance calcium-sensitive K+ channels, hyperpolarizing the cell membrane and thereby limiting further voltage-dependent increases in intracellular calcium.
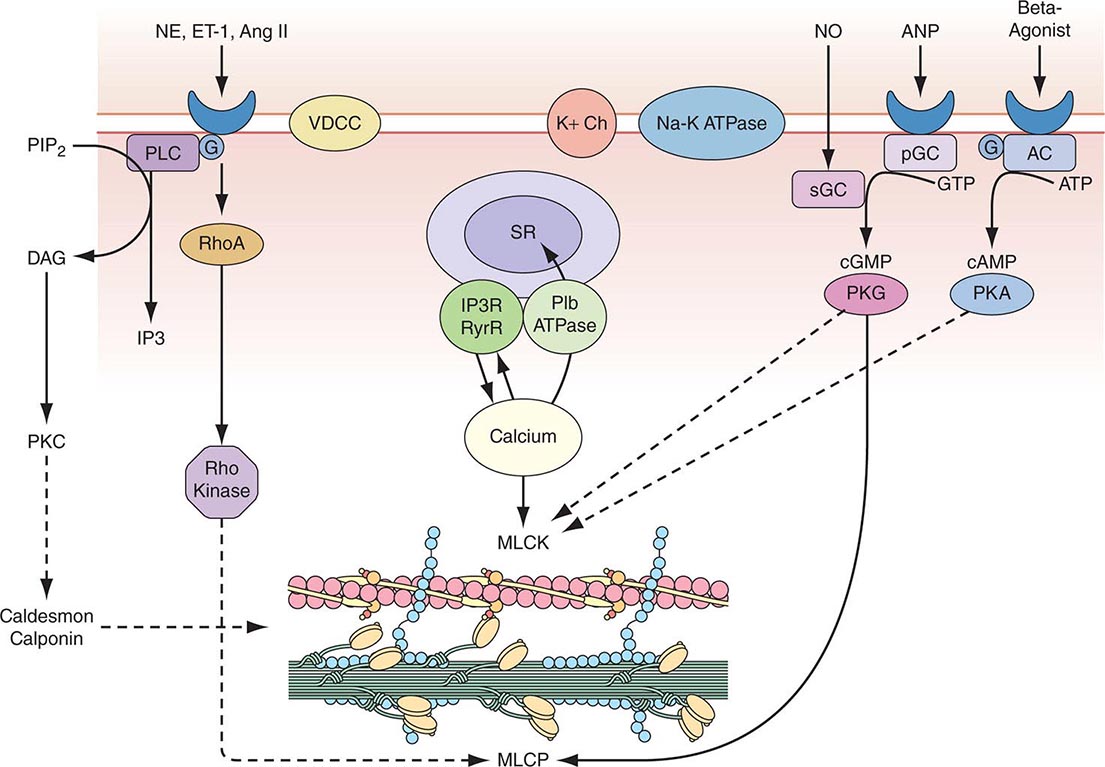
FIGURE 265e-3 Regulation of vascular smooth-muscle cell calcium concentration and actomyosin ATPase-dependent contraction. AC, adenylyl cyclase; Ang II, angiotensin II; ANP, atrial natriuretic peptide; DAG, diacylglycerol; ET-1, endothelin-1; G, G protein; IP3, inositol 1,4,5-trisphosphate; MLCK, myosin light chain kinase; MLCP, myosin light chain phosphatase; NE, norepinephrine; NO, nitric oxide; pGC, particular guanylyl cyclase; PIP2, phosphatidylinositol 4,5-bisphosphate; PKA, protein kinase A; PKC, protein kinase C; PKG, protein kinase G; PLC, phospholipase C; sGC, soluble guanylyl cyclase; SR, sarcoplasmic reticulum; VDCC, voltage-dependent calcium channel. (Modified from B Berk, in Vascular Medicine, 3rd ed. Philadelphia, Saunders, Elsevier, 2006, p. 23; with permission.)
Biochemical agonists also increase intracellular calcium concentration, in this case by receptor-dependent activation of phospholipase C with hydrolysis of phosphatidylinositol 4,5-bisphosphate, resulting in the generation of diacylglycerol (DAG) and inositol 1,4,5-trisphosphate (IP3). These membrane lipid derivatives in turn activate protein kinase C and increase intracellular calcium concentration. In addition, IP3 binds to specific receptors on the sarcoplasmic reticulum membrane to increase calcium efflux from this calcium storage pool into the cytoplasm.
Vascular smooth-muscle cell contraction depends principally on the phosphorylation of myosin light chain, which in the steady state, reflects the balance between the actions of myosin light chain kinase and myosin light chain phosphatase. Calcium activates myosin light chain kinase through the formation of a calcium-calmodulin complex. Phosphorylation of myosin light chain by this kinase augments myosin ATPase activity and enhances contraction. Myosin light chain phosphatase dephosphorylates myosin light chain, reducing myosin ATPase activity and contractile force. Phosphorylation of the myosin-binding subunit (thr695) of myosin light chain phosphatase by Rho kinase inhibits phosphatase activity and induces calcium sensitization of the contractile apparatus. Rho kinase is itself activated by the small GTPase RhoA, which is stimulated by guanosine exchange factors and inhibited by GTPase-activating proteins.
Both cyclic AMP and cyclic GMP relax vascular smooth-muscle cells through complex mechanisms. β agonists, acting through their G-protein-coupled receptors activate adenylyl cyclase to convert ATP to cyclic AMP; NO and atrial natriuretic peptide acting directly and via a G-protein-coupled receptor, respectively, activate guanylyl cyclase to convert GTP to cyclic GMP. These agents in turn activate protein kinase A and protein kinase G, respectively, which inactivate myosin light chain kinase and decrease vascular smooth-muscle cell tone. In addition, protein kinase G can interact directly with the myosin-binding substrate subunit of myosin light chain phosphatase, increasing phosphatase activity and decreasing vascular tone. Finally, several mechanisms drive NO-dependent, protein kinase G–mediated reductions in vascular smooth-muscle cell calcium concentration, including phosphorylation-dependent inactivation of RhoA; decreased IP3 formation; phosphorylation of the IP3 receptor–associated cyclic GMP kinase substrate, with subsequent inhibition of IP3 receptor function; phosphorylation of phospholamban, which increases calcium ATPase activity and sequestration of calcium in the sarcoplasmic reticulum; and protein kinase G–dependent stimulation of plasma membrane calcium ATPase activity, perhaps by activation of the Na+,K+-ATPase pump or hyperpolarization of the cell membrane by activation of calcium-dependent K+ channels.
Control of Vascular Smooth-Muscle Cell Tone The autonomic nervous system and endothelial cells modulate vascular smooth-muscle cells in a tightly regulated manner. Autonomic neurons enter the blood vessel medial layer from the adventitia and modulate vascular smooth-muscle cell tone in response to baroreceptors and chemoreceptors within the aortic arch and carotid bodies and in response to thermoreceptors in the skin. These regulatory components include rapidly acting reflex arcs modulated by central inputs that respond to sensory inputs (olfactory, visual, auditory, and tactile) as well as emotional stimuli. Three classes of nerves mediate autonomic regulation of vascular tone: sympathetic, whose principal neurotransmitters are epinephrine and norepinephrine; parasympathetic, whose principal neurotransmitter is acetylcholine; and nonadrenergic/noncholinergic, which include two subgroups—nitrergic, whose principal neurotransmitter is NO, and peptidergic, whose principal neurotransmitters are substance P, vasoactive intestinal peptide, calcitonin gene-related peptide, and ATP.
Each of these neurotransmitters acts through specific receptors on the vascular smooth-muscle cell to modulate intracellular calcium and, consequently, contractile tone. Norepinephrine activates α receptors, and epinephrine activates α and β receptors (adrenergic receptors); in most blood vessels, norepinephrine activates postjunctional α1 receptors in large arteries and α2 receptors in small arteries and arterioles, leading to vasoconstriction. Most blood vessels express β2-adrenergic receptors on their vascular smooth-muscle cells and respond to β agonists by cyclic AMP–dependent relaxation. Acetylcholine released from parasympathetic neurons binds to muscarinic receptors (of which there are five subtypes, M1–5) on vascular smooth-muscle cells to yield vasorelaxation. In addition, NO stimulates presynaptic neurons to release acetylcholine, which can stimulate the release of NO from the endothelium. Nitrergic neurons release NO produced by neuronal NO synthase, which causes vascular smooth-muscle cell relaxation via the cyclic GMP–dependent and –independent mechanisms described above. The peptidergic neurotransmitters all potently vasodilate, acting either directly or through endothelium-dependent NO release to decrease vascular smooth-muscle cell tone. For the detailed molecular physiology of the autonomic nervous system, see Chap. 454.
The endothelium modulates vascular smooth-muscle tone by the direct release of several effectors, including NO, prostacyclin, hydrogen sulfide, and endothelium-derived hyperpolarizing factor, all of which cause vasorelaxation, and endothelin, which causes vasoconstriction. The release of these endothelial effectors of vascular smooth-muscle cell tone is stimulated by mechanical (shear stress, cyclic strain, etc.) and biochemical mediators (purinergic agonists, muscarinic agonists, peptidergic agonists), with the biochemical mediators acting through endothelial receptors specific to each class. In addition to these local paracrine modulators of vascular smooth-muscle cell tone, circulating mediators can affect tone, including norepinephrine and epinephrine, vasopressin, angiotensin II, bradykinin, and the natriuretic peptides (atrial natriuretic peptide [ANP], brain natriuretic peptide [BNP], C-type natriuretic peptide [CNP], and dendroaspis natriuretic peptide [DNP]), as discussed above.
VASCULAR REGENERATION
Growth of new blood vessels can occur in response to conditions such as chronic hypoxemia and tissue ischemia. Growth factors, including vascular endothelial growth factor (VEGF) and forms of fibroblast growth factor (FGF), activate a signaling cascade that stimulates endothelial proliferation and tube formation, defined as angiogenesis. Guidance molecules, including members of the semaphorin family of secreted peptides, direct blood vessel patterning by attracting or repelling nascent endothelial tubes. The development of collateral vascular networks in the ischemic myocardium, an example of angiogenesis, can result from selective activation of endothelial progenitor cells, which may reside in the blood vessel wall or home to the ischemic tissue from the bone marrow. True arteriogenesis, or the development of a new blood vessel that includes all three cell layers, normally does not occur in the cardiovascular system of adult mammals. The molecular mechanisms and progenitor cells that can recapitulate blood vessel development de novo are under rapidly advancing study (Chaps. 88, 89e, and 90e).
VASCULAR PHARMACOGENOMICS
The last decade has witnessed considerable progress in efforts to define the genetic differences underlying individual variations in vascular pharmacologic responses. Many investigators have focused on receptors and enzymes associated with neurohumoral modulation of vascular function as well as hepatic enzymes that metabolize drugs that affect vascular tone. The genetic polymorphisms thus far associated with differences in vascular response often (but not invariably) relate to functional differences in the activity or expression of the receptor or enzyme of interest. Some of these polymorphisms appear to have different allele frequencies in specific ethnic groups.
CELLULAR BASIS OF CARDIAC CONTRACTION
CARDIAC ULTRASTRUCTURE
About three-fourths of the ventricular mass is composed of cardiomyocytes, normally 60–140 μm in length and 17–25 μm in diameter (Fig. 265e-4A). Each cell contains multiple, rodlike cross-banded strands (myofibrils) that run the length of the cell and are composed of serially repeating structures, the sarcomeres. The cytoplasm between the myofibrils contains other cell constituents, including the single centrally located nucleus, numerous mitochondria, and the intracellular membrane system, the sarcoplasmic reticulum.
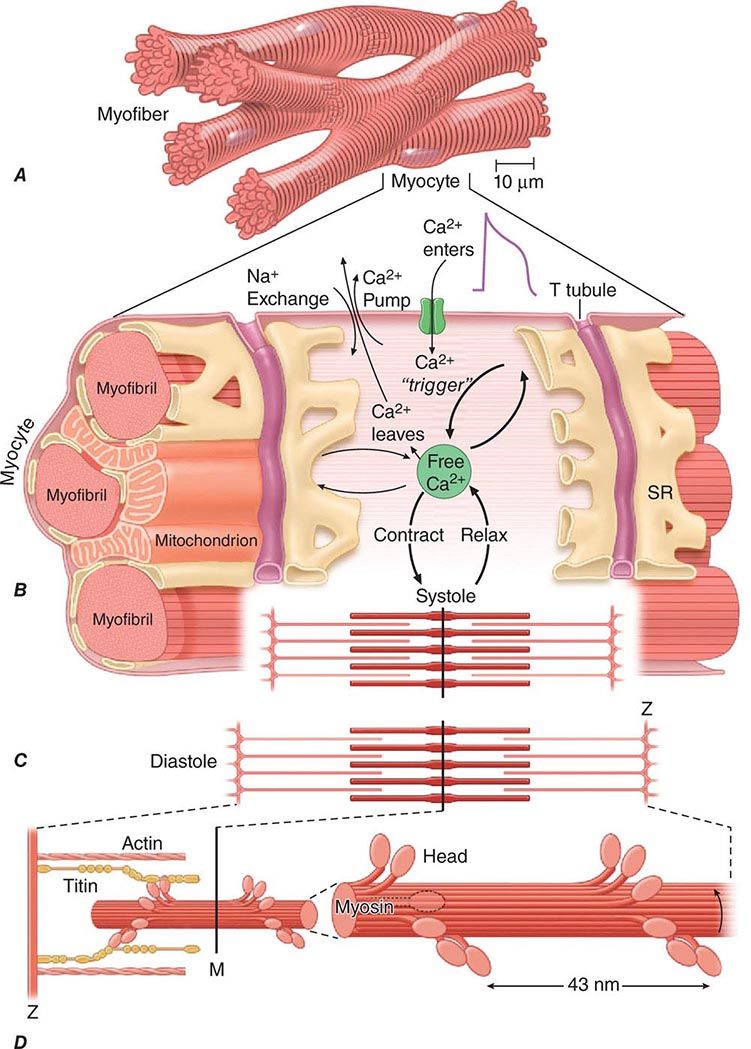
FIGURE 265e-4 A shows the branching myocytes making up the cardiac myofibers. B illustrates the critical role played by the changing [Ca2+] in the myocardial cytosol. Ca2+ ions are schematically shown as entering through the calcium channel that opens in response to the wave of depolarization that travels along the sarcolemma. These Ca2+ ions “trigger” the release of more calcium from the sarcoplasmic reticulum (SR) and thereby initiate a contraction-relaxation cycle. Eventually the small quantity of Ca2+ that has entered the cell leaves predominantly through an Na+/Ca2+ exchanger, with a lesser role for the sarcolemmal Ca2+ pump. The varying actin-myosin overlap is shown for (B) systole, when [Ca2+] is maximal, and (C) diastole, when [Ca2+] is minimal. D. The myosin heads, attached to the thick filaments, interact with the thin actin filaments. (From LH Opie: Heart Physiology: From Cell to Circulation, 4th ed. Philadelphia, Lippincott, Williams & Wilkins, 2004. Reprinted with permission. Copyright LH Opie, 2004.)
The sarcomere, the structural and functional unit of contraction, lies between adjacent Z lines, which are dark repeating bands that are apparent on transmission electron microscopy. The distance between Z lines varies with the degree of contraction or stretch of the muscle and ranges between 1.6 and 2.2 μm. Within the confines of the sarcomere are alternating light and dark bands, giving the myocardial fibers their striated appearance under the light microscope. At the center of the sarcomere is a dark band of constant length (1.5 μm), the A band, which is flanked by two lighter bands, the I bands, which are of variable length. The sarcomere of heart muscle, like that of skeletal muscle, consists of two sets of interdigitating myofilaments. Thicker filaments, composed principally of the protein myosin, traverse the A band; they are about 10 nm (100 Å) in diameter, with tapered ends. Thinner filaments, composed primarily of actin, course from the Z lines through the I band into the A band; they are approximately 5 nm (50 Å) in diameter and 1.0 μm in length. Thus, thick and thin filaments overlap only within the (dark) A band, whereas the (light) I band contains only thin filaments. On electron-microscopic examination, bridges may be seen to extend between the thick and thin filaments within the A band; these are myosin heads (see below) bound to actin filaments.
THE CONTRACTILE PROCESS
The sliding filament model for muscle contraction rests on the fundamental observation that both the thick and the thin filaments are constant in overall length during both contraction and relaxation. With activation, the actin filaments are propelled farther into the A band. In the process, the A band remains constant in length, whereas the I band shortens and the Z lines move toward one another.
The myosin molecule is a complex, asymmetric fibrous protein with a molecular mass of about 500,000 Da; it has a rodlike portion that is about 150 nm (1500 Å) in length with a globular portion (head) at its end. These globular portions of myosin form the bridges between the myosin and actin molecules and are the site of ATPase activity. In forming the thick myofilament, which is composed of ~300 longitudinally stacked myosin molecules, the rodlike segments of the myosin molecules are laid down in an orderly, polarized manner, leaving the globular portions projecting outward so that they can interact with actin to generate force and shortening (Fig. 265e-4B).
Actin has a molecular mass of about 47,000 Da. The thin filament consists of a double helix of two chains of actin molecules wound about each other on a larger molecule, tropomyosin. A group of regulatory proteins—troponins C, I, and T—are spaced at regular intervals on this filament (Fig. 265e-5). In contrast to myosin, actin lacks intrinsic enzymatic activity but does combine reversibly with myosin in the presence of ATP and Ca2+. The calcium ion activates the myosin ATPase, which in turn breaks down ATP, the energy source for contraction (Fig. 265e-5). The activity of myosin ATPase determines the rate of forming and breaking of the actomyosin cross-bridges and ultimately the velocity of muscle contraction. In relaxed muscle, tropomyosin inhibits this interaction. Titin (Fig. 265e-4D) is a large, flexible, myofibrillar protein that connects myosin to the Z line; its stretching contributes to the elasticity of the heart. Dystrophin is a long cytoskeletal protein that has an amino-terminal actin-binding domain and a carboxy-terminal domain that binds to the dystroglycan complex at adherens junctions on the cell membrane, thus tethering the sarcomere to the cell membrane at regions tightly coupled to adjacent contracting myocytes. Mutations in components of the dystrophin complex lead to muscular dystrophy and associated cardiomyopathy.
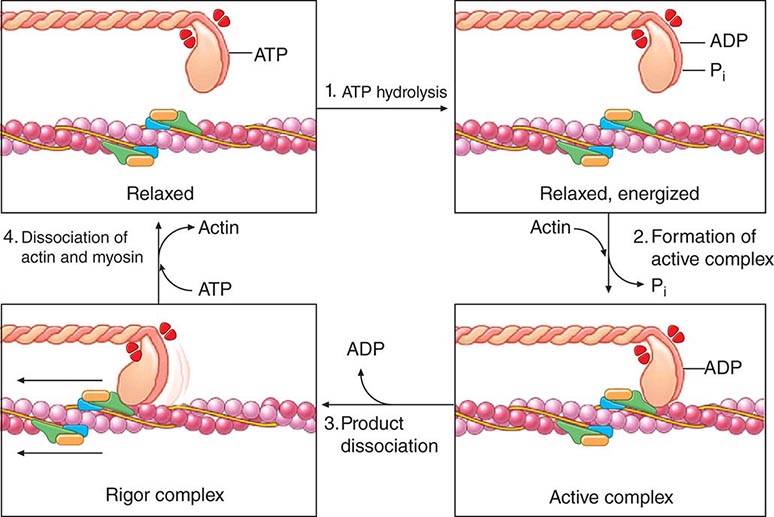
FIGURE 265e-5 Four steps in cardiac muscle contraction and relaxation. In relaxed muscle (upper left), ATP bound to the myosin cross-bridge dissociates the thick and thin filaments. Step 1: Hydrolysis of myosin-bound ATP by the ATPase site on the myosin head transfers the chemical energy of the nucleotide to the activated cross-bridge (upper right). When cytosolic Ca2+ concentration is low, as in relaxed muscle, the reaction cannot proceed because tropomyosin and the troponin complex on the thin filament do not allow the active sites on actin to interact with the cross-bridges. Therefore, even though the cross-bridges are energized, they cannot interact with actin. Step 2: When Ca2+ binding to troponin C has exposed active sites on the thin filament, actin interacts with the myosin cross-bridges to form an active complex (lower right) in which the energy derived from ATP is retained in the actin-bound cross-bridge, whose orientation has not yet shifted. Step 3: The muscle contracts when ADP dissociates from the cross-bridge. This step leads to the formation of the low-energy rigor complex (lower left) in which the chemical energy derived from ATP hydrolysis has been expended to perform mechanical work (the “rowing” motion of the cross-bridge). Step 4: The muscle returns to its resting state, and the cycle ends when a new molecule of ATP binds to the rigor complex and dissociates the cross-bridge from the thin filament. This cycle continues until calcium is dissociated from troponin C in the thin filament, which causes the contractile proteins to return to the resting state with the cross-bridge in the energized state. ADP, adenosine diphosphate; ATP, adenosine triphosphate; ATPase, adenosine triphosphatase. (From AM Katz: Heart failure: Cardiac function and dysfunction, in Atlas of Heart Diseases, 3rd ed, WS Colucci [ed]. Philadelphia, Current Medicine, 2002. Reprinted with permission.)
During activation of the cardiac myocyte, Ca2+ becomes attached to one of three components of the heterotrimer troponin C, which results in a conformational change in the regulatory protein tropomyosin; the latter, in turn, exposes the actin cross-bridge interaction sites (Fig. 265e-5). Repetitive interaction between myosin heads and actin filaments is termed cross-bridge cycling, which results in sliding of the actin along the myosin filaments, ultimately causing muscle shortening and/or the development of tension. The splitting of ATP then dissociates the myosin cross-bridge from actin. In the presence of ATP (Fig. 265e-5), linkages between actin and myosin filaments are made and broken cyclically as long as sufficient Ca2+ is present; these linkages cease when [Ca2+] falls below a critical level, and the troponin-tropomyosin complex once more prevents interactions between the myosin cross-bridges and actin filaments (Fig. 265e-6).
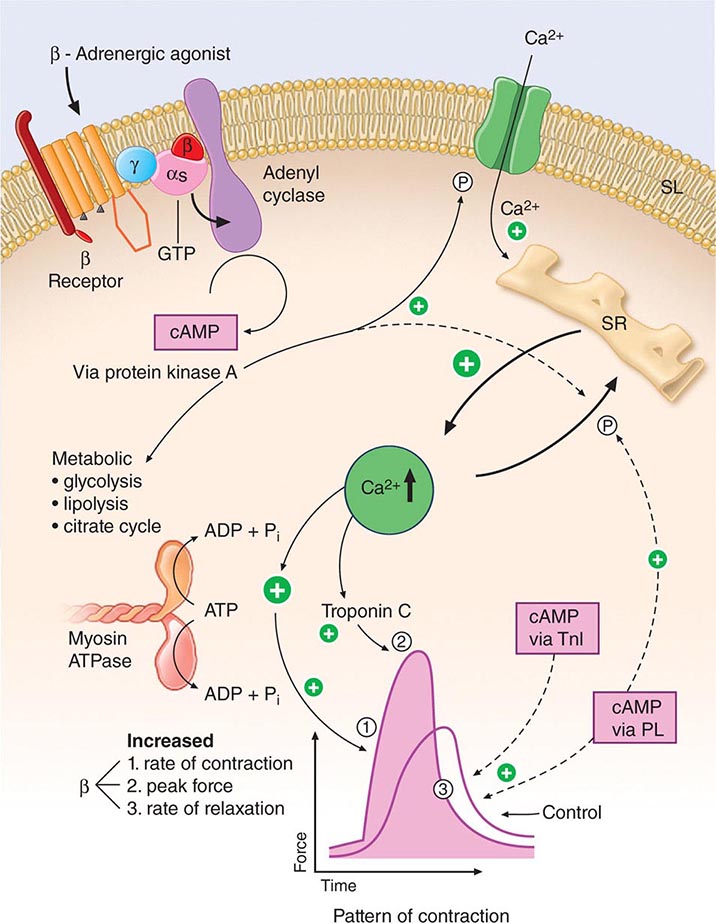
FIGURE 265e-6 Signal systems involved in positive inotropic and lusitropic (enhanced relaxation) effects of β-adrenergic stimulation. When the β-adrenergic agonist interacts with the β receptor, a series of G protein–mediated changes leads to activation of adenylyl cyclase and the formation of cyclic adenosine monophosphate (cAMP). The latter acts via protein kinase A to stimulate metabolism (left) and phosphorylate the Ca2+ channel protein (right). The result is an enhanced opening probability of the Ca2+ channel, thereby increasing the inward movement of Ca2+ ions through the sarcolemma (SL) of the T tubule. These Ca2+ ions release more calcium from the sarcoplasmic reticulum (SR) to increase cytosolic Ca2+ and activate troponin C. Ca2+ ions also increase the rate of breakdown of adenosine triphosphate (ATP) to adenosine diphosphate (ADP) and inorganic phosphate (Pi). Enhanced myosin ATPase activity explains the increased rate of contraction, with increased activation of troponin C explaining increased peak force development. An increased rate of relaxation results from the ability of cAMP to activate as well the protein phospholamban, situated on the membrane of the SR, that controls the rate of uptake of calcium into the SR. The latter effect explains enhanced relaxation (lusitropic effect). P, phosphorylation; PL, phospholamban; TnI, troponin I. (Modified from LH Opie: Heart Physiology: From Cell to Circulation, 4th ed. Philadelphia, Lippincott, Williams & Wilkins, 2004. Reprinted with permission. Copyright LH Opie, 2004.)
Intracytoplasmic Ca2+ is a principal determinant of the inotropic state of the heart. Most agents that stimulate myocardial contractility (positive inotropic stimuli), including the digitalis glycosides and β-adrenergic agonists, increase the [Ca2+] in the vicinity of the myofilaments, which in turn triggers cross-bridge cycling. Increased impulse traffic in the cardiac adrenergic nerves stimulates myocardial contractility as a consequence of the release of norepinephrine from cardiac adrenergic nerve endings. Norepinephrine activates myocardial β receptors and, through the Gs-stimulated guanine nucleotide-binding protein, activates the enzyme adenylyl cyclase, which leads to the formation of the intracellular second messenger cyclic AMP from ATP (Fig. 265e-6). Cyclic AMP in turn activates protein kinase A (PKA), which phosphorylates the Ca2+ channel in the myocardial sarcolemma, thereby enhancing the influx of Ca2+ into the myocyte. Other functions of PKA are discussed below.
The sarcoplasmic reticulum (SR) (Fig. 265e-7), a complex network of anastomosing intracellular channels, invests the myofibrils. Its longitudinally disposed tubules closely invest the surfaces of individual sarcomeres but have no direct continuity with the outside of the cell. However, closely related to the SR, both structurally and functionally, are the transverse tubules, or T system, formed by tubelike invaginations of the sarcolemma that extend into the myocardial fiber along the Z lines, i.e., the ends of the sarcomeres.
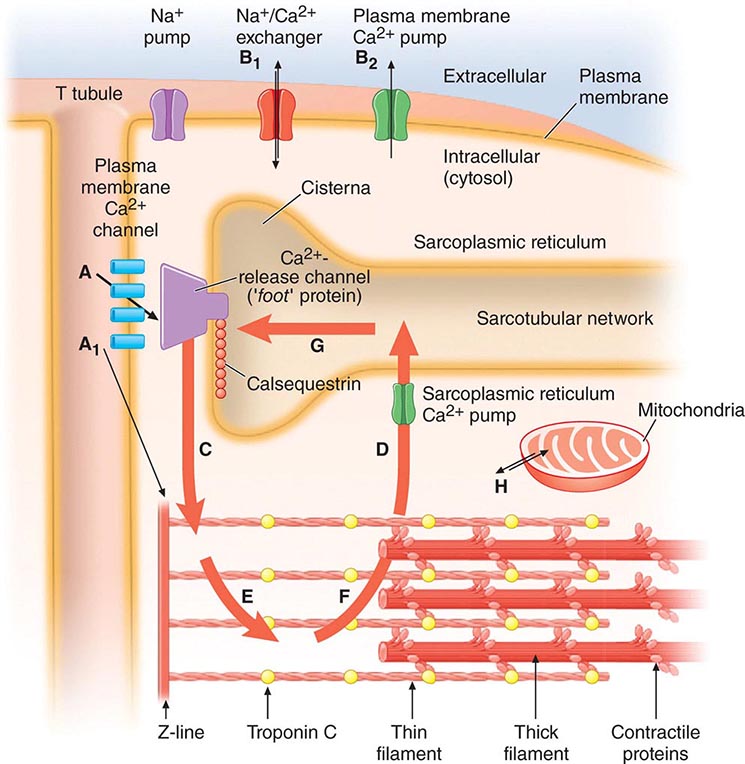
FIGURE 265e-7 The Ca2+ fluxes and key structures involved in cardiac excitation-contraction coupling. The arrows denote the direction of Ca2+ fluxes. The thickness of each arrow indicates the magnitude of the calcium flux. Two Ca2+ cycles regulate excitation-contraction coupling and relaxation. The larger cycle is entirely intracellular and involves Ca2+ fluxes into and out of the sarcoplasmic reticulum, as well as Ca2+ binding to and release from troponin C. The smaller extracellular Ca2+ cycle occurs when this cation moves into and out of the cell. The action potential opens plasma membrane Ca2+ channels to allow passive entry of Ca2+ into the cell from the extracellular fluid (arrow A). Only a small portion of the Ca2+ that enters the cell directly activates the contractile proteins (arrow A1). The extracellular cycle is completed when Ca2+ is actively transported back out to the extracellular fluid by way of two plasma membrane fluxes mediated by the sodium-calcium exchanger (arrow B1) and the plasma membrane calcium pump (arrow B2). In the intracellular Ca2+ cycle, passive Ca2+ release occurs through channels in the cisternae (arrow C) and initiates contraction; active Ca2+ uptake by the Ca2+ pump of the sarcotubular network (arrow D) relaxes the heart. Diffusion of Ca2+ within the sarcoplasmic reticulum (arrow G) returns this activator cation to the cisternae, where it is stored in a complex with calsequestrin and other calcium-binding proteins. Ca2+ released from the sarcoplasmic reticulum initiates systole when it binds to troponin C (arrow E). Lowering of cytosolic [Ca2+] by the sarcoplasmic reticulum (SR) causes this ion to dissociate from troponin (arrow F) and relaxes the heart. Ca2+ also may move between mitochondria and cytoplasm (H). (Adapted from AM Katz: Physiology of the Heart, 4th ed. Philadelphia, Lippincott, Williams & Wilkins, 2005, with permission.)
CARDIAC ACTIVATION
In the inactive state, the cardiac cell is electrically polarized; i.e., the interior has a negative charge relative to the outside of the cell, with a transmembrane potential of –80 to –100 mV (Chap. 273e). The sarcolemma, which in the resting state is largely impermeable to Na+, has a Na+– and K+-stimulating pump energized by ATP that extrudes Na+ from the cell; this pump plays a critical role in establishing the resting potential. Thus, intracellular [K+] is relatively high and [Na+] is far lower; conversely, extracellular [Na+] is high and [K+] is low. At the same time, in the resting state, extracellular [Ca2+] greatly exceeds free intracellular [Ca2+].
The action potential has four phases (see Fig. 273e-1B). During the plateau of the action potential (phase 2), there is a slow inward current through L-type Ca2+ channels in the sarcolemma (Fig. 265e-7). The depolarizing current not only extends across the surface of the cell but penetrates deeply into the cell by way of the ramifying T tubular system. The absolute quantity of Ca2+ that crosses the sarcolemma and the T system is relatively small and by itself appears to be insufficient to bring about full activation of the contractile apparatus. However, this Ca2+ current triggers the release of much larger quantities of Ca2+ from the SR, a process termed Ca2+-induced Ca2+ release. The latter is a major determinant of intracytoplasmic [Ca2+] and therefore of myocardial contractility.
Ca2+ is released from the SR through a Ca2+ release channel, a cardiac isoform of the ryanodine receptor (RyR2), which controls intracytoplasmic [Ca2+] and, as in vascular smooth-muscle cells, leads to the local changes in intracellular [Ca2+] called calcium sparks. A number of regulatory proteins, including calstabin 2, inhibit RyR2 and thereby the release of Ca2+ from the SR. PKA dissociates calstabin from the RyR2, enhancing Ca2+ release and thereby myocardial contractility. Excessive plasma catecholamine levels and cardiac sympathetic neuronal release of norepinephrine cause hyperphosphorylation of PKA, leading to calstabin 2–depleted RyR2. The latter depletes SR Ca2+ stores and thereby impairs cardiac contraction, leading to heart failure, and also triggers ventricular arrhythmias.
The Ca2+ released from the SR then diffuses toward the myofibrils, where, as already described, it combines with troponin C (Fig. 265e-6). By repressing this inhibitor of contraction, Ca2+ activates the myofilaments to shorten. During repolarization, the activity of the Ca2+ pump in the SR, the SR Ca2+ ATPase (SERCA2A), reaccumulates Ca2+ against a concentration gradient, and the Ca2+ is stored in the SR by its attachment to a protein, calsequestrin. This reaccumulation of Ca2+ is an energy (ATP)-requiring process that lowers the cytoplasmic [Ca2+] to a level that inhibits the actomyosin interaction responsible for contraction, and in this manner leads to myocardial relaxation. Also, there is an exchange of Ca2+ for Na+ at the sarcolemma (Fig. 265e-7), reducing the cytoplasmic [Ca2+]. Cyclic AMP–dependent PKA phosphorylates the SR protein phospholamban; the latter, in turn, permits activation of the Ca2+ pump, thereby increasing the uptake of Ca2+ by the SR, accelerating the rate of relaxation, and providing larger quantities of Ca2+ in the SR for release by subsequent depolarization, thereby stimulating contraction.
Thus, the combination of the cell membrane, transverse tubules, and SR, with their ability to transmit the action potential and release and then reaccumulate Ca2+, plays a fundamental role in the rhythmic contraction and relaxation of heart muscle. Genetic or pharmacologic alterations of any component, whatever its etiology, can disturb these functions.
CONTROL OF CARDIAC PERFORMANCE AND OUTPUT
The extent of shortening of heart muscle and, therefore, the stroke volume of the ventricle in the intact heart depend on three major influences: (1) the length of the muscle at the onset of contraction, i.e., the preload; (2) the tension that the muscle is called on to develop during contraction, i.e., the afterload; and (3) the contractility of the muscle, i.e., the extent and velocity of shortening at any given preload and afterload. The major determinants of preload, afterload, and contractility are shown in Table 265e-2.
|
DETERMINANTS OF STROKE VOLUME |
aArrows indicate directional effects of determinants of contractility. bContractility rises initially but later becomes depressed.
THE ROLE OF MUSCLE LENGTH (PRELOAD)
The preload determines the length of the sarcomeres at the onset of contraction. The length of the sarcomeres associated with the most forceful contraction is ~2.2 μm. This length provides the optimum configuration for the interaction between the two sets of myofilaments. The length of the sarcomere also regulates the extent of activation of the contractile system, i.e., its sensitivity to Ca2+. According to this concept, termed length-dependent activation, myofilament sensitivity to Ca2+ is also maximal at the optimal sarcomere length. The relation between the initial length of the muscle fibers and the developed force has prime importance for the function of heart muscle. This relationship forms the basis of Starling’s law of the heart, which states that within limits, the force of ventricular contraction depends on the end-diastolic length of the cardiac muscle; in the intact heart, the latter relates closely to the ventricular end-diastolic volume.
CARDIAC PERFORMANCE
The ventricular end-diastolic or “filling” pressure sometimes is used as a surrogate for the end-diastolic volume. In isolated heart and heart-lung preparations, the stroke volume varies directly with the end-diastolic fiber length (preload) and inversely with the arterial resistance (afterload), and as the heart fails—i.e., as its contractility declines—it delivers a progressively smaller stroke volume from a normal or even elevated end-diastolic volume. The relation between the ventricular end-diastolic pressure and the stroke work of the ventricle (the ventricular function curve) provides a useful definition of the level of contractility of the heart in the intact organism. An increase in contractility is accompanied by a shift of the ventricular function curve upward and to the left (greater stroke work at any level of ventricular end-diastolic pressure, or lower end-diastolic volume at any level of stroke work), whereas a shift downward and to the right characterizes depression of contractility (Fig. 265e-8).
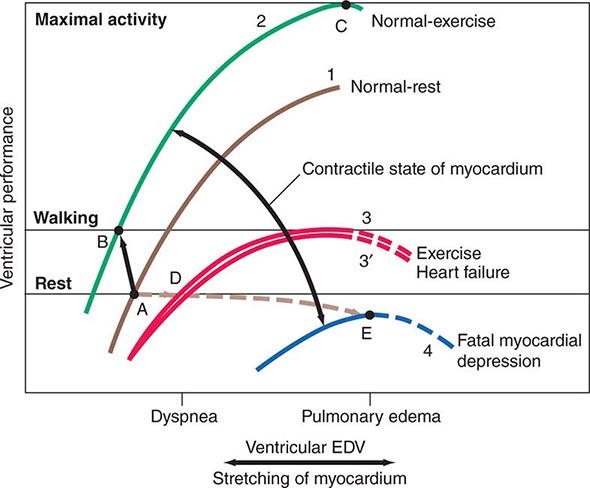
FIGURE 265e-8 The interrelations among influences on ventricular end-diastolic volume (EDV) through stretching of the myocardium and the contractile state of the myocardium. Levels of ventricular EDV associated with filling pressures that result in dyspnea and pulmonary edema are shown on the abscissa. Levels of ventricular performance required when the subject is at rest, while walking, and during maximal activity are designated on the ordinate. The broken lines are the descending limbs of the ventricular-performance curves, which are rarely seen during life but show the level of ventricular performance if end-diastolic volume could be elevated to very high levels. For further explanation, see text. (Modified from WS Colucci and E Braunwald: Pathophysiology of heart failure, in Braunwald’s Heart Disease, 7th ed, DP Zipes et al [eds]. Philadelphia: Elsevier, 2005, pp 509–538.)
VENTRICULAR AFTERLOAD
In the intact heart, as in isolated cardiac muscle, the extent and velocity of shortening of ventricular muscle fibers at any level of preload and of myocardial contractility relate inversely to the afterload, i.e., the load that opposes shortening. In the intact heart, the afterload may be defined as the tension developed in the ventricular wall during ejection. Afterload is determined by the aortic pressure as well as by the volume and thickness of the ventricular cavity. Laplace’s law states that the tension of the myocardial fiber is the product of the intracavitary ventricular pressure and ventricular radius divided by wall thickness. Therefore, at any particular level of aortic pressure, the afterload on a dilated left ventricle exceeds that on a normal-sized ventricle. Conversely, at the same aortic pressure and ventricular diastolic volume, the afterload on a hypertrophied ventricle is lower than of a normal chamber. The aortic pressure in turn depends on the peripheral vascular resistance, the physical characteristics of the arterial tree, and the volume of blood it contains at the onset of ejection.
Ventricular afterload critically regulates cardiovascular performance (Fig. 265e-9). As already noted, elevations in both preload and contractility increase myocardial fiber shortening, whereas increases in afterload reduce it. The extent of myocardial fiber shortening and left ventricular size determine stroke volume. An increase in arterial pressure induced by vasoconstriction, for example, augments afterload, which opposes myocardial fiber shortening, reducing stroke volume.
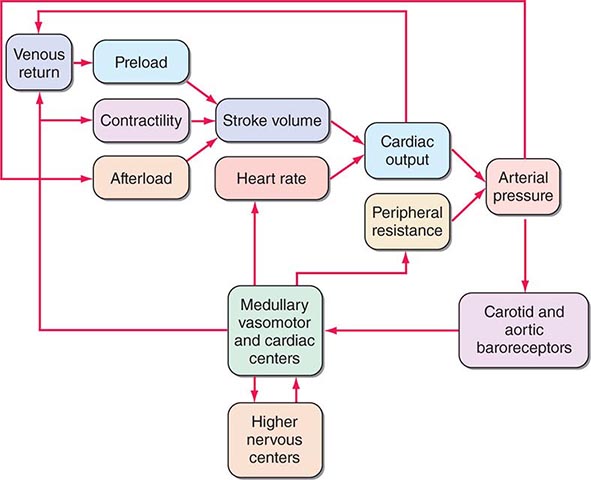
FIGURE 265e-9 Interactions in the intact circulation of preload, contractility, and afterload in producing stroke volume. Stroke volume combined with heart rate determines cardiac output, which, when combined with peripheral vascular resistance, determines arterial pressure for tissue perfusion. The characteristics of the arterial system also contribute to afterload, an increase that reduces stroke volume. The interaction of these components with carotid and aortic arch baroreceptors provides a feedback mechanism to higher medullary and vasomotor cardiac centers and to higher levels in the central nervous system to effect a modulating influence on heart rate, peripheral vascular resistance, venous return, and contractility. (From MR Starling: Physiology of myocardial contraction, in Atlas of Heart Failure: Cardiac Function and Dysfunction, 3rd ed, WS Colucci and E Braunwald [eds]. Philadelphia: Current Medicine, 2002, pp 19–35.)
When myocardial contractility becomes impaired and the ventricle dilates, afterload rises (Laplace’s law) and limits cardiac output. Increased afterload also may result from neural and humoral stimuli that occur in response to a fall in cardiac output. This increased afterload may reduce cardiac output further, thereby increasing ventricular volume and initiating a vicious circle, especially in patients with ischemic heart disease and limited myocardial O2 supply. Treatment with vasodilators has the opposite effect; when afterload is reduced, cardiac output rises (Chap. 279).
Under normal circumstances, the various influences acting on cardiac performance enumerated above interact in a complex fashion to maintain cardiac output at a level appropriate to the requirements of the metabolizing tissues (Fig. 265e-9); interference with a single mechanism may not influence the cardiac output. For example, a moderate reduction of blood volume or the loss of the atrial contribution to ventricular contraction ordinarily can be sustained without a reduction in the cardiac output at rest. Under these circumstances, other factors, such as increases in the frequency of adrenergic nerve impulses to the heart, heart rate, and venous tone, will serve as compensatory mechanisms and sustain cardiac output in a normal individual.
EXERCISE
The integrated response to exercise illustrates the interactions among the three determinants of stroke volume: preload, afterload, and contractility (Fig. 265e-8). Hyperventilation, the pumping action of the exercising muscles, and venoconstriction during exercise all augment venous return and hence ventricular filling and preload (Table 265e-2). Simultaneously, the increase in the adrenergic nerve impulse traffic to the myocardium, the increased concentration of circulating catecholamines, and the tachycardia that occur during exercise combine to augment the contractility of the myocardium (Fig. 265e-8, curves 1 and 2) and together elevate stroke volume and stroke work, without a change in or even a reduction of end-diastolic pressure and volume (Fig. 265e-8, points A and B). Vasodilation occurs in the exercising muscles, thus tending to limit the increase in arterial pressure that otherwise would occur as cardiac output rises to levels as high as five times greater than basal levels during maximal exercise. This vasodilation ultimately allows the achievement of a greatly elevated cardiac output during exercise at an arterial pressure only moderately higher than in the resting state.
ASSESSMENT OF CARDIAC FUNCTION
Several techniques can define impaired cardiac function in clinical practice. The cardiac output and stroke volume may be depressed in the presence of heart failure, but not uncommonly, these variables are within normal limits in this condition. A somewhat more sensitive index of cardiac function is the ejection fraction, i.e., the ratio of stroke volume to end-diastolic volume (normal value = 67 ± 8%), which is frequently depressed in systolic heart failure even when the stroke volume itself is normal. Alternatively, abnormally elevated ventricular end-diastolic volume (normal value = 75 ± 20 mL/m2) or end-systolic volume (normal value = 25 ± 7 mL/m2) signifies impairment of left ventricular systolic function.
Noninvasive techniques, particularly echocardiography as well as radionuclide scintigraphy and cardiac magnetic resonance imaging (MRI) (Chap. 270e), have great value in the clinical assessment of myocardial function. They provide measurements of end-diastolic and end-systolic volumes, ejection fraction, and systolic shortening rate, and they allow assessment of ventricular filling (see below) as well as regional contraction and relaxation. The latter measurements are particularly important in ischemic heart disease, as myocardial infarction causes regional myocardial damage.
A limitation of measurements of cardiac output, ejection fraction, and ventricular volumes in assessing cardiac function is that ventricular loading conditions strongly influence these variables. Thus, a depressed ejection fraction and lowered cardiac output may occur in patients with normal ventricular function but reduced preload, as occurs in hypovolemia, or with increased afterload, as occurs in acutely elevated arterial pressure.
The end-systolic left ventricular pressure-volume relationship is a particularly useful index of ventricular performance because it does not depend on preload and afterload (Fig. 265e-10). At any level of myocardial contractility, left ventricular end-systolic volume varies inversely with end-systolic pressure; as contractility declines, end-systolic volume (at any level of end-systolic pressure) rises.
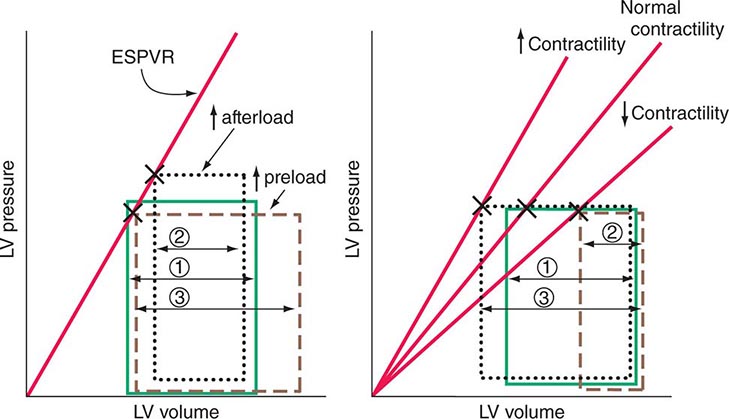
FIGURE 265e-10 The responses of the left ventricle to increased afterload, increased preload, and increased and reduced contractility are shown in the pressure-volume plane. Left. Effects of increases in preload and afterload on the pressure-volume loop. Because there has been no change in contractility, the end-systolic pressure-volume relationship (ESPVR) is unchanged. With an increase in afterload, stroke volume falls (1 → 2); with an increase in preload, stroke volume rises (1 → 3). Right. With increased myocardial contractility and constant left ventricular end-diastolic volume, the ESPVR moves to the left of the normal line (lower end-systolic volume at any end-systolic pressure) and stroke volume rises (1 → 3). With reduced myocardial contractility, the ESPVR moves to the right; end-systolic volume is increased, and stroke volume falls (1 → 2).
DIASTOLIC FUNCTION
Ventricular filling is influenced by the extent and speed of myocardial relaxation, which in turn depends on the rate of uptake of Ca2+ by the SR; the latter may be enhanced by adrenergic activation and reduced by ischemia, which reduces the ATP available for pumping Ca2+ into the SR (see above). The stiffness of the ventricular wall also may impede filling. Ventricular stiffness increases with hypertrophy and conditions that infiltrate the ventricle, such as amyloid, or is caused by an extrinsic constraint (e.g., pericardial compression) (Fig. 265e-11).
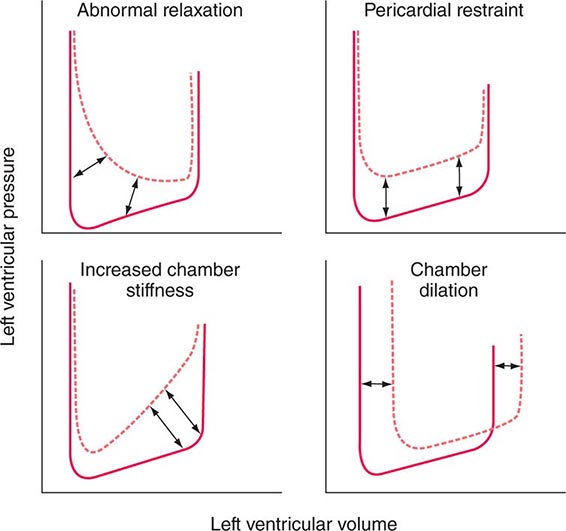
FIGURE 265e-11 Mechanisms that cause diastolic dysfunction reflected in the pressure-volume relation. The bottom half of the pressure-volume loop is depicted. Solid lines represent normal subjects; broken lines represent patients with diastolic dysfunction. (From JD Carroll et al: The differential effects of positive inotropic and vasodilator therapy on diastolic properties in patients with congestive cardiomyopathy. Circulation 74:815, 1986; with permission.)
Ventricular filling can be assessed by continuously measuring the velocity of flow across the mitral valve using Doppler ultrasound. Normally, the velocity of inflow is more rapid in early diastole than during atrial systole; with mild to moderately impaired relaxation, the rate of early diastolic filling declines, whereas the rate of presystolic filling rises. With further impairment of filling, the pattern is “pseudonormalized,” and early ventricular filling becomes more rapid as left atrial pressure upstream to the stiff left ventricle rises.
CARDIAC METABOLISM
The heart requires a continuous supply of energy (in the form of ATP) not only to perform its mechanical pumping functions, but also to regulate intracellular and transsarcolemmal ionic movements and concentration gradients. Among its pumping functions, the development of tension, the frequency of contraction, and the level of myocardial contractility are the principal determinants of the heart’s substantial energy needs, making its O2 requirements approximately 15% of that of the entire organism.
Most ATP production depends on the oxidation of substrate (glucose and free fatty acids [FFAs]). Myocardial FFAs are derived from circulating FFAs, which result principally from lipolysis in adipose tissue, whereas the myocyte’s glucose derives from plasma as well as from the cell’s breakdown of its glycogen stores (glycogenolysis). These two principal sources of acetyl coenzyme A in cardiac muscle vary reciprocally. Glucose is broken down in the cytoplasm into a three-carbon product, pyruvate, which passes into the mitochondria, where it is metabolized to the two-carbon fragment, acetyl-CoA, and undergoes oxidation. FFAs are converted to acyl-CoA in the cytoplasm and acetyl-CoA in the mitochondria. Acetyl-CoA enters the citric acid (Krebs) cycle to produce ATP by oxidative phosphorylation within the mitochondria; ATP then enters the cytoplasm from the mitochondrial compartment. Intracellular ADP, resulting from the breakdown of ATP, enhances mitochondrial ATP production.
In the fasted, resting state, circulating FFA concentrations and their myocardial uptake are high, and they furnish most of the heart’s acetyl-CoA (~70%). In the fed state, with elevations of blood glucose and insulin, glucose oxidation increases and FFA oxidation subsides. Increased cardiac work, the administration of inotropic agents, hypoxia, and mild ischemia all enhance myocardial glucose uptake, glucose production resulting from glycogenolysis, and glucose metabolism to pyruvate (glycolysis). By contrast, β-adrenergic stimulation, as occurs during stress, raises the circulating levels and metabolism of FFAs in favor of glucose. Severe ischemia inhibits the cytoplasmic enzyme pyruvate dehydrogenase, and despite both glycogen and glucose breakdown, glucose is metabolized only to lactic acid (anaerobic glycolysis), which does not enter the citric acid cycle. Anaerobic glycolysis produces much less ATP than does aerobic glucose metabolism, in which glucose is metabolized to pyruvate and subsequently oxidized to CO2. High concentrations of circulating FFAs, which can occur when adrenergic stimulation is superimposed on severe ischemia, reduce oxidative phosphorylation and also cause ATP wastage; the myocardial content of ATP declines and impairs myocardial contraction. In addition, products of FFA breakdown can exert toxic effects on cardiac cell membranes and may be arrhythmogenic.
Myocardial energy is stored as creatine phosphate (CP), which is in equilibrium with ATP, the immediate source of energy. In states of reduced energy availability, the CP stores decline first. Cardiac hypertrophy, fibrosis, tachycardia, increased wall tension resulting from ventricular dilation, and increased intracytoplasmic [Ca2+] all contribute to increased myocardial energy needs. When coupled with reduced coronary flow reserve, as occurs with obstruction of coronary arteries or abnormalities of the coronary microcirculation, an imbalance in myocardial ATP production relative to demand may occur, and the resulting ischemia can worsen or cause heart failure.
Developmental Biology of the Cardiovascular System The heart is the first organ to form during embryogenesis (Fig. 265e-12) and must accomplish the simultaneous challenges of circulating blood, nutrients, and oxygen to the other forming organs while continuing to grow and undergo complex morphogenetic changes. Early progenitors of the heart arise within very early crescent-shaped fields of lateral splanchnic mesoderm under the influence of multiple signals, including those derived from neural ectoderm long before neural tube closure. Early cardiac precursors express genes encoding regulatory transcription factors that play reiterated roles in cardiac development, such as NKX2-5 and GATA4. Mutations in these genes are responsible for some forms of inherited congenital heart disease. Cardiac precursors coalesce to form a midline heart tube composed of a single cell layer of endocardium surrounded by a single layer of myocardial precursors. The caudal, inflow region of the heart tube, which is destined to adopt a more rostral final position, represents the atrial anlagen, whereas the rostral, outflow portion of the tube forms the truncus arteriosus, which divides to produce the aorta and the proximal pulmonary artery. Between these extremes lie the structural precursors of the ventricles.
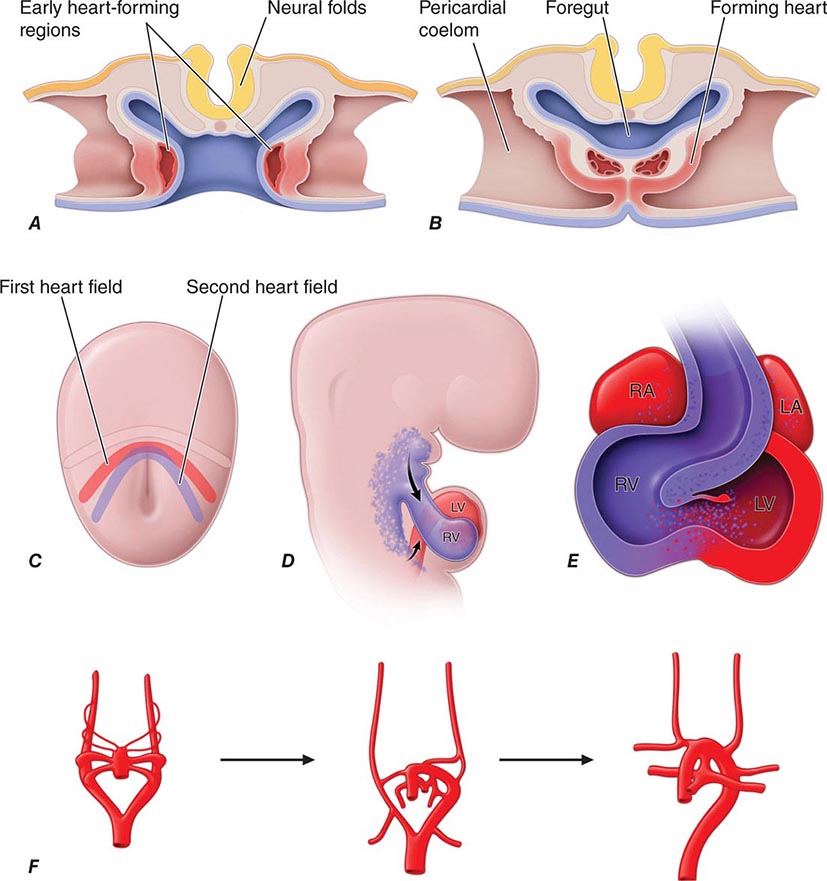
FIGURE 265e-12 A. Schematic depiction of a transverse section through an early embryo depicts the bilateral regions where early heart tubes form. B. The bilateral heart tubes subsequently migrate to the midline and fuse to form the linear heart tube. C. At the early cardiac crescent stage of embryonic development, cardiac precursors include a primary heart field fated to form the linear heart tube and a second heart field fated to add myocardium to the inflow and outflow poles of the heart. D. Second heart field cells populate the pharyngeal region before subsequently migrating to the maturing heart. E. Large portions of the right ventricle and outflow tract and some cells within the atria derive from the second heart field. F. The aortic arch arteries form as symmetric sets of vessels that then remodel under the influence of the neural crest to form the asymmetric mature vasculature. LA, left atrium; LV, left ventricle; RA, right atrium; RV, right ventricle.
The linear heart tube undergoes an asymmetric looping process (the first gross evidence of left-right asymmetry in the developing embryo), which positions the portion of the heart tube destined to become the left ventricle to the left of the more rostral precursors of the right ventricle and outflow tract. Looping is coordinated with chamber specification and ballooning of various regions of the heart tube to produce the presumptive atria and ventricles.
Relatively recent work has demonstrated that significant portions of the right ventricle are formed by cells that are added to the developing heart after looping has occurred. These cells, which are derived from what is called the second heart field, migrate to the heart from the ventral pharynx and express markers that allow for their identification, including Islet-1. Different embryologic origins of cells within the right and left ventricles may help explain why some forms of congenital and adult heart diseases affect these regions of the heart to varying degrees.
After looping and chamber formation, a series of septation events divide the left and right sides of the heart, separate the atria from the ventricles, and form the aorta and pulmonary artery from the truncus arteriosus. Cardiac valves form between the atria and the ventricles and between the ventricles and the outflow vessels. Early in development, the single layer of myocardial cells secretes an extracellular matrix rich in hyaluronic acid. This extracellular matrix, termed “cardiac jelly,” accumulates within the endocardial cushions, precursors of the cardiac valves. Signals from overlying myocardial cells, including members of the transforming growth factor β family, trigger migration, invasion, and phenotypic changes of underlying endocardial cells, which undergo an epithelial-mesenchymal transformation and invade the cardiac jelly to cellularize the endocardial cushions. Mesenchymal components proliferate and remodel to form the mature valve leaflets.
The great vessels form as a series of bilaterally symmetric aortic arch arteries that undergo asymmetric remodeling events to form the mature vasculature. The immigration of neural crest cells that arise in the dorsal neural tube orchestrates this process. These cells are required for aortic arch remodeling and septation of the truncus arteriosus. They develop into smooth-muscle cells within the tunica media of the aortic arch, the ductus arteriosus, and the carotid arteries. Smooth-muscle cells within the descending aorta arise from a different embryologic source, the lateral plate mesoderm, and smooth muscle of the proximal outflow tract arises from the second heart field. Neural crest cells are sensitive to both vitamin A and folic acid, and congenital heart disease involving abnormal remodeling of the aortic arch arteries has been associated with maternal deficiencies of these vitamins. Congenital heart disease involving the outflow tract can be associated with other defects of neural crest, such as cleft palate or craniofacial abnormalities.
Coronary artery formation requires yet another cell population that initiates extrinsic to the embryonic heart fields. Epicardial cells arise in the proepicardial organ, a derivative of the septum transversum, which also contributes to the fibrous portion of the diaphragm and to the liver. Proepicardial cells contribute to the smooth-muscle cells of the coronary arteries and are required for their proper patterning. Other cell types within the heart, including fibroblasts and potentially some myocardial and endocardial cells, also can arise from the proepicardium.
The cardiac conduction system, which functions both to generate and to propagate electrical impulses, develops primarily from multipotential cardiac precursors, which also give rise to cardiac muscle. The conduction system is composed of slow-conducting (proximal) components, such as the sinoatrial (SA) and atrioventricular (AV) nodes, as well as fast-conducting (distal) components, including the His bundle, bundle branches, and Purkinje fibers. The AV node primarily serves to delay the electrical impulse between atria and ventricles (manifesting decremental conduction), whereas the distal conduction system rapidly delivers the impulse throughout the ventricles. Significant recent attention has been focused on the embryologic origins of various components of the specialized conduction network. Precursors within the sinus venosus give rise to the SA node, whereas those within the AV canal mature into heterogeneous cell types that compose the AV node. Myocardial cells transdifferentiate into Purkinje fibers to form the distal conduction system. Fast and slow conducting cell types within the nodes and bundles are characterized by expression of distinct gap junction proteins, including connexins, and ion channels that characterize unique cell fates and electrical properties of the tissues. Developmental defects in conduction system morphogenesis and lineage determination can lead to various electrophysiologic disorders, including congenital heart block and preexcitation syndromes such as the Wolff-Parkinson-White syndrome (Chap. 276).
Studies of cardiac stem and progenitor cells suggest that progressive lineage restriction results in the gradual and stepwise determination of mature cell fates within the heart, with early precursors capable of adopting endothelial, smooth-muscle, or cardiac phenotypes, and subsequent further specialization into atrial, ventricular, and specialized conduction cell types.
REGENERATING CARDIAC TISSUE
Until very recently, adult mammalian myocardial cells were viewed as fully differentiated and without regenerative potential. Evidence currently supports the existence of limited regenerative potential of the mature heart. Considerable current effort is being devoted to evaluating the utility of various putative stem cell populations and regenerative approaches to enhance cardiac repair after injury. The success of such approaches would offer the exciting possibility of reconstructing an infarcted or failing ventricle (Chaps. 88 and 90e).
266e |
Epidemiology of Cardiovascular Disease |
Cardiovascular disease (CVD) is now the most common cause of death worldwide. Before 1900, infectious diseases and malnutrition were the most common causes, and CVD was responsible for less than 10% of all deaths. In 2010, CVD accounted for approximately 16 million deaths worldwide (30%), including nearly 40% of deaths in high-income countries and about 28% in low- and middle-income countries.
THE EPIDEMIOLOGIC TRANSITION
![]() The global rise in CVD is the result of an unprecedented transformation in the causes of morbidity and mortality during the twentieth century. Known as the epidemiologic transition, this shift is driven by industrialization, urbanization, and associated lifestyle changes and is taking place in every part of the world among all races, ethnic groups, and cultures. The transition is divided into four basic stages: pestilence and famine, receding pandemics, degenerative and man-made diseases, and delayed degenerative diseases. A fifth stage, characterized by an epidemic of inactivity and obesity, is emerging in some countries (Table 266e-1).
The global rise in CVD is the result of an unprecedented transformation in the causes of morbidity and mortality during the twentieth century. Known as the epidemiologic transition, this shift is driven by industrialization, urbanization, and associated lifestyle changes and is taking place in every part of the world among all races, ethnic groups, and cultures. The transition is divided into four basic stages: pestilence and famine, receding pandemics, degenerative and man-made diseases, and delayed degenerative diseases. A fifth stage, characterized by an epidemic of inactivity and obesity, is emerging in some countries (Table 266e-1).
|
FIVE STAGES OF THE EPIDEMIOLOGIC TRANSITION |
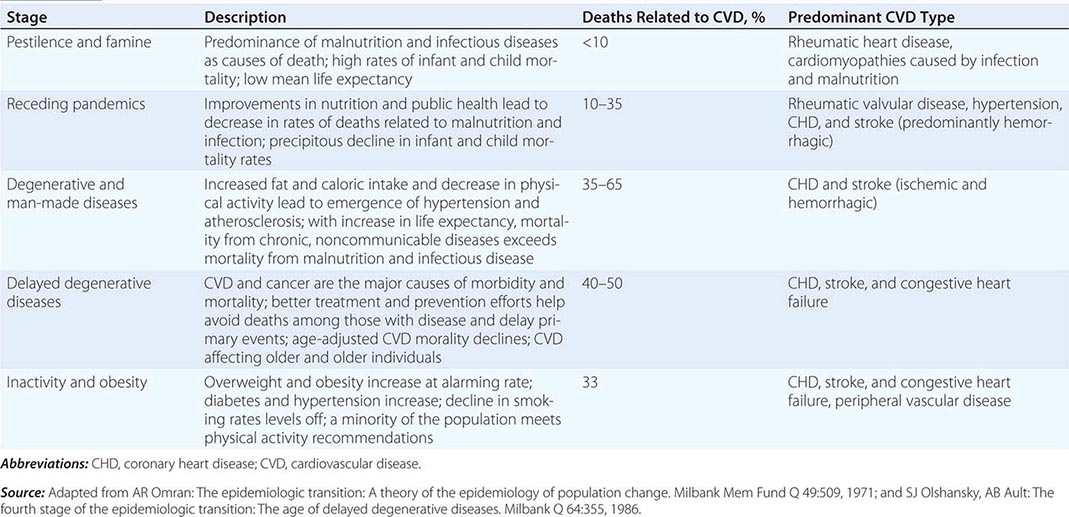
The age of pestilence and famine is marked by malnutrition, infectious diseases, and high infant and child mortality that are offset by high fertility. Tuberculosis, dysentery, cholera, and influenza are often fatal, resulting in a mean life expectancy of about 30 years. CVD, which accounts for less than 10% of deaths, takes the form of rheumatic heart disease and cardiomyopathies due to infection and malnutrition. Approximately 10% of the world’s population remains in the age of pestilence and famine.
Per capita income and life expectancy increase during the age of receding pandemics as the emergence of public health systems, cleaner water supplies, and improved nutrition combine to drive down deaths from infectious disease and malnutrition. Infant and childhood mortality also decline, but deaths due to CVD increase to between 10 and 35% of all deaths. Rheumatic valvular disease, hypertension, coronary heart disease (CHD), and stroke are the predominant forms of CVD. Almost 40% of the world’s population is currently in this stage.
The age of degenerative and man-made diseases is distinguished by mortality from noncommunicable diseases—primarily CVD—surpassing mortality from malnutrition and infectious diseases. Caloric intake, particularly from animal fat, increases. CHD and stroke are prevalent, and between 35 and 65% of all deaths can be traced to CVD. Typically, the rate of CHD deaths exceeds that of stroke by a ratio of 2:1 to 3:1. During this period, average life expectancy surpasses the age of 50. Roughly 35% of the world’s population falls into this category.
In the age of delayed degenerative diseases, CVD and cancer remain the major causes of morbidity and mortality, with CVD accounting for 40% of all deaths. However, age-adjusted CVD mortality declines, aided by preventive strategies (for example, smoking cessation programs and effective blood pressure control), acute hospital management, and technologic advances, such as the availability of bypass surgery. CHD, stroke, and congestive heart failure are the primary forms of CVD. About 15% of the world’s population is now in the age of delayed degenerative diseases or is exiting this age and moving into the fifth stage of the epidemiologic transition.
In the industrialized world, physical activity continues to decline while total caloric intake increases. The resulting epidemic of overweight and obesity may signal the start of the age of inactivity and obesity. Rates of type 2 diabetes mellitus, hypertension, and lipid abnormalities are on the rise, trends that are particularly evident in children. If these risk factor trends continue, age-adjusted CVD mortality rates could increase in the coming years.
PATTERNS IN THE EPIDEMIOLOGIC TRANSITION
Unique regional features have modified aspects of the transition in various parts of the world. High-income countries experienced declines in CVD death rates by as much as 50–60% over the last 60 years, whereas CVD death rates increased by 15% over the past 20 years in the low- and middle-income range. However, given the large amount of available data, the United States serves as a useful reference point for comparisons. The age of pestilence and famine occurred before 1900, with a largely agrarian economy and population. Infectious diseases accounted for more deaths than any other cause. By the 1930s, the country proceeded through the age of receding pandemics. The establishment of public health infrastructures resulted in dramatic declines in infectious disease mortality rates. Lifestyle changes due to rapid urbanization resulted in a simultaneous increase in CVD mortality rates, reaching approximately 390 per 100,000. Between 1930 and 1965, the country entered the age of degenerative and man-made diseases. Infectious disease mortality rates fell to fewer than 50 per 100,000 per year, whereas CVD mortality rates reached peak levels with increasing urbanization and lifestyle changes in diet, physical activity, and tobacco consumption. The age of delayed degenerative diseases took place between 1965 and 2000. New therapeutic approaches, preventive measures, and exposure to public health campaigns promoting lifestyle modifications led to substantial declines in age-adjusted mortality rates and a steadily rising age at which a first CVD event occurs.
![]() Currently, the United States is entering what appears to be a fifth phase. The decline in the age-adjusted CVD death rate of 3% per year through the 1970s and 1980s has tapered off in the 1990s to 2%. However, CVD death rates have declined by 3–5% per year during the first decade of the new millennium. Competing trends appear to be at play. One the one hand, an increase in the prevalence of diabetes and obesity, a slowing in the rate of decline in smoking, and a leveling off in the rate of detection and treatment for hypertension are in the negative column. On the other hand, cholesterol levels continue to decline in the face of increased statin use.
Currently, the United States is entering what appears to be a fifth phase. The decline in the age-adjusted CVD death rate of 3% per year through the 1970s and 1980s has tapered off in the 1990s to 2%. However, CVD death rates have declined by 3–5% per year during the first decade of the new millennium. Competing trends appear to be at play. One the one hand, an increase in the prevalence of diabetes and obesity, a slowing in the rate of decline in smoking, and a leveling off in the rate of detection and treatment for hypertension are in the negative column. On the other hand, cholesterol levels continue to decline in the face of increased statin use.
Many high-income countries (HICs)—which together account for 15% of the population—have proceeded through four stages of the epidemiologic transition in roughly the same pattern as the United States. CHD is the dominant form of CVD in these countries, with rates that tend to be two- to five-fold higher than stroke rates. However, variations exist. Whereas North America, Australia, and central northwestern European HICs experienced significant increases then rapid declines in CVD rates, southern and central European countries experienced a more gradual rise and fall in rates. More specifically, central European countries (i.e., Austria, Belgium, and Germany) declined at slower rates compared to their northern counterparts (i.e., Finland, Sweden, Denmark, and Norway). Countries such as Portugal, Spain, and Japan never reached the high mortality rates that the United States and other countries did, with CHD mortality rates at 200 per 100,000, or less. The countries of Western Europe also exhibit a clear north/south gradient in absolute rates of CVD, with rates highest in northern countries (i.e., Finland, Ireland, and Scotland) and lowest in Mediterranean countries (i.e., France, Spain, and Italy). Japan is unique among the HICs, most likely due to the unique dietary patterns of its population. Although stroke rates increased dramatically, CHD rates did not rise as sharply in Japan. However, Japanese dietary habits are undergoing substantial changes, reflected in an increase in cholesterol levels.
Patterns in low- and middle-income countries (LMICs; gross national income per capita less than U.S. $12,615) depend, in part, on cultural differences, secular trends, and responses at the country level, with regard to both public health and treatment infrastructure. Although communicable diseases continue to be a major cause of death, CVD has emerged as a significant health concern in LMICs. With 85% of the world’s population, LMICs are driving the rates of change in the global burden of CVD(Fig. 266e-1). In most LMICs, an urban/rural gradient has emerged for CHD, stroke, and hypertension, with higher rates in urban centers.

FIGURE 266-1 Global deaths by cause, 2010. CMNN, communicable, maternal, neonatal, and nutritional disorders; CVD, cardiovascular diseases; INJ, injuries; ONC, other noncommunicable diseases. (Based on data from Global Burden of Disease Study 2010: Global Burden of Disease Study 2010 Mortality Results 1970–2010. Seattle, Institute for Health Metrics and Evaluation, 2012.)
However, although CVD rates are rapidly rising, vast differences exist among the regions and countries, and even within the countries themselves (Fig. 266e-2). The East Asia and Pacific regions appear to be straddling the second and third phases of the epidemiologic transition. CVD is a major cause of death in China, but like Japan, stroke causes more deaths than CHD in a ratio of about three to one. Vietnam and Cambodia, on the other hand, are just emerging from the pestilence and famine transition. The Middle East and North Africa regions also appear to be entering the third phase of the epidemiologic transition, with increasing life expectancy and CVD death rates just below those of HICs. In general, Latin America appears to be in the third phase of the transition, although there is vast regional heterogeneity with some areas in the second phase of the transition and some in the fourth. The Eastern Europe and Central Asia regions, however, are firmly in the peak of the third phase, with the highest death rates due to CVD (~66%) in the world. Importantly, deaths due to CHD are not limited to the elderly in this region and have a significant effect on working-age populations. South Asia—and more specifically, India, which accounts for the greatest proportion of the region’s population—is experiencing an alarming increase in heart disease. The transition appears to be in the Western style, with CHD as the dominant form of CVD. However, rheumatic heart disease continues to be a major cause of morbidity and mortality. As in South Asia, rheumatic heart disease is also an important cause of CVD morbidity and mortality in sub-Saharan Africa, which largely remains in the first phase of the epidemiologic transition.

FIGURE 266-2 Cardiovascular disease deaths as a percentage of total deaths and total population in seven economic regions of the world defined by the World Bank. (Based on data from Global Burden of Disease Study 2010: Global Burden of Disease Study 2010 Mortality Results 1970–2010. Seattle, Institute for Health Metrics and Evaluation, 2012.)
Many factors contribute to this heterogeneity among LMICs. First, the regions are in various stages of the epidemiologic transition. Second, vast differences in lifestyle and behavioral risk factors exist. Third, racial and ethnic differences may lead to altered susceptibilities to various forms of CVD. In addition, it should be noted that for most countries in these regions, accurate country-wide data on cause-specific mortality are not complete.
GLOBAL TRENDS IN CARDIOVASCULAR DISEASE
![]() CVD accounts for nearly 30% of deaths worldwide, a number that is expected to increase. In 2010, CHD accounted for 13.3% of all deaths globally and the largest portion of global years of life lost (YLLs) and disability-adjusted life-years (DALYs). The second largest cause of death was stroke (11.1% of all deaths), which was also the third largest contributor to global YLLs and DALYs (Table 266e-2). Together, CHD and stroke accounted for nearly a quarter of all deaths worldwide. The burden of stroke is of growing concern among LMICs. The impact of stroke on DALYs and mortality rates is more than three times greater in LMICs as compared to HICs. By 2030, the number of deaths due to stroke is projected to increase by more than 30%, the majority of which will occur in LMICs.
CVD accounts for nearly 30% of deaths worldwide, a number that is expected to increase. In 2010, CHD accounted for 13.3% of all deaths globally and the largest portion of global years of life lost (YLLs) and disability-adjusted life-years (DALYs). The second largest cause of death was stroke (11.1% of all deaths), which was also the third largest contributor to global YLLs and DALYs (Table 266e-2). Together, CHD and stroke accounted for nearly a quarter of all deaths worldwide. The burden of stroke is of growing concern among LMICs. The impact of stroke on DALYs and mortality rates is more than three times greater in LMICs as compared to HICs. By 2030, the number of deaths due to stroke is projected to increase by more than 30%, the majority of which will occur in LMICs.
|
MORBIDITY RELATED TO HEART DISEASE: 2010–2030 |
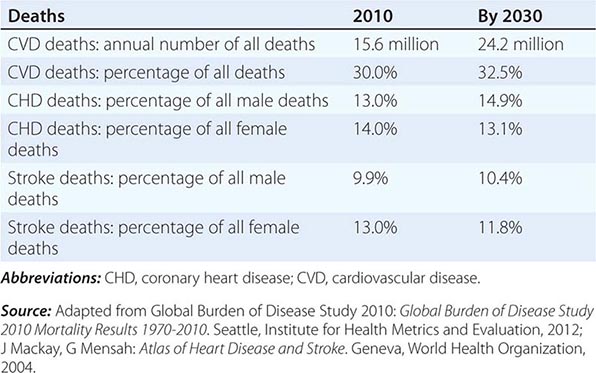
With nearly 85% of the world’s population, LMICs largely drive global CVD rates and trends. Ten million CVD deaths occurred in LMICs in 2010, compared to 5.6 million in HICs. Globally, there is evidence of significant delays in age of occurrence and/or improvements in case fatality rates; between 1990 and 2010, the number of CVD deaths increased by 31%, but age-adjusted death rates decreased by 21.2% in the same period.
Although HIC population growth will be fueled by emigration from LMICs, the populations of HICs will shrink as a proportion of the world’s population. The modest decline in CVD death rates that began in the HICs in the latter third of the twentieth century will continue, but the rate of decline appears to be slowing. However, these countries are expected to see an increase in the prevalence of CVD, as well as the absolute number of deaths as the population ages.
Significant portions of the population living in LMICs have entered the third phase of the epidemiologic transition, and some are entering the fourth stage. Changing demographics play a significant role in future predictions for CVD throughout the world. For example, the population growth rate in Eastern Europe and Central Asia was 0.7% in 2012, whereas it was 1.3% in South Asia.
CVD rates will also have an economic impact. Even assuming no increase in CVD risk factors, most countries, but especially India and South Africa, will see a large number of people between 35 and 64 die of CVD over the next 30 years, as well as an increasing level of morbidity among middle-aged people related to heart disease and stroke. In China, it is estimated that there will be 9 million deaths from CVD in 2030—up from 2.4 million in 2002—with half occurring in individuals between 35 and 64 years old.
RISK FACTORS
The global variation in CVD rates is related to temporal and regional variations in known risk behaviors and factors. Ecological analyses of major CVD risk factors and mortality demonstrate high correlations between expected and observed mortality rates for the three main risk factors—smoking, serum cholesterol, and hypertension—and suggest that many of the regional variations are based on differences in conventional risk factors.
Behavioral Risk Factors • TOBACCO Over 1.3 billion people use tobacco worldwide, a number that is projected to increase to 1.6 billion by 2030. Tobacco use currently causes about 5 million deaths annually (9% of all deaths), approximately 1.6 million of which are CVD-related. If current smoking patterns continue, the global burden of disease attributable to tobacco will reach 10 million deaths by 2030. Although tobacco use has been greatest in HICs historically, consumption has shifted dramatically to LMICs in recent decades. Some of the highest tobacco use now occurs in the East Asia and Pacific region. A unique feature of LMICs is easy access to smoking during the early stages of the epidemiologic transition due to the availability of relatively inexpensive tobacco products. In South Asia, the prominence of other locally produced forms of tobacco besides manufactured cigarettes makes control of consumption more challenging. Secondhand smoke is another well-established cause of CHD, responsible for 600,000 deaths of nonsmokers in 2011. Although smoking bans have both immediate and long-term benefits, implementation varies greatly between countries.
DIET Total caloric intake per capita increases as countries develop. With regard to CVD, a key element of dietary change is an increase in intake of saturated animal fats and hydrogenated vegetable fats, which contain atherogenic trans fatty acids, along with a decrease in intake of plant-based foods and an increase in simple carbohydrates. Fat contributes less than 20% of calories in rural China and India, less than 30% in Japan, and well above 30% in the United States. Caloric contributions from fat appear to be falling in the HICs. In the United States, between 1971 and 2010, the percentage of calories derived from saturated fat decreased from 13% to 11%.
PHYSICAL INACTIVITY The increased mechanization that accompanies the economic transition leads to a shift from physically demanding, agriculture-based work to largely sedentary industry- and office-based work. In the United States, approximately one-quarter of the population does not participate in any leisure-time physical activity, and only 51.6% of adults report engaging in physical activity three or more times a week. Physical inactivity is similarly high in other regions of the world and is increasing in countries that are rapidly urbanizing as part of their economic transition. In urban China, for example, the proportion of adults who participate in moderate- or high-level activity has decreased significantly, whereas those who participate in low-level activity has increased.
METABOLIC RISK FACTORS
Examination of trends in metabolic risk factors provides insight into changes in the CVD burden globally. Here we describe four metabolic risk factors—lipid levels, hypertension, obesity, and diabetes mellitus—using data from the Global Burden of Disease, Injuries, and Risk Factors Study (GBD 2010). The GBD project identified and compiled mortality and morbidity data from 187 countries from 1980 to 2010.
Lipid Levels Worldwide, high cholesterol levels are estimated to play a role in 56% of ischemic heart disease events and 18% of strokes, amounting to 4.4 million deaths annually. Although mean population plasma cholesterol levels tend to rise as countries move through the epidemiologic transition, mean serum total cholesterol levels have decreased globally between 1980 and 2008 by 0.08 mmol/L per decade in men and 0.07 mmol/L per decade in women. In 2008, age-standardized mean total cholesterol was 4.64 mmol/L (179.4 mg/dL) in men and 4.76 mmol/L (184.2 mg/dL) in women. Large declines occurred in Australasia, North America, and Western Europe (0.19–0.21 mmol/L). Countries in the East Asia and Pacific region experienced increases of greater than 0.08 mmol/L in both men and women. Social and individual changes that accompany urbanization clearly play a role because plasma cholesterol levels tend to be higher among urban residents than among rural residents. This shift is largely driven by greater consumption of dietary fats—primarily from animal products and processed vegetable oils—and decreased physical activity. In HICs, in general, mean population cholesterol levels are falling, whereas wide variation is seen in the LMICs.
Hypertension Elevated blood pressure is an early indicator of the epidemiologic transition. Worldwide, approximately 62% of strokes and 49% of CHD are attributable to suboptimal (>115 mmHg systolic) blood pressure, which is believed to account for more than 7 million deaths annually. Remarkably, nearly half of this burden occurs among those with systolic blood pressure less than 140 mmHg, even as this level is used at the arbitrary threshold for defining hypertension in many national guidelines. Between 1980 and 2008, the age-standardized prevalence of uncontrolled prevalence has decreased even as the number of people with uncontrolled hypertension has increased. This trend results largely from population growth and aging. Rising mean population blood pressure also occurs as populations industrialize and move from rural to urban settings. For example, the prevalence of hypertension in urban India is 25%, but varies between 10% and 15% in rural communities. One major concern in LMICs is the high rate of undetected, and therefore untreated, hypertension. This may explain, at least in part, the higher stroke rates in these countries in relation to CHD rates during the early stages of the transition. The high rates of hypertension throughout Asia, especially undiagnosed hypertension, likely contribute to the high prevalence of hemorrhagic stroke in the region. Globally, however, mean systolic blood pressure has decreased among both genders (0.8 mmHg per decade among men; 1.0 mmHg per decade among women).
Obesity Although clearly associated with increased risk of CHD, much of the risk posed by obesity may be mediated by other CVD risk factors, including hypertension, diabetes mellitus, and lipid profile imbalances. According to the latest GBD data, nearly 1.46 billion adults were overweight (body mass index ≥25 kg/m2) in 2008, and approximately 508 million were obese (BMI ≥30 kg/m2). Obesity is increasing throughout the world, particularly in developing countries, where the trajectories are steeper than those experienced by the developed countries. In many of the LMICs, obesity appears to coexist with undernutrition and malnutrition. Adolescents are at particular risk. Currently, 1 in 10 children are estimated to be overweight, a number that is increasing worldwide. Women are also more affected than men, with the number of overweight women generally exceeding underweight women based on data from 36 LMICs.
Diabetes Mellitus As a consequence of, or in addition to, increasing body mass index and decreasing levels of physical activity, worldwide rates of diabetes—predominantly type 2 diabetes—are on the rise. According to the most recent data from the GBD project, mean fasting plasma glucose levels have increased globally between 1980 and 2008. An estimated 346 million people worldwide have diabetes. The International Diabetes Foundation predicts that this number will reach 522 million by 2030, a yearly rate of growth that is higher than that of the world’s adult population. Nearly 50% of people with diabetes are undiagnosed, and 80% live in LMICs. The highest regional prevalence for diabetes occurs in the Middle East and North Africa, where an estimated 12.5% of the adult population has diabetes. Future growth will also largely occur in this region, along with other LMICs in South Asia and sub-Saharan Africa. There appear to be clear genetic susceptibilities to diabetes mellitus of various racial and ethnic groups. For example, migration studies suggest that South Asians and Indians tend to be at higher risk than those of European extraction.
SUMMARY
Although CVD rates are declining in the HICs, they are increasing in virtually every other region of the world. The consequences of this preventable epidemic will be substantial on many levels, including individual mortality and morbidity, family suffering, and staggering economic costs.
Three complementary strategies can be used to lessen the impact. First, the overall burden of CVD risk factors can be lowered through population-wide public health measures, such as national campaigns against cigarette smoking, unhealthy diets, and physical inactivity. Second, it is important to identify higher risk subgroups of the population who stand to benefit the most from specific, low-cost prevention interventions, including screening for and treatment of hypertension and elevated cholesterol. Simple, low-cost interventions, such as the “polypill,” a regimen of aspirin, a statin, and an antihypertensive agent, also need to be explored. Third, resources should be allocated to acute as well as secondary prevention interventions. For countries with limited resources, a critical first step in developing a comprehensive plan is better assessment of cause-specific mortality and morbidity, as well as the prevalence of the major preventable risk factors.
In the meantime, the HICs must continue to bear the burden of research and development aimed at prevention and treatment, being mindful of the economic limitations of many countries. The concept of the epidemiologic transition provides insight into how to alter the course of the CVD epidemic. The efficient transfer of low-cost preventive and therapeutic strategies could alter the natural course of this epidemic and thereby reduce the excess global burden of preventable CVD.
SECTION 2 |
DIAGNOSIS OF CARDIOVASCULAR DISORDERS |
267 |
Physical Examination of the Cardiovascular System |
The approach to a patient with known or suspected cardiovascular disease begins with the time-honored traditions of a directed history and a targeted physical examination. The scope of these activities depends on the clinical context at the time of presentation, ranging from an elective ambulatory follow-up visit to a more focused emergency department encounter. There has been a gradual decline in physical examination skills over the last two decades at every level, from student to faculty specialist, a development of great concern to both clinicians and medical educators. Classic cardiac findings are recognized by only a minority of internal medicine and family practice residents. Despite popular perceptions, clinical performance does not improve predictably as a function of experience; instead, the acquisition of new examination skills may become more difficult for a busy individual practitioner. Less time is now devoted to mentored cardiovascular examinations during the training of students and residents. One widely recognized outcome of these trends is the progressive overutilization of noninvasive imaging studies to establish the presence and severity of cardiovascular disease even when the examination findings imply a low pretest probability of significant pathology. Educational techniques to improve bedside skills include repetition, patient-centered teaching conferences, and visual display feedback of auscultatory events with Doppler echocardiographic imaging.
The evidence base that links the findings from the history and physical examination to the presence, severity, and prognosis of cardiovascular disease has been established most rigorously for coronary artery disease, heart failure, and valvular heart disease. For example, observations regarding heart rate, blood pressure, signs of pulmonary congestion, and the presence of mitral regurgitation (MR) contribute importantly to bedside risk assessment in patients with acute coronary syndromes. Observations from the physical examination in this setting can inform clinical decision making before the results of cardiac biomarkers testing are known. The prognosis of patients with systolic heart failure can be predicted on the basis of the jugular venous pressure (JVP) and the presence or absence of a third heart sound (S3). Accurate characterization of cardiac murmurs provides important insight into the natural history of many valvular and congenital heart lesions. Finally, the important role played by the physical examination in enhancing the clinician-patient relationship cannot be overestimated.
THE GENERAL PHYSICAL EXAMINATION
Any examination begins with an assessment of the general appearance of the patient, with notation of age, posture, demeanor, and overall health status. Is the patient in pain or resting quietly, dyspneic or diaphoretic? Does the patient choose to avoid certain body positions to reduce or eliminate pain, as might be the case with suspected acute pericarditis? Are there clues indicating that dyspnea may have a pulmonary cause, such as a barrel chest deformity with an increased anterior-posterior diameter, tachypnea, and pursed-lip breathing? Skin pallor, cyanosis, and jaundice can be appreciated readily and provide additional clues. A chronically ill-appearing emaciated patient may suggest the presence of long-standing heart failure or another systemic disorder, such as a malignancy. Various genetic syndromes, often with cardiovascular involvement, can also be recognized easily, such as trisomy 21, Marfan’s syndrome, and Holt-Oram syndrome. Height and weight should be measured routinely, and both body mass index and body surface area should be calculated. Knowledge of the waist circumference and the waist-to-hip ratio can be used to predict long-term cardiovascular risk. Mental status, level of alertness, and mood should be assessed continuously during the interview and examination.
Skin Central cyanosis occurs with significant right-to-left shunting at the level of the heart or lungs, allowing deoxygenated blood to reach the systemic circulation. Peripheral cyanosis or acrocyanosis, in contrast, is usually related to reduced extremity blood flow due to small vessel constriction, as seen in patients with severe heart failure, shock, or peripheral vascular disease; it can be aggravated by the use of β-adrenergic blockers with unopposed α-mediated constriction. Differential cyanosis refers to isolated cyanosis affecting the lower but not the upper extremities in a patient with a large patent ductus arteriosus (PDA) and secondary pulmonary hypertension with right-to-left to shunting at the great vessel level. Hereditary telangiectasias on the lips, tongue, and mucous membranes, as part of the Osler-Weber-Rendu syndrome (hereditary hemorrhagic telangiectasia), resemble spider nevi and can be a source of right-to-left shunting when also present in the lung. Malar telangiectasias also are seen in patients with advanced mitral stenosis and scleroderma. An unusually tan or bronze discoloration of the skin may suggest hemochromatosis as the cause of the associated systolic heart failure. Jaundice, which may be visible first in the sclerae, has a broad differential diagnosis but, in the appropriate setting, can be consistent with advanced right heart failure and congestive hepatomegaly or late-term “cardiac cirrhosis.” Cutaneous ecchymoses are seen frequently among patients taking vitamin K antagonists or antiplatelet agents such as aspirin and thienopyridines. Various lipid disorders sometimes are associated with subcutaneous xanthomas, particularly along the tendon sheaths or over the extensor surfaces of the extremities. Severe hypertriglyceridemia can be associated with eruptive xanthomatosis and lipemia retinalis. Palmar crease xanthomas are specific for type III hyperlipoproteinemia. Pseudoxanthoma elasticum, a disease associated with premature atherosclerosis, is manifested by a leathery, cobblestoned appearance of the skin in the axilla and neck creases and by angioid streaks on funduscopic examination. Extensive lentiginoses have been described in a variety of development delay–cardiovascular syndromes, including Carney’s syndrome, which includes multiple atrial myxomas. Cutaneous manifestations of sarcoidosis such as lupus pernio and erythema nodosum may suggest this disease as a cause of an associated dilated cardiomyopathy, especially with heart block, intraventricular conduction delay, or ventricular tachycardia.
Head and Neck Dentition and oral hygiene should be assessed in every patient both as a source of potential infection and as an index of general health. A high-arched palate is a feature of Marfan’s syndrome and other connective tissue disease syndromes. Bifid uvula has been described in patients with Loeys-Dietz syndrome, and orange tonsils are characteristic of Tangier disease. The ocular manifestations of hyperthyroidism have been well described. Many patients with congenital heart disease have associated hypertelorism, low-set ears, or micrognathia. Blue sclerae are a feature of osteogenesis imperfecta. An arcus senilis pattern lacks specificity as an index of coronary heart disease risk. The funduscopic examination is an often underused method by which to assess the microvasculature, especially among patients with established atherosclerosis, hypertension, or diabetes mellitus. A mydriatic agent may be necessary for optimal visualization. A funduscopic examination should be performed routinely in the assessment of patients with suspected endocarditis and those with a history of acute visual change. Branch retinal artery occlusion or visualization of a Hollenhorst plaque can narrow the differential diagnosis rapidly in the appropriate setting. Relapsing polychondritis may manifest as an inflamed pinna or, in its later stages, as a saddle-nose deformity because of destruction of nasal cartilage; granulomatosis with polyangiitis (Wegener’s) can also lead to a saddle-nose deformity.
Chest Midline sternotomy, left posterolateral thoracotomy, or infraclavicular scars at the site of pacemaker/defibrillator generator implantation should not be overlooked and may provide the first clue regarding an underlying cardiovascular disorder in patients unable to provide a relevant history. A prominent venous collateral pattern may suggest subclavian or vena caval obstruction. If the head and neck appear dusky and slightly cyanotic and the venous pressure is grossly elevated without visible pulsations, a diagnosis of superior vena cava syndrome should be entertained. Thoracic cage abnormalities have been well described among patients with connective tissue disease syndromes. They include pectus carinatum (“pigeon chest”) and pectus excavatum (“funnel chest”). Obstructive lung disease is suggested by a barrel chest deformity, especially with tachypnea, pursed-lip breathing, and use of accessory muscles. The characteristically severe kyphosis and compensatory lumbar, pelvic, and knee flexion of ankylosing spondylitis should prompt careful auscultation for a murmur of aortic regurgitation (AR). Straight back syndrome refers to the loss of the normal kyphosis of the thoracic spine and has been described in patients with mitral valve prolapse (MVP) and its variants. In some patients with cyanotic congenital heart disease, the chest wall appears to be asymmetric, with anterior displacement of the left hemithorax. The respiratory rate and pattern should be noted during spontaneous breathing, with additional attention to depth, audible wheezing, and stridor. Lung examination can reveal adventitious sounds indicative of pulmonary edema, pneumonia, or pleuritis.
Abdomen In some patients with advanced obstructive lung disease, the point of maximal cardiac impulse may be in the epigastrium. The liver is frequently enlarged and tender in patients with chronic heart failure. Systolic pulsations over the liver signify severe tricuspid regurgitation (TR). Splenomegaly may be a feature of infective endocarditis, particularly when symptoms have persisted for weeks or months. Ascites is a nonspecific finding but may be present with advanced chronic right heart failure, constrictive pericarditis, hepatic cirrhosis, or an intraperitoneal malignancy. The finding of an elevated JVP implies a cardiovascular etiology. In nonobese patients, the aorta typically is palpated between the epigastrium and the umbilicus. The sensitivity of palpation for the detection of an abdominal aortic aneurysm (pulsatile and expansile mass) decreases as a function of body size. Because palpation alone is not sufficiently accurate to establish this diagnosis, a screening ultrasound examination is advised. The presence of an arterial bruit over the abdomen suggests high-grade atherosclerotic disease, although precise localization is difficult.
Extremities The temperature and color of the extremities, the presence of clubbing, arachnodactyly, and pertinent nail findings can be surmised quickly during the examination. Clubbing implies the presence of central right-to-left shunting, although it has also been described in patients with endocarditis. Its appearance can range from cyanosis and softening of the root of the nail bed, to the classic loss of the normal angle between the base of the nail and the skin, to the skeletal and periosteal bony changes of hypertrophic osteoarthropathy, which is seen rarely in patients with advanced lung or liver disease. Patients with the Holt-Oram syndrome have an unopposable, “fingerized” thumb, whereas patients with Marfan’s syndrome may have arachnodactyly and a positive “wrist” (overlapping of the thumb and fifth finger around the wrist) or “thumb” (protrusion of the thumb beyond the ulnar aspect of the hand when the fingers are clenched over the thumb in a fist) sign. The Janeway lesions of endocarditis are nontender, slightly raised hemorrhages on the palms and soles, whereas Osler’s nodes are tender, raised nodules on the pads of the fingers or toes. Splinter hemorrhages are classically identified as linear petechiae in the midposition of the nail bed and should be distinguished from the more common traumatic petechiae, which are seen closer to the distal edge.
Lower extremity or presacral edema in the setting of an elevated JVP defines volume overload and may be a feature of chronic heart failure or constrictive pericarditis. Lower extremity edema in the absence of jugular venous hypertension may be due to lymphatic or venous obstruction or, more commonly, to venous insufficiency, as further suggested by the appearance of varicosities, venous ulcers (typically medial in location), and brownish cutaneous discoloration from hemosiderin deposition (eburnation). Pitting edema can also be seen in patients who use dihydropyridine calcium channel blockers. A Homan’s sign (posterior calf pain on active dorsiflexion of the foot against resistance) is neither specific nor sensitive for deep venous thrombosis. Muscular atrophy or the absence of hair along an extremity is consistent with severe arterial insufficiency or a primary neuromuscular disorder.
CARDIOVASCULAR EXAMINATION
Jugular Venous Pressure and Waveform JVP is the single most important bedside measurement from which to estimate the volume status. The internal jugular vein is preferred because the external jugular vein is valved and not directly in line with the superior vena cava and right atrium. Nevertheless, the external jugular vein has been used to discriminate between high and low central venous pressure (CVP) when tested among medical students, residents, and attending physicians. Precise estimation of the central venous or right atrial pressure from bedside assessment of the jugular venous waveform has proved difficult. Venous pressure traditionally has been measured as the vertical distance between the top of the jugular venous pulsation and the sternal inflection point (angle of Louis). A distance >4.5 cm at 30° elevation is considered abnormal. However, the actual distance between the mid-right atrium and the angle of Louis varies considerably as a function of both body size and the patient angle at which the assessment is made (30°, 45°, or 60°). The use of the sternal angle as a reference point leads to systematic underestimation of CVP, and this method should be used less for semiquantification than to distinguish a normal from an abnormally elevated CVP. The use of the clavicle may provide an easier reference for standardization. Venous pulsations above this level in the sitting position are clearly abnormal, as the distance between the clavicle and the right atrium is at least 10 cm. The patient should always be placed in the sitting position, with the legs dangling below the bedside, when an elevated pressure is suspected in the semisupine position. It should also be noted that bedside estimates of CVP are made in centimeters of water but must be converted to millimeters of mercury to provide correlation with accepted hemodynamic norms (1.36 cmH2O = 1.0 mmHg).
The venous waveform sometimes can be difficult to distinguish from the carotid pulse, especially during casual inspection. Nevertheless, the venous waveform has several characteristic features, and its individual components can be appreciated in most patients (Fig. 267-1). The arterial pulsation is not easily obliterated with palpation; the venous waveform in patients with sinus rhythm is usually biphasic, while the carotid pulse is monophasic; and the jugular venous pulsation should change with changes in posture or inspiration (unless the venous pressure is quite elevated).
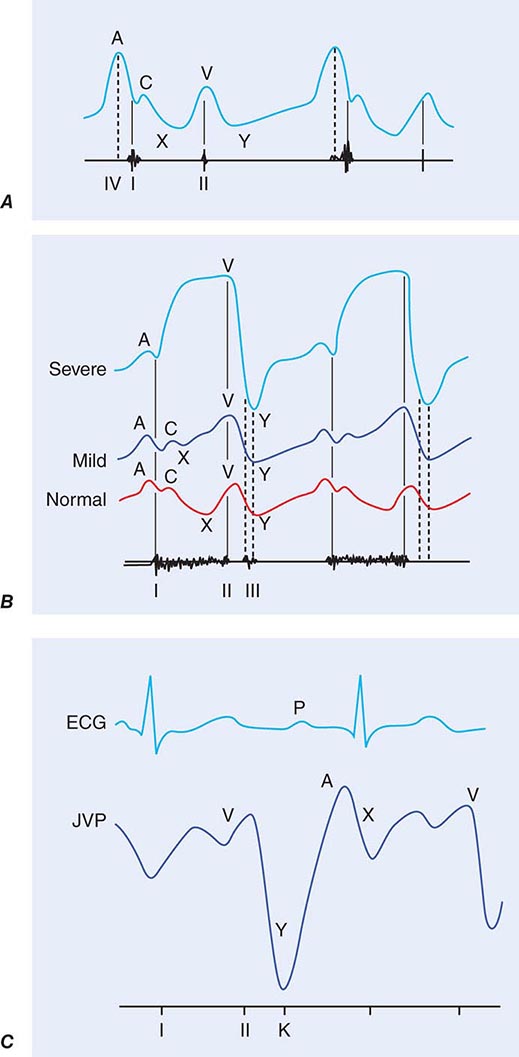
FIGURE 267-1 A. Jugular venous pulse wave tracing (top) with heart sounds (bottom). The A wave represents right atrial presystolic contraction and occurs just after the electrocardiographic P wave and just before the first heart sound (I). In this example, the A wave is accentuated and larger than normal due to decreased right ventricular compliance, as also suggested by the right-sided S4 (IV). The C wave may reflect the carotid pulsation in the neck and/or an early systolic increase in right atrial pressure as the right ventricle pushes the closed tricuspid valve into the right atrium. The x descent follows the A wave just as atrial pressure continues to fall. The V wave represents atrial filling during ventricular systole and peaks at the second heart sound (II). The y descent corresponds to the fall in right atrial pressure after tricuspid valve opening. B. Jugular venous wave forms in mild (middle) and severe (top) tricuspid regurgitation, compared with normal, with phonocardiographic representation of the corresponding heart sounds below. With increasing degrees of tricuspid regurgitation, the waveform becomes “ventricularized.” C. Electrocardiogram (ECG) (top), jugular venous waveform (JVP) (middle), and heart sounds (bottom) in pericardial constriction. Note the prominent and rapid y descent, corresponding in timing to the pericardial knock (K). (From J Abrams: Synopsis of Cardiac Physical Diagnosis, 2nd ed. Boston, Butterworth Heinemann, 2001, pp 25–35.)
The venous waveform is divided into several distinct peaks. The a wave reflects right atrial presystolic contraction and occurs just after the electrocardiographic P wave, preceding the first heart sound (S1). A prominent a wave is seen in patients with reduced right ventricular compliance; a cannon a wave occurs with atrioventricular (AV) dissociation and right atrial contraction against a closed tricuspid valve. In a patient with a wide complex tachycardia, the appreciation of cannon a waves in the jugular venous waveform identifies the rhythm as ventricular in origin. The a wave is not present with atrial fibrillation. The x descent defines the fall in right atrial pressure after inscription of the a wave. The c wave interrupts this x descent and is followed by a further descent. The v wave represents atrial filling (atrial diastole) and occurs during ventricular systole. The height of the v wave is determined by right atrial compliance as well as the volume of blood returning to the right atrium either antegrade from the cavae or retrograde through an incompetent tricuspid valve. In patients with TR, the v wave is accentuated and the subsequent fall in pressure (y descent) is rapid. With progressive degrees of TR, the v wave merges with the c wave, and the right atrial and jugular vein waveforms become “ventricularized.” The y descent, which follows the peak of the v wave, can become prolonged or blunted with obstruction to right ventricular inflow, as may occur with tricuspid stenosis or pericardial tamponade. Normally, the venous pressure should fall by at least 3 mmHg with inspiration. Kussmaul’s sign is defined by either a rise or a lack of fall of the JVP with inspiration and is classically associated with constrictive pericarditis, although it has been reported in patients with restrictive cardiomyopathy, massive pulmonary embolism, right ventricular infarction, and advanced left ventricular systolic heart failure. It is also a common, isolated finding in patients after cardiac surgery without other hemodynamic abnormalities.
Venous hypertension sometimes can be elicited by performance of the abdominojugular reflex or with passive leg elevation. When these signs are positive, a volume-overloaded state with limited compliance of an overly distended or constricted venous system is present. The abdominojugular reflex is elicited with firm and consistent pressure over the upper portion of the abdomen, preferably over the right upper quadrant, for at least 10 s. A positive response is defined by a sustained rise of more than 3 cm in JVP for at least 15 s after release of the hand. Patients must be coached to refrain from breath holding or a Valsalva-like maneuver during the procedure. The abdominojugular reflex is useful in predicting a pulmonary artery wedge pressure in excess of 15 mmHg in patients with heart failure.
Although the JVP estimates right ventricular filling pressure, it has a predictable relationship with the pulmonary artery wedge pressure. In a large study of patients with advanced heart failure, the presence of a right atrial pressure >10 mmHg (as predicted on bedside examination) had a positive value of 88% for the prediction of a pulmonary artery wedge pressure of >22 mmHg. In addition, an elevated JVP has prognostic significance in patients with both symptomatic heart failure and asymptomatic left ventricular systolic dysfunction. The presence of an elevated JVP is associated with a higher risk of subsequent hospitalization for heart failure, death from heart failure, or both.
Assessment of Blood Pressure Measurement of blood pressure usually is delegated to a medical assistant but should be repeated by the clinician. Accurate measurement depends on body position, arm size, time of measurement, place of measurement, device, device size, technique, and examiner. In general, physician-recorded blood pressures are higher than both nurse-recorded pressures and self-recorded pressures at home. Blood pressure is best measured in the seated position with the arm at the level of the heart, using an appropriately sized cuff, after 5–10 min of relaxation. When it is measured in the supine position, the arm should be raised to bring it to the level of the mid-right atrium. The length and width of the blood pressure cuff bladder should be 80% and 40% of the arm’s circumference, respectively. A common source of error in practice is to use an inappropriately small cuff, resulting in marked overestimation of true blood pressure, or an inappropriately large cuff, resulting in underestimation of true blood pressure. The cuff should be inflated to 30 mmHg above the expected systolic pressure and the pressure released at a rate of 2–3 mmHg/s. Systolic and diastolic pressures are defined by the first and fifth Korotkoff sounds, respectively. Very low (even 0 mmHg) diastolic blood pressures may be recorded in patients with chronic, severe AR or a large arteriovenous fistula because of enhanced diastolic “run-off.” In these instances, both the phase IV and phase V Korotkoff sounds should be recorded. Blood pressure is best assessed at the brachial artery level, though it can be measured at the radial, popliteal, or pedal pulse level. In general, systolic pressure increases and diastolic pressure decreases when measured in more distal arteries. Blood pressure should be measured in both arms, and the difference should be less than 10 mmHg. A blood pressure differential that exceeds this threshold may be associated with atherosclerotic or inflammatory subclavian artery disease, supravalvular aortic stenosis, aortic coarctation, or aortic dissection. Systolic leg pressures are usually as much as 20 mmHg higher than systolic arm pressures. Greater leg–arm pressure differences are seen in patients with chronic severe AR as well as patients with extensive and calcified lower extremity peripheral arterial disease. The ankle-brachial index (lower pressure in the dorsalis pedis or posterior tibial artery divided by the higher of the two brachial artery pressures) is a powerful predictor of long-term cardiovascular mortality.
The blood pressure measured in an office or hospital setting may not accurately reflect the pressure in other venues. “White coat hypertension” is defined by at least three separate clinic-based measurements >140/90 mmHg and at least two non-clinic-based measurements <140/90 mmHg in the absence of any evidence of target organ damage. Individuals with white coat hypertension may not benefit from drug therapy, although they may be more likely to develop sustained hypertension over time. Masked hypertension should be suspected when normal or even low blood pressures are recorded in patients with advanced atherosclerotic disease, especially when evidence of target organ damage is present or bruits are audible.
Orthostatic hypotension is defined by a fall in systolic pressure >20 mmHg or in diastolic pressure >10 mmHg in response to assumption of the upright posture from a supine position within 3 min. There may also be a lack of a compensatory tachycardia, an abnormal response that suggests autonomic insufficiency, as may be seen in patients with diabetes or Parkinson’s disease. Orthostatic hypotension is a common cause of postural lightheadedness/syncope and should be assessed routinely in patients for whom this diagnosis might pertain. It can be exacerbated by advanced age, dehydration, certain medications, food, deconditioning, and ambient temperature.
Arterial Pulse The carotid artery pulse occurs just after the ascending aortic pulse. The aortic pulse is best appreciated in the epigastrium, just above the level of the umbilicus. Peripheral arterial pulses that should be assessed routinely include the subclavian, brachial, radial, ulnar, femoral, popliteal, dorsalis pedis, and posterior tibial. In patients in whom the diagnosis of either temporal arteritis or polymyalgia rheumatica is suspected, the temporal arteries also should be examined. Although one of the two pedal pulses may not be palpable in up to 10% of normal subjects, the pair should be symmetric. The integrity of the arcuate system of the hand is assessed by Allen’s test, which is performed routinely before instrumentation of the radial artery. The pulses should be examined for their symmetry, volume, timing, contour, amplitude, and duration. If necessary, simultaneous auscultation of the heart can help identify a delay in the arrival of an arterial pulse. Simultaneous palpation of the radial and femoral pulses may reveal a femoral delay in a patient with hypertension and suspected aortic coarctation. The carotid upstrokes should never be examined simultaneously or before listening for a bruit. Light pressure should always be used to avoid precipitation of carotid hypersensitivity syndrome and syncope in a susceptible elderly individual. The arterial pulse usually becomes more rapid and spiking as a function of its distance from the heart, a phenomenon that reflects the muscular status of the more peripheral arteries and the summation of the incident and reflected waves. In general, the character and contour of the arterial pulse depend on the stroke volume, ejection velocity, vascular compliance, and systemic vascular resistance. The pulse examination can be misleading in patients with reduced cardiac output and in those with stiffened arteries from aging, chronic hypertension, or peripheral arterial disease.
The character of the pulse is best appreciated at the carotid level (Fig. 267-2). A weak and delayed pulse (pulsus parvus et tardus) defines severe aortic stenosis (AS). Some patients with AS may also have a slow, notched, or interrupted upstroke (anacrotic pulse) with a thrill or shudder. With chronic severe AR, by contrast, the carotid upstroke has a sharp rise and rapid fall-off (Corrigan’s or water-hammer pulse). Some patients with advanced AR may have a bifid or bisferiens pulse, in which two systolic peaks can be appreciated. A bifid pulse is also described in patients with hypertrophic obstructive cardiomyopathy (HOCM), with inscription of percussion and tidal waves. A bifid pulse is easily appreciated in patients on intraaortic balloon counterpulsation (IABP), in whom the second pulse is diastolic in timing.
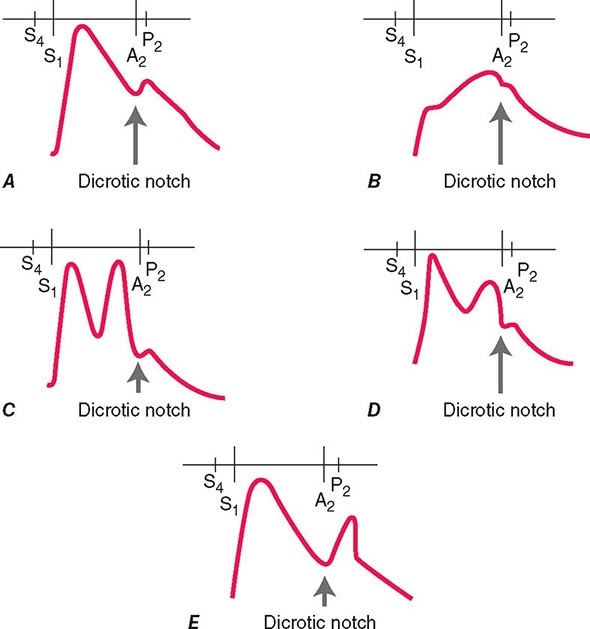
FIGURE 267-2 Schematic diagrams of the configurational changes in carotid pulse and their differential diagnoses. Heart sounds are also illustrated. A. Normal. S4, fourth heart sound; S1, first heart sound; A2 aortic component of second heart sound; P2 pulmonic component of second heart sound. B. Aortic stenosis. Anacrotic pulse with slow upstroke to a reduced peak. C. Bisferiens pulse with two peaks in systole. This pulse is rarely appreciated in patients with severe aortic regurgitation. D. Bisferiens pulse in hypertrophic obstructive cardiomyopathy. There is a rapid upstroke to the first peak (percussion wave) and a slower rise to the second peak (tidal wave). E. Dicrotic pulse with peaks in systole and diastole. This waveform may be seen in patients with sepsis or during intraaortic balloon counterpulsation with inflation just after the dicrotic notch. (From K Chatterjee, W Parmley [eds]: Cardiology: An Illustrated Text/Reference. Philadelphia, Gower Medical Publishers, 1991.)
Pulsus paradoxus refers to a fall in systolic pressure >10 mmHg with inspiration that is seen in patients with pericardial tamponade but also is described in those with massive pulmonary embolism, hemorrhagic shock, severe obstructive lung disease, and tension pneumothorax. Pulsus paradoxus is measured by noting the difference between the systolic pressure at which the Korotkoff sounds are first heard (during expiration) and the systolic pressure at which the Korotkoff sounds are heard with each heartbeat, independent of the respiratory phase. Between these two pressures, the Korotkoff sounds are heard only intermittently and during expiration. The cuff pressure must be decreased slowly to appreciate the finding. It can be difficult to measure pulsus paradoxus in patients with tachycardia, atrial fibrillation, or tachypnea. A pulsus paradoxus may be palpable at the brachial artery or femoral artery level when the pressure difference exceeds 15 mmHg. This inspiratory fall in systolic pressure is an exaggerated consequence of interventricular dependence.
Pulsus alternans, in contrast, is defined by beat-to-beat variability of pulse amplitude. It is present only when every other phase I Korotkoff sound is audible as the cuff pressure is lowered slowly, typically in a patient with a regular heart rhythm and independent of the respiratory cycle. Pulsus alternans is seen in patients with severe left ventricular systolic dysfunction and is thought to be due to cyclic changes in intracellular calcium and action potential duration. When pulsus alternans is associated with electrocardiographic T-wave alternans, the risk for an arrhythmic event appears to be increased.
Ascending aortic aneurysms can rarely be appreciated as a pulsatile mass in the right parasternal area. Appreciation of a prominent abdominal aortic pulse should prompt noninvasive imaging for better characterization. Femoral and/or popliteal artery aneurysms should be sought in patients with abdominal aortic aneurysm disease.
The level of a claudication-producing arterial obstruction can often be identified on physical examination (Fig. 267-3). For example, in a patient with calf claudication, a decrease in pulse amplitude between the common femoral and popliteal arteries will localize the obstruction to the level of the superficial femoral artery, although inflow obstruction above the level of the common femoral artery may coexist. Auscultation for carotid, subclavian, abdominal aortic, and femoral artery bruits should be routine. However, the correlation between the presence of a bruit and the degree of vascular obstruction is poor. A cervical bruit is a weak indicator of the degree of carotid artery stenosis; the absence of a bruit does not exclude the presence of significant luminal obstruction. If a bruit extends into diastole or if a thrill is present, the obstruction is usually severe. Another cause of an arterial bruit is an arteriovenous fistula with enhanced flow.
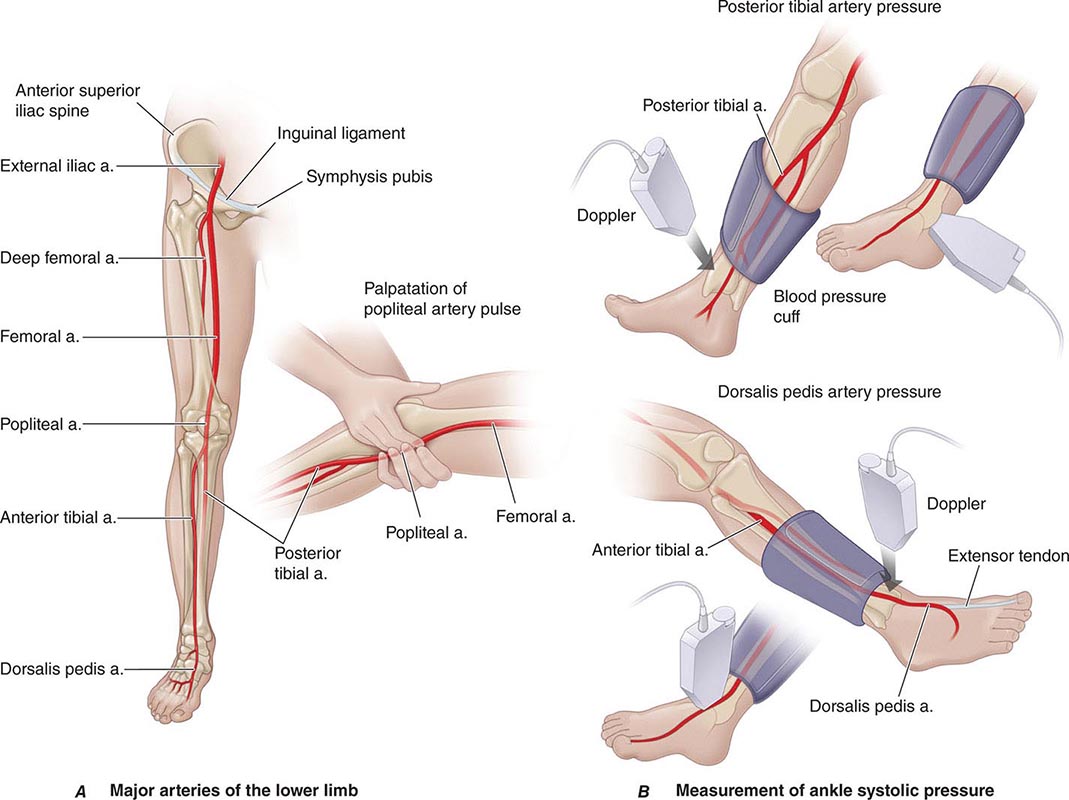
FIGURE 267-3 A. Anatomy of the major arteries of the leg. B. Measurement of the ankle systolic pressure. (From NA Khan et al: JAMA 295:536, 2006.)
The likelihood of significant lower extremity peripheral arterial disease increases with typical symptoms of claudication, cool skin, abnormalities on pulse examination, or the presence of a vascular bruit. Abnormal pulse oximetry (a >2% difference between finger and toe oxygen saturation) can be used to detect lower extremity peripheral arterial disease and is comparable in its performance characteristics to the ankle-brachial index.
Inspection and Palpation of the Heart The left ventricular apex beat may be visible in the midclavicular line at the fifth intercostal space in thin-chested adults. Visible pulsations anywhere other than this expected location are abnormal. The left anterior chest wall may heave in patients with an enlarged or hyperdynamic left or right ventricle. As noted previously, a visible right upper parasternal pulsation may be suggestive of ascending aortic aneurysm disease. In thin, tall patients and patients with advanced obstructive lung disease and flattened diaphragms, the cardiac impulse may be visible in the epigastrium and should be distinguished from a pulsatile liver edge.
Palpation of the heart begins with the patient in the supine position at 30° and can be enhanced by placing the patient in the left lateral decubitus position. The normal left ventricular impulse is less than 2 cm in diameter and moves quickly away from the fingers; it is better appreciated at end expiration, with the heart closer to the anterior chest wall. Characteristics such as size, amplitude, and rate of force development should be noted.
Enlargement of the left ventricular cavity is manifested by a leftward and downward displacement of an enlarged apex beat. A sustained apex beat is a sign of pressure overload, such as that which may be present in patients with AS or chronic hypertension. A palpable presystolic impulse corresponds to the fourth heart sound (S4) and is indicative of reduced left ventricular compliance and the forceful contribution of atrial contraction to ventricular filling. A palpable third sound (S3), which is indicative of a rapid early filling wave in patients with heart failure, may be present even when the gallop itself is not audible. A large left ventricular aneurysm may sometimes be palpable as an ectopic impulse, discrete from the apex beat. HOCM may very rarely cause a triple cadence beat at the apex with contributions from a palpable S4 and the two components of the bisferiens systolic pulse.
Right ventricular pressure or volume overload may create a sternal lift. Signs of either TR (cv waves in the jugular venous pulse) and/or pulmonary arterial hypertension (a loud single or palpable P2) would be confirmatory. The right ventricle can enlarge to the extent that left-sided events cannot be appreciated. A zone of retraction between the right and left ventricular impulses sometimes can be appreciated in patients with right ventricle pressure or volume overload when they are placed in the left lateral decubitus position. Systolic and diastolic thrills signify turbulent and high-velocity blood flow. Their locations help identify the origin of heart murmurs.
CARDIAC AUSCULTATION
Heart Sounds Ventricular systole is defined by the interval between the first (S1) and second (S2) heart sounds (Fig. 267-4). The first heart sound (S1) includes mitral and tricuspid valve closure. Normal splitting can be appreciated in young patients and those with right bundle branch block, in whom tricuspid valve closure is relatively delayed. The intensity of S1 is determined by the distance over which the anterior leaflet of the mitral valve must travel to return to its annular plane, leaflet mobility, left ventricular contractility, and the PR interval. S1 is classically loud in the early phases of rheumatic mitral stenosis (MS) and in patients with hyperkinetic circulatory states or short PR intervals. S1 becomes softer in the later stages of MS when the leaflets are rigid and calcified, after exposure to β-adrenergic receptor blockers, with long PR intervals, and with left ventricular contractile dysfunction. The intensity of heart sounds, however, can be reduced by any process that increases the distance between the stethoscope and the responsible cardiac event, including mechanical ventilation, obstructive lung disease, obesity, pneumothorax, and a pericardial effusion.
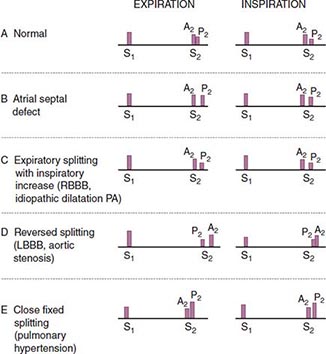
FIGURE 267-4 Heart sounds. A. Normal. S1, first heart sound; S2, second heart sound; A2, aortic component of the second heart sound; P2, pulmonic component of the second heart sound. B. Atrial septal defect with fixed splitting of S2. C. Physiologic but wide splitting of S2 with right bundle branch block (RBBB). PA, pulmonary artery. D. Reversed or paradoxical splitting of S2 with left bundle branch block (LBBB). E. Narrow splitting of S2 with pulmonary hypertension. (From NO Fowler: Diagnosis of Heart Disease. New York, Springer-Verlag, 1991, p 31.)
Aortic and pulmonic valve closure constitutes the second heart sound (S2). With normal or physiologic splitting, the A2–P2 interval increases with inspiration and narrows during expiration. This physiologic interval will widen with right bundle branch block because of the further delay in pulmonic valve closure and in patients with severe MR because of the premature closure of the aortic valve. An unusually narrowly split or even a singular S2 is a feature of pulmonary arterial hypertension. Fixed splitting of S2, in which the A2–P2 interval is wide and does not change during the respiratory cycle, occurs in patients with a secundum atrial septal defect. Reversed or paradoxical splitting refers to a pathologic delay in aortic valve closure, such as that which occurs in patients with left bundle branch block, right ventricular pacing, severe AS, HOCM, and acute myocardial ischemia. With reversed or paradoxical splitting, the individual components of S2 are audible at end expiration, and their interval narrows with inspiration, the opposite of what would be expected under normal physiologic conditions. P2 is considered loud when its intensity exceeds that of A2 at the base, when it can be palpated in the area of the proximal main pulmonary artery (second left interspace), or when both components of S2 can be appreciated at the lower left sternal border or apex. The intensity of A2 and P2 decreases with aortic and pulmonic stenosis, respectively. In these conditions, a single S2 may result.
Systolic Sounds An ejection sound is a high-pitched early systolic sound that corresponds in timing to the upstroke of the carotid pulse. It usually is associated with congenital bicuspid aortic or pulmonic valve disease; however, ejection sounds are also sometimes audible in patients with isolated aortic or pulmonary root dilation and normal semilunar valves. The ejection sound that accompanies bicuspid aortic valve disease becomes softer and then inaudible as the valve calcifies and becomes more rigid. The ejection sound that accompanies pulmonic stenosis (PS) moves closer to the first heart sound as the severity of the stenosis increases. In addition, the pulmonic ejection sound is the only right-sided acoustic event that decreases in intensity with inspiration. Ejection sounds are often heard more easily at the lower left sternal border than they are at the base. Nonejection sounds (clicks), which occur after the onset of the carotid upstroke, are related to MVP and may be single or multiple. The nonejection click may introduce a murmur. This click-murmur complex will move away from the first heart sound with maneuvers that increase ventricular preload, such as squatting. On standing, the click and murmur move closer to S1.
Diastolic Sounds The high-pitched opening snap (OS) of MS occurs after a very short interval after the second heart sound. The A2–OS interval is inversely proportional to the height of the left atrial–left ventricular diastolic pressure gradient. The intensity of both S1 and the OS of MS decreases with progressive calcification and rigidity of the anterior mitral leaflets. The pericardial knock (PK) is also high-pitched and occurs slightly later than the OS, corresponding in timing to the abrupt cessation of ventricular expansion after tricuspid valve opening and to an exaggerated y descent seen in the jugular venous waveform in patients with constrictive pericarditis. A tumor plop is a lower-pitched sound that rarely can be heard in patients with atrial myxoma. It may be appreciated only in certain positions and arises from the diastolic prolapse of the tumor across the mitral valve.
The third heart sound (S3) occurs during the rapid filling phase of ventricular diastole. It can be a normal finding in children, adolescents, and young adults; however, in older patients, it signifies heart failure. A left-sided S3 is a low-pitched sound best heard over the left ventricular (LV) apex. A right-sided S3 is usually better heard over the lower left sternal border and becomes louder with inspiration. A left-sided S3 in patients with chronic heart failure is predictive of cardiovascular morbidity and mortality. Interestingly, an S3 is equally prevalent among heart failure patients with and without LV systolic dysfunction.
The fourth heart sound (S4) occurs during the atrial filling phase of ventricular diastole and indicates LV presystolic expansion. An S4 is more common among patients who derive significant benefit from the atrial contribution to ventricular filling, such as those with chronic LV hypertrophy or active myocardial ischemia. An S4 is not present with atrial fibrillation.
Cardiac Murmurs Heart murmurs result from audible vibrations that are caused by increased turbulence and are defined by their timing within the cardiac cycle. Not all murmurs are indicative of structural heart disease, and the accurate identification of a benign or functional systolic murmur often can obviate the need for additional testing in healthy subjects. The duration, frequency, configuration, and intensity of a heart murmur are dictated by the magnitude, variability, and duration of the responsible pressure difference between two cardiac chambers, the two ventricles, or the ventricles and their respective great arteries. The intensity of a heart murmur is graded on a scale of 1 to 6; a thrill is present with murmurs of grade 4 or greater intensity. Other attributes of the murmur that aid in its accurate identification include its location, radiation, and response to bedside maneuvers. Although clinicians can detect and correctly identify heart murmurs with only fair reliability, a careful and complete bedside examination usually can identify individuals with valvular heart disease for whom transthoracic echocardiography and clinical follow-up are indicated and exclude subjects for whom no further evaluation is necessary.
Systolic murmurs can be early, mid, late, or holosystolic in timing (Fig. 267-5). Acute severe MR results in a decrescendo early systolic murmur, the characteristics of which are related to the progressive attenuation of the left ventricular to left atrial pressure gradient during systole because of the steep and rapid rise in left atrial pressure in this context. Severe MR associated with posterior leaflet prolapse or flail radiates anteriorly and to the base, where it can be confused with the murmur of AS. MR that is due to anterior leaflet involvement radiates posteriorly and to the axilla. With acute TR in patients with normal pulmonary artery pressures, an early systolic murmur that may increase in intensity with inspiration may be heard at the left lower sternal border, with regurgitant cv waves visible in the jugular venous pulse.
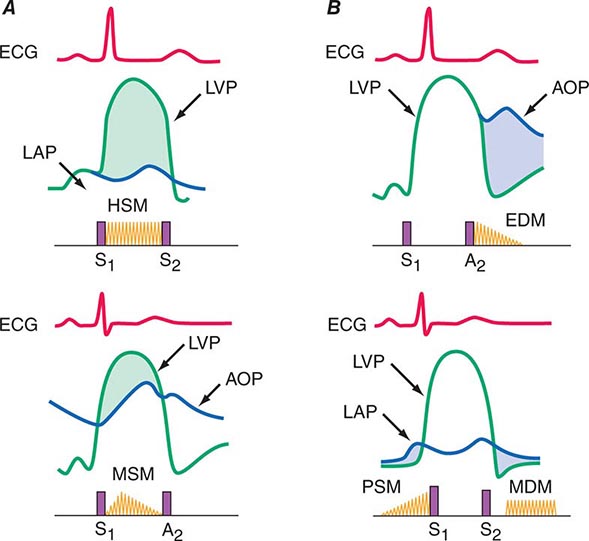
FIGURE 267-5 A. Top. Graphic representation of the systolic pressure difference (green shaded area) between left ventricle and left atrium with phonocardiographic recording of a holosystolic murmur (HSM) indicative of mitral regurgitation. ECG, electrocardiogram; LAP, left atrial pressure; LVP, left ventricular pressure; S1, first heart sound; S2 second heart sound. Bottom. Graphic representation of the systolic pressure gradient (green shaded area) between left ventricle and aorta in patient with aortic stenosis. A midsystolic murmur (MSM) with a crescendo-decrescendo configuration is recorded. AOP, aortic pressure. B. Top. Graphic representation of the diastolic pressure difference between the aorta and left ventricle (blue shaded area) in a patient with aortic regurgitation, resulting in a decrescendo, early diastolic murmur (EDM) beginning with A2. Bottom. Graphic representation of the diastolic left atrial–left ventricular gradient (blue areas) in a patient with mitral stenosis with a mid-diastolic murmur (MDM) and late presystolic murmurs (PSM).
A midsystolic murmur begins after S1 and ends before S2; it is typically crescendo-decrescendo in configuration. AS is the most common cause of a midsystolic murmur in an adult. It is often difficult to estimate the severity of the valve lesion on the basis of the physical examination findings, especially in older hypertensive patients with stiffened carotid arteries or patients with low cardiac output in whom the intensity of the systolic heart murmur is misleadingly soft. Examination findings consistent with severe AS would include parvus et tardus carotid upstrokes, a late-peaking grade 3 or greater midsystolic murmur, a soft A2, a sustained LV apical impulse, and an S4. It is sometimes difficult to distinguish aortic sclerosis from more advanced degrees of valve stenosis. The former is defined by focal thickening and calcification of the aortic valve leaflets that is not severe enough to result in obstruction. These valve changes are associated with a Doppler jet velocity across the aortic valve of 2.5 m/s or less. Patients with aortic sclerosis can have grade 2 or 3 midsystolic murmurs identical in their acoustic characteristics to the murmurs heard in patients with more advanced degrees of AS. Other causes of a midsystolic heart murmur include pulmonic valve stenosis (with or without an ejection sound), HOCM, increased pulmonary blood flow in patients with a large atrial septal defect and left-to-right shunting, and several states associated with accelerated blood flow in the absence of structural heart disease, such as fever, thyrotoxicosis, pregnancy, anemia, and normal childhood/adolescence.
The murmur of HOCM has features of both obstruction to LV outflow and MR, as would be expected from knowledge of the pathophysiology of this condition. The systolic murmur of HOCM usually can be distinguished from other causes on the basis of its response to bedside maneuvers, including Valsalva, passive leg raising, and standing/squatting. In general, maneuvers that decrease LV preload (or increase LV contractility) will cause the murmur to intensify, whereas maneuvers that increase LV preload or afterload will cause a decrease in the intensity of the murmur. Accordingly, the systolic murmur of HOCM becomes louder during the strain phase of the Valsalva maneuver and after standing quickly from a squatting position. The murmur becomes softer with passive leg raising and when squatting. The murmur of AS is typically loudest in the second right interspace with radiation into the carotids, whereas the murmur of HOCM is best heard between the lower left sternal border and the apex. The murmur of PS is best heard in the second left interspace. The midsystolic murmur associated with enhanced pulmonic blood flow in the setting of a large atrial septal defect (ASD) is usually loudest at the mid-left sternal border.
A late systolic murmur, heard best at the apex, indicates MVP. As previously noted, the murmur may or may not be introduced by a nonejection click. Differential radiation of the murmur, as previously described, may help identify the specific leaflet involved by the myxomatous process. The click-murmur complex behaves in a manner directionally similar to that demonstrated by the murmur of HOCM during the Valsalva and stand/squat maneuvers (Fig. 267-6). The murmur of MVP can be identified by the accompanying nonejection click.
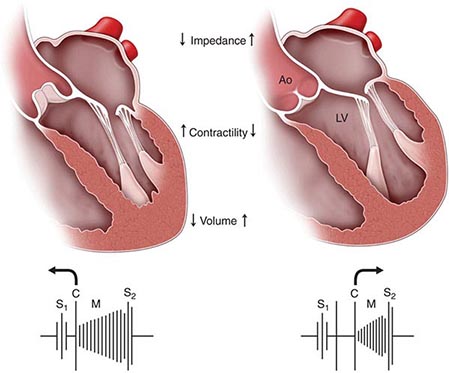
FIGURE 267-6 Behavior of the click (C) and murmur (M) of mitral valve prolapse with changes in loading (volume, impedance) and contractility. S1, first heart sound; S2, second heart sound. With standing (left side of figure), volume and impedance decrease, as a result of which the click and murmur move closer to S1. With squatting (right), the click and murmur move away from S1 due to the increases in left ventricular volume and impedance (afterload). Ao, aorta; LV, left ventricle. (Adapted from RA O’Rourke, MH Crawford: Curr Prob Cardiol 1:9, 1976.)
Holosystolic murmurs are plateau in configuration and reflect a continuous and wide pressure gradient between the left ventricle and left atrium with chronic MR, the left ventricle and right ventricle with a ventricular septal defect (VSD), and the right ventricle and right atrium with TR. In contrast to acute MR, in chronic MR the left atrium is enlarged and its compliance is normal or increased to the extent that there is little if any further increase in left atrial pressure from any increase in regurgitant volume. The murmur of MR is best heard over the cardiac apex. The intensity of the murmur increases with maneuvers that increase LV afterload, such as sustained hand grip. The murmur of a VSD (without significant pulmonary hypertension) is holosystolic and loudest at the mid-left sternal border, where a thrill is usually present. The murmur of TR is loudest at the lower left sternal border, increases in intensity with inspiration (Carvallo’s sign), and is accompanied by visible cv waves in the jugular venous wave form and, on occasion, by pulsatile hepatomegaly.
Diastolic Murmurs In contrast to some systolic murmurs, diastolic heart murmurs always signify structural heart disease (Fig. 267-5). The murmur associated with acute, severe AR is relatively soft and of short duration because of the rapid rise in LV diastolic pressure and the progressive diminution of the aortic-LV diastolic pressure gradient. In contrast, the murmur of chronic severe AR is classically heard as a decrescendo, blowing diastolic murmur along the left sternal border in patients with primary valve pathology and sometimes along the right sternal border in patients with primary aortic root pathology. With chronic AR, the pulse pressure is wide and the arterial pulses are bounding in character. These signs of significant diastolic run-off are absent in the acute phase. The murmur of pulmonic regurgitation is also heard along the left sternal border. It is most commonly due to pulmonary hypertension and enlargement of the annulus of the pulmonic valve. S2 is single and loud and may be palpable. There is a right ventricular/parasternal lift that is indicative of chronic right ventricular pressure overload. A less impressive murmur of PR is present after repair of tetralogy of Fallot or pulmonic valve atresia. In this postoperative setting, the murmur is softer and lower-pitched, and the severity of the accompanying pulmonic regurgitation can be underestimated significantly.
MS is the classic cause of a mid- to late diastolic murmur, which is best heard over the apex in the left lateral decubitus position, is low-pitched or rumbling, and is introduced by an OS in the early stages of the rheumatic disease process. Presystolic accentuation refers to an increase in the intensity of the murmur just before the first heart sound and occurs in patients with sinus rhythm. It is absent in patients with atrial fibrillation. The auscultatory findings in patients with rheumatic tricuspid stenosis typically are obscured by left-sided events, although they are similar in nature to those described in patients with MS. “Functional” mitral or tricuspid stenosis refers to the generation of mid-diastolic murmurs that are created by increased and accelerated transvalvular diastolic flow, even in the absence of valvular obstruction, in the setting of severe MR, severe TR, or a large ASD with left-to-right shunting. The Austin Flint murmur of chronic severe AR is a low-pitched mid- to late apical diastolic murmur that sometimes can be confused with MS. The Austin Flint murmur typically decreases in intensity after exposure to vasodilators, whereas the murmur of MS may be accompanied by an opening snap and also may increase in intensity after vasodilators because of the associated increase in cardiac output. Unusual causes of a mid-diastolic murmur include atrial myxoma, complete heart block, and acute rheumatic mitral valvulitis.
Continuous Murmur A continuous murmur is predicated on a pressure gradient that persists between two cardiac chambers or blood vessels across systole and diastole. The murmurs typically begin in systole, envelop the second heart sound (S2), and continue through some portion of diastole. They can often be difficult to distinguish from individual systolic and diastolic murmurs in patients with mixed valvular heart disease. The classic example of a continuous murmur is that associated with a PDA, which usually is heard in the second or third interspace at a slight distance from the sternal border. Other causes of a continuous murmur include a ruptured sinus of Valsalva aneurysm with creation of an aortic–right atrial or right ventricular fistula, a coronary or great vessel arteriovenous fistula, and an arteriovenous fistula constructed to provide dialysis access. There are two types of benign continuous murmurs. The cervical venous hum is heard in children or adolescents in the supraclavicular fossa. It can be obliterated with firm pressure applied to the diaphragm of the stethoscope, especially when the subject turns his or her head toward the examiner. The mammary soufflé of pregnancy relates to enhanced arterial blood flow through engorged breasts. The diastolic component of the murmur can be obliterated with firm pressure over the stethoscope.
Dynamic Auscultation Diagnostic accuracy can be enhanced by the performance of simple bedside maneuvers to identify heart murmurs and characterize their significance (Table 267-1). Except for the pulmonic ejection sound, right-sided events increase in intensity with inspiration and decrease with expiration; left-sided events behave oppositely (100% sensitivity, 88% specificity). As previously noted, the intensity of the murmurs associated with MR, VSD, and AR will increase in response to maneuvers that increase LV afterload, such as hand grip and vasopressors. The intensity of these murmurs will decrease after exposure to vasodilating agents. Squatting is associated with an abrupt increase in LV preload and afterload, whereas rapid standing results in a sudden decrease in preload. In patients with MVP, the click and murmur move away from the first heart sound with squatting because of the delay in onset of leaflet prolapse at higher ventricular volumes. With rapid standing, however, the click and murmur move closer to the first heart sound as prolapse occurs earlier in systole at a smaller chamber dimension. The murmur of HOCM behaves similarly, becoming softer and shorter with squatting (95% sensitivity, 85% specificity) and longer and louder on rapid standing (95% sensitivity, 84% specificity). A change in the intensity of a systolic murmur in the first beat after a premature beat or in the beat after a long cycle length in patients with atrial fibrillation suggests valvular AS rather than MR, particularly in an older patient in whom the murmur of the AS may be well transmitted to the apex (Gallavardin effect). Of note, however, the systolic murmur of HOCM also increases in intensity in the beat after a premature beat. This increase in intensity of any LV outflow murmur in the beat after a premature beat relates to the combined effects of enhanced LV filling (from the longer diastolic period) and postextrasystolic potentiation of LV contractile function. In either instance, forward flow will accelerate, causing an increase in the gradient across the LV outflow tract (dynamic or fixed) and a louder systolic murmur. In contrast, the intensity of the murmur of MR does not change in a postpremature beat, because there is relatively little change in the nearly constant LV to left atrial pressure gradient or further alteration in mitral valve flow. Bedside exercise can sometimes be performed to increase cardiac output and, secondarily, the intensity of both systolic and diastolic heart murmurs. Most left-sided heart murmurs decrease in intensity and duration during the strain phase of the Valsalva maneuver. The murmurs associated with MVP and HOCM are the two notable exceptions. The Valsalva maneuver also can be used to assess the integrity of the heart and vasculature in the setting of advanced heart failure.
|
EFFECTS OF PHYSIOLOGIC AND PHARMACOLOGIC INTERVENTIONS ON THE INTENSITY OF HEART MURMURS AND SOUNDS |
Abbreviations: AF, atrial fibrillation; AR, aortic regurgitation; HOCM, hypertrophic obstructive cardiomyopathy; MR, mitral regurgitation; MS, mitral stenosis; MVP, mitral valve prolapse; PES, pulmonic ejection sound; PR, pulmonic regurgitation; PS, pulmonic stenosis; TR, tricuspid regurgitation; TS, tricuspid stenosis; VPB, ventricular premature beat; VSD, ventricular septal defect.
Prosthetic Heart Valves The first clue that prosthetic valve dysfunction may contribute to recurrent symptoms is frequently a change in the quality of the heart sounds or the appearance of a new murmur. The heart sounds with a bioprosthetic valve resemble those generated by native valves. A mitral bioprosthesis usually is associated with a grade 2 or 3 midsystolic murmur along the left sternal border (created by turbulence across the valve struts as they project into the LV outflow tract) as well as by a soft mid-diastolic murmur that occurs with normal LV filling. This diastolic murmur often can be heard only in the left lateral decubitus position and after exercise. A high pitched or holosystolic apical murmur is indicative of pathologic MR due to a paravalvular leak and/or intra-annular bioprosthetic regurgitation from leaflet degeneration, for which additional imaging is usually indicated. Clinical deterioration can occur rapidly after the first expression of mitral bioprosthetic failure. A tissue valve in the aortic position is always associated with a grade 2 to 3 midsystolic murmur at the base or just below the suprasternal notch. A diastolic murmur of AR is abnormal in any circumstance. Mechanical valve dysfunction may first be suggested by a decrease in the intensity of either the opening or the closing sound. A high-pitched apical systolic murmur in patients with a mechanical mitral prosthesis and a diastolic decrescendo murmur in patients with a mechanical aortic prosthesis indicate paravalvular regurgitation. Patients with prosthetic valve thrombosis may present clinically with signs of shock, muffled heart sounds, and soft murmurs.
Pericardial Disease A pericardial friction rub is nearly 100% specific for the diagnosis of acute pericarditis, although the sensitivity of this finding is not nearly as high, because the rub may come and go over the course of an acute illness or be very difficult to elicit. The rub is heard as a leathery or scratchy three-component or two-component sound, although it may be monophasic. Classically, the three components are ventricular systole, rapid early diastolic filling, and late presystolic filling after atrial contraction in patients in sinus rhythm. It is necessary to listen to the heart in several positions. Additional clues may be present from the history and 12-lead electrocardiogram. The rub typically disappears as the volume of any pericardial effusion increases. Pericardial tamponade can be diagnosed with a sensitivity of 98%, a specificity of 83%, and a positive likelihood ratio of 5.9 (95% confidence interval 2.4–14) by a pulsus paradoxus that exceeds 12 mmHg in a patient with a large pericardial effusion.
The findings on physical examination are integrated with the symptoms previously elicited with a careful history to construct an appropriate differential diagnosis and proceed with indicated imaging and laboratory assessment. The physical examination is an irreplaceable component of the diagnostic algorithm and in selected patients can inform prognosis. Educational efforts to improve clinician competence eventually may result in cost saving, particularly if the indications for imaging can be influenced by the examination findings.
268 |
Electrocardiography |
An electrocardiogram (ECG or EKG) is a graphic recording of electric potentials generated by the heart. The signals are detected by means of metal electrodes attached to the extremities and chest wall and then are amplified and recorded by the electrocardiograph. ECG leads actually display the instantaneous differences in potential between the electrodes.
The clinical utility of the ECG derives from its immediate availability as a noninvasive, inexpensive, and highly versatile test. In addition to its use in detecting arrhythmias, conduction disturbances, and myocardial ischemia, electrocardiography may reveal findings related to life-threatening metabolic disturbances (e.g., hyperkalemia) or increased susceptibility to sudden cardiac death (e.g., QT prolongation syndromes).
ELECTROPHYSIOLOGY
(See also Chaps. 274 and 276) Depolarization of the heart is the initiating event for cardiac contraction. The electric currents that spread through the heart are produced by three components: cardiac pacemaker cells, specialized conduction tissue, and the heart muscle itself. The ECG, however, records only the depolarization (stimulation) and repolarization (recovery) potentials generated by the “working” atrial and ventricular myocardium.
The depolarization stimulus for the normal heartbeat originates in the sinoatrial (SA) node (Fig. 268-1), or sinus node, a collection of pacemaker cells. These cells fire spontaneously; that is, they exhibit automaticity. The first phase of cardiac electrical activation is the spread of the depolarization wave through the right and left atria, followed by atrial contraction. Next, the impulse stimulates pacemaker and specialized conduction tissues in the atrioventricular (AV) nodal and His-bundle areas; together, these two regions constitute the AV junction. The bundle of His bifurcates into two main branches, the right and left bundles, which rapidly transmit depolarization wavefronts to the right and left ventricular myocardium by way of Purkinje fibers. The main left bundle bifurcates into two primary subdivisions: a left anterior fascicle and a left posterior fascicle. The depolarization wavefronts then spread through the ventricular wall, from endocardium to epicardium, triggering ventricular contraction.
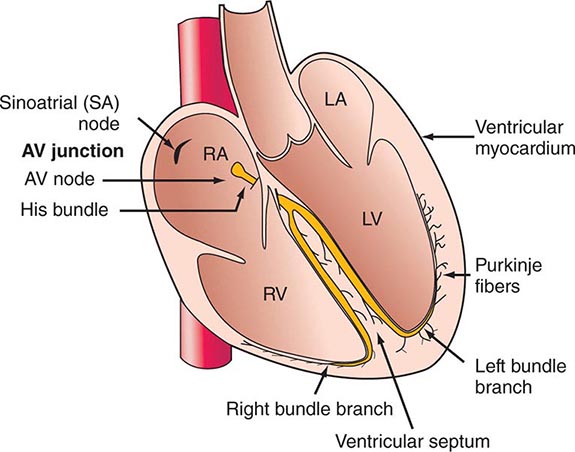
FIGURE 268-1 Schematic of the cardiac conduction system.
Since the cardiac depolarization and repolarization waves have direction and magnitude, they can be represented by vectors. Vector analysis illustrates a central concept of electrocardiography: The ECG records the complex spatial and temporal summation of electrical potentials from multiple myocardial fibers conducted to the surface of the body. This principle accounts for inherent limitations in both ECG sensitivity (activity from certain cardiac regions may be canceled out or may be too weak to be recorded) and specificity (the same vectorial sum can result from either a selective gain or a loss of forces in opposite directions).
ECG WAVEFORMS AND INTERVALS
The ECG waveforms are labeled alphabetically, beginning with the P wave, which represents atrial depolarization (Fig. 268-2). The QRS complex represents ventricular depolarization, and the ST-T-U complex (ST segment, T wave, and U wave) represents ventricular repolarization. The J point is the junction between the end of the QRS complex and the beginning of the ST segment. Atrial repolarization (STa and Ta) is usually too low in amplitude to be detected, but it may become apparent in conditions such as acute pericarditis and atrial infarction.
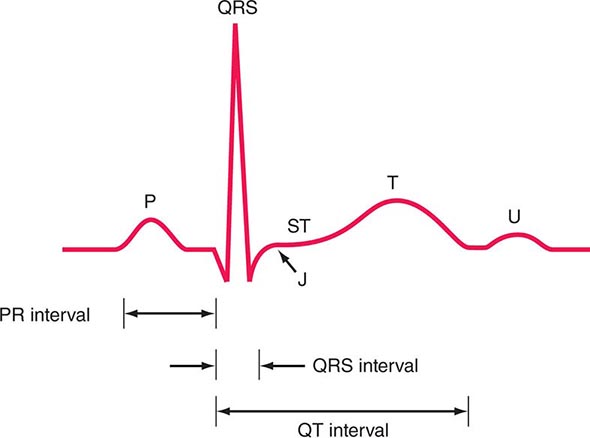
FIGURE 268-2 Basic ECG waveforms and intervals. Not shown is the RR interval, the time between consecutive QRS complexes.
The QRS-T waveforms of the surface ECG correspond in a general way with the different phases of simultaneously obtained ventricular action potentials, the intracellular recordings from single myocardial fibers (Chap. 274). The rapid upstroke (phase 0) of the action potential corresponds to the onset of QRS. The plateau (phase 2) corresponds to the isoelectric ST segment, and active repolarization (phase 3) corresponds to the inscription of the T wave. Factors that decrease the slope of phase 0 by impairing the influx of Na+ (e.g., hyperkalemia and drugs such as flecainide) tend to increase QRS duration. Conditions that prolong phase 2 (amiodarone, hypocalcemia) increase the QT interval. In contrast, shortening of ventricular repolarization (phase 2), such as by digitalis administration or hypercalcemia, abbreviates the ST segment.
The ECG ordinarily is recorded on special graph paper that is divided into 1-mm2 gridlike boxes. Since the usual ECG paper speed is 25 mm/s, the smallest (1 mm) horizontal divisions correspond to 0.04 (40 ms), with heavier lines at intervals of 0.20 s (200 ms). Vertically, the ECG graph measures the amplitude of a specific wave or deflection (1 mV = 10 mm with standard calibration; the voltage criteria for hypertrophy mentioned below are given in millimeters). There are four major ECG intervals: RR, PR, QRS, and QT (Fig. 268-2). The heart rate (beats per minute) can be computed readily from the interbeat (RR) interval by dividing the number of large (0.20 s) time units between consecutive R waves into 300 or the number of small (0.04 s) units into 1500. The PR interval measures the time (normally 120–200 ms) between atrial and ventricular depolarization, which includes the physiologic delay imposed by stimulation of cells in the AV junction area. The QRS interval (normally 100–110 ms or less) reflects the duration of ventricular depolarization. The QT interval includes both ventricular depolarization and repolarization times and varies inversely with the heart rate. A rate-related (“corrected”) QT interval, QTc, can be calculated as QT/√RR and normally is ≤0.44 s. (Some references give QTc upper normal limits as 0.43 s in men and 0.45 s in women. Also, a number of different formulas have been proposed, without consensus, for calculating the QTc.)
The QRS complex is subdivided into specific deflections or waves. If the initial QRS deflection in a particular lead is negative, it is termed a Q wave; the first positive deflection is termed an R wave. A negative deflection after an R wave is an S wave. Subsequent positive or negative waves are labeled R′ and S′, respectively. Lowercase letters (qrs) are used for waves of relatively small amplitude. An entirely negative QRS complex is termed a QS wave.
ECG LEADS
The 12 conventional ECG leads record the difference in potential between electrodes placed on the surface of the body. These leads are divided into two groups: six limb (extremity) leads and six chest (precordial) leads. The limb leads record potentials transmitted onto the frontal plane (Fig. 268-3A), and the chest leads record potentials transmitted onto the horizontal plane (Fig. 268-3B).
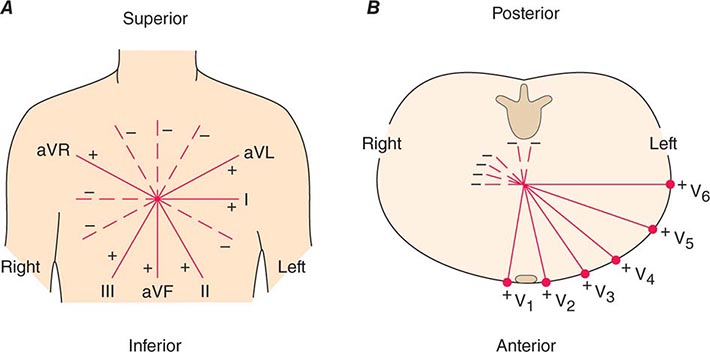
FIGURE 268-3 The six frontal plane (A) and six horizontal plane (B) leads provide a three-dimensional representation of cardiac electrical activity.
The spatial orientation and polarity of the six frontal plane leads is represented on the hexaxial diagram (Fig. 268-4). The six chest leads (Fig. 268-5) are unipolar recordings obtained by electrodes in the following positions: lead V1, fourth intercostal space, just to the right of the sternum; lead V2, fourth intercostal space, just to the left of the sternum; lead V3, midway between V2 and V4; lead V4, midclavicular line, fifth intercostal space; lead V5, anterior axillary line, same level as V4; and lead V6, midaxillary line, same level as V4 and V5. Additional posterior leads are sometimes placed on the same horizontal plane as V4 to facilitate detection of acute posterolateral infarction (V7, midaxillary line; V8 posterior axillary line; and V9, posterior scapular line).
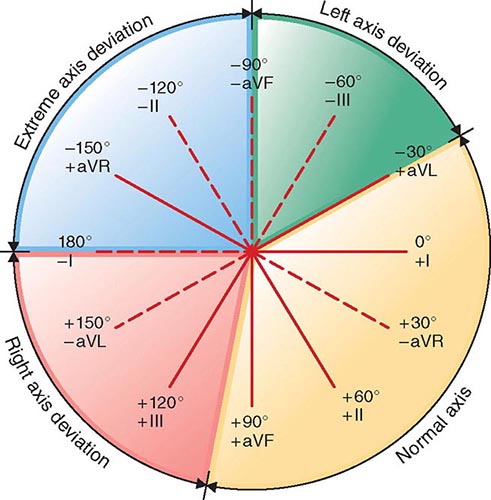
FIGURE 268-4 The frontal plane (limb or extremity) leads are represented on a hexaxial diagram. Each ECG lead has a specific spatial orientation and polarity. The positive pole of each lead axis (solid line) and the negative pole (hatched line) are designated by their angular position relative to the positive pole of lead I (0°). The mean electrical axis of the QRS complex is measured with respect to this display.
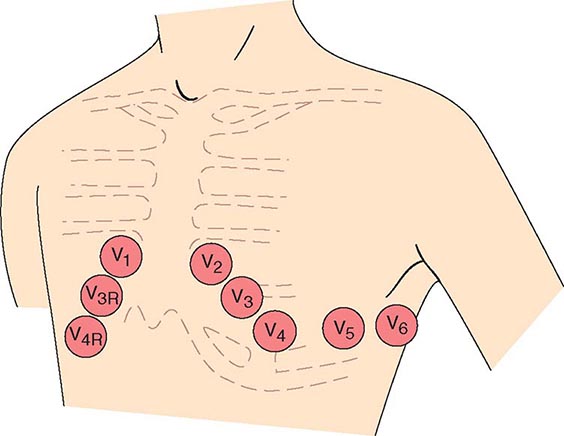
FIGURE 268-5 The horizontal plane (chest or precordial) leads are obtained with electrodes in the locations shown.
Together, the frontal and horizontal plane electrodes provide a three-dimensional representation of cardiac electrical activity. Each lead can be likened to a different video camera angle “looking” at the same events—atrial and ventricular depolarization and repolarization—from different spatial orientations. The conventional 12-lead ECG can be supplemented with additional leads in special circumstances. For example, right precordial leads V3R, V4R, etc., are useful in detecting evidence of acute right ventricular ischemia. Bedside monitors and ambulatory ECG (Holter) recordings usually employ only one or two modified leads. Intracardiac electrocardiography and electrophysiologic testing are discussed in Chaps. 274 and 276.
The ECG leads are configured so that a positive (upright) deflection is recorded in a lead if a wave of depolarization spreads toward the positive pole of that lead, and a negative deflection is recorded if the wave spreads toward the negative pole. If the mean orientation of the depolarization vector is at right angles to a particular lead axis, a biphasic (equally positive and negative) deflection will be recorded.
GENESIS OF THE NORMAL ECG
P WAVE
The normal atrial depolarization vector is oriented downward and toward the subject’s left, reflecting the spread of depolarization from the sinus node to the right and then the left atrial myocardium. Since this vector points toward the positive pole of lead II and toward the negative pole of lead aVR, the normal P wave will be positive in lead II and negative in lead aVR. By contrast, activation of the atria from an ectopic pacemaker in the lower part of either atrium or in the AV junction region may produce retrograde P waves (negative in lead II, positive in lead aVR). The normal P wave in lead V1 may be biphasic with a positive component reflecting right atrial depolarization, followed by a small (<1 mm2) negative component reflecting left atrial depolarization.
QRS COMPLEX
Normal ventricular depolarization proceeds as a rapid, continuous spread of activation wave fronts. This complex process can be divided into two major sequential phases, and each phase can be represented by a mean vector (Fig. 268-6). The first phase is depolarization of the interventricular septum from the left to the right and anteriorly (vector 1). The second results from the simultaneous depolarization of the right and left ventricles; it normally is dominated by the more massive left ventricle, so that vector 2 points leftward and posteriorly. Therefore, a right precordial lead (V1) will record this biphasic depolarization process with a small positive deflection (septal r wave) followed by a larger negative deflection (S wave). A left precordial lead, e.g., V6, will record the same sequence with a small negative deflection (septal q wave) followed by a relatively tall positive deflection (R wave). Intermediate leads show a relative increase in R-wave amplitude (normal R-wave progression) and a decrease in S-wave amplitude progressing across the chest from right to left. The precordial lead where the R and S waves are of approximately equal amplitude is referred to as the transition zone (usually V3 or V4) (Fig. 268-7).
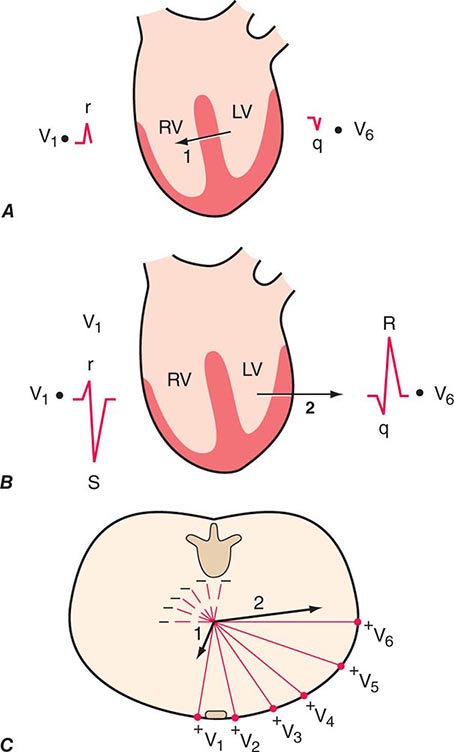
FIGURE 268-6 Ventricular depolarization can be divided into two major phases, each represented by a vector. A. The first phase (arrow 1) denotes depolarization of the ventricular septum, beginning on the left side and spreading to the right. This process is represented by a small “septal” r wave in lead V1 and a small septal q wave in lead V6. B. Simultaneous depolarization of the left and right ventricles (LV and RV) constitutes the second phase. Vector 2 is oriented to the left and posteriorly, reflecting the electrical predominance of the LV. C. Vectors (arrows) representing these two phases are shown in reference to the horizontal plane leads. (After AL Goldberger et al: Goldberger’s Clinical Electrocardiography: A Simplified Approach, 8th ed. Philadelphia, Elsevier/Saunders, 2013.)
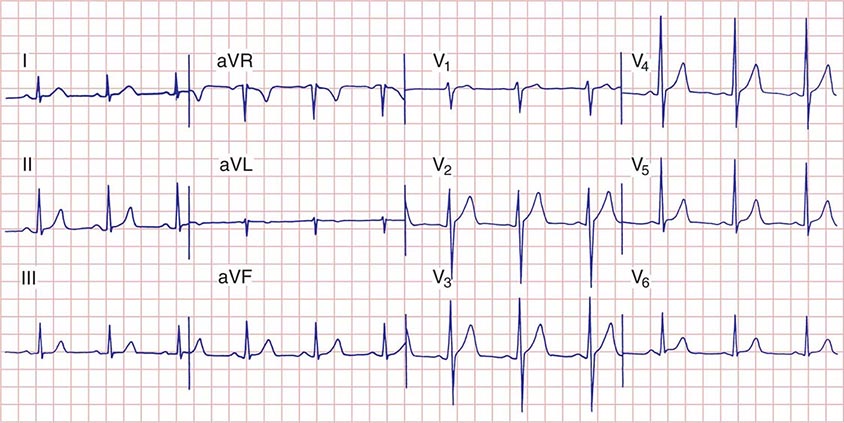
FIGURE 268-7 Normal electrocardiogram from a healthy subject. Sinus rhythm is present with a heart rate of 75 beats per minute. PR interval is 0.16 s; QRS interval (duration) is 0.08 s; QT interval is 0.36 s; QTc is 0.40 s; the mean QRS axis is about +70°. The precordial leads show normal R-wave progression with the transition zone (R wave = S wave) in lead V3.
The QRS pattern in the extremity leads may vary considerably from one normal subject to another depending on the electrical axis of the QRS, which describes the mean orientation of the QRS vector with reference to the six frontal plane leads. Normally, the QRS axis ranges from –30° to +100° (Fig. 268-4). An axis more negative than –30° is referred to as left axis deviation, and an axis more positive than +100° is referred to as right axis deviation. Left axis deviation may occur as a normal variant but is more commonly associated with left ventricular hypertrophy, a block in the anterior fascicle of the left bundle system (left anterior fascicular block or hemiblock), or inferior myocardial infarction. Right axis deviation also may occur as a normal variant (particularly in children and young adults), as a spurious finding due to reversal of the left and right arm electrodes, or in conditions such as right ventricular overload (acute or chronic), infarction of the lateral wall of the left ventricle, dextrocardia, left pneumothorax, and left posterior fascicular block.
T WAVE AND U WAVE
Normally, the mean T-wave vector is oriented roughly concordant with the mean QRS vector (within about 45° in the frontal plane). Since depolarization and repolarization are electrically opposite processes, this normal QRS–T-wave vector concordance indicates that repolarization normally must proceed in the reverse direction from depolarization (i.e., from ventricular epicardium to endocardium). The normal U wave is a small, rounded deflection (≤1 mm) that follows the T wave and usually has the same polarity as the T wave. An abnormal increase in U-wave amplitude is most commonly due to drugs (e.g., dofetilide, amiodarone, sotalol, quinidine) or to hypokalemia. Very prominent U waves are a marker of increased susceptibility to the torsades de pointes type of ventricular tachycardia (Chap. 276). Inversion of the U wave in the precordial leads is abnormal and may be a subtle sign of ischemia.
MAJOR ECG ABNORMALITIES
CARDIAC ENLARGEMENT AND HYPERTROPHY
Right atrial overload (acute or chronic) may lead to an increase in P-wave amplitude (≥2.5 mm) (Fig. 268-8), sometimes referred to as “P-pulmonale.” Left atrial overload typically produces a biphasic P wave in V1 with a broad negative component or a broad (≥120 ms), often notched P wave in one or more limb leads (Fig. 268-8). This pattern, previously referred to as “P-mitrale,” may also occur with left atrial conduction delays in the absence of actual atrial enlargement, leading to the more general designation of left atrial abnormality.
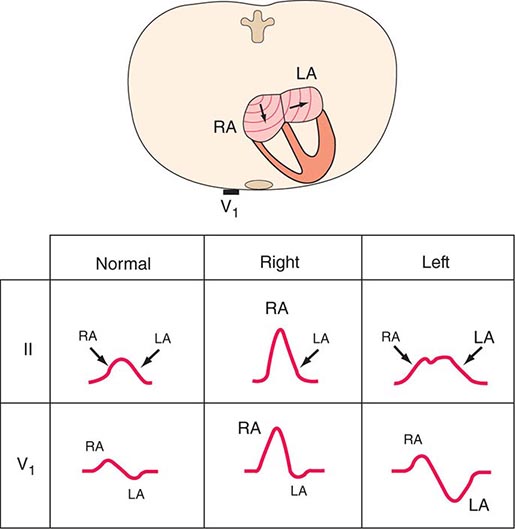
FIGURE 268-8 Right atrial (RA) overload may cause tall, peaked P waves in the limb or precordial leads. Left atrial (LA) abnormality may cause broad, often notched P waves in the limb leads and a biphasic P wave in lead V1 with a prominent negative component representing delayed depolarization of the LA. (After MK Park, WG Guntheroth: How to Read Pediatric ECGs, 4th ed. St. Louis, Mosby/Elsevier, 2006.)
Right ventricular hypertrophy due to a sustained, severe pressure load (e.g., due to tight pulmonic valve stenosis or certain pulmonary artery hypertension syndromes) is characterized by a relatively tall R wave in lead V1 (R ≥ S wave), usually with right axis deviation (Fig. 268-9); alternatively, there may be a qR pattern in V1 or V3R. ST depression and T-wave inversion in the right-to-midprecordial leads are also often present. This pattern, formerly called right ventricular “strain,” is attributed to repolarization abnormalities in acutely or chronically overloaded muscle. Prominent S waves may occur in the left lateral precordial leads. Right ventricular hypertrophy due to ostium secundum–type atrial septal defects, with the accompanying right ventricular volume overload, is commonly associated with an incomplete or complete right bundle branch block pattern with a rightward QRS axis.
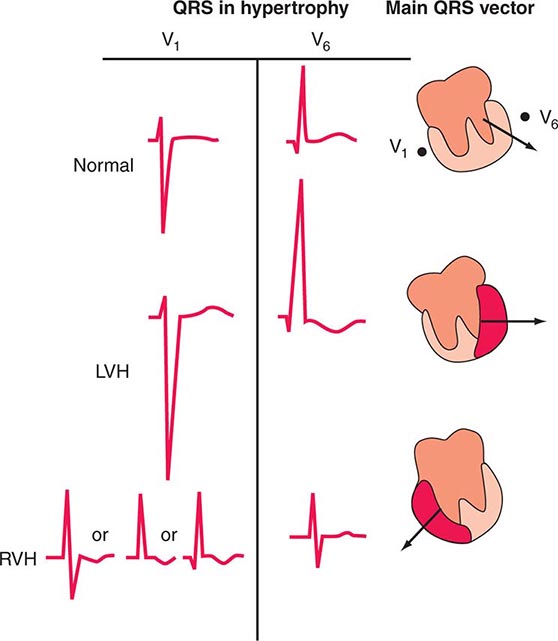
FIGURE 268-9 Left ventricular hypertrophy (LVH) increases the amplitude of electrical forces directed to the left and posteriorly. In addition, repolarization abnormalities may cause ST-segment depression and T-wave inversion in leads with a prominent R wave. Right ventricular hypertrophy (RVH) may shift the QRS vector to the right; this effect usually is associated with an R, RS, or qR complex in lead V1. T-wave inversions may be present in right precordial leads.
Acute cor pulmonale due to pulmonary embolism (Chap. 300), for example, may be associated with a normal ECG or a variety of abnormalities. Sinus tachycardia is the most common arrhythmia, although other tachyarrhythmias, such as atrial fibrillation or flutter, may occur. The QRS axis may shift to the right, sometimes in concert with the so-called S1Q3T3 pattern (prominence of the S wave in lead I and the Q wave in lead III, with T-wave inversion in lead III). Acute right ventricular dilation also may be associated with slow R-wave progression and ST-T abnormalities in V1 to V4 simulating acute anterior infarction. A right ventricular conduction disturbance may appear.
Chronic cor pulmonale due to obstructive lung disease (Chap. 279) usually does not produce the classic ECG patterns of right ventricular hypertrophy noted above. Instead of tall right precordial R waves, chronic lung disease more typically is associated with small R waves in right-to-midprecordial leads (slow R-wave progression) due in part to downward displacement of the diaphragm and the heart. Low-voltage complexes are commonly present, owing to hyperaeration of the lungs.
A number of different voltage criteria for left ventricular hypertrophy (Fig. 268-9) have been proposed on the basis of the presence of tall left precordial R waves and deep right precordial S waves (e.g., SV1 + [RV5 or RV6] >35 mm). Repolarization abnormalities (ST depression with T-wave inversions, formerly called the left ventricular “strain” pattern) also may appear in leads with prominent R waves. However, prominent precordial voltages may occur as a normal variant, especially in athletic or young individuals. Left ventricular hypertrophy may increase limb lead voltage with or without increased precordial voltage (e.g., RaVL + SV3 >20 mm in women and >28 mm in men). The presence of left atrial abnormality increases the likelihood of underlying left ventricular hypertrophy in cases with borderline voltage criteria. Left ventricular hypertrophy often progresses to incomplete or complete left bundle branch block. The sensitivity of conventional voltage criteria for left ventricular hypertrophy is decreased in obese persons and smokers. ECG evidence for left ventricular hypertrophy is a major noninvasive marker of increased risk of cardiovascular morbidity and mortality rates, including sudden cardiac death. However, because of false-positive and false-negative diagnoses, the ECG is of limited utility in diagnosing atrial or ventricular enlargement. More definitive information is provided by echocardiography (Chap. 270e).
BUNDLE BRANCH BLOCKS AND RELATED PATTERNS
Intrinsic impairment of conduction in either the right or the left bundle system (intraventricular conduction disturbances) leads to prolongation of the QRS interval. With complete bundle branch blocks, the QRS interval is ≥120 ms in duration; with incomplete blocks, the QRS interval is between 100 and 120 ms. The QRS vector usually is oriented in the direction of the myocardial region where depolarization is delayed (Fig. 268-10). Thus, with right bundle branch block, the terminal QRS vector is oriented to the right and anteriorly (rSR′ in V1 and qRS in V6, typically). Left bundle branch block alters both early and later phases of ventricular depolarization. The major QRS vector is directed to the left and posteriorly. In addition, the normal early left-to-right pattern of septal activation is disrupted such that septal depolarization proceeds from right to left as well. As a result, left bundle branch block generates wide, predominantly negative (QS) complexes in lead V1 and entirely positive (R) complexes in lead V6. A pattern identical to that of left bundle branch block, preceded by a sharp spike, is seen in most cases of electronic right ventricular pacing because of the relative delay in left ventricular activation.
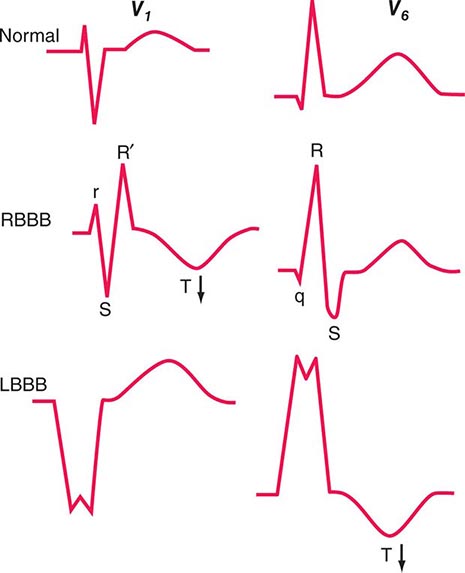
FIGURE 268-10 Comparison of typical QRS-T patterns in right bundle branch block (RBBB) and left bundle branch block (LBBB) with the normal pattern in leads V1 and V6. Note the secondary T-wave inversions (arrows) in leads with an rSR′ complex with RBBB and in leads with a wide R wave with LBBB.
Bundle branch block may occur in a variety of conditions. In subjects without structural heart disease, right bundle branch block is seen more commonly than left bundle branch block. Right bundle branch block also occurs with heart disease, both congenital (e.g., atrial septal defect) and acquired (e.g., valvular, ischemic). Left bundle branch block is often a marker of one of four underlying conditions associated with increased risk of cardiovascular morbidity and mortality rates: coronary heart disease (frequently with impaired left ventricular function), hypertensive heart disease, aortic valve disease, and cardiomyopathy. Bundle branch blocks may be chronic or intermittent. A bundle branch block may be rate-related; for example, it often occurs when the heart rate exceeds some critical value.
Bundle branch blocks and depolarization abnormalities secondary to artificial pacemakers not only affect ventricular depolarization (QRS) but also are characteristically associated with secondary repolarization (ST-T) abnormalities. With bundle branch blocks, the T wave is typically opposite in polarity to the last deflection of the QRS (Fig. 268-10). This discordance of the QRS–T-wave vectors is caused by the altered sequence of repolarization that occurs secondary to altered depolarization. In contrast, primary repolarization abnormalities are independent of QRS changes and are related instead to actual alterations in the electrical properties of the myocardial fibers themselves (e.g., in the resting membrane potential or action potential duration), not just to changes in the sequence of repolarization. Ischemia, electrolyte imbalance, and drugs such as digitalis all cause such primary ST–T-wave changes. Primary and secondary T-wave changes may coexist. For example, T-wave inversions in the right precordial leads with left bundle branch block or in the left precordial leads with right bundle branch block may be important markers of underlying ischemia or other abnormalities. A distinctive abnormality simulating right bundle branch block with ST-segment elevations in the right chest leads is seen with the Brugada pattern (Chap. 276).
Partial blocks (fascicular or “hemiblocks”) in the left bundle system (left anterior or posterior fascicular blocks) generally do not prolong the QRS duration substantially but instead are associated with shifts in the frontal plane QRS axis (leftward or rightward, respectively). Left anterior fascicular block (QRS axis more negative than –45°) is probably the most common cause of marked left axis deviation in adults. In contrast, left posterior fascicular block (QRS axis more rightward than +110–120°) is extremely rare as an isolated finding and requires exclusion of other factors causing right axis deviation mentioned earlier.
More complex combinations of fascicular and bundle branch blocks may occur that involve the left and right bundle system. Examples of bifascicular block include right bundle branch block and left posterior fascicular block, right bundle branch block with left anterior fascicular block, and complete left bundle branch block. Chronic bifascicular block in an asymptomatic individual is associated with a relatively low risk of progression to high-degree AV heart block. In contrast, new bifascicular block with acute anterior myocardial infarction carries a much greater risk of complete heart block. Alternation of right and left bundle branch block is a sign of trifascicular disease. However, the presence of a prolonged PR interval and bifascicular block does not necessarily indicate trifascicular involvement, since this combination may arise with AV node disease and bifascicular block. Intraventricular conduction delays also can be caused by extrinsic (toxic) factors that slow ventricular conduction, particularly hyperkalemia or drugs (e.g., class 1 antiarrhythmic agents, tricyclic antidepressants, phenothiazines).
Prolongation of QRS duration does not necessarily indicate a conduction delay but may be due to preexcitation of the ventricles via a bypass tract, as in Wolff-Parkinson-White (WPW) patterns (Chap. 276) and related variants. The diagnostic triad of WPW consists of a wide QRS complex associated with a relatively short PR interval and slurring of the initial part of the QRS (delta wave), with the latter effect being due to aberrant activation of ventricular myocardium. The presence of a bypass tract predisposes to reentrant supraventricular tachyarrhythmias.
MYOCARDIAL ISCHEMIA AND INFARCTION
(See also Chap. 295) The ECG is a cornerstone in the diagnosis of acute and chronic ischemic heart disease. The findings depend on several key factors: the nature of the process (reversible [i.e., ischemia] versus irreversible [i.e., infarction]), the duration (acute versus chronic), the extent (transmural versus subendocardial), and localization (anterior versus inferoposterior), as well as the presence of other underlying abnormalities (ventricular hypertrophy, conduction defects).
Ischemia exerts complex time-dependent effects on the electrical properties of myocardial cells. Severe, acute ischemia lowers the resting membrane potential and shortens the duration of the action potential. Such changes cause a voltage gradient between normal and ischemic zones. As a consequence, current flows between those regions. These currents of injury are represented on the surface ECG by deviation of the ST segment (Fig. 268-11). When the acute ischemia is transmural, the ST vector usually is shifted in the direction of the outer (epicardial) layers, producing ST elevations and sometimes, in the earliest stages of ischemia, tall, positive so-called hyperacute T waves over the ischemic zone. With ischemia confined primarily to the subendocardium, the ST vector typically shifts toward the subendocardium and ventricular cavity, so that overlying (e.g., anterior precordial) leads show ST-segment depression (with ST elevation in lead aVR). Multiple factors affect the amplitude of acute ischemic ST deviations. Profound ST elevation or depression in multiple leads usually indicates very severe ischemia. from a clinical viewpoint, the division of acute myocardial infarction into ST-segment elevation and non-ST elevation types is useful since the efficacy of acute reperfusion therapy is limited to the former group.
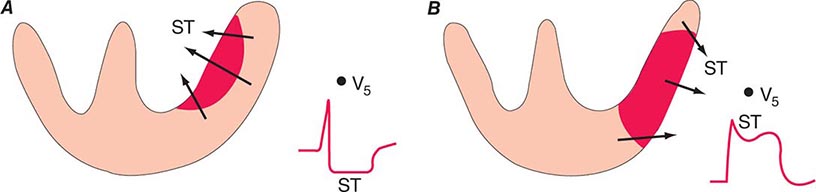
FIGURE 268-11 Acute ischemia causes a current of injury. With predominant subendocardial ischemia (A), the resultant ST vector will be directed toward the inner layer of the affected ventricle and the ventricular cavity. Overlying leads therefore will record ST depression. With ischemia involving the outer ventricular layer (B) (transmural or epicardial injury), the ST vector will be directed outward. Overlying leads will record ST elevation.
The ECG leads are usually more helpful in localizing regions of ST elevation than non-ST elevation ischemia. For example, acute transmural anterior (including apical and lateral) wall ischemia is reflected by ST elevations or increased T-wave positivity in one or more of the precordial leads (V1–V6) and leads I and aVL. Inferior wall ischemia produces changes in leads II, III, and aVF. “Posterior” wall ischemia (usually associated with lateral or inferior involvement) may be indirectly recognized by reciprocal ST depressions in leads V1 to V3 (thus constituting an ST elevation “equivalent” acute coronary syndrome). Right ventricular ischemia usually produces ST elevations in right-sided chest leads (Fig. 268-5). When ischemic ST elevations occur as the earliest sign of acute infarction, they typically are followed within a period ranging from hours to days by evolving T-wave inversions and often by Q waves occurring in the same lead distribution. Reversible transmural ischemia, for example, due to coronary vasospasm (Prinzmetal’s variant angina and possibly the Tako-tsubo “stress” cardiomyopathy syndrome), may cause transient ST-segment elevations without development of Q waves, as may very early reperfusion in acute coronary syndromes. Depending on the severity and duration of ischemia, the ST elevations may resolve completely in minutes or be followed by T-wave inversions that persist for hours or even days. Patients with ischemic chest pain who present with deep T-wave inversions in multiple precordial leads (e.g., V1–V4,, I, and aVL) with or without cardiac enzyme elevations typically have severe obstruction in the left anterior descending coronary artery system (Fig. 268-12). In contrast, patients whose baseline ECG already shows abnormal T-wave inversions may develop T-wave normalization (pseudonormalization) during episodes of acute transmural ischemia.
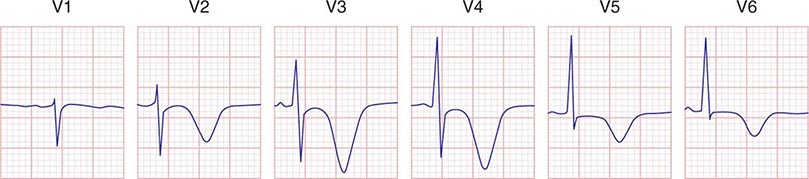
FIGURE 268-12 Severe anterior wall ischemia (with or without infarction) may cause prominent T-wave inversions in the precordial leads. This pattern (sometimes referred to as Wellens T waves) is usually associated with a high-grade stenosis of the left anterior descending coronary artery.
With infarction, depolarization (QRS) changes often accompany repolarization (ST-T) abnormalities. Necrosis of sufficient myocardial tissue may lead to decreased R-wave amplitude or abnormal Q waves (even in the absence of transmurality) in the anterior or inferior leads (Fig. 268-13). Previously, abnormal Q waves were considered markers of transmural myocardial infarction, whereas subendocardial infarcts were thought not to produce Q waves. However, careful ECG-pathology correlative studies have indicated that transmural infarcts may occur without Q waves and that subendocardial (nontransmural) infarcts sometimes may be associated with Q waves. Therefore, infarcts are more appropriately classified as “Q-wave” or “non-Q-wave.” The major acute ECG changes in syndromes of ischemic heart disease are summarized schematically in Fig. 268-14. Loss of depolarization forces due to posterior or lateral infarction may cause reciprocal increases in R-wave amplitude in leads V1 and V2 without diagnostic Q waves in any of the conventional leads. Atrial infarction may be associated with PR-segment deviations due to an atrial current of injury, changes in P-wave morphology, or atrial arrhythmias. In the weeks and months after infarction, these ECG changes may persist or begin to resolve. Complete normalization of the ECG after Q-wave infarction is uncommon but may occur, particularly with smaller infarcts. In contrast, ST-segment elevations that persist for several weeks or more after a Q-wave infarct usually correlate with a severe underlying wall motion disorder (akinetic or dyskinetic zone), although not necessarily a frank ventricular aneurysm. ECG changes due to ischemia may occur spontaneously or may be provoked by various exercise protocols (stress electrocardiography; Chap. 293).
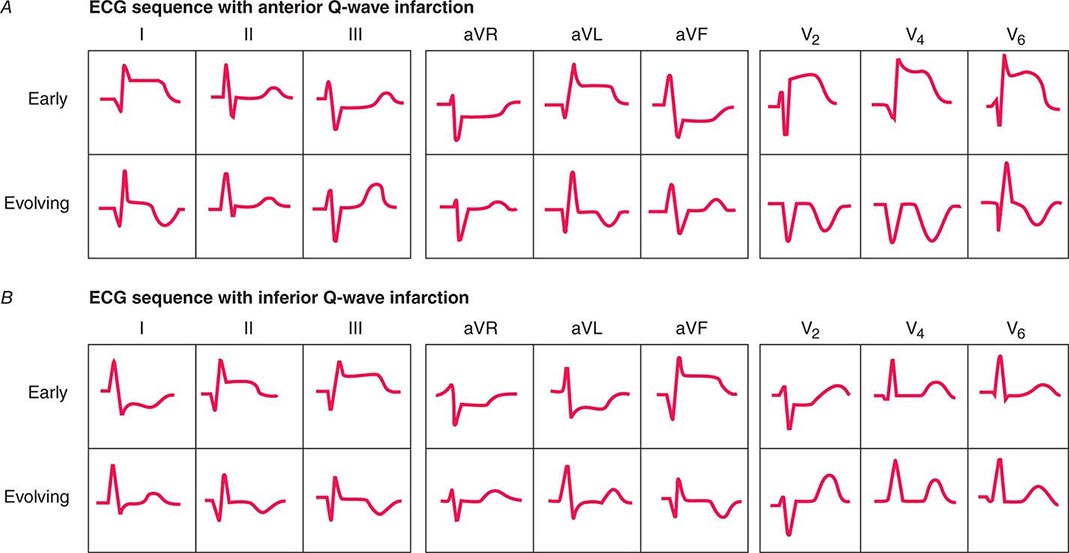
FIGURE 268-13 Sequence of depolarization and repolarization changes with (A) acute anterior and (B) acute inferior wall Q-wave infarctions. With anterior infarcts, ST elevation in leads I and aVL and the precordial leads may be accompanied by reciprocal ST depressions in leads II, III, and aVF. Conversely, acute inferior (or posterolateral) infarcts may be associated with reciprocal ST depressions in leads V1 to V3. (After AL Goldberger et al: Goldberger’s Clinical Electrocardiography: A Simplified Approach, 8th ed. Philadelphia, Elsevier/Saunders, 2013.)
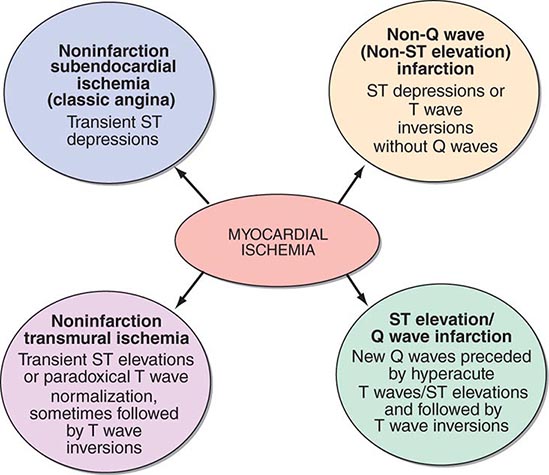
FIGURE 268-14 Variability of ECG patterns with acute myocardial ischemia. The ECG also may be normal or nonspecifically abnormal. Furthermore, these categorizations are not mutually exclusive. (After AL Goldberger et al: Goldberger’s Clinical Electrocardiography: A Simplified Approach, 8th ed. Philadelphia, Elsevier/Saunders, 2013.)
The ECG has important limitations in both sensitivity and specificity in the diagnosis of ischemic heart disease. Although a single normal ECG does not exclude ischemia or even acute infarction, a normal ECG throughout the course of an acute infarct is distinctly uncommon. Prolonged chest pain without diagnostic ECG changes therefore should always prompt a careful search for other noncoronary causes of chest pain (Chap. 19). Furthermore, the diagnostic changes of acute or evolving ischemia are often masked by the presence of left bundle branch block, electronic ventricular pacemaker patterns, and Wolff-Parkinson-White preexcitation. However, clinicians continue to overdiagnose ischemia or infarction based on the presence of ST-segment elevations or depressions; T-wave inversions; tall, positive T waves; or Q waves not related to ischemic heart disease (pseudoinfarct patterns). For example, ST-segment elevations simulating ischemia may occur with acute pericarditis or myocarditis, as a normal variant (including the typical “early repolarization” pattern), or in a variety of other conditions (Table 268-1). Similarly, tall, positive T waves do not invariably represent hyperacute ischemic changes but may also be caused by normal variants, hyperkalemia, cerebrovascular injury, and left ventricular volume overload due to mitral or aortic regurgitation, among other causes.
|
DIFFERENTIAL DIAGNOSIS OF ST-SEGMENT ELEVATIONS |
aUsually localized to V1–V2 or V3.
Source: Modified from AL Goldberger et al: Goldberger’s Clinical Electrocardiography: A Simplified Approach, 8th ed. Philadelphia, Elsevier/Saunders, 2013.
ST-segment elevations and tall, positive T waves are common findings in leads V1 and V2 in left bundle branch block or left ventricular hypertrophy in the absence of ischemia. The differential diagnosis of Q waves includes physiologic or positional variants, ventricular hypertrophy, acute or chronic noncoronary myocardial injury, hypertrophic cardiomyopathy, and ventricular conduction disorders. Digoxin, ventricular hypertrophy, hypokalemia, and a variety of other factors may cause ST-segment depression mimicking subendocardial ischemia. Prominent T-wave inversion may occur with ventricular hypertrophy, cardiomyopathies, myocarditis, and cerebrovascular injury (particularly intracranial bleeds), among many other conditions.
METABOLIC FACTORS AND DRUG EFFECTS
A variety of metabolic and pharmacologic agents alter the ECG and, in particular, cause changes in repolarization (ST-T-U) and sometimes QRS prolongation. Certain life-threatening electrolyte disturbances may be diagnosed initially and monitored from the ECG. Hyperkalemia produces a sequence of changes (Fig. 268-15), usually beginning with narrowing and peaking (tenting) of the T waves. Further elevation of extracellular K+ leads to AV conduction disturbances, diminution in P-wave amplitude, and widening of the QRS interval. Severe hyperkalemia eventually causes cardiac arrest with a slow sinusoidal type of mechanism (“sine-wave” pattern) followed by asystole. Hypokalemia (Fig. 268-16) prolongs ventricular repolarization, often with prominent U waves. Prolongation of the QT interval is also seen with drugs that increase the duration of the ventricular action potential: class 1A antiarrhythmic agents and related drugs (e.g., quinidine, disopyramide, procainamide, tricyclic antidepressants, phenothiazines) and class III agents (e.g., amiodarone [Fig. 268-16], dofetilide, dronedarone, sotalol, ibutilide). Marked QT prolongation, sometimes with deep, wide T-wave inversions, may occur with intracranial bleeds, particularly subarachnoid hemorrhage (“CVA T-wave” pattern) (Fig. 268-16). Systemic hypothermia also prolongs repolarization, usually with a distinctive convex elevation of the J point (Osborn wave). Hypocalcemia typically prolongs the QT interval (ST portion), whereas hypercalcemia shortens it (Fig. 268-17). Digitalis glycosides also shorten the QT interval, often with a characteristic “scooping” of the ST–T-wave complex (digitalis effect).
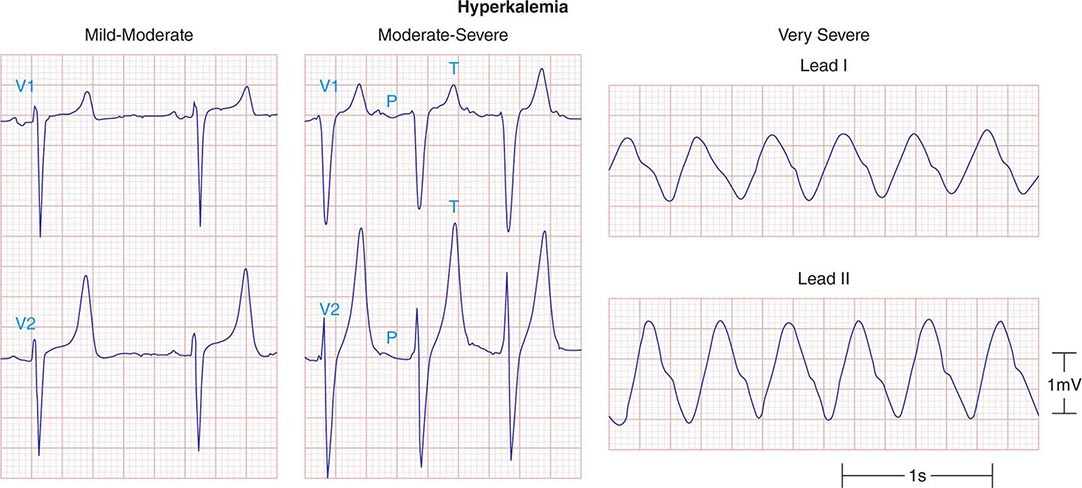
FIGURE 268-15 The earliest ECG change with hyperkalemia is usually peaking (“tenting”) of the T waves. With further increases in the serum potassium concentration, the QRS complexes widen, the P waves decrease in amplitude and may disappear, and finally a sine-wave pattern leads to asystole unless emergency therapy is given. (After AL Goldberger et al: Goldberger’s Clinical Electrocardiography: A Simplified Approach, 8th ed. Philadelphia, Elsevier/Saunders, 2013.)
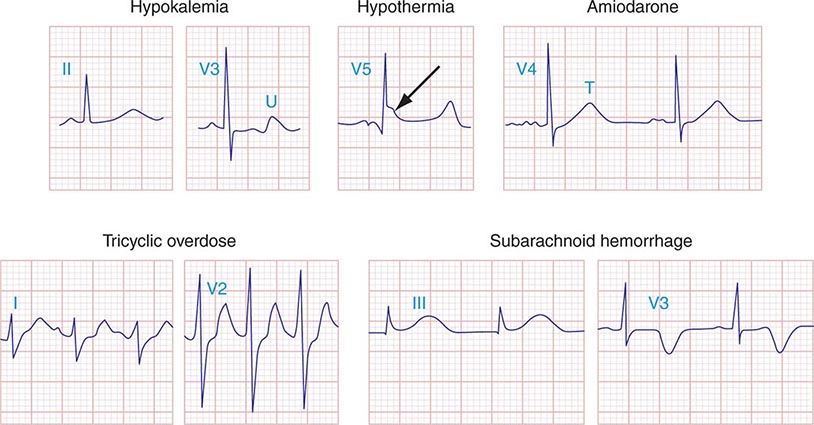
FIGURE 268-16 A variety of metabolic derangements, drug effects, and other factors may prolong ventricular repolarization with QT prolongation or prominent U waves. Prominent repolarization prolongation, particularly if due to hypokalemia, inherited “channelopathies,” or certain pharmacologic agents, indicates increased susceptibility to torsades des pointes–type ventricular tachycardia (Chap. 277). Marked systemic hypothermia is associated with a distinctive convex “hump” at the J point (Osborn wave, arrow) due to altered ventricular action potential characteristics. Note QRS and QT prolongation along with sinus tachycardia in the case of tricyclic antidepressant overdose.
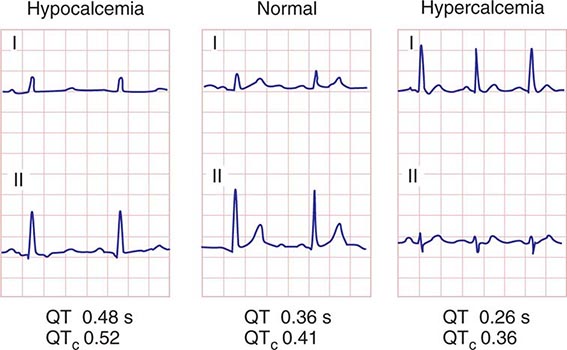
FIGURE 268-17 Prolongation of the Q-T interval (ST-segment portion) is typical of hypocalcemia. Hypercalcemia may cause abbreviation of the ST segment and shortening of the QT interval.
Many other factors are associated with ECG changes, particularly alterations in ventricular repolarization. T-wave flattening, minimal T-wave inversions, or slight ST-segment depression (“nonspecific ST–T-wave changes”) may occur with a variety of electrolyte and acid-base disturbances, a number of infectious processes, central nervous system disorders, endocrine abnormalities, many drugs, ischemia, hypoxia, and virtually any type of cardiopulmonary abnormality. Although subtle ST–T-wave changes may be markers of ischemia, transient nonspecific repolarization changes may also occur after a meal or with postural (orthostatic) change, hyperventilation, or exercise in healthy individuals.
LOW QRS VOLTAGE
Low QRS voltage is arbitrarily defined as peak-to-trough QRS amplitudes of ≤5 mm in the six limb leads and/or ≤10 mm in the chest leads. Multiple factors may be responsible. Among the most serious include pericardial (Fig. 268-18) or pleural effusions, chronic obstructive pulmonary disease, infiltrative cardiomyopathies, and anasarca.
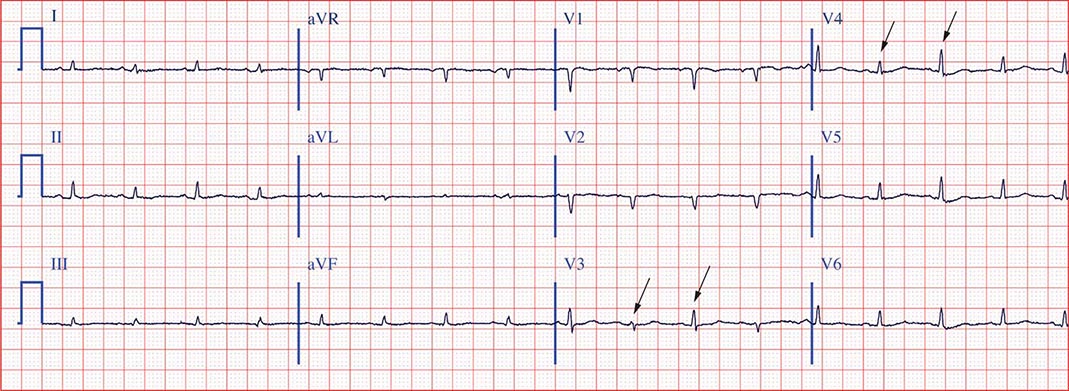
FIGURE 268-18 Classic triad of findings for pericardial effusion with cardiac tamponade: (1) sinus tachycardia; (2) low QRS voltages; and (3) electrical alternans (best seen in leads V3 and V4 in this case; arrows). This triad is highly specific for pericardial effusion, usually with tamponade physiology, but of limited sensitivity. (Adapted from LA Nathanson et al: ECG Wave-Maven. http://ecg.bidmc.harvard.edu.)
ELECTRICAL ALTERNANS
Electrical alternans—a beat-to-beat alternation in one or more components of the ECG signal—is a common type of nonlinear cardiovascular response to a variety of hemodynamic and electrophysiologic perturbations. Total electrical alternans (P-QRS-T) with sinus tachycardia is a relatively specific sign of pericardial effusion, usually with cardiac tamponade (Fig. 268-18). The mechanism relates to a periodic swinging motion of the heart in the effusion at a frequency exactly one-half the heart rate. In contrast, pure repolarization (ST-T or U wave) alternans is a sign of electrical instability and may precede ventricular tachyarrhythmias.
CLINICAL INTERPRETATION OF THE ECG
Accurate analysis of ECGs requires thoroughness and care. The patient’s age, gender, and clinical status should always be taken into account. Many mistakes in ECG interpretation are errors of omission. Therefore, a systematic approach is essential. The following 14 points should be analyzed carefully in every ECG: (1) standardization (calibration) and technical features (including lead placement and artifacts), (2) rhythm, (3) heart rate, (4) PR interval/AV conduction, (5) QRS interval, (6) QT/QTc intervals, (7) mean QRS electrical axis, (8) P waves, (9) QRS voltages, (10) precordial R-wave progression, (11) abnormal Q waves, (12) ST segments, (13) T waves, and (14) U waves. Comparison with any previous ECGs is invaluable. The diagnosis and management of specific cardiac arrhythmias and conduction disturbances are discussed in Chaps. 274 and 276.
[/level-membership-for-internal-medicine-category][not-level-membership-for-internal-medicine-category]
PART 10: Disorders of the Cardiovascular System
SECTION 1 |
INTRODUCTION TO CARDIOVASCULAR DISORDERS |
264 |
Approach to the Patient with Possible Cardiovascular Disease |
THE MAGNITUDE OF THE PROBLEM
Cardiovascular diseases comprise the most prevalent serious disorders in industrialized nations and are a rapidly growing problem in developing nations (Chap. 266e). Age-adjusted death rates for coronary heart disease have declined by two-thirds in the last four decades in the United States, reflecting the identification and reduction of risk factors as well as improved treatments and interventions for the management of coronary artery disease, arrhythmias, and heart failure. Nonetheless, cardiovascular diseases remain the most common causes of death, responsible for 35% of all deaths, almost 1 million deaths each year. Approximately one-fourth of these deaths are sudden. In addition, cardiovascular diseases are highly prevalent, diagnosed in 80 million adults, or ~35% of the adult population. The growing prevalence of obesity (Chap. 416), type 2 diabetes mellitus (Chap. 417), and metabolic syndrome (Chap. 422), which are important risk factors for atherosclerosis, now threatens to reverse the progress that has been made in the age-adjusted reduction in the mortality rate of coronary heart disease.
For many years cardiovascular disease was considered to be more common in men than in women. In fact, the percentage of all deaths secondary to cardiovascular disease is higher among women (43%) than among men (37%) (Chap. 6e). In addition, although the absolute number of deaths secondary to cardiovascular disease has declined over the past decades in men, this number has actually risen in women. Inflammation, obesity, type 2 diabetes mellitus, and the metabolic syndrome appear to play more prominent roles in the development of coronary atherosclerosis in women than in men. Coronary artery disease (CAD) is more frequently associated with dysfunction of the coronary microcirculation in women than in men. Exercise electrocardiography has a lower diagnostic accuracy in the prediction of epicardial obstruction in women than in men.
NATURAL HISTORY
Cardiovascular disorders often present acutely, as in a previously asymptomatic person who develops an acute myocardial infarction (Chap. 295), or a previously asymptomatic patient with hypertrophic cardiomyopathy (Chap. 287), or with a prolonged QT interval (Chap. 277) whose first clinical manifestation is syncope or even sudden death. However, the alert physician may recognize the patient at risk for these complications long before they occur and often can take measures to prevent their occurrence. For example, a patient with acute myocardial infarction will often have had risk factors for atherosclerosis for many years. Had these risk factors been recognized, their elimination or reduction might have delayed or even prevented the infarction. Similarly, a patient with hypertrophic cardiomyopathy may have had a heart murmur for years and a family history of this disorder. These findings could have led to an echocardiographic examination, recognition of the condition, and appropriate therapy long before the occurrence of a serious acute manifestation.
Patients with valvular heart disease or idiopathic dilated cardiomyopathy, by contrast, may have a prolonged course of gradually increasing dyspnea and other manifestations of chronic heart failure that is punctuated by episodes of acute deterioration only late in the course of the disease. Understanding the natural history of various cardiac disorders is essential for applying appropriate diagnostic and therapeutic measures to each stage of the condition, as well as for providing the patient and family with the likely prognosis.
CARDIAC SYMPTOMS
The symptoms caused by heart disease result most commonly from myocardial ischemia, disturbance of the contraction and/or relaxation of the myocardium, obstruction to blood flow, or an abnormal cardiac rhythm or rate. Ischemia, which is caused by an imbalance between the heart’s oxygen supply and demand, is manifest most frequently as chest discomfort (Chap. 19), whereas reduction of the pumping ability of the heart commonly leads to fatigue and elevated intravascular pressure upstream of the failing ventricle. The latter results in abnormal fluid accumulation, with peripheral edema (Chap. 50) or pulmonary congestion and dyspnea (Chap. 47e). Obstruction to blood flow, as occurs in valvular stenosis, can cause symptoms resembling those of myocardial failure (Chap. 279). Cardiac arrhythmias often develop suddenly, and the resulting symptoms and signs—palpitations (Chap. 52), dyspnea, hypotension, and syncope (Chap. 27)—generally occur abruptly and may disappear as rapidly as they develop.
Although dyspnea, chest discomfort, edema, and syncope are cardinal manifestations of cardiac disease, they occur in other conditions as well. Thus, dyspnea is observed in disorders as diverse as pulmonary disease, marked obesity, and anxiety (Chap. 47e). Similarly, chest discomfort may result from a variety of noncardiac and cardiac causes other than myocardial ischemia (Chap. 19). Edema, an important finding in untreated or inadequately treated heart failure, also may occur with primary renal disease and in hepatic cirrhosis (Chap. 50). Syncope occurs not only with serious cardiac arrhythmias but in a number of neurologic conditions as well (Chap. 27). Whether heart disease is responsible for these symptoms frequently can be determined by carrying out a careful clinical examination (Chap. 267), supplemented by noninvasive testing using electrocardiography at rest and during exercise (Chap. 268), echocardiography, roentgenography, and other forms of myocardial imaging (Chap. 270e).
Myocardial or coronary function that may be adequate at rest may be insufficient during exertion. Thus, dyspnea and/or chest discomfort that appear during activity are characteristic of patients with heart disease, whereas the opposite pattern, i.e., the appearance of these symptoms at rest and their remission during exertion, is rarely observed in such patients. It is important, therefore, to question the patient carefully about the relation of symptoms to exertion.
Many patients with cardiovascular disease may be asymptomatic both at rest and during exertion but may present with an abnormal physical finding such as a heart murmur, elevated arterial pressure, or an abnormality of the electrocardiogram (ECG) or imaging test. It is important to assess the global risk of CAD in asymptomatic individuals, using a combination of clinical assessment and measurement of cholesterol and its fractions, as well as other biomarkers, such as C-reactive protein, in some patients (Chap. 291e). Since the first clinical manifestation of CAD may be catastrophic—sudden cardiac death, acute myocardial infarction, or stroke in previous asymptomatic persons—it is mandatory to identify those at high risk of such events and institute further testing and preventive measures.
DIAGNOSIS
As outlined by the New York Heart Association (NYHA), the elements of a complete cardiac diagnosis include the systematic consideration of the following:
1. The underlying etiology. Is the disease congenital, hypertensive, ischemic, or inflammatory in origin?
2. The anatomic abnormalities. Which chambers are involved? Are they hypertrophied, dilated, or both? Which valves are affected? Are they regurgitant and/or stenotic? Is there pericardial involvement? Has there been a myocardial infarction?
3. The physiologic disturbances. Is an arrhythmia present? Is there evidence of congestive heart failure or myocardial ischemia?
4. Functional disability. How strenuous is the physical activity required to elicit symptoms? The classification provided by the NYHA has been found to be useful in describing functional disability (Table 264-1).
|
NEW YORK HEART ASSOCIATION FUNCTIONAL CLASSIFICATION |
One example may serve to illustrate the importance of establishing a complete diagnosis. In a patient who presents with exertional chest discomfort, the identification of myocardial ischemia as the etiology is of great clinical importance. However, the simple recognition of ischemia is insufficient to formulate a therapeutic strategy or prognosis until the underlying anatomic abnormalities responsible for the myocardial ischemia, e.g., coronary atherosclerosis or aortic stenosis, are identified and a judgment is made about whether other physiologic disturbances that cause an imbalance between myocardial oxygen supply and demand, such as severe anemia, thyrotoxicosis, or supraventricular tachycardia, play contributory roles. Finally, the severity of the disability should govern the extent and tempo of the workup and strongly influence the therapeutic strategy that is selected.
The establishment of a correct and complete cardiac diagnosis usually commences with the history and physical examination (Chap. 267). Indeed, the clinical examination remains the basis for the diagnosis of a wide variety of disorders. The clinical examination may then be supplemented by five types of laboratory tests: (1) ECG (Chap. 268), (2) noninvasive imaging examinations (chest roentgenogram, echocardiogram, radionuclide imaging, computed tomographic imaging, positron emission tomography, and magnetic resonance imaging) (Chap. 270e), (3) blood tests to assess risk (e.g., lipid determinations, C-reactive protein [Chap. 291e]) or cardiac function (e.g., brain natriuretic peptide [BNP] [Chap. 279]), (4) occasionally specialized invasive examinations (i.e., cardiac catheterization and coronary arteriography [Chap. 272]), and (5) genetic tests to identify monogenic cardiac diseases (e.g., hypertrophic cardiomyopathy [Chap. 287], Marfan’s syndrome [Chap. 427], and abnormalities of cardiac ion channels that lead to prolongation of the QT interval and an increase in the risk of sudden death [Chap. 276]). These tests are becoming more widely available.
FAMILY HISTORY
In eliciting the history of a patient with known or suspected cardiovascular disease, particular attention should be directed to the family history. Familial clustering is common in many forms of heart disease. Mendelian transmission of single-gene defects may occur, as in hypertrophic cardiomyopathy (Chap. 287), Marfan’s syndrome (Chap. 427), and sudden death associated with a prolonged QT syndrome (Chap. 277). Premature coronary disease and essential hypertension, type 2 diabetes mellitus, and hyperlipidemia (the most important risk factors for CAD) are usually polygenic disorders. Although familial transmission may be less obvious than in the monogenic disorders, it is helpful in assessing risk and prognosis in polygenic disorders, as well. Familial clustering of cardiovascular diseases not only may occur on a genetic basis but also may be related to familial dietary or behavior patterns, such as excessive ingestion of salt or calories and cigarette smoking.
ASSESSMENT OF FUNCTIONAL IMPAIRMENT
When an attempt is made to determine the severity of functional impairment in a patient with heart disease, it is helpful to ascertain the level of activity and the rate at which it is performed before symptoms develop. Thus, it is not sufficient to state that the patient complains of dyspnea. The breathlessness that occurs after running up two long flights of stairs denotes far less functional impairment than do similar symptoms that occur after taking a few steps on level ground. Also, the degree of customary physical activity at work and during recreation should be considered. The development of two-flight dyspnea in a well-conditioned marathon runner may be far more significant than the development of one-flight dyspnea in a previously sedentary person. The history should include a detailed consideration of the patient’s therapeutic regimen. For example, the persistence or development of edema, breathlessness, and other manifestations of heart failure in a patient who is receiving optimal doses of diuretics and other therapies for heart failure (Chap. 279) is far graver than are similar manifestations in the absence of treatment. Similarly, the presence of angina pectoris despite treatment with optimal doses of multiple antianginal drugs (Chap. 293) is more serious than it is in a patient on no therapy. In an effort to determine the progression of symptoms, and thus the severity of the underlying illness, it may be useful to ascertain what, if any, specific tasks the patient could have carried out 6 months or 1 year earlier that he or she cannot carry out at present.
ELECTROCARDIOGRAM
(See also Chap. 268) Although an ECG usually should be recorded in patients with known or suspected heart disease, with the exception of the identification of arrhythmias, conduction abnormalities, ventricular hypertrophy, and acute myocardial infarction, it generally does not establish a specific diagnosis. The range of normal electrocardiographic findings is wide, and the tracing can be affected significantly by many noncardiac factors, such as age, body habitus, and serum electrolyte concentrations. In general, electrocardiographic changes should be interpreted in the context of other abnormal cardiovascular findings.
ASSESSMENT OF THE PATIENT WITH A HEART MURMUR
(Fig. 264-1) The cause of a heart murmur can often be readily elucidated from a systematic evaluation of its major attributes: timing, duration, intensity, quality, frequency, configuration, location, and radiation when considered in the light of the history, general physical examination, and other features of the cardiac examination, as described in Chap. 267.
FIGURE 264-1 Approach to the evaluation of a heart murmur. ECG, electrocardiogram. (From RA O’Rourke, in Primary Cardiology, 2nd ed, E Braunwald, L Goldman [eds]. Philadelphia, Saunders, 2003.)
The majority of heart murmurs are midsystolic and soft (grades I–II/VI). When such a murmur occurs in an asymptomatic child or young adult without other evidence of heart disease on clinical examination, it is usually benign and echocardiography generally is not required. By contrast, two-dimensional and Doppler echocardiography (Chap. 270e) are indicated in patients with loud systolic murmurs (grades ≥III/VI), especially those that are holosystolic or late systolic, and in most patients with diastolic or continuous murmurs.
PITFALLS IN CARDIOVASCULAR MEDICINE
Increasing subspecialization in internal medicine and the perfection of advanced diagnostic techniques in cardiology can lead to several undesirable consequences. Examples include the following:
1. Failure by the noncardiologist to recognize important cardiac manifestations of systemic illnesses. For example, the presence of mitral stenosis, patent foramen ovale, and/or transient atrial arrhythmia should be considered in a patient with stroke, or the presence of pulmonary hypertension and cor pulmonale should be considered in a patient with scleroderma or Raynaud’s syndrome. A cardiovascular examination should be carried out to identify and estimate the severity of the cardiovascular involvement that accompanies many noncardiac disorders.
2. Failure by the cardiologist to recognize underlying systemic disorders in patients with heart disease. For example, hyperthyroidism should be considered in an elderly patient with atrial fibrillation and unexplained heart failure, and Lyme disease should be considered in a patient with unexplained fluctuating atrioventricular block. A cardiovascular abnormality may provide the clue critical to the recognition of some systemic disorders. For example, an unexplained pericardial effusion may provide an early clue to the diagnosis of tuberculosis or a neoplasm.
3. Overreliance on and overutilization of laboratory tests, particularly invasive techniques, for the evaluation of the cardiovascular system. Cardiac catheterization and coronary arteriography (Chap. 272) provide precise diagnostic information that may be crucial in developing a therapeutic plan in patients with known or suspected CAD. Although a great deal of attention has been directed to these examinations, it is important to recognize that they serve to supplement, not supplant, a careful examination carried out with clinical and noninvasive techniques. A coronary arteriogram should not be performed in lieu of a careful history in patients with chest pain suspected of having ischemic heart disease. Although coronary arteriography may establish whether the coronary arteries are obstructed and to what extent, the results of the procedure by themselves often do not provide a definitive answer to the question of whether a patient’s complaint of chest discomfort is attributable to coronary atherosclerosis and whether or not revascularization is indicated.
Despite the value of invasive tests in certain circumstances, they entail some small risk to the patient, involve discomfort and substantial cost, and place a strain on medical facilities. Therefore, they should be carried out only if the results can be expected to modify the patient’s management.
DISEASE PREVENTION AND MANAGEMENT
The prevention of heart disease, especially of CAD, is one of the most important tasks of primary care health givers as well as cardiologists. Prevention begins with risk assessment, followed by attention to lifestyle, such as achieving optimal weight, physical activity, and smoking cessation, and then aggressive treatment of all abnormal risk factors, such as hypertension, hyperlipidemia, and diabetes mellitus (Chap. 417).
After a complete diagnosis has been established in patients with known heart disease, a number of management options are usually available. Several examples may be used to demonstrate some of the principles of cardiovascular therapeutics:
1. In the absence of evidence of heart disease, the patient should be clearly informed of this assessment and not be asked to return at intervals for repeated examinations. If there is no evidence of disease, such continued attention may lead to the patient’s developing inappropriate concern about the possibility of heart disease.
2. If there is no evidence of cardiovascular disease but the patient has one or more risk factors for the development of ischemic heart disease (Chap. 293), a plan for their reduction should be developed and the patient should be retested at intervals to assess compliance and efficacy in risk reduction.
3. Asymptomatic or mildly symptomatic patients with valvular heart disease that is anatomically severe should be evaluated periodically, every 6 to 12 months, by clinical and noninvasive examinations. Early signs of deterioration of ventricular function may signify the need for surgical treatment before the development of disabling symptoms, irreversible myocardial damage, and excessive risk of surgical treatment (Chap. 283).
4. In patients with CAD (Chap. 293), available practice guidelines should be considered in the decision on the form of treatment (medical, percutaneous coronary intervention, or surgical revascularization). Mechanical revascularization may be employed too frequently in the United States and too infrequently in Eastern Europe and developing nations. The mere presence of angina pectoris and/or the demonstration of critical coronary arterial narrowing at angiography should not reflexively evoke a decision to treat the patient by revascularization. Instead, these interventions should be limited to patients with CAD whose angina has not responded adequately to medical treatment or in whom revascularization has been shown to improve the natural history (e.g., acute coronary syndrome or multivessel CAD with left ventricular dysfunction).
265e |
Basic Biology of the Cardiovascular System |
THE BLOOD VESSEL
VASCULAR ULTRASTRUCTURE
Blood vessels participate in homeostasis on a moment-to-moment basis and contribute to the pathophysiology of diseases of virtually every organ system. Hence, an understanding of the fundamentals of vascular biology furnishes a foundation for understanding the normal function of all organ systems and many diseases. The smallest blood vessels—capillaries—consist of a monolayer of endothelial cells apposed to a basement membrane, adjacent to occasional smooth-muscle-like cells known as pericytes (Fig. 265e-1A). Unlike larger vessels, pericytes do not invest the entire microvessel to form a continuous sheath. Arteries typically have a trilaminar structure (Fig. 265e-1B–E). The intima consists of a monolayer of endothelial cells continuous with those of the capillaries. The middle layer, or tunica media, consists of layers of smooth-muscle cells; in veins, the media can contain just a few layers of smooth-muscle cells (Fig. 265e-1B). The outer layer, the adventitia, consists of looser extracellular matrix with occasional fibroblasts, mast cells, and nerve terminals. Larger arteries have their own vasculature, the vasa vasorum, which nourishes the outer aspects of the tunica media. The adventitia of many veins surpasses the intima in thickness.
FIGURE 265e-1 Schematics of the structures of various types of blood vessels. A. Capillaries consist of an endothelial tube in contact with a discontinuous population of pericytes. B. Veins typically have thin medias and thicker adventitias. C. A small muscular artery features a prominent tunica media. D. Larger muscular arteries have a prominent media with smooth-muscle cells embedded in a complex extracellular matrix. E. Larger elastic arteries have cylindrical layers of elastic tissue alternating with concentric rings of smooth-muscle cells.
The tone of muscular arterioles regulates blood pressure and flow through various arterial beds. These smaller arteries have a relatively thick tunica media in relation to the adventitia (Fig. 265e-1C). Medium-size muscular arteries similarly contain a prominent tunica media (Fig. 265e-1D); atherosclerosis commonly affects this type of muscular artery. The larger elastic arteries have a much more structured tunica media consisting of concentric bands of smooth-muscle cells, interspersed with strata of elastin-rich extracellular matrix sandwiched between layers of smooth-muscle cells (Fig. 265e-1E). Larger arteries have a clearly demarcated internal elastic lamina that forms the barrier between the intima and the media. An external elastic lamina demarcates the media of arteries from the surrounding adventitia.
ORIGIN OF VASCULAR CELLS
The intima in human arteries often contains occasional resident smooth-muscle cells beneath the monolayer of vascular endothelial cells. The embryonic origin of smooth-muscle cells in various types of artery differs. Some upper-body arterial smooth-muscle cells derive from the neural crest, whereas lower-body arteries generally recruit smooth-muscle cells from neighboring mesodermal structures during development. Derivatives of the proepicardial organ, which gives rise to the epicardial layer of the heart, contribute to the vascular smooth-muscle cells of the coronary arteries. Bone marrow–derived endothelial progenitors may aid repair of damaged or aging arteries. In addition, multipotent vascular stem cells resident in vessel walls may give rise to the smooth-muscle cells that accumulate in injured or atheromatous arteries (Chaps. 88, 89e, and 90e).
VASCULAR CELL BIOLOGY
Endothelial Cell The key cell of the vascular intima, the endothelial cell, has manifold functions in health and disease. The endothelium forms the interface between tissues and the blood compartment. It therefore must regulate the entry of molecules and cells into tissues in a selective manner. The ability of endothelial cells to serve as a selectively permeable barrier fails in many vascular disorders, including atherosclerosis, hypertension, and renal disease. This dysregulation of permeability also occurs in pulmonary edema and other situations of “capillary leak.”
The endothelium also participates in the local regulation of blood flow and vascular caliber. Endogenous substances produced by endothelial cells such as prostacyclin, endothelium-derived hyperpolarizing factor, nitric oxide (NO), and hydrogen peroxide (H2O2) provide tonic vasodilatory stimuli under physiologic conditions in vivo (Table 265e-1). Impaired production or excess catabolism of NO impairs this endothelium-dependent vasodilator function and may contribute to excessive vasoconstriction in various pathologic situations. Measurement of flow-mediated dilatation can assess endothelial vasodilator function in humans (Fig. 265e-2). By contrast, endothelial cells also produce potent vasoconstrictor substances such as endothelin in a regulated fashion. Excessive production of reactive oxygen species, such as superoxide anion (O2–), by endothelial or smooth-muscle cells under pathologic conditions (e.g., excessive exposure to angiotensin II), can promote local oxidative stress and inactivate NO.
|
ENDOTHELIAL FUNCTIONS IN HEALTH AND DISEASE |
FIGURE 265e-2 Assessment of endothelial function in vivo using blood pressure cuff occlusion and release. Upon deflation of the cuff, an ultrasound probe monitors changes in diameter (A) and blood flow (B) of the brachial artery (C). (Reproduced with permission of J. Vita, MD.)
The endothelial monolayer contributes critically to inflammatory processes involved in normal host defenses and pathologic states. The normal endothelium resists prolonged contact with blood leukocytes; however, when activated by bacterial products such as endotoxin or by proinflammatory cytokines released during infection or injury, endothelial cells express an array of leukocyte adhesion molecules that bind various classes of leukocytes. The endothelial cells appear to recruit selectively different classes of leukocytes in different pathologic conditions. The gamut of adhesion molecules and chemokines generated during acute bacterial infection tends to recruit granulocytes. In chronic inflammatory diseases such as tuberculosis and atherosclerosis, endothelial cells express adhesion molecules that favor the recruitment of mononuclear leukocytes that characteristically accumulate in these conditions.
The endothelium also dynamically regulates thrombosis and hemostasis. NO, in addition to its vasodilatory properties, can limit platelet activation and aggregation. Like NO, prostacyclin produced by endothelial cells under normal conditions not only provides a vasodilatory stimulus but also antagonizes platelet activation and aggregation. Thrombomodulin expressed on the surface of endothelial cells binds thrombin at low concentrations and inhibits coagulation through activation of the protein C pathway, inactivating clotting factors Va and VIIIa and thus combating thrombus formation. The surface of endothelial cells contains heparan sulfate glycosaminoglycans that furnish an endogenous antithrombotic coating to the vasculature. Endothelial cells also participate actively in fibrinolysis and its regulation. They express receptors for plasminogen and plasminogen activators and produce tissue-type plasminogen activator. Through local generation of plasmin, the normal endothelial monolayer can promote the lysis of nascent thrombi.
When activated by inflammatory cytokines, bacterial endotoxin, or angiotensin II, for example, endothelial cells can produce substantial quantities of the major inhibitor of fibrinolysis, plasminogen activator inhibitor 1 (PAI-1). Thus, in pathologic circumstances, the endothelial cell may promote local thrombus accumulation rather than combat it. Inflammatory stimuli also induce the expression of the potent procoagulant tissue factor, a contributor to disseminated intravascular coagulation in sepsis.
Endothelial cells also participate in the pathophysiology of a number of immune-mediated diseases. Lysis of endothelial cells mediated by complement provides an example of immunologically mediated tissue injury. The presentation of foreign histocompatibility complex antigens by endothelial cells in solid-organ allografts can promote allograft arteriopathy. In addition, immune-mediated endothelial injury may contribute in some patients with thrombotic thrombocytopenic purpura and patients with hemolytic-uremic syndrome. Thus, in addition to the involvement of innate immune responses, endothelial cells participate actively in both humoral and cellular limbs of the immune response.
Endothelial cells regulate growth of subjacent smooth-muscle cells. Heparan sulfate glycosaminoglycans elaborated by endothelial cells can inhibit smooth-muscle proliferation. In contrast, when exposed to various injurious stimuli, endothelial cells can elaborate growth factors and chemoattractants, such as platelet-derived growth factor, that can promote the migration and proliferation of vascular smooth-muscle cells. Dysregulated elaboration of these growth-stimulatory molecules may promote smooth-muscle accumulation in atherosclerotic lesions.
Vascular Smooth-Muscle Cell The vascular smooth-muscle cell, the major cell type of the media layer of blood vessels, also contributes actively to vascular pathobiology. Contraction and relaxation of smooth-muscle cells at the level of the muscular arteries controls blood pressure and, hence, regional blood flow and the afterload experienced by the left ventricle (see below). The vasomotor tone of veins, which is governed by smooth-muscle cell tone, regulates the capacitance of the venous tree and influences the preload experienced by both ventricles. Smooth-muscle cells in the adult vessel seldom replicate in the absence of arterial injury or inflammatory activation. Proliferation and migration of arterial smooth-muscle cells, associated with functional modulation characterized by lower content of contractile proteins and greater production of extracellular matrix macromolecules, can contribute to the development of arterial stenoses in atherosclerosis, arteriolar remodeling that can sustain and propagate hypertension, and the hyperplastic response of arteries injured by percutaneous intervention. In the pulmonary circulation, smooth-muscle migration and proliferation contribute decisively to the pulmonary vascular disease that gradually occurs in response to sustained high-flow states such as left-to-right shunts. Such pulmonary vascular disease provides a major obstacle to the management of many patients with adult congenital heart disease. Among other mediators, microRNAs have emerged as powerful regulators of this transition, offering new targets for intervention.
Smooth-muscle cells secrete the bulk of vascular extracellular matrix. Excessive production of collagen and glycosaminoglycans contributes to the remodeling and altered functions and biomechanics of arteries affected by hypertension or atherosclerosis. In larger elastic arteries, the elastin synthesized by smooth-muscle cells serves to maintain not only normal arterial structure, but also hemodynamic function. The ability of the larger arteries, such as the aorta, to store the kinetic energy of systole promotes tissue perfusion during diastole. Arterial stiffness associated with aging or disease, as manifested by a widening pulse pressure, increases left ventricular afterload and portends a poor outcome.
Like endothelial cells, vascular smooth-muscle cells do not merely respond to vasomotor or inflammatory stimuli elaborated by other cell types but can themselves serve as a source of such stimuli. For example, when exposed to bacterial endotoxin or other proinflammatory stimuli, smooth-muscle cells can elaborate cytokines and other inflammatory mediators. Like endothelial cells, upon inflammatory activation, arterial smooth-muscle cells can produce prothrombotic mediators such as tissue factor, the antifibrinolytic protein PAI-1, and other molecules that modulate thrombosis and fibrinolysis. Smooth-muscle cells also elaborate autocrine growth factors that can amplify hyperplastic responses to arterial injury.
Vascular Smooth-Muscle Cell Function Vascular smooth-muscle cells govern vessel tone. Those cells contract when stimulated by a rise in intracellular calcium concentration by calcium influx through the plasma membrane and by calcium release from intracellular stores (Fig. 265e-3). In vascular smooth-muscle cells, voltage-dependent L-type calcium channels open with membrane depolarization, which is regulated by energy-dependent ion pumps such as the Na+,K+-ATPase pump and ion channels such as the Ca2+-sensitive K+ channel. Local changes in intracellular calcium concentration, termed calcium sparks, result from the influx of calcium through the voltage-dependent calcium channel and are caused by the coordinated activation of a cluster of ryanodine-sensitive calcium release channels in the sarcoplasmic reticulum (see below). Calcium sparks directly augment intracellular calcium concentration and indirectly increase intracellular calcium concentration by activating chloride channels. In addition, calcium sparks reduce smooth-muscle contractility by activating large-conductance calcium-sensitive K+ channels, hyperpolarizing the cell membrane and thereby limiting further voltage-dependent increases in intracellular calcium.
FIGURE 265e-3 Regulation of vascular smooth-muscle cell calcium concentration and actomyosin ATPase-dependent contraction. AC, adenylyl cyclase; Ang II, angiotensin II; ANP, atrial natriuretic peptide; DAG, diacylglycerol; ET-1, endothelin-1; G, G protein; IP3, inositol 1,4,5-trisphosphate; MLCK, myosin light chain kinase; MLCP, myosin light chain phosphatase; NE, norepinephrine; NO, nitric oxide; pGC, particular guanylyl cyclase; PIP2, phosphatidylinositol 4,5-bisphosphate; PKA, protein kinase A; PKC, protein kinase C; PKG, protein kinase G; PLC, phospholipase C; sGC, soluble guanylyl cyclase; SR, sarcoplasmic reticulum; VDCC, voltage-dependent calcium channel. (Modified from B Berk, in Vascular Medicine, 3rd ed. Philadelphia, Saunders, Elsevier, 2006, p. 23; with permission.)
Biochemical agonists also increase intracellular calcium concentration, in this case by receptor-dependent activation of phospholipase C with hydrolysis of phosphatidylinositol 4,5-bisphosphate, resulting in the generation of diacylglycerol (DAG) and inositol 1,4,5-trisphosphate (IP3). These membrane lipid derivatives in turn activate protein kinase C and increase intracellular calcium concentration. In addition, IP3 binds to specific receptors on the sarcoplasmic reticulum membrane to increase calcium efflux from this calcium storage pool into the cytoplasm.
Vascular smooth-muscle cell contraction depends principally on the phosphorylation of myosin light chain, which in the steady state, reflects the balance between the actions of myosin light chain kinase and myosin light chain phosphatase. Calcium activates myosin light chain kinase through the formation of a calcium-calmodulin complex. Phosphorylation of myosin light chain by this kinase augments myosin ATPase activity and enhances contraction. Myosin light chain phosphatase dephosphorylates myosin light chain, reducing myosin ATPase activity and contractile force. Phosphorylation of the myosin-binding subunit (thr695) of myosin light chain phosphatase by Rho kinase inhibits phosphatase activity and induces calcium sensitization of the contractile apparatus. Rho kinase is itself activated by the small GTPase RhoA, which is stimulated by guanosine exchange factors and inhibited by GTPase-activating proteins.
Both cyclic AMP and cyclic GMP relax vascular smooth-muscle cells through complex mechanisms. β agonists, acting through their G-protein-coupled receptors activate adenylyl cyclase to convert ATP to cyclic AMP; NO and atrial natriuretic peptide acting directly and via a G-protein-coupled receptor, respectively, activate guanylyl cyclase to convert GTP to cyclic GMP. These agents in turn activate protein kinase A and protein kinase G, respectively, which inactivate myosin light chain kinase and decrease vascular smooth-muscle cell tone. In addition, protein kinase G can interact directly with the myosin-binding substrate subunit of myosin light chain phosphatase, increasing phosphatase activity and decreasing vascular tone. Finally, several mechanisms drive NO-dependent, protein kinase G–mediated reductions in vascular smooth-muscle cell calcium concentration, including phosphorylation-dependent inactivation of RhoA; decreased IP3 formation; phosphorylation of the IP3 receptor–associated cyclic GMP kinase substrate, with subsequent inhibition of IP3 receptor function; phosphorylation of phospholamban, which increases calcium ATPase activity and sequestration of calcium in the sarcoplasmic reticulum; and protein kinase G–dependent stimulation of plasma membrane calcium ATPase activity, perhaps by activation of the Na+,K+-ATPase pump or hyperpolarization of the cell membrane by activation of calcium-dependent K+ channels.
Control of Vascular Smooth-Muscle Cell Tone The autonomic nervous system and endothelial cells modulate vascular smooth-muscle cells in a tightly regulated manner. Autonomic neurons enter the blood vessel medial layer from the adventitia and modulate vascular smooth-muscle cell tone in response to baroreceptors and chemoreceptors within the aortic arch and carotid bodies and in response to thermoreceptors in the skin. These regulatory components include rapidly acting reflex arcs modulated by central inputs that respond to sensory inputs (olfactory, visual, auditory, and tactile) as well as emotional stimuli. Three classes of nerves mediate autonomic regulation of vascular tone: sympathetic, whose principal neurotransmitters are epinephrine and norepinephrine; parasympathetic, whose principal neurotransmitter is acetylcholine; and nonadrenergic/noncholinergic, which include two subgroups—nitrergic, whose principal neurotransmitter is NO, and peptidergic, whose principal neurotransmitters are substance P, vasoactive intestinal peptide, calcitonin gene-related peptide, and ATP.
Each of these neurotransmitters acts through specific receptors on the vascular smooth-muscle cell to modulate intracellular calcium and, consequently, contractile tone. Norepinephrine activates α receptors, and epinephrine activates α and β receptors (adrenergic receptors); in most blood vessels, norepinephrine activates postjunctional α1 receptors in large arteries and α2 receptors in small arteries and arterioles, leading to vasoconstriction. Most blood vessels express β2-adrenergic receptors on their vascular smooth-muscle cells and respond to β agonists by cyclic AMP–dependent relaxation. Acetylcholine released from parasympathetic neurons binds to muscarinic receptors (of which there are five subtypes, M1–5) on vascular smooth-muscle cells to yield vasorelaxation. In addition, NO stimulates presynaptic neurons to release acetylcholine, which can stimulate the release of NO from the endothelium. Nitrergic neurons release NO produced by neuronal NO synthase, which causes vascular smooth-muscle cell relaxation via the cyclic GMP–dependent and –independent mechanisms described above. The peptidergic neurotransmitters all potently vasodilate, acting either directly or through endothelium-dependent NO release to decrease vascular smooth-muscle cell tone. For the detailed molecular physiology of the autonomic nervous system, see Chap. 454.
The endothelium modulates vascular smooth-muscle tone by the direct release of several effectors, including NO, prostacyclin, hydrogen sulfide, and endothelium-derived hyperpolarizing factor, all of which cause vasorelaxation, and endothelin, which causes vasoconstriction. The release of these endothelial effectors of vascular smooth-muscle cell tone is stimulated by mechanical (shear stress, cyclic strain, etc.) and biochemical mediators (purinergic agonists, muscarinic agonists, peptidergic agonists), with the biochemical mediators acting through endothelial receptors specific to each class. In addition to these local paracrine modulators of vascular smooth-muscle cell tone, circulating mediators can affect tone, including norepinephrine and epinephrine, vasopressin, angiotensin II, bradykinin, and the natriuretic peptides (atrial natriuretic peptide [ANP], brain natriuretic peptide [BNP], C-type natriuretic peptide [CNP], and dendroaspis natriuretic peptide [DNP]), as discussed above.
VASCULAR REGENERATION
Growth of new blood vessels can occur in response to conditions such as chronic hypoxemia and tissue ischemia. Growth factors, including vascular endothelial growth factor (VEGF) and forms of fibroblast growth factor (FGF), activate a signaling cascade that stimulates endothelial proliferation and tube formation, defined as angiogenesis. Guidance molecules, including members of the semaphorin family of secreted peptides, direct blood vessel patterning by attracting or repelling nascent endothelial tubes. The development of collateral vascular networks in the ischemic myocardium, an example of angiogenesis, can result from selective activation of endothelial progenitor cells, which may reside in the blood vessel wall or home to the ischemic tissue from the bone marrow. True arteriogenesis, or the development of a new blood vessel that includes all three cell layers, normally does not occur in the cardiovascular system of adult mammals. The molecular mechanisms and progenitor cells that can recapitulate blood vessel development de novo are under rapidly advancing study (Chaps. 88, 89e, and 90e).
VASCULAR PHARMACOGENOMICS
The last decade has witnessed considerable progress in efforts to define the genetic differences underlying individual variations in vascular pharmacologic responses. Many investigators have focused on receptors and enzymes associated with neurohumoral modulation of vascular function as well as hepatic enzymes that metabolize drugs that affect vascular tone. The genetic polymorphisms thus far associated with differences in vascular response often (but not invariably) relate to functional differences in the activity or expression of the receptor or enzyme of interest. Some of these polymorphisms appear to have different allele frequencies in specific ethnic groups.
CELLULAR BASIS OF CARDIAC CONTRACTION
CARDIAC ULTRASTRUCTURE
About three-fourths of the ventricular mass is composed of cardiomyocytes, normally 60–140 μm in length and 17–25 μm in diameter (Fig. 265e-4A). Each cell contains multiple, rodlike cross-banded strands (myofibrils) that run the length of the cell and are composed of serially repeating structures, the sarcomeres. The cytoplasm between the myofibrils contains other cell constituents, including the single centrally located nucleus, numerous mitochondria, and the intracellular membrane system, the sarcoplasmic reticulum.
FIGURE 265e-4 A shows the branching myocytes making up the cardiac myofibers. B illustrates the critical role played by the changing [Ca2+] in the myocardial cytosol. Ca2+ ions are schematically shown as entering through the calcium channel that opens in response to the wave of depolarization that travels along the sarcolemma. These Ca2+ ions “trigger” the release of more calcium from the sarcoplasmic reticulum (SR) and thereby initiate a contraction-relaxation cycle. Eventually the small quantity of Ca2+ that has entered the cell leaves predominantly through an Na+/Ca2+ exchanger, with a lesser role for the sarcolemmal Ca2+ pump. The varying actin-myosin overlap is shown for (B) systole, when [Ca2+] is maximal, and (C) diastole, when [Ca2+] is minimal. D. The myosin heads, attached to the thick filaments, interact with the thin actin filaments. (From LH Opie: Heart Physiology: From Cell to Circulation, 4th ed. Philadelphia, Lippincott, Williams & Wilkins, 2004. Reprinted with permission. Copyright LH Opie, 2004.)
The sarcomere, the structural and functional unit of contraction, lies between adjacent Z lines, which are dark repeating bands that are apparent on transmission electron microscopy. The distance between Z lines varies with the degree of contraction or stretch of the muscle and ranges between 1.6 and 2.2 μm. Within the confines of the sarcomere are alternating light and dark bands, giving the myocardial fibers their striated appearance under the light microscope. At the center of the sarcomere is a dark band of constant length (1.5 μm), the A band, which is flanked by two lighter bands, the I bands, which are of variable length. The sarcomere of heart muscle, like that of skeletal muscle, consists of two sets of interdigitating myofilaments. Thicker filaments, composed principally of the protein myosin, traverse the A band; they are about 10 nm (100 Å) in diameter, with tapered ends. Thinner filaments, composed primarily of actin, course from the Z lines through the I band into the A band; they are approximately 5 nm (50 Å) in diameter and 1.0 μm in length. Thus, thick and thin filaments overlap only within the (dark) A band, whereas the (light) I band contains only thin filaments. On electron-microscopic examination, bridges may be seen to extend between the thick and thin filaments within the A band; these are myosin heads (see below) bound to actin filaments.
THE CONTRACTILE PROCESS
The sliding filament model for muscle contraction rests on the fundamental observation that both the thick and the thin filaments are constant in overall length during both contraction and relaxation. With activation, the actin filaments are propelled farther into the A band. In the process, the A band remains constant in length, whereas the I band shortens and the Z lines move toward one another.
The myosin molecule is a complex, asymmetric fibrous protein with a molecular mass of about 500,000 Da; it has a rodlike portion that is about 150 nm (1500 Å) in length with a globular portion (head) at its end. These globular portions of myosin form the bridges between the myosin and actin molecules and are the site of ATPase activity. In forming the thick myofilament, which is composed of ~300 longitudinally stacked myosin molecules, the rodlike segments of the myosin molecules are laid down in an orderly, polarized manner, leaving the globular portions projecting outward so that they can interact with actin to generate force and shortening (Fig. 265e-4B).
Actin has a molecular mass of about 47,000 Da. The thin filament consists of a double helix of two chains of actin molecules wound about each other on a larger molecule, tropomyosin. A group of regulatory proteins—troponins C, I, and T—are spaced at regular intervals on this filament (Fig. 265e-5). In contrast to myosin, actin lacks intrinsic enzymatic activity but does combine reversibly with myosin in the presence of ATP and Ca2+. The calcium ion activates the myosin ATPase, which in turn breaks down ATP, the energy source for contraction (Fig. 265e-5). The activity of myosin ATPase determines the rate of forming and breaking of the actomyosin cross-bridges and ultimately the velocity of muscle contraction. In relaxed muscle, tropomyosin inhibits this interaction. Titin (Fig. 265e-4D) is a large, flexible, myofibrillar protein that connects myosin to the Z line; its stretching contributes to the elasticity of the heart. Dystrophin is a long cytoskeletal protein that has an amino-terminal actin-binding domain and a carboxy-terminal domain that binds to the dystroglycan complex at adherens junctions on the cell membrane, thus tethering the sarcomere to the cell membrane at regions tightly coupled to adjacent contracting myocytes. Mutations in components of the dystrophin complex lead to muscular dystrophy and associated cardiomyopathy.
FIGURE 265e-5 Four steps in cardiac muscle contraction and relaxation. In relaxed muscle (upper left), ATP bound to the myosin cross-bridge dissociates the thick and thin filaments. Step 1: Hydrolysis of myosin-bound ATP by the ATPase site on the myosin head transfers the chemical energy of the nucleotide to the activated cross-bridge (upper right). When cytosolic Ca2+ concentration is low, as in relaxed muscle, the reaction cannot proceed because tropomyosin and the troponin complex on the thin filament do not allow the active sites on actin to interact with the cross-bridges. Therefore, even though the cross-bridges are energized, they cannot interact with actin. Step 2: When Ca2+ binding to troponin C has exposed active sites on the thin filament, actin interacts with the myosin cross-bridges to form an active complex (lower right) in which the energy derived from ATP is retained in the actin-bound cross-bridge, whose orientation has not yet shifted. Step 3: The muscle contracts when ADP dissociates from the cross-bridge. This step leads to the formation of the low-energy rigor complex (lower left) in which the chemical energy derived from ATP hydrolysis has been expended to perform mechanical work (the “rowing” motion of the cross-bridge). Step 4: The muscle returns to its resting state, and the cycle ends when a new molecule of ATP binds to the rigor complex and dissociates the cross-bridge from the thin filament. This cycle continues until calcium is dissociated from troponin C in the thin filament, which causes the contractile proteins to return to the resting state with the cross-bridge in the energized state. ADP, adenosine diphosphate; ATP, adenosine triphosphate; ATPase, adenosine triphosphatase. (From AM Katz: Heart failure: Cardiac function and dysfunction, in Atlas of Heart Diseases, 3rd ed, WS Colucci [ed]. Philadelphia, Current Medicine, 2002. Reprinted with permission.)
During activation of the cardiac myocyte, Ca2+ becomes attached to one of three components of the heterotrimer troponin C, which results in a conformational change in the regulatory protein tropomyosin; the latter, in turn, exposes the actin cross-bridge interaction sites (Fig. 265e-5). Repetitive interaction between myosin heads and actin filaments is termed cross-bridge cycling, which results in sliding of the actin along the myosin filaments, ultimately causing muscle shortening and/or the development of tension. The splitting of ATP then dissociates the myosin cross-bridge from actin. In the presence of ATP (Fig. 265e-5), linkages between actin and myosin filaments are made and broken cyclically as long as sufficient Ca2+ is present; these linkages cease when [Ca2+] falls below a critical level, and the troponin-tropomyosin complex once more prevents interactions between the myosin cross-bridges and actin filaments (Fig. 265e-6).
FIGURE 265e-6 Signal systems involved in positive inotropic and lusitropic (enhanced relaxation) effects of β-adrenergic stimulation. When the β-adrenergic agonist interacts with the β receptor, a series of G protein–mediated changes leads to activation of adenylyl cyclase and the formation of cyclic adenosine monophosphate (cAMP). The latter acts via protein kinase A to stimulate metabolism (left) and phosphorylate the Ca2+ channel protein (right). The result is an enhanced opening probability of the Ca2+ channel, thereby increasing the inward movement of Ca2+ ions through the sarcolemma (SL) of the T tubule. These Ca2+ ions release more calcium from the sarcoplasmic reticulum (SR) to increase cytosolic Ca2+ and activate troponin C. Ca2+ ions also increase the rate of breakdown of adenosine triphosphate (ATP) to adenosine diphosphate (ADP) and inorganic phosphate (Pi). Enhanced myosin ATPase activity explains the increased rate of contraction, with increased activation of troponin C explaining increased peak force development. An increased rate of relaxation results from the ability of cAMP to activate as well the protein phospholamban, situated on the membrane of the SR, that controls the rate of uptake of calcium into the SR. The latter effect explains enhanced relaxation (lusitropic effect). P, phosphorylation; PL, phospholamban; TnI, troponin I. (Modified from LH Opie: Heart Physiology: From Cell to Circulation, 4th ed. Philadelphia, Lippincott, Williams & Wilkins, 2004. Reprinted with permission. Copyright LH Opie, 2004.)
Intracytoplasmic Ca2+ is a principal determinant of the inotropic state of the heart. Most agents that stimulate myocardial contractility (positive inotropic stimuli), including the digitalis glycosides and β-adrenergic agonists, increase the [Ca2+] in the vicinity of the myofilaments, which in turn triggers cross-bridge cycling. Increased impulse traffic in the cardiac adrenergic nerves stimulates myocardial contractility as a consequence of the release of norepinephrine from cardiac adrenergic nerve endings. Norepinephrine activates myocardial β receptors and, through the Gs-stimulated guanine nucleotide-binding protein, activates the enzyme adenylyl cyclase, which leads to the formation of the intracellular second messenger cyclic AMP from ATP (Fig. 265e-6). Cyclic AMP in turn activates protein kinase A (PKA), which phosphorylates the Ca2+ channel in the myocardial sarcolemma, thereby enhancing the influx of Ca2+ into the myocyte. Other functions of PKA are discussed below.
The sarcoplasmic reticulum (SR) (Fig. 265e-7), a complex network of anastomosing intracellular channels, invests the myofibrils. Its longitudinally disposed tubules closely invest the surfaces of individual sarcomeres but have no direct continuity with the outside of the cell. However, closely related to the SR, both structurally and functionally, are the transverse tubules, or T system, formed by tubelike invaginations of the sarcolemma that extend into the myocardial fiber along the Z lines, i.e., the ends of the sarcomeres.
FIGURE 265e-7 The Ca2+ fluxes and key structures involved in cardiac excitation-contraction coupling. The arrows denote the direction of Ca2+ fluxes. The thickness of each arrow indicates the magnitude of the calcium flux. Two Ca2+ cycles regulate excitation-contraction coupling and relaxation. The larger cycle is entirely intracellular and involves Ca2+ fluxes into and out of the sarcoplasmic reticulum, as well as Ca2+ binding to and release from troponin C. The smaller extracellular Ca2+ cycle occurs when this cation moves into and out of the cell. The action potential opens plasma membrane Ca2+ channels to allow passive entry of Ca2+ into the cell from the extracellular fluid (arrow A). Only a small portion of the Ca2+ that enters the cell directly activates the contractile proteins (arrow A1). The extracellular cycle is completed when Ca2+ is actively transported back out to the extracellular fluid by way of two plasma membrane fluxes mediated by the sodium-calcium exchanger (arrow B1) and the plasma membrane calcium pump (arrow B2). In the intracellular Ca2+ cycle, passive Ca2+ release occurs through channels in the cisternae (arrow C) and initiates contraction; active Ca2+ uptake by the Ca2+ pump of the sarcotubular network (arrow D) relaxes the heart. Diffusion of Ca2+ within the sarcoplasmic reticulum (arrow G) returns this activator cation to the cisternae, where it is stored in a complex with calsequestrin and other calcium-binding proteins. Ca2+ released from the sarcoplasmic reticulum initiates systole when it binds to troponin C (arrow E). Lowering of cytosolic [Ca2+] by the sarcoplasmic reticulum (SR) causes this ion to dissociate from troponin (arrow F) and relaxes the heart. Ca2+ also may move between mitochondria and cytoplasm (H). (Adapted from AM Katz: Physiology of the Heart, 4th ed. Philadelphia, Lippincott, Williams & Wilkins, 2005, with permission.)
CARDIAC ACTIVATION
In the inactive state, the cardiac cell is electrically polarized; i.e., the interior has a negative charge relative to the outside of the cell, with a transmembrane potential of –80 to –100 mV (Chap. 273e). The sarcolemma, which in the resting state is largely impermeable to Na+, has a Na+– and K+-stimulating pump energized by ATP that extrudes Na+ from the cell; this pump plays a critical role in establishing the resting potential. Thus, intracellular [K+] is relatively high and [Na+] is far lower; conversely, extracellular [Na+] is high and [K+] is low. At the same time, in the resting state, extracellular [Ca2+] greatly exceeds free intracellular [Ca2+].
The action potential has four phases (see Fig. 273e-1B). During the plateau of the action potential (phase 2), there is a slow inward current through L-type Ca2+ channels in the sarcolemma (Fig. 265e-7). The depolarizing current not only extends across the surface of the cell but penetrates deeply into the cell by way of the ramifying T tubular system. The absolute quantity of Ca2+ that crosses the sarcolemma and the T system is relatively small and by itself appears to be insufficient to bring about full activation of the contractile apparatus. However, this Ca2+ current triggers the release of much larger quantities of Ca2+ from the SR, a process termed Ca2+-induced Ca2+ release. The latter is a major determinant of intracytoplasmic [Ca2+] and therefore of myocardial contractility.
Ca2+ is released from the SR through a Ca2+ release channel, a cardiac isoform of the ryanodine receptor (RyR2), which controls intracytoplasmic [Ca2+] and, as in vascular smooth-muscle cells, leads to the local changes in intracellular [Ca2+] called calcium sparks. A number of regulatory proteins, including calstabin 2, inhibit RyR2 and thereby the release of Ca2+ from the SR. PKA dissociates calstabin from the RyR2, enhancing Ca2+ release and thereby myocardial contractility. Excessive plasma catecholamine levels and cardiac sympathetic neuronal release of norepinephrine cause hyperphosphorylation of PKA, leading to calstabin 2–depleted RyR2. The latter depletes SR Ca2+ stores and thereby impairs cardiac contraction, leading to heart failure, and also triggers ventricular arrhythmias.
The Ca2+ released from the SR then diffuses toward the myofibrils, where, as already described, it combines with troponin C (Fig. 265e-6). By repressing this inhibitor of contraction, Ca2+ activates the myofilaments to shorten. During repolarization, the activity of the Ca2+ pump in the SR, the SR Ca2+ ATPase (SERCA2A), reaccumulates Ca2+ against a concentration gradient, and the Ca2+ is stored in the SR by its attachment to a protein, calsequestrin. This reaccumulation of Ca2+ is an energy (ATP)-requiring process that lowers the cytoplasmic [Ca2+] to a level that inhibits the actomyosin interaction responsible for contraction, and in this manner leads to myocardial relaxation. Also, there is an exchange of Ca2+ for Na+ at the sarcolemma (Fig. 265e-7), reducing the cytoplasmic [Ca2+]. Cyclic AMP–dependent PKA phosphorylates the SR protein phospholamban; the latter, in turn, permits activation of the Ca2+ pump, thereby increasing the uptake of Ca2+ by the SR, accelerating the rate of relaxation, and providing larger quantities of Ca2+ in the SR for release by subsequent depolarization, thereby stimulating contraction.
Thus, the combination of the cell membrane, transverse tubules, and SR, with their ability to transmit the action potential and release and then reaccumulate Ca2+, plays a fundamental role in the rhythmic contraction and relaxation of heart muscle. Genetic or pharmacologic alterations of any component, whatever its etiology, can disturb these functions.
CONTROL OF CARDIAC PERFORMANCE AND OUTPUT
The extent of shortening of heart muscle and, therefore, the stroke volume of the ventricle in the intact heart depend on three major influences: (1) the length of the muscle at the onset of contraction, i.e., the preload; (2) the tension that the muscle is called on to develop during contraction, i.e., the afterload; and (3) the contractility of the muscle, i.e., the extent and velocity of shortening at any given preload and afterload. The major determinants of preload, afterload, and contractility are shown in Table 265e-2.
|
DETERMINANTS OF STROKE VOLUME |
aArrows indicate directional effects of determinants of contractility. bContractility rises initially but later becomes depressed.
THE ROLE OF MUSCLE LENGTH (PRELOAD)
The preload determines the length of the sarcomeres at the onset of contraction. The length of the sarcomeres associated with the most forceful contraction is ~2.2 μm. This length provides the optimum configuration for the interaction between the two sets of myofilaments. The length of the sarcomere also regulates the extent of activation of the contractile system, i.e., its sensitivity to Ca2+. According to this concept, termed length-dependent activation, myofilament sensitivity to Ca2+ is also maximal at the optimal sarcomere length. The relation between the initial length of the muscle fibers and the developed force has prime importance for the function of heart muscle. This relationship forms the basis of Starling’s law of the heart, which states that within limits, the force of ventricular contraction depends on the end-diastolic length of the cardiac muscle; in the intact heart, the latter relates closely to the ventricular end-diastolic volume.
CARDIAC PERFORMANCE
The ventricular end-diastolic or “filling” pressure sometimes is used as a surrogate for the end-diastolic volume. In isolated heart and heart-lung preparations, the stroke volume varies directly with the end-diastolic fiber length (preload) and inversely with the arterial resistance (afterload), and as the heart fails—i.e., as its contractility declines—it delivers a progressively smaller stroke volume from a normal or even elevated end-diastolic volume. The relation between the ventricular end-diastolic pressure and the stroke work of the ventricle (the ventricular function curve) provides a useful definition of the level of contractility of the heart in the intact organism. An increase in contractility is accompanied by a shift of the ventricular function curve upward and to the left (greater stroke work at any level of ventricular end-diastolic pressure, or lower end-diastolic volume at any level of stroke work), whereas a shift downward and to the right characterizes depression of contractility (Fig. 265e-8).
FIGURE 265e-8 The interrelations among influences on ventricular end-diastolic volume (EDV) through stretching of the myocardium and the contractile state of the myocardium. Levels of ventricular EDV associated with filling pressures that result in dyspnea and pulmonary edema are shown on the abscissa. Levels of ventricular performance required when the subject is at rest, while walking, and during maximal activity are designated on the ordinate. The broken lines are the descending limbs of the ventricular-performance curves, which are rarely seen during life but show the level of ventricular performance if end-diastolic volume could be elevated to very high levels. For further explanation, see text. (Modified from WS Colucci and E Braunwald: Pathophysiology of heart failure, in Braunwald’s Heart Disease, 7th ed, DP Zipes et al [eds]. Philadelphia: Elsevier, 2005, pp 509–538.)
VENTRICULAR AFTERLOAD
In the intact heart, as in isolated cardiac muscle, the extent and velocity of shortening of ventricular muscle fibers at any level of preload and of myocardial contractility relate inversely to the afterload, i.e., the load that opposes shortening. In the intact heart, the afterload may be defined as the tension developed in the ventricular wall during ejection. Afterload is determined by the aortic pressure as well as by the volume and thickness of the ventricular cavity. Laplace’s law states that the tension of the myocardial fiber is the product of the intracavitary ventricular pressure and ventricular radius divided by wall thickness. Therefore, at any particular level of aortic pressure, the afterload on a dilated left ventricle exceeds that on a normal-sized ventricle. Conversely, at the same aortic pressure and ventricular diastolic volume, the afterload on a hypertrophied ventricle is lower than of a normal chamber. The aortic pressure in turn depends on the peripheral vascular resistance, the physical characteristics of the arterial tree, and the volume of blood it contains at the onset of ejection.
Ventricular afterload critically regulates cardiovascular performance (Fig. 265e-9). As already noted, elevations in both preload and contractility increase myocardial fiber shortening, whereas increases in afterload reduce it. The extent of myocardial fiber shortening and left ventricular size determine stroke volume. An increase in arterial pressure induced by vasoconstriction, for example, augments afterload, which opposes myocardial fiber shortening, reducing stroke volume.
FIGURE 265e-9
[/not-level-membership-for-internal-medicine-category]
