Published on 26/02/2015 by admin
Filed under Cardiovascular
Last modified 22/04/2025
This article have been viewed 4037 times
1 Electrocardiography
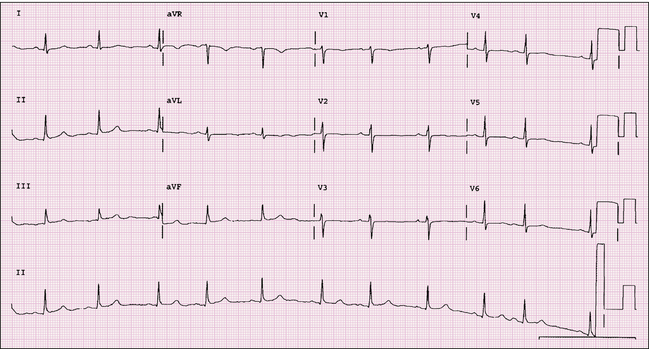
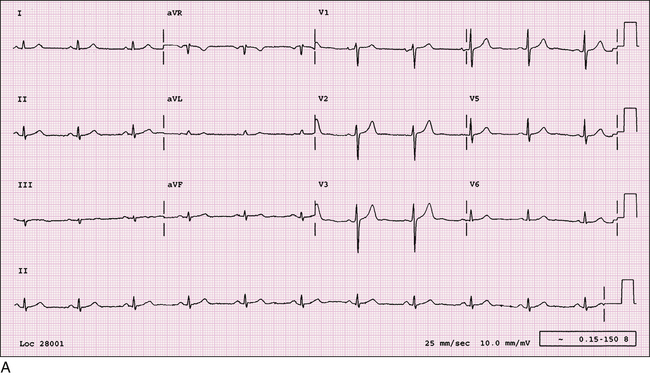
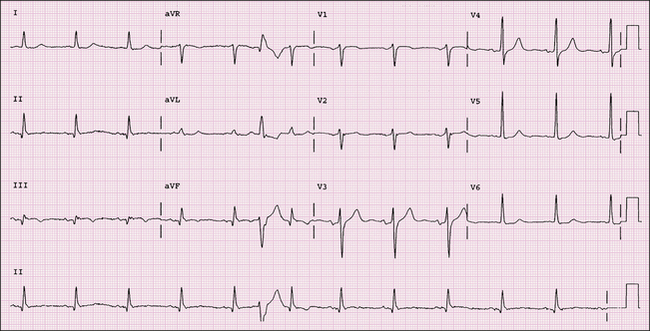
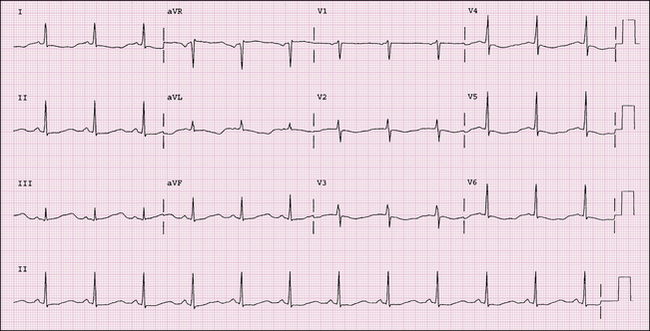
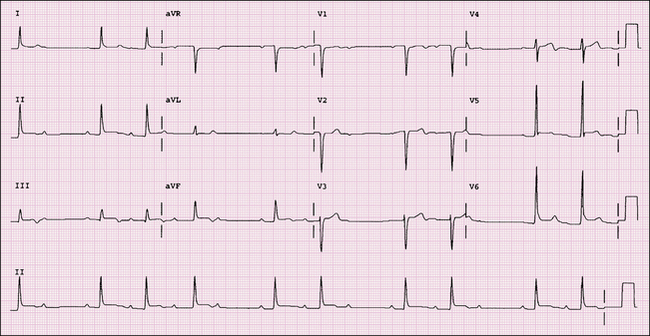
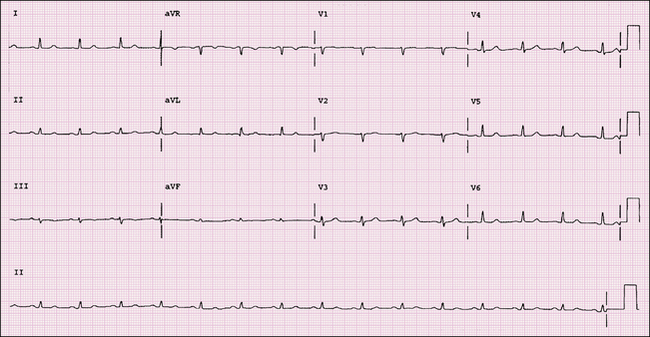
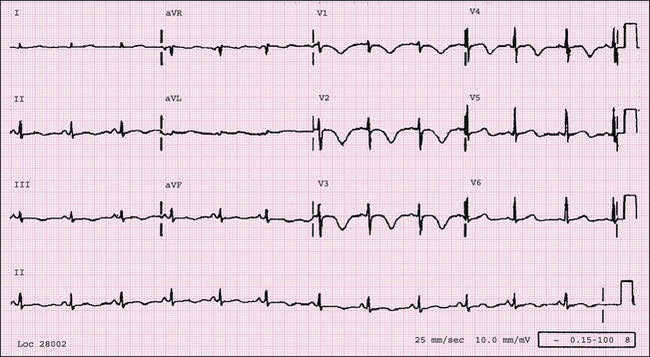
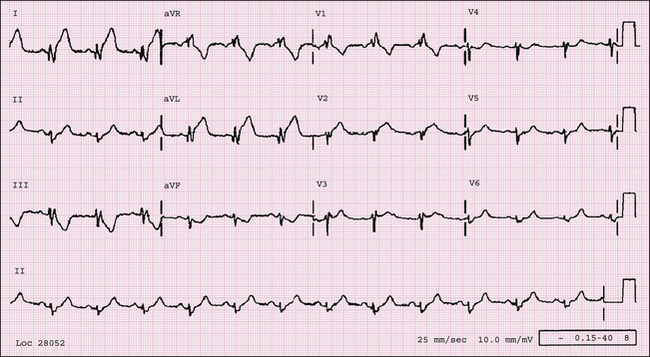
FIGURE 1-1 This ECG reveals sinus arrhythmia. For this diagnosis the P-wave axis and morphology have to be normal with a gradual change in the P-P interval. The difference between the shortest and longest P-P intervals must be >10%.
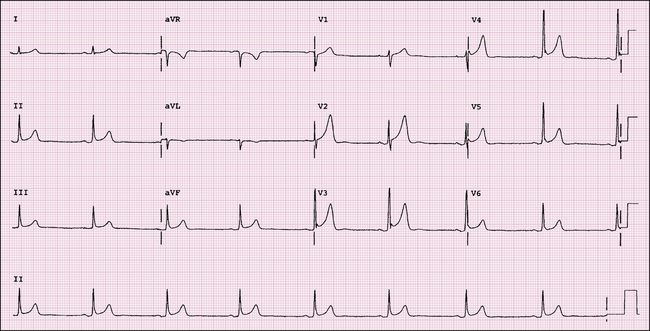
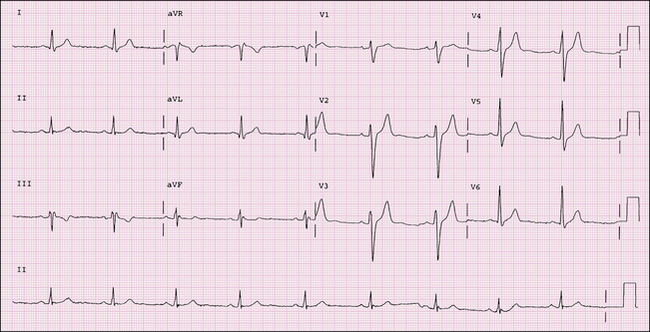
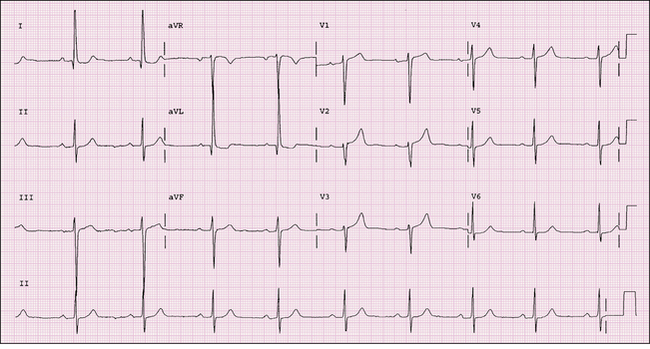
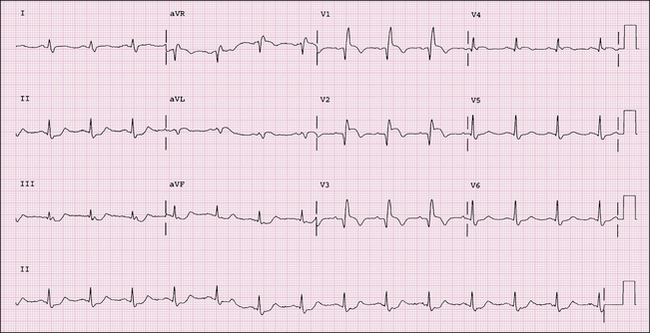
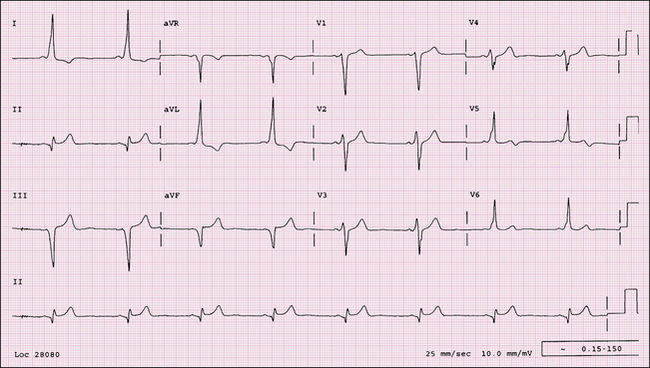
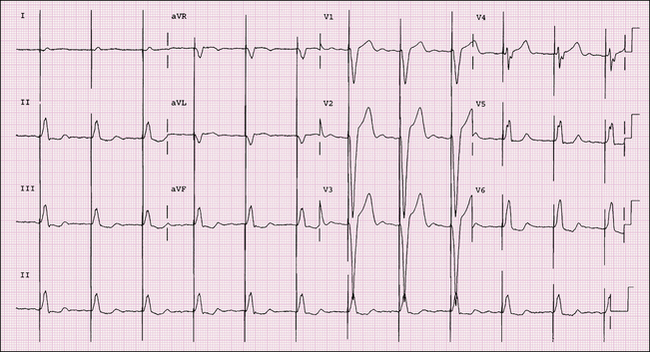
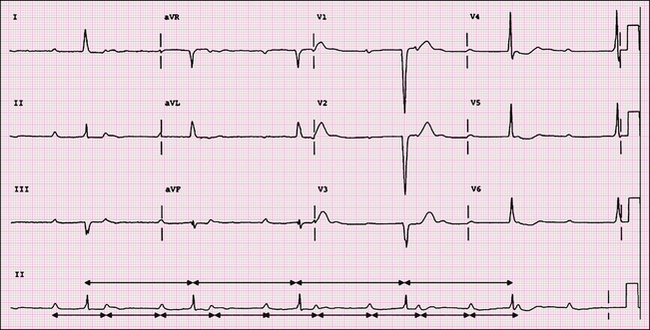
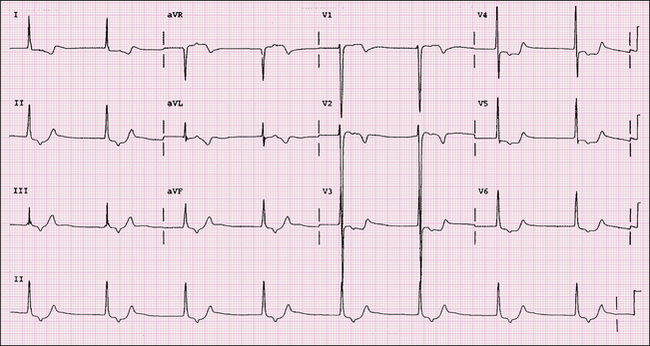
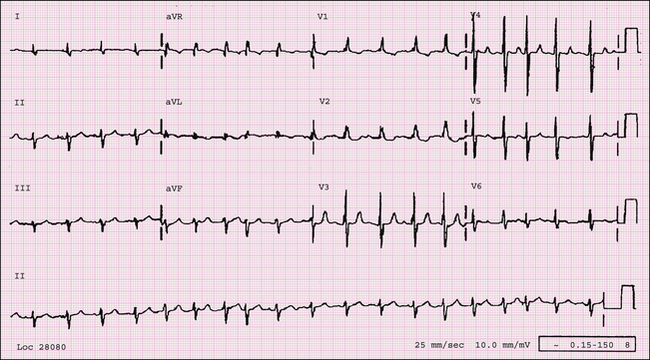
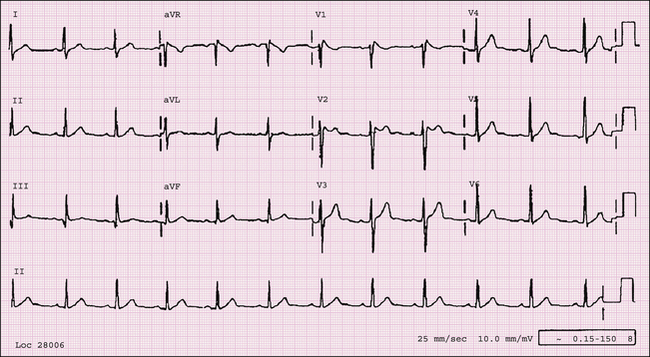
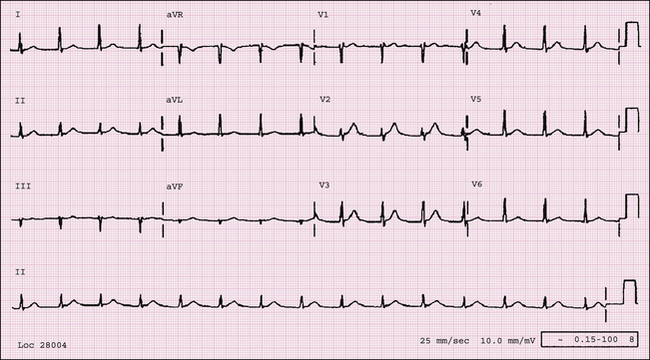
FIGURE 1-2 An ECG obtained from a 28-year-old male college basketball player. It displays sinus bradycardia with early repolarization (normal variant).
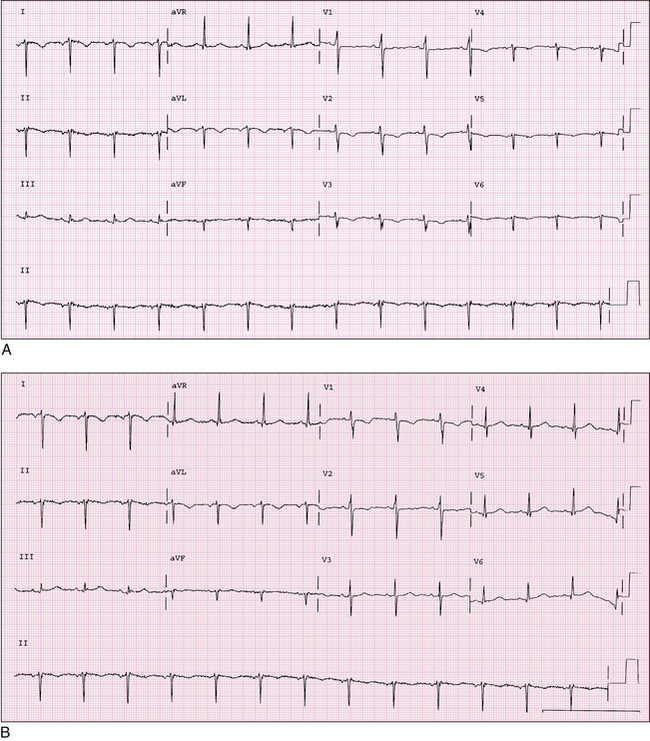
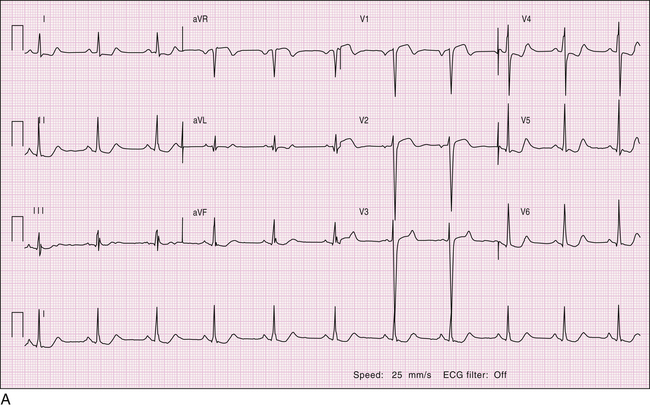
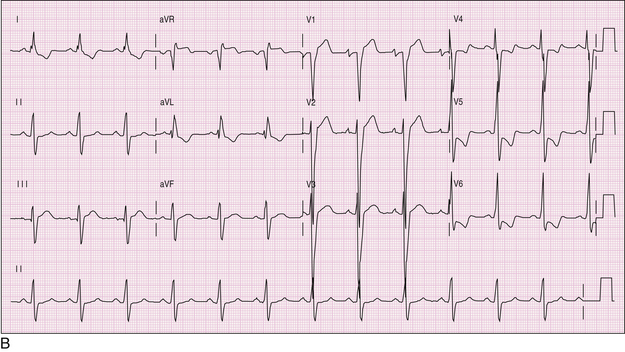
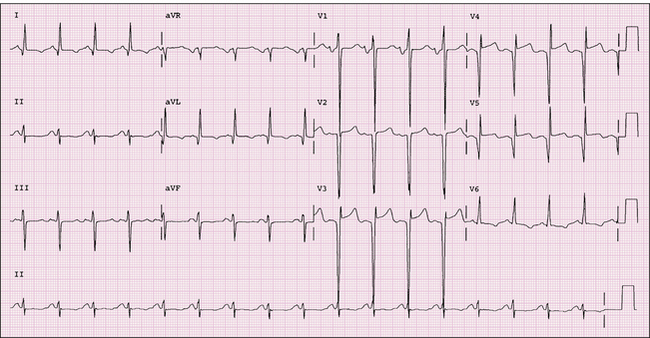
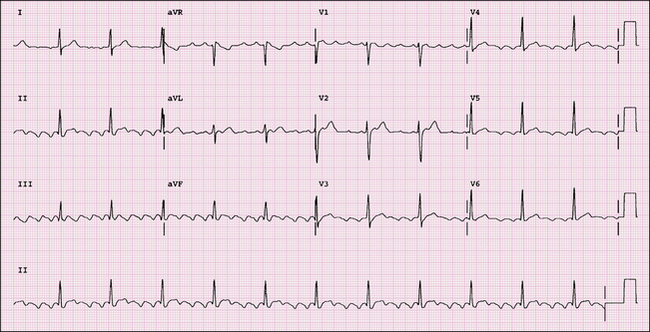
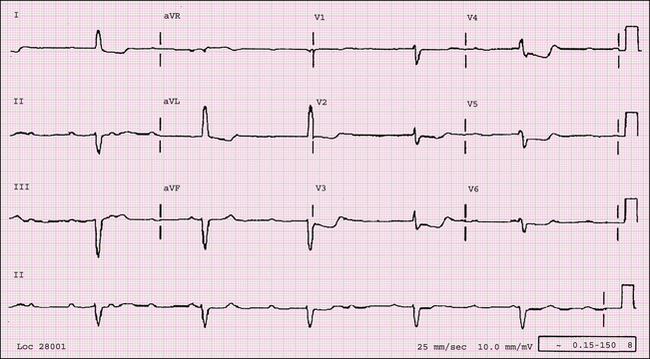
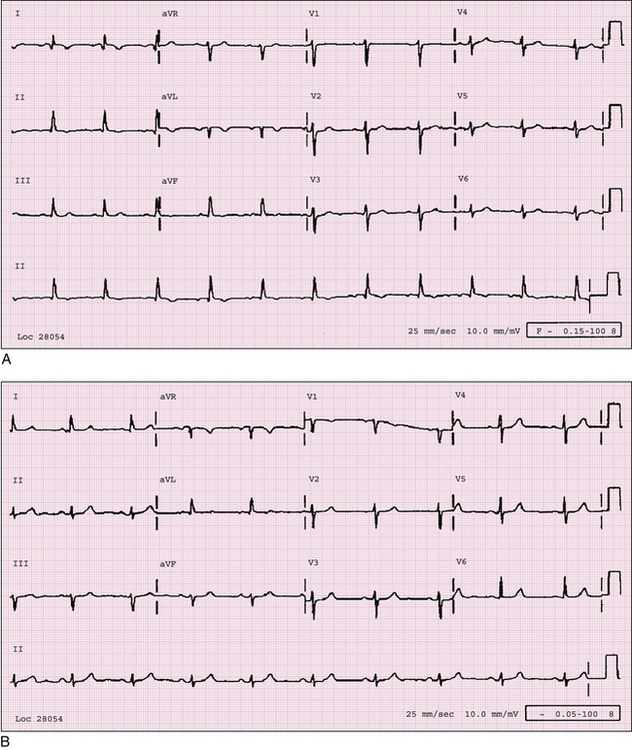
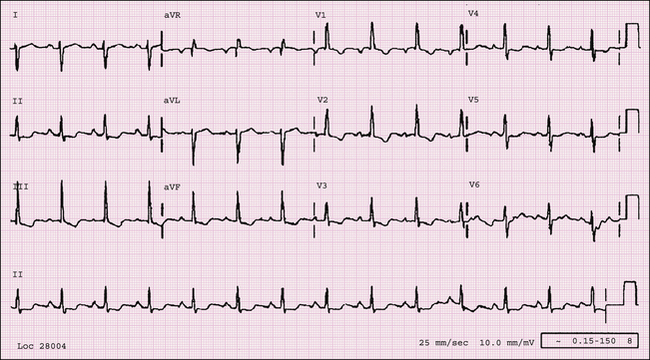
FIGURE 1-3 A, This ECG was obtained on a routine physical examination in a 50-year-old male. The ECG displays sinus rhythm and findings consistent with dextrocardia. Note the positive P waves and upright QRS in lead aVR and the reverse in leads I and aVL. Also note that the R-wave progression in the chest leads is reversed. B, A subsequent ECG was obtained for this patient. In this ECG the chest leads are rearranged onto the right precordium, correcting the abnormal R-wave progression. If the above information was not known, one would then comment on left and right arm lead reversal in their interpretation.
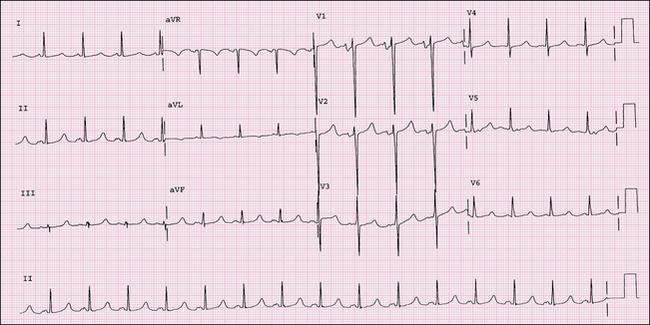
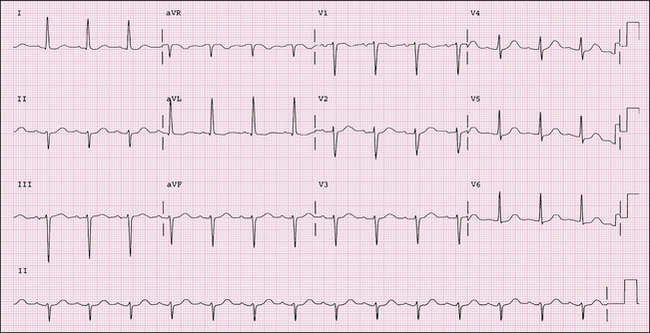
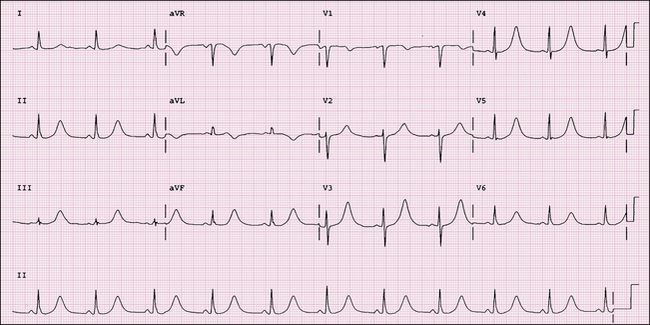
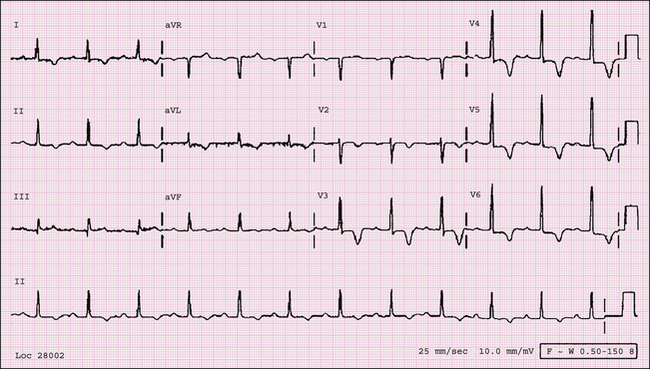
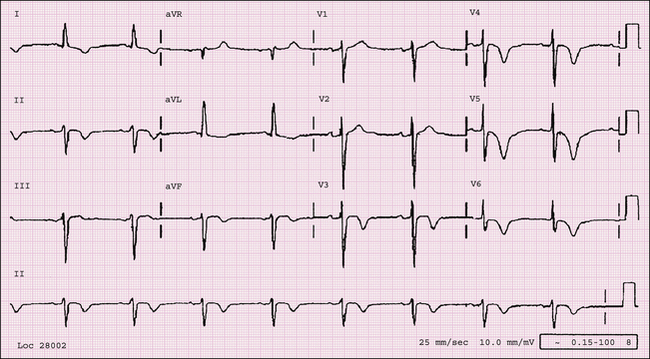
FIGURE 1-4 Normal sinus rhythm, left atrial abnormality, LVH, and prolonged QT interval (487 ms). The criteria for LAE include a notched P wave with duration ≥ 0.12 s in inferior leads (P mitrale) and terminal downward deflection of the P wave in V1 with negative amplitude of 1 mm and duration of 0.04 ms.
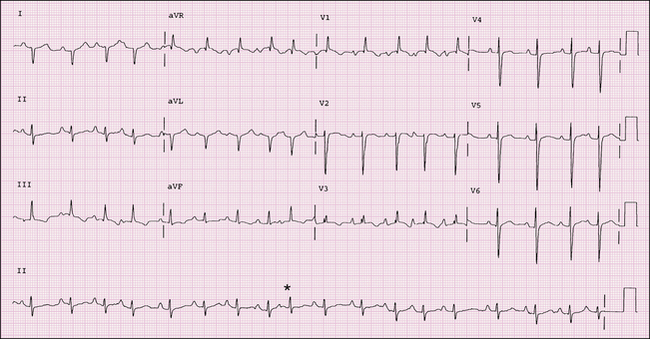
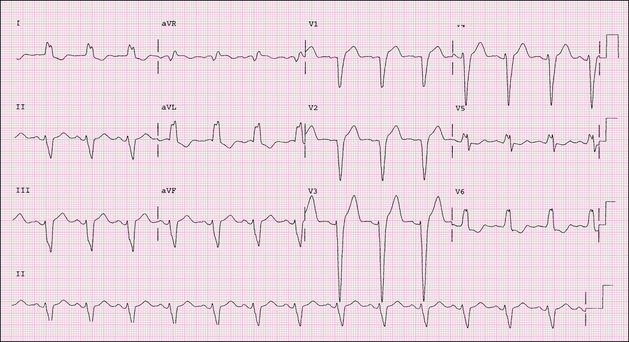
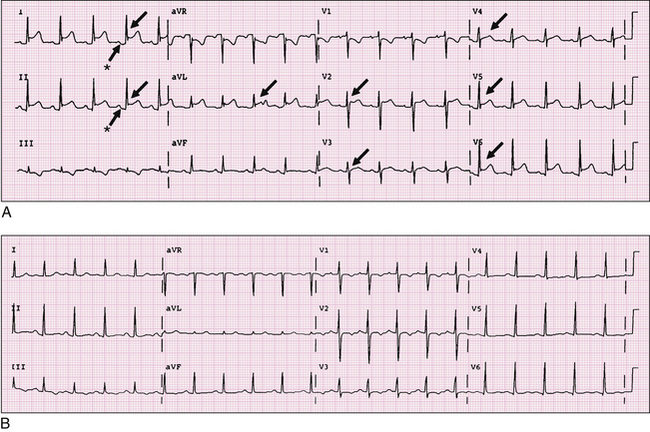
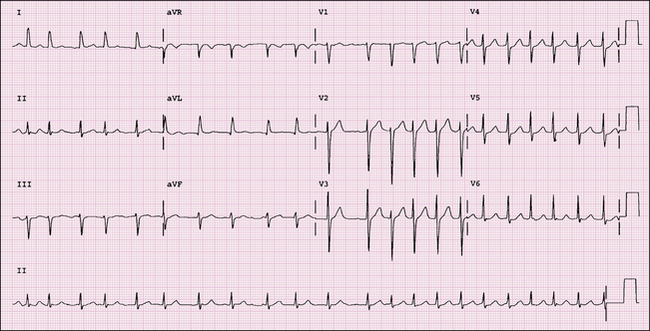
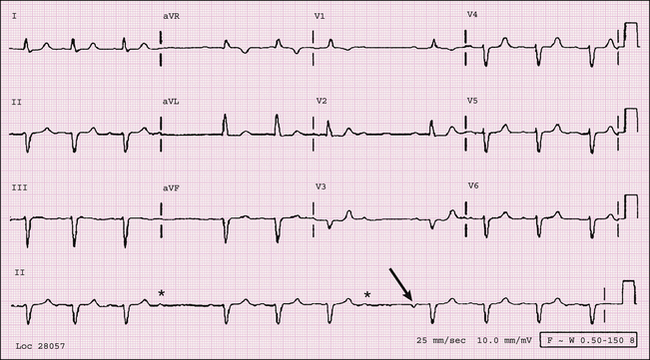
FIGURE 1-5 Note the following findings on this ECG: normal sinus rhythm, sinus arrhythmia, RAD, LAE, RAE, RVH with ST-segment and/or T-wave abnormality secondary to hypertrophy. Lead V2 and V3 are reversed. Finally, an atrial premature complex is present (asterisk).
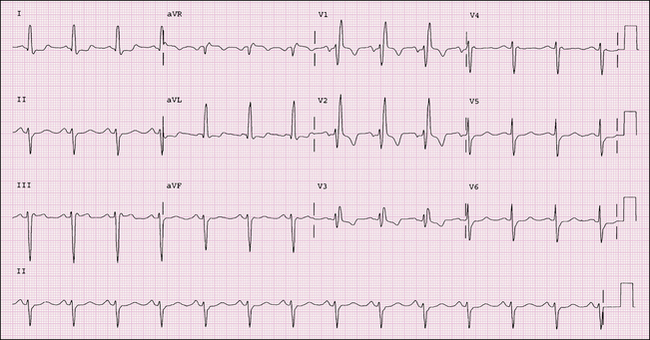
FIGURE 1-6 This ECG reveals sinus rhythm with a nonspecific IVCD. The criteria for IVCD are QRS ≥ 110 ms and morphology not meeting criteria for either LBBB or RBBB. Some of the common causes include conduction system disease, antiarrhythmic drug toxicity, hyperkalemia, WPW syndrome, and hypothermia.
FIGURE 1-7 This ECG was obtained in an asymptomatic 84-year-old male. It reveals sinus rhythm, LAE, complete RBBB, and LAFB. Criteria for LAFB include frontal plane axis of −45° to −90°, qR pattern in lead aVL, R peak time in lead aVL of 45 msec or more, and QRS duration less than 120 msec in absence of a RBBB.
FIGURE 1-8 Sinus rhythm with LAFB. Criteria for LAFB are axis between −45° and −90°, qR complex in lead aVL, R peak time in lead aVL of 45 msec or more, and QRS duration less than 120 msec. In addition, other reasons for LAD such as LVH or inferior infarct should be absent. Remember in the presence of LAFB, voltage criteria for LVH using the R-wave amplitude in lead aVL in isolation is not applicable.
FIGURE 1-9 This ECG was obtained in a 65-year-old female with cardiomyopathy. It demonstrates sinus rhythm and complete LBBB. For a diagnosis of complete LBBB the following criteria should be present: QRS duration > 120 ms; delayed intrinsicoid deflection in the left-sided precordial leads (V5 and V6); broad monophasic R waves in leads I, aVL, V5, and V6; QS or rS complex in lead V1; and absent septal Q waves in the left-sided leads.
FIGURE 1-10 A 34-year-old male with exertional shortness of breath. The ECG reveals sinus bradycardia (rate 50 bpm), voltage criteria for LVH with pseudo Q waves in leads I and aVL. An echocardiogram confirmed the diagnosis of HCM.
FIGURE 1-11 A, This ECG was obtained in a 29-year-old male with a history of HCM with a significant outflow tract gradient of 90 mm Hg. The ECG reveals sinus rhythm, LAE, and LVH with ST-T abnormalities due to hypertrophy. B, The same patient, after failing medical therapy, underwent surgical septal resection. Postoperatively he developed an IVCD resembling LBBB.
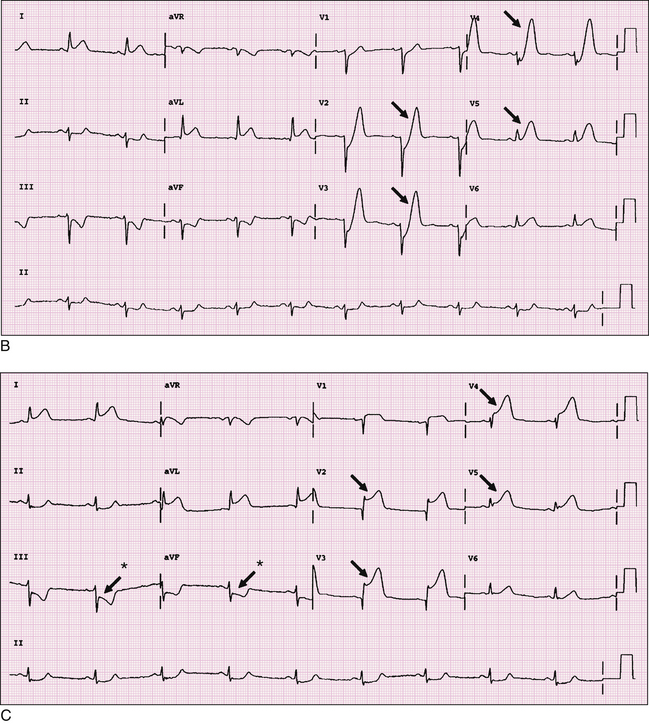
FIGURE 1-12 A, A 56-year-old male presented to the emergency department promptly after the onset of precordial chest pain, nausea, and shortness of breath. An ECG was obtained that revealed normal sinus rhythm with low voltage in the frontal leads.Figure 1-12—cont’dB, This ECG was obtained 30 minutes after onset of pain. There are hyperacute T waves (arrows) in the precordial leads, suggesting acute anterolateral myocardial injury. ST-segment elevation is present in leads I and aVL. Reciprocal changes of ST-segment depression and T-wave inversion are noted inferiorly. C, A third ECG was obtained as the patient was being prepared for the cardiac catheterization laboratory. ST-segment elevation (arrows) and anterior Q waves developed indicative of acute anterior and lateral MI/injury. Note reciprocal ST-segment depression (arrows with asterisks) in the inferior leads.
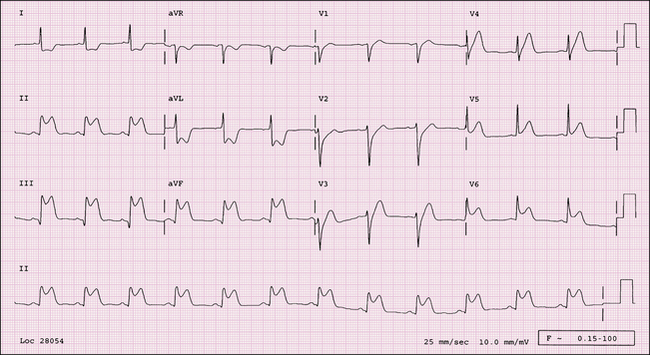
FIGURE 1-13 This ECG reveals sinus rhythm with acute inferolateral injury. ST-segment elevation is present in leads II, III, aVF, V5, and V6. Reciprocal ST-segment depression is present in the high lateral leads, I and aVL. Diagnostic Q waves consistent with acute inferior infarction are present in lead III but borderline in aVF.
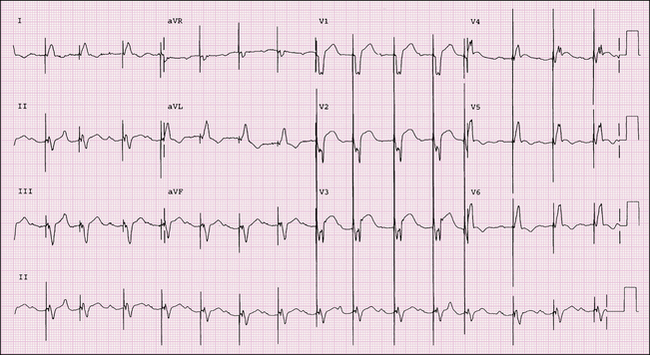
FIGURE 1-14 This ECG reveals sinus rhythm, first-degree AV block, and an atrial-sensed and ventricular-paced rhythm. An acute AMI is evident on this ECG. Note the primary ST-segment and T-wave changes best seen in V4 and V5.
FIGURE 1-15 This ECG reveals sinus rhythm with an interpolated PVC and an age-indeterminate inferior wall MI. An interpolated PVC occurs most often when the sinus rate is slow and it does not disturb the sinus rhythm.
FIGURE 1-16 This 69-year-old male presented with sudden onset of chest pain to the emergency department. The ECG reveals sinus rhythm, RBBB, with Q waves and ST-segment elevation in leads V1 to V4, suggesting acute anteroseptal STEMI. Note RBBB does not interfere with the diagnosis of AMI as LBBB does.
FIGURE 1-17 This ECG was obtained from a 78-year-old male with a history of MI 10 years ago. He is followed in a heart failure clinic. The ECG reveals normal sinus rhythm, LAE, borderline LAD, and an old anterior and lateral MI. There is persistent ST-segment elevation anteriorly, suggesting ventricular aneurysm.
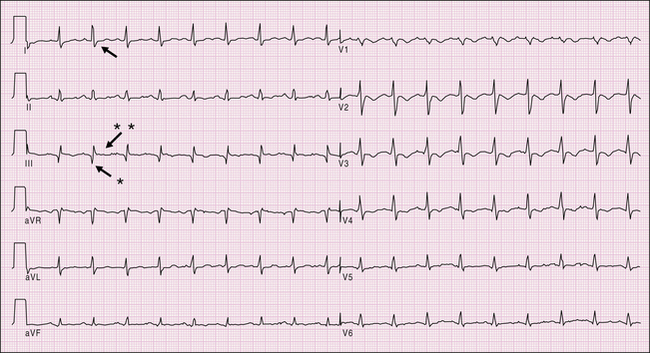
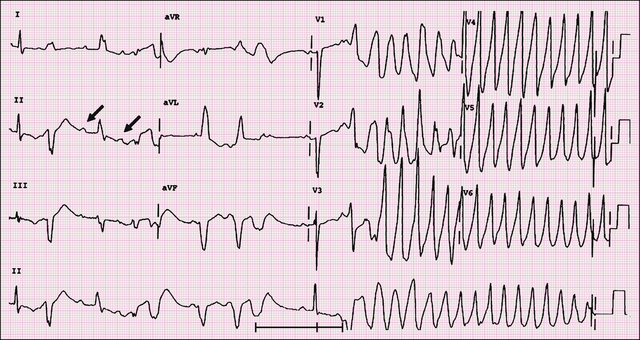
FIGURE 1-18 A, An ECG of a 43-year-old male who presented with fevers, body aches, and chest pain on inspiration reveals sinus rhythm, diffuse ST-segment elevations (arrows) (except in leads aVR and V1), and PR-segment depression (arrows with asterisks), best visualized in leads I and II. These changes suggest acute pericarditis. Other findings that may be present in such cases are tachycardia, low-voltage QRS complexes, and electrical alternans. B, Follow-up ECG of the same patient demonstrates typical evolutionary changes in acute pericarditis. Interval resolution of the ST-segment elevation and inversion of T waves are now present.
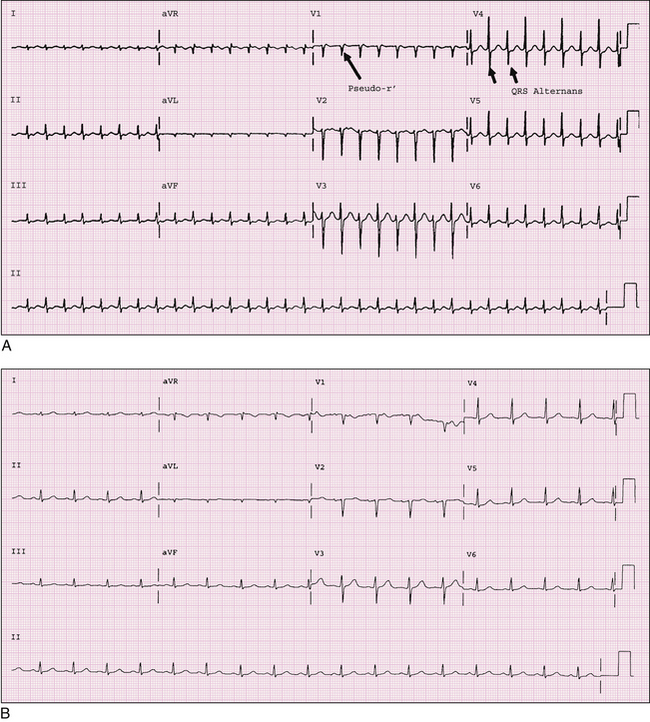
FIGURE 1-19 A, An ECG of a 32-year-old male who presented with sudden onset of palpitations reveals a narrow complex tachycardia (SVT). Note the pseudo-r´ (retrograde P wave; long arrow) seen in the terminal portion of lead V1, suggesting AVNRT. QRS alternans (short arrows), noted here, is often present during SVT. B, The patient received I.V. adenosine, which terminated his SVT, and this ECG was then obtained. Findings indicate normal sinus rhythm. Note the normal appearance of the QRS complex in lead V1. Compare this with the morphology in lead V1 during the tachycardia.
FIGURE 1-20 This 54-year-old male presented to his PCP with a history of palpitations. The ECG reveals sinus bradycardia, short PR interval, delta waves (positive and best seen in leads I, aVL, V5, and V6), suggesting ventricular preexcitation (WPW syndrome). There are negative delta waves inferiorly, simulating inferior Q waves. Electrocardiographically this suggests a right posteroseptal accessory pathway. There are ST-T wave changes in leads I, aVL, and V5 that are due to repolarization abnormalities.
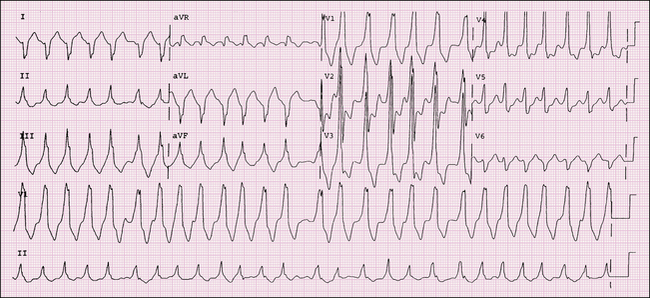
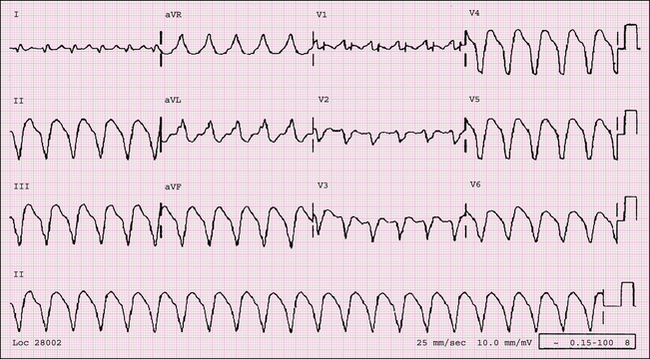
FIGURE 1-21 A 28-year-old female with a history of sudden onset of palpitation and dizziness that required cardioversion. The ECG reveals a rapid irregular wide complex tachycardia. This is atrial fibrillation with rapid ventricular response, with the variable conduction defects seen due to underlying preexcitation (WPW syndrome). A diagnosis of MI, axis deviation, or ventricular hypertrophy should not be made when underlying preexcitation is present.
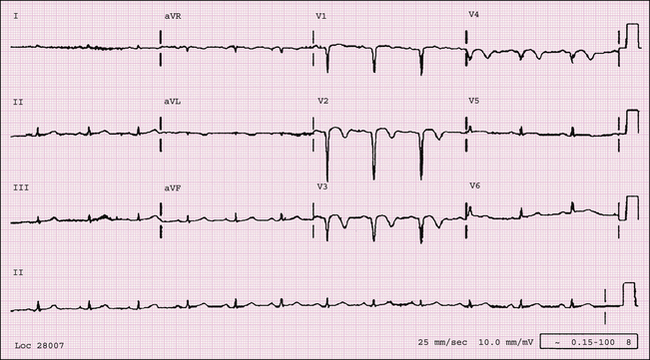
FIGURE 1-22 This ECG was obtained from a patient presenting with syncope and hypoxia. Sinus tachycardia with S1Q3T3 pattern (S1, arrow; Q3, arrow with asterisk; T3, arrow with double asterisks) is present, suggestive of pulmonary embolism. Anterior T-wave inversions in this case are consistent with right ventricular strain. In the appropriate clinical setting, such as in this case, the ECG findings are consistent with the diagnosis of acute cor pulmonale from a pulmonary embolus.
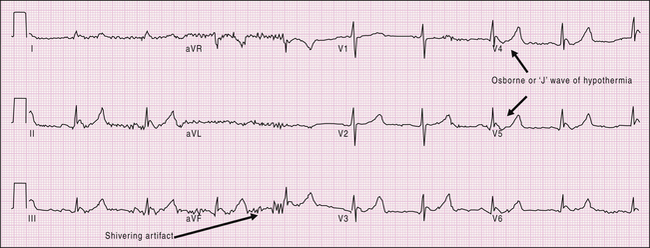
FIGURE 1-23 This ECG was obtained in a patient with hypothermia. Findings include sinus bradycardia, artifact (shivering; long arrow), prolonged QT interval, and J waves/Osborne waves (short arrows).
FIGURE 1-24 This ECG was obtained on a 39-year-old female with meningitis and altered mental status. It reveals sinus rhythm and prolonged QT interval secondary to acute CNS injury. Tall T waves may also suggest hyperkalemia but are often narrow-based unlike these wide-based T waves. Other changes that may be present in a patient with CNS injury include deeply inverted T waves, prominent U waves, ST-segment elevation or depression, and multiple rhythm abnormalities.
FIGURE 1-25 This ECG was obtained on an unresponsive patient after the patient underwent cardioversion for polymorphic VT. Her potassium level was 2.2 mEq/L. The ECG shows sinus rhythm with marked QT prolongation and ST-T abnormalities secondary to hypokalemia.
FIGURE 1-26 Ventricular-paced rhythm with underlying atrial fibrillation. Note the absence of underlying P waves, suggesting underlying atrial fibrillation. This ECG was obtained from a 70-year-old male with a history of symptomatic bradycardia and chronic atrial fibrillation who received a single-chamber ventricular pacemaker.
FIGURE 1-27 A 58-year-old male with a history of ischemic cardiomyopathy presents with a regular wide QRS complex tachycardia (125 bpm) with an indeterminate axis consistent with VT. Findings favoring ventricular origin include QRS morphology resembling a RBBB with R > r´, QRS width > 140 ms, and the time from the beginning of R wave to nadir of s wave > 100 ms. The deflection seen in lead V1 is suggestive of AV dissociation (arrow).
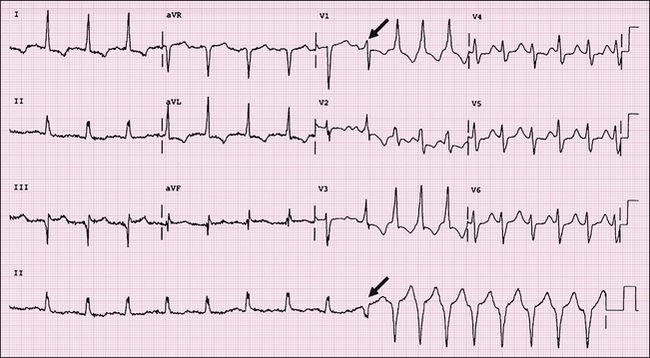
FIGURE 1-28 This ECG shows sinus rhythm with LVH with ST-T wave abnormalities due to hypertrophy. The second half of the ECG reveals VT with a fusion beat (arrow) at the onset. The presence of a fusion beat is evidence of AV dissociation, and a monophasic R wave in V1 is also consistent with VT.
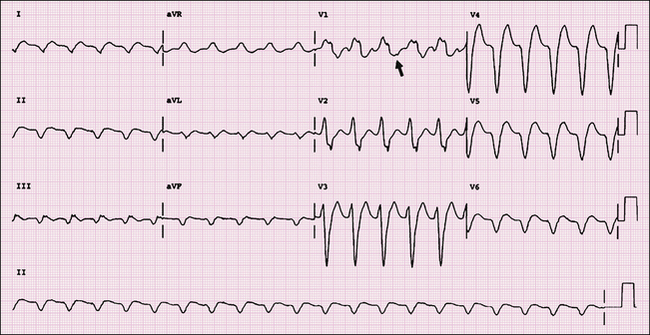
FIGURE 1-29 This patient, who was admitted with complete heart block, then developed bradycardia-induced polymorphic VT (ventricular rates, 250 bpm). This ECG shows the atria and ventricle to be dissociated in the initial half of the tracing (note P waves marked with the arrows). There are multiform PVCs present. In the middle of the tracing there is a sinus beat normally conducted, followed by a fusion beat and then the onset of polymorphic VT. Note the long–short sequence (marked in the figure with brackets), which often occurs before the onset of this arrhythmia.
FIGURE 1-30 This ECG reveals sinus rhythm with first-degree AV block, LAE, and LVH with secondary ST/T wave changes.
FIGURE 1-31 This 52-year-old male was seen in the emergency department with sudden onset of chest pain and nausea. The ECG reveals sinus rhythm and LVH by voltage criteria. There are subtle ST-T wave abnormalities, suggesting injury, in the inferior and lateral leads. Finally, second-degree Mobitz type I AV block (Wenckebach) is present. Note when the shortest PR interval following the Wenckebach sequence has a PR interval > 200 ms, first-degree AV block is also present. Criteria for Mobitz type I AV block are progressive PR prolongation, then block; progressive RR shortening, then block; RR interval containing nonconducted P wave < 2 P-P intervals; and group beating.
FIGURE 1-32 An 84-year-old male presented to the emergency department with presyncopal spells on exertion. The ECG revealed complete heart block with a junctional escape rhythm at a rate of 34 bpm. Note the dissociation of the P waves and QRS complexes. There is voltage criteria for LVH with secondary ST-T wave changes and an incomplete LBBB (QRS = 118 ms).
FIGURE 1-33 This ECG reveals atrial flutter with 2:1 AV block. This can often be difficult to diagnose. The clue lies in the heart rate close to 150 bpm. Flutter waves are usually at rates of 240–340 bpm as opposed to atrial tachycardia with atrial rates < 240 bpm.
FIGURE 1-34 This ECG reveals atrial flutter with 4:1 AV block. The flutter waves give the baseline a saw-tooth appearance, which is best seen in the inferior leads.
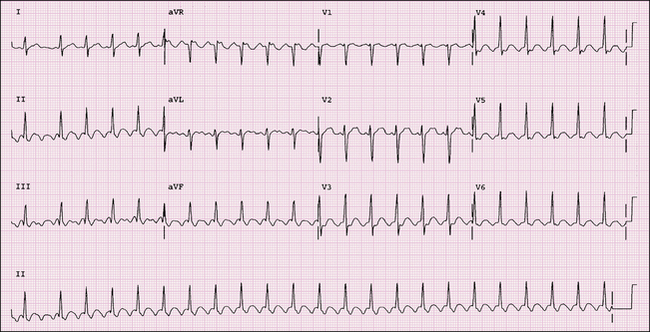
FIGURE 1-35 This ECG demonstrates atrial fibrillation with rapid ventricular response. Note that P waves are absent, and there is irregularity of the R-R intervals.
FIGURE 1-36 This ECG reveals low voltage in both limb (R+S < 5 mm) and precordial (R+S < 10 mm) leads. Depending on the accompanying clinical situation, consider the following common diagnoses: pericardial effusion, COPD, and myxedema. Other causes, such as morbid obesity and infiltrative myocardial diseases, are also possibilities.
FIGURE 1-37 This ECG was obtained in an 80-year-old lethargic male. The rhythm is junctional bradycardia with retrograde P waves (note the inverted P waves in the inferior leads). Other findings include LVH with secondary ST-T wave changes.
FIGURE 1-38 This ECG was obtained in a 60-year-old male who presented with light-headedness. It reveals sinus rhythm at a rate of 88 bpm with complete heart block and a ventricular escape rhythm at a rate of 34 bpm.
FIGURE 1-39 A 60-year-old female presented to the emergency department with chest pain. Coronary angiography revealed normal coronary arteries. Her ECG is characteristic of apical ballooning syndrome, also known as Takotsubo cardiomyopathy. Sinus rhythm with diffuse broad-based T-wave inversions and prolongation of the QT interval (600 ms) is present. Differential diagnosis would include CNS pathology, apical variant of HCM, pheochromocytoma, myocarditis, and anterior ischemia. In apical ballooning syndrome, ST-segment elevation may be the initial ECG finding at the time of presentation during active chest pain.
FIGURE 1-40 This 27-year-old male complained of palpitations. His ECG revealed sinus tachycardia with frequent atrial premature complexes, an incomplete RBBB, and LAD. A complete or incomplete RBBB with LAD is characteristic of an ostium primum ASD, which was diagnosed by echocardiography in this patient.
FIGURE 1-41 In a 75-year-old male with a dual-chamber pacemaker, an ECG revealed a paced rhythm at a rate of 130 bpm, which was the upper rate limit set for his device. He was treated initially by applying a magnet over the pacemaker, which terminated this rhythm. He had PMT. The initiation of PMT involves the tracking of a retrograde P wave from a PVC and depolarization of the atrium before the next atrial-paced beat. This impulse can then trigger the pacemaker and a circuit is established, thereby generating PMT or endless-loop tachycardia. To prevent PMT, the pacemaker is programmed so the atrial lead is insensitive to the retrograde P wave. This is accomplished by increasing the post-ventricular atrial refractory period.
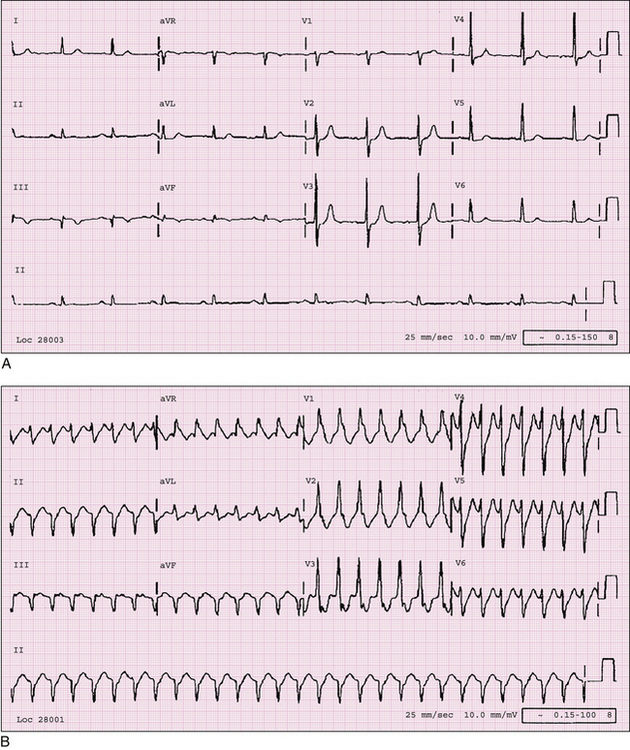
FIGURE 1-42 A, ECG of an 86-year-old female shows sinus rhythm and an inferior infarct, age indeterminate. She was hospitalized for evaluation of syncope. B, This ECG, obtained during her hospitalization, reveals a wide-complex tachycardia consistent with VT. Features suggestive of VT include RBBB with R > R′, QRS width > 140 ms, and change in axis from baseline to extreme northwest axis. Other features of VT not present here include AV dissociation, absence of RS complexes in precordial leads, R-to-S interval > 100 ms, and concordance across the precordial leads.
FIGURE 1-43 A 90-year-old male with Mobitz type II second-degree AV block. In type II second-degree AV block, there are intermittent blocked P waves (asterisks). The PR intervals of the conducted impulses are constant. However, the PR interval may be slightly shorter in the impulse following the block because of improved conduction that may occur after the blocked beat. The beat marked with an arrow has a slightly different P-wave morphology and is like an escape complex.
FIGURE 1-44 A 50-year-old male with Brugada ECG pattern. There is incomplete RBBB with ST-segment elevation across right precordial leads. This ECG has features of type I and type II Brugada pattern. The type I ECG pattern (noted in lead V1) is characterized by pronounced elevation of the J point, a coved-type ST segment, and an inverted T wave. The type II pattern is characterized by ST-segment elevation >1 mm with a saddleback configuration as seen in lead V2. The type III pattern, (not shown here), is characterized by saddleback ST-segment elevation < 1 mm.
FIGURE 1-45 A, This ECG demonstrates limb lead reversal (left and right arm). Note the positive P wave and T wave in lead aVR; negative P wave in leads I, II, and aVL; and negative T wave in leads I and aVL. The R-wave progression across the precordial leads is normal excluding dextrocardia. B, Repeat ECG after correct limb lead placement revealing normal sinus P-wave configuration and QRS and T-wave complexes.
FIGURE 1-46 A 72-year-old male with the apical variant of HCM. His ECG reveals sinus rhythm with characteristic giant T-wave inversions (defined as > −10 mm in amplitude) and tall R waves across lateral precordial leads. Note first-degree AV block is present, which is also common in this variant.
FIGURE 1-47 A 65-year-old female presenting with chest pain. ECG reveals sinus rhythm with complete RBBB. There is also ST-segment elevation in the high lateral leads (I, aVL) with reciprocal ST-segment depression inferiorly. Q waves are present in leads I and aVL, indicating an acute STEMI. ST-segment elevation indicative of injury can be diagnosed in RBBB, unlike in LBBB, where this finding would be masked by the bundle branch block.
FIGURE 1-48 A 57-year-old male with digoxin overdose. His ECG revealed an accelerated junctional rhythm at a rate of 88 bpm, which is a classic rhythm seen in patients with digoxin toxicity. Paroxysmal atrial tachycardia with block is another rhythm associated with digoxin toxicity.
FIGURE 1-49 A 46-year-old male with shortness of breath. ECG reveals sinus rhythm with LAE, RAD, and RVH. The criteria for RVH present are: the tall R wave in lead V1 > 6 mm, R/S ratio > 1 in lead V1, and R/S ratio < 1 in lead V6. A differential diagnosis for a tall R wave in lead V1 would include posterior MI, RBBB, WPW syndrome, Duchenne muscular dystrophy, incorrect lead placement, and a normal variant.
FIGURE 1-50 An 80-year-old female diagnosed with an intracranial hemorrhage. Her ECG reveals sinus rhythm with diffuse anterolateral T-wave inversions and a prolonged QT interval of 600 ms. Corrected QT interval is 547 ms. There is LAFB; hence, lead aVL cannot be used as a sole criterion for LVH.
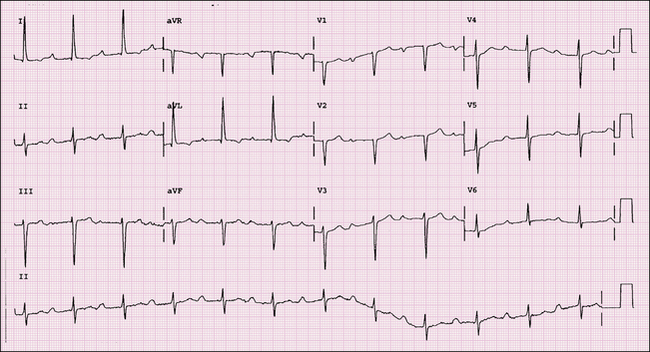
FIGURE 1-51 A 63-year-old male with a history of chest pain several weeks before admission who presented with CHF. ECG revealed sinus rhythm and a recent anterior infarct with persistent T-wave changes. Low voltage is noted in the limb leads, which is consistent with an extensive infarction.
Cardiovascular Imaging Review Expert Consult
WhatsApp us