Electrocardiogram Identification
Physiology and Anatomy of the Conduction System
Cardiac Action Potential
The cardiac action potential is generated by the flow of ions across myocardial cell membranes; it has a distinctive shape and five phases (phases 0 to 4).1 In the cell’s resting state, a negative membrane potential exists, based on the selective permeability of the cardiac cell membrane and the relative concentrations of sodium (Na+), calcium (Ca2+), and potassium (K+) ions in the internal and external cellular environments. The relative time-sensitive ionic currents for each species are color-coded and labeled in Figure 12-1, and the cardiac action potential is superimposed over the individual currents that compose it. At rest, a typical ventricular cardiomyocyte membrane is primarily permeable only to K+ ions, allowing the movement of K+ out of the cell until the charge inside is approximately −90 mV, relative to the charge outside. This is the resting membrane potential of the cardiomyocyte and is close to the equilibrium potential for K+. The membrane potential changes rapidly at the onset of depolarization, with the opening of Na+ and Ca2+ channels, allowing these ions to cross the membrane and enter the cell. Calcium then becomes available for contraction of cardiac muscle myofibrils.
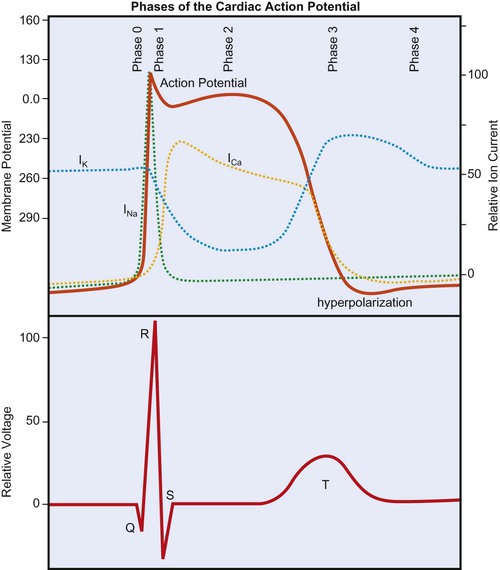
During depolarization, the membrane’s potential becomes positive and the cell contracts. As in skeletal muscle, the Na+ channels are fast-opening and fast-closing mechanisms, allowing Na+ to rapidly enter the myocardial cell on depolarization (referred to as phase 0 of the cardiac action potential in Figure 12-1). Unlike skeletal muscle, however, cardiac muscle has a prolonged action potential as a result of the slower and extended opening of the Ca2+ channels. After initial depolarization, some K+ channels remain open while others close, and repolarization begins (phase 1) as a result of outward K+ current flowing through the open K+ channels. A plateau phase (phase 2) of the action potential exists, during which the outward flow of K+ ions is balanced by an inward flow of Ca2+ ions. This prolongs depolarization and delays return to the resting membrane potential. Closure of the slow Ca2+ channels at onset of repolarization is accompanied by the opening of additional K+ channels, causing a rapid outflow of K+, which completes repolarization (phase 3 in Figure 12-1), restoring resting negative membrane potential. During the cell’s resting phase (phase 4 of Figure 12-1), Na+ and Ca2+ are actively pumped out of the cell, and K+ is pumped into the cell, restoring the ionic gradients needed for repolarization.1,2,3
From Figure 12-1 it can be seen that certain ionic currents contribute to particular phases of the cardiac action potential. The Na+ current is the predominant factor in the initial depolarization, whereas the Ca2+ current is important in the plateau phase, and the K+ currents are important in the duration of the action potential and in repolarization. Many of the drugs used to treat dysrhythmias work on the channels for one or more of these three ions and affect their permeability. Furthermore, the electrical current produced by these ionic currents is transmitted through the conductive tissues surrounding the heart. The “wave” of depolarization that is propagated through the conduction system and contractile tissue of the heart, as well as repolarization, which takes place in a particular spatial manner, are detectable by the surface electrodes of the ECG.
Conduction System
Figure 12-2 displays the anatomical association of the cardiac electrical conduction system with its components on the ECG. Atrial depolarization is initiated by a spontaneously generated impulse that originates in the SA node. The impulse is then transmitted throughout the atrial muscle, resulting in atrial contraction. The event is recorded as the P wave of the ECG. The impulse is also transmitted, via rapidly conducting internodal pathways, to the AV node. Atrial repolarization is not recorded by the ECG because it occurs during ventricular depolarization.
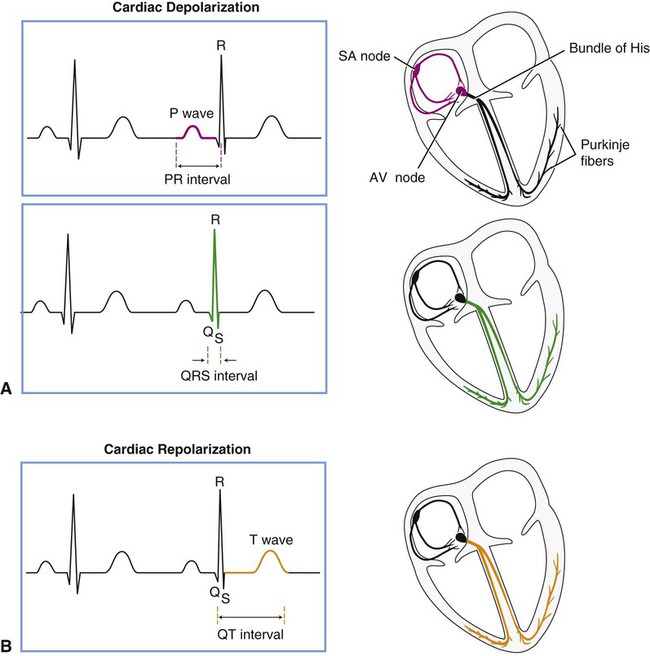
Impulse conduction slows within the AV node considerably, resulting in a delaying of the impulse before it reaches the ventricular conduction system. The pause in impulse propagation allows the atria to contract and fill the ventricles with blood. The P-R interval of the ECG represents this period between the onset of atrial depolarization and the onset of ventricular depolarization. Normally the P-R interval lasts between 0.12 and 0.20 second.4
Following passage through the AV node, the impulse continues to the AV bundle (bundle of His) and then to Purkinje fibers, which transmit the impulse rapidly to the ventricular endocardium. Ventricular depolarization corresponds to phase 0 of the cardiac action potential (see Figure 12-1) and is represented in the ECG by the QRS complex. The depolarization wave propagates relatively slowly throughout the ventricular myocardium. The span of time elapsing during ventricular depolarization is reflected by the QRS interval, which normally ranges between 0.06 and 0.1 seconds. Ventricular depolarization originates in the interventricular septum, creating the Q wave, which is normally small or absent, depending on the lead. The depolarization wave next spreads to the apex and then to the right and left ventricles, causing the R and S waves. Depolarization also propagates in an endocardial to epicardial direction within the ventricles.2,3 A normal QRS duration indicates that the impulse originated in the SA node or a region above the AV node (supraventricular). A long QRS interval (≥0.1 second) suggests that the impulse arose from the ventricle or originated abnormally in supraventricular tissue. The normal sequence of depolarization is as follows: SA node to AV node to bundle of His to Purkinje fibers to the ventricular myocardium. When this sequence is followed, the ECG correlates with the mechanical events of the cardiac cycle as shown in Figure 4-13.
After ventricular depolarization, the ECG deflection returns to baseline, and this pause in electrical activity corresponds with the plateau phase (phase 2) of the cardiac action potential. Ventricular repolarization is represented by the T wave and corresponds to phase 3 of the cardiac action potential. The configuration of the S-T segment is an important marker of myocardial ischemia or infarction. Following the T wave, a U wave may also be present. The source of the U wave is not well understood.5 Although U wave inversion may indicate ischemia involving the left ventricular wall,6 it is not a unique marker and is not as sensitive as S-T segment changes in predicting ischemia; therefore it is not a useful clinical marker.7
Within the ventricle, individual cardiomyocytes are in direct communication with each other via gap junctions. This facilitates rapid spread of the wave of depolarization from cell to cell, allowing the right and left ventricular heart muscle to function as a syncytium, or a single pumping unit.8 Note that the ventricles remain in a state of contraction until slightly after repolarization. This period of contraction corresponds to the Q-T interval on the ECG. Diastole, therefore, begins subsequent to the end of the T wave and continues until the next ventricular depolarization. Note also that atrial depolarization and contraction occur during diastole.
Electrocardiogram
Recording the Electrocardiogram
Before examining the timing of the wave forms and the rhythms of the ECG, a basic understanding of the principles of electrocardiography is needed. A standard 12-lead configuration is used for the diagnosis and medical management of cardiac conditions (Figure 12-3): six leads record the electrical signals in the frontal plane, and six leads record signals in the transverse plane. The placements of the 10 electrodes for a 12-lead ECG are shown in Figure 12-4 (note that 12 electrodes are not necessary because some leads serve a dual purpose).
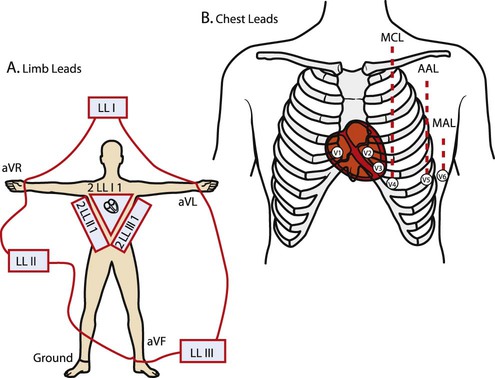
The frontal-plane leads include three standard bipolar limb leads, referred to as leads I, II, and III, and three augmented unipolar limb leads, referred to as aVR (right arm), aVL (left arm), and aVF (left leg). These two sets of leads share the same electrodes but view the electrical activity of the heart from different perspectives. The bipolar leads have a single positive and a single negative electrode and record the difference in electrical potential between them. The augmented limb leads have a single positive electrode and derive the negative electrode from the combination of the other electrodes. The standard limb leads form a triangle, known as the Einthoven’s triangle, around the heart that allows for advanced calculations related to the net vector of depolarization, or the axis of the heart (an index of the cardiac mass and position). If only a single lead is recorded, standard limb lead II is often chosen because all of the deflections are typically upright.4
The transverse-plane leads are referred to as the precordial, or chest, leads. These six leads form a semicircle around the anterior aspect of the heart; their placement is described in Figure 12-4. In addition to the three electrodes for the limb leads and the six electrodes for the chest leads, a 10th electrode that serves as a neutral ground must be used to reduce artifacts and stabilize the baseline. Imagine that each of the 12 leads “views” the heart from a different angle, therefore recording events in different locations of the heart in different ways. By convention, the waveform on the ECG is positive (upward) as current travels toward a positive electrode or lead and is negative (downward) when current travels away from a lead. Other lead configurations may be used for exercise testing.9 Single-lead monitoring is commonly used during exercise training or in the acute care settings.
Evaluating the ECG Strip
The evaluation of an ECG should be approached in a systematic fashion. The following questions are useful for appreciating the information that is relevant to current clinical practice.10
What is the rate and pattern (regularity) of the rhythm? Is the R-R interval (the distance between successive R waves) equal for each beat? This indicates regularity of the beats.
Does a P wave precede every QRS complex? This indicates that the rhythm is atrial.
Is there a QRS complex after every P wave? This indicates conduction of impulses from the atria to the ventricles.
What is the P-R interval? A P-R interval of 0.12 to 0.20 second indicates normal conduction from atria to ventricles. A P-R interval >0.2 seconds indicates a conduction delay or block.
Is the QRS complex of normal duration and morphology (shape)? A QRS complex greater than 0.1 second indicates either that an impulse arose within a ventricle or was conducted abnormally through the ventricular conduction system.
Determination of Heart Rate
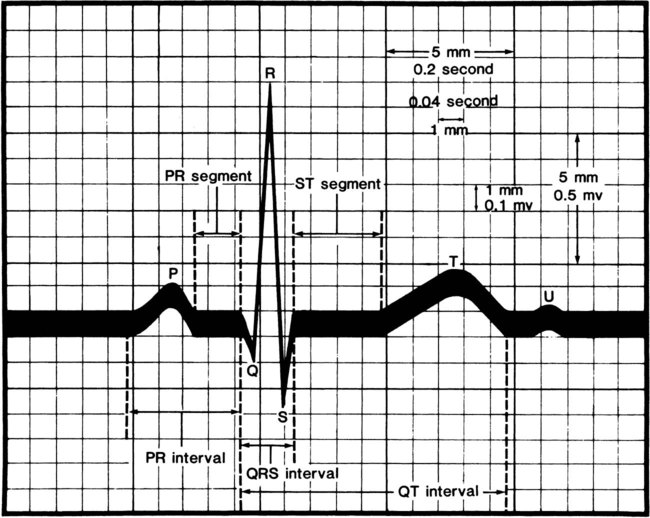
Several quick methods can be used to estimate heart rate. Most printed and displayed ECG recordings indicate a heart rate. This must be interpreted with caution, however, because the presence of artifact (extraneous deflections of the waveform caused by movement or electrical interference) may render an automated heart rate calculation inaccurate. This is a common problem during activity or exercise, the circumstances during which many physical therapists monitor patients. It is possible to calculate or to estimate a heart rate on the basis of a printed ECG strip because, by convention, the recording paper is divided into 1-mm squares and larger 5-mm squares, which are defined by heavier lines (Figure 12-5). Also by convention, the standard paper speed for an ECG recording is a rate of 25 mm per second, and most recorders mark each 3-second interval. Each millimeter of length then represents  , or 0.04 second, and each 5-mm block represents
  , or 0.20 second. Some monitor systems, however, place a mark on the recording paper at 25-mm, or 1-second intervals.
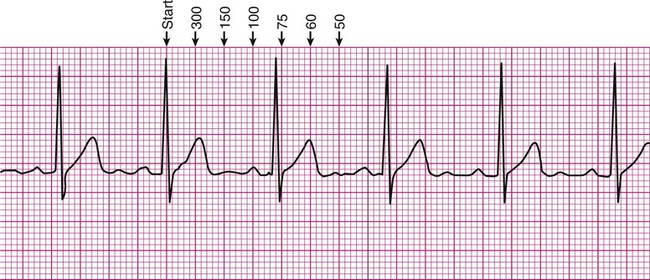
There are several methods of estimating heart rate from a printed ECG strip (Figure 12-6). On the strip, find an R wave located on or near a heavy vertical line. Proceeding to the right of that R wave, for each subsequent heavy vertical line, assign the following numbers: 300 for the first heavy line encountered, 150 for the next, followed by 100, 75, 60, 50, and 42 (Figure 12-6, A). Stop at the first heavy vertical line following the next R wave that is encountered. The heart rate may be estimated as falling between values to the left and right. In Figure 12-6, the rate would be estimated as falling between 100 and 75, or close to 80 beats per minute.
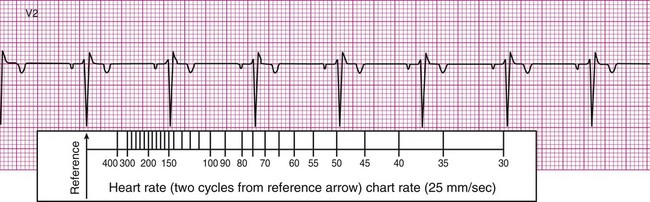
In many clinics, rulers are available that are calibrated so that heart rate may be estimated quickly by aligning markings on the ruler with features of the ECG strip. For example, after the arrow on the ruler is placed on an R wave, count two R waves to the right and read the number at that position on the ruler. In Figure 12-6, B, this method approximates the heart rate as 74 beats per minute. It is important to note that the preceding two methods are useful only if the rhythm of the ECG strip is regular (i.e., the R waves are equally spaced, occurring at consistent intervals). Should the rhythm be irregular, with R waves appearing at varying intervals, another method must be employed to estimate the heart rate.
A common and easy method for estimating the heart rate is to count off the number of R waves in a 6-second strip. Depending on whether the ECG recorder makes a mark every 1, 3, or 6 seconds, count off the appropriate number of seconds to obtain a 6-second strip. The procedure is as follows: Start at the mark corresponding to the beginning of the 6-second period and proceeding from left to right, count the number of R waves within the 6-second recording. Now multiply by 10. That is the estimated heart rate, rounded down to the nearest 10 beats per minute. Several 6-second strips may be analyzed to document the heart rate range of an irregular rhythm. The rate of the irregular rhythm in Figure 12-6, C, is estimated at approximately 60 beats per minute.
Evaluation of Rhythms
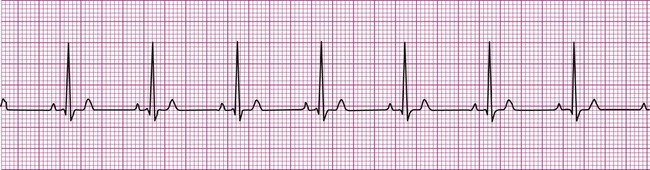
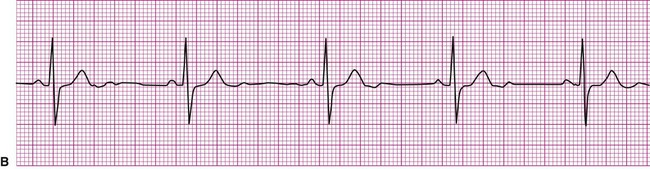
Normally, a cardiac impulse is generated by the SA node, causing atrial depolarization. This is followed by a slight delay in the AV node, after which the impulse is conducted to the ventricles, causing ventricular depolarization. These events are shown in Figure 12-7 in their normal spatial and temporal sequence and in normal sinus rhythm. A P wave precedes every QRS complex and every P wave is, in turn, succeeded by a QRS complex. This occurs within an interval of 0.12 to 0.20 second (one large box), as determined by the P-R interval. The QRS complexes occur within a range of 0.04 to 0.12 second, indicating that ventricular impulse conduction and depolarization is occurring in a normal interval. The positively deflected T wave indicates normal ventricular repolarization. Because the SA node spontaneously depolarizes at a rate of between 60 and 100 beats per minute, the rate of normal sinus rhythm must fall within these limits.
Dysrhythmia Identification
Supraventricular Dysrhythmias
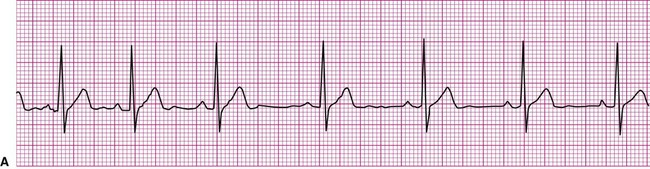
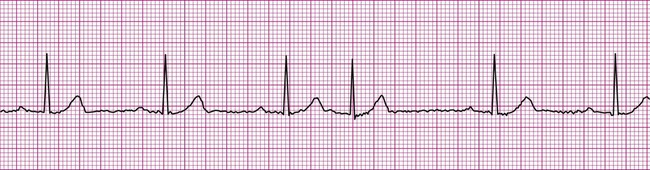
A cardiac dysrhythmia may be a sinus rhythm but with an irregular or abnormally rapid or slow rate (Figure 12-8). Sinus dysrhythmia is an irregular sinus rhythm with varying R-R intervals (Figure 12-8, A). This is a normal variant that is associated with the individual’s respiratory pattern. Sinus bradycardia is a sinus rhythm occurring at a rate of less than 60 beats per minute (Figure 12-8, B). This rhythm may significantly reduce cardiac output, causing hemodynamic compromise, manifested by hypotension or symptoms such as dizziness, lightheadedness, or syncope. On the other hand, individuals taking beta blockers, a group of medications that slow the heart, may exhibit this as their normal rhythm, as might individuals who achieve a high level of physical conditioning. Sinus tachycardia is a sinus rhythm occurring at a rate of greater than 100 beats per minute (Figure 12-8, C). Sinus tachycardia, or any other form of tachycardia, increases myocardial oxygen demand, or the workload on the heart. This may initiate or exacerbate ischemia in the presence of coronary artery disease (CAD).
A beat or rhythm that does not originate in the SA node is considered to represent an ectopic focus or pacemaker. One common form of dysrhythmia is a “premature” complex (i.e., a beat that occurs sooner than expected given the established rhythm). A premature atrial complex, or PAC, is an early beat that has an ectopic atrial origin (Figure 12-9). An R wave appears closer to its preceding R wave than the other R waves in the established rhythm. The P wave of the odd beat may have a different shape or may be inverted relative to the normal P waves, indicating that it came from a focus other than the SA node, but the associated QRS complex is always preceded by a P wave, meaning that the impulse first depolarized the atria before being conducted to the ventricles. Sometimes the AV junction may initiate an early beat, causing a premature junctional complex, or PJC. When this occurs, the R wave appears earlier; however, there may be no associated P wave, or there may be an unusual P wave, one that is inverted or follows the QRS complex. An inverted or late P wave indicates that the impulse was conducted in a retrograde (backward) fashion. Clinically, a premature atrial or junctional complex may be palpated as a “skipped” or early beat during pulse taking, or the patient may perceive a palpitation or skipped beat. Otherwise, these dysrhythmias are usually of little clinical significance.4,11
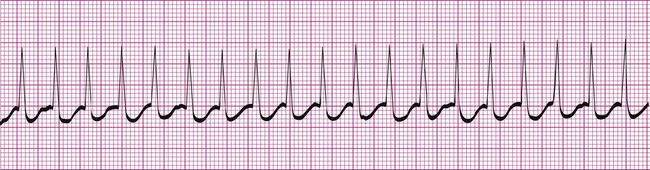
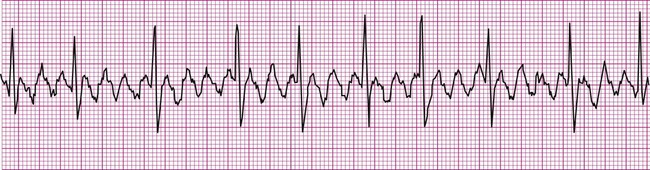
A more serious supraventricular dysrhythmia is supraventricular tachycardia, or SVT. In this dysrhythmia, the heart rate is rapid, exceeding 150 beats per minute. The tachycardia may be sustained, lasting hours or even days, or it may be “paroxysmal” (PSVT), appearing abruptly and spontaneously reconverting to the previous rhythm within seconds or minutes. The P wave is often not visible, making assessment of atrial or junctional origin difficult. According to the 2005 American Heart Association guidelines, tachycardia is classified on the basis of the width of the QRS complex. So called “narrow-complex tachycardia” refers to a rapid rhythm with a QRS <0.12 seconds. These types of tachycardia originate above the ventricle and are “supraventricular.” Wide complex tachycardia (QRS >0.12 seconds) is usually ventricular in origin and is discussed below. Distinguishing between these two types of tachycardia is important since the ventricular form is more serious and a life-threatening condition. The R-R interval in supraventricular tachycardia is markedly shortened. Figure 12-10 demonstrates supraventricular tachycardia at a rate of 190 beats per minute. Other related forms of SVT include paroxysmal atrial tachycardia (PAT) and multifocal atrial tachycardia (MAT). Clinically, patients with SVT may perceive a “racing” heart rate, which may be quite distressing. At very rapid heart rates, for example, greater than 170 beats per minute, diastolic ventricular filling time is markedly reduced, which may cause hemodynamic compromise. Symptoms associated with inadequate cardiac output, such as dizziness, lightheadedness, and syncope may ensue. Some individuals with SVT remain asymptomatic, the rhythm being detected incidentally, for example, during routine pulse or telemetry monitoring.
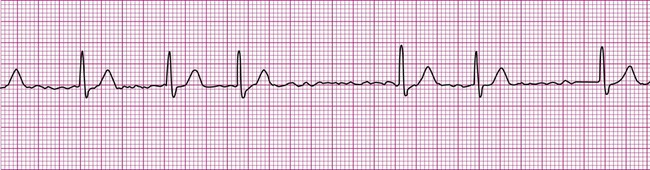
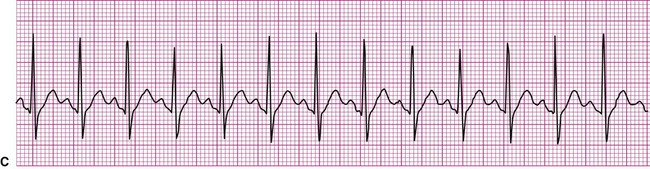
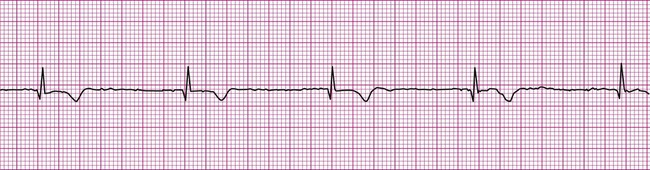
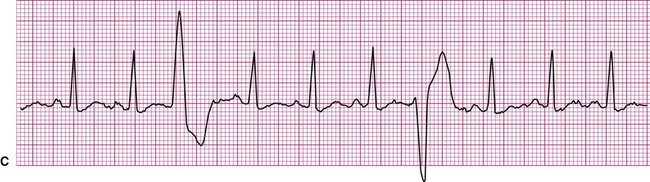
Atrial fibrillation is the most common clinically encountered dysrhythmia; it is seen in approximately 0.4% of the general population, but in more than 6% of patients over age 80.12 Atrial fibrillation is characterized by inconsistent, irregular R-R intervals with an absence of true P waves (see Figure 12-6, C). P waves may be replaced by multiple, fibrillatory F waves of varying configurations. This dysrhythmia is characterized by the presence of many impulses simultaneously, generated from multiple locations within the atria. The atria, therefore, are not pumping effectively which, in turn, may impair ventricular contraction, resulting in a reduction in cardiac output of up to 25%. This is because of the loss of the additional ventricular filling supplied by atrial contraction. Impulses do conduct through the AV junction to the ventricles; however, this occurs inconsistently and results in the irregular R-R interval. The ventricular response to atrial fibrillation is important. A rapid ventricular response, resulting in tachycardia, may cause hemodynamic compromise with associated symptoms or poor activity tolerance. Of additional clinical significance is the association between atrial fibrillation and embolic cerebrovascular accidents. Stasis of blood within the noncontracting atria may allow for thrombus formation. Figure 12-6, C illustrates atrial fibrillation with a “controlled” (i.e., fewer than 100 beats per minute) ventricular response. Pulse monitoring of an individual in atrial fibrillation reveals an irregular pattern.
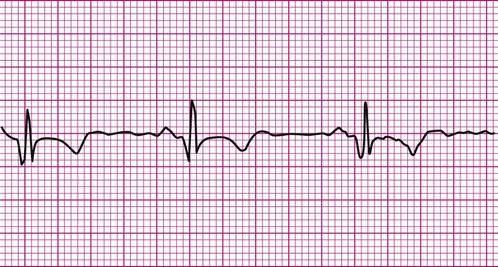
Another dysrhythmia that is characterized by abnormal atrial activity is atrial flutter (Figure 12-11). In this rhythm, P waves are replaced by F waves that have a distinctive morphology often referred to as a saw-tooth or picket-fence appearance. Of clinical importance is the ratio of atrial to ventricular conduction and whether or not the patient is hemodynamically stable.4,11
Because the intrinsic rate of spontaneous depolarization of the AV node is less than that of the SA node, spontaneous AV node depolarization is normally prevented. However, in the absence of an atrial impulse, the AV node depolarizes spontaneously and generates an impulse that then is conducted to the ventricles. Thus in junctional rhythm or nodal rhythm (Figure 12-12), the QRS complex is not preceded by a P wave. The AV node may generate an isolated “escape” beat, or it may take over as the heart’s pacemaker. Sustained nodal or junctional rhythm is usually between 40 and 60 beats per minute, corresponding with the inherent rate of spontaneous AV node depolarization.
Ventricular Dysrhythmias
An impulse generated within the ventricles, outside the normal conduction pathways, initially depolarizes surrounding local myocardium. The depolarization wave then spreads outward from that focus, but it is propagated at a slower velocity. Ventricular contraction, in this case, is not coordinated; some regions contract well before the depolarization wave reaches regions remote from the ectopic focus. It follows that the ventricular ejection of blood is reduced during an ectopic beat (Figure 12-13). An ECG rhythm (Figure 12-13, bottom) is recorded simultaneously with the record of arterial blood pressure monitoring (top). The appearance of the wide and weird complex results in significant diminution of the corresponding arterial pressure wave. Ventricular dysrhythmias are strongly associated with serious heart disease, but it is often not clear whether the dysrhythmia is the cause or the result of the heart condition.13
The most common form of ventricular dysrhythmia is a premature ventricular complex (PVC). In Figure 12-13 the QRS complex appears early, interrupting the established rhythm. An electrical pause often follows a PVC, after which the established rhythm resumes. Clinically, a PVC may be perceived by a patient as a skipped beat or a palpitation. If a PVC occurs during pulse monitoring, the examiner will likely sense a skipped, or irregular, beat.
PVCs sometimes happen in patterns, occurring at regular intervals (Figure 12-14). A PVC occurs in ventricular bigeminy on every second beat (Figure 12-14, A), in ventricular trigeminy on every third beat, and in ventricular quadrigeminy on every fourth beat. With these rhythms, a regularly irregular pattern may be noted during pulse monitoring. PVCs may also occur twice in succession as a ventricular couplet, as seen in Figure 12-14, B.
PVCs that originate from more than one ectopic focus are termed multifocal PVCs. In this circumstance, the waveforms will have different morphologies according to the locations of the ectopic foci. Remember that the positive or negative deflection of the waveform depends on the direction of depolarization, as viewed by the lead used for monitoring. In Figure 12-14, C, the first PVC shown has an initial positive deflection, whereas the second PVC seen has an initial negative deflection. Each of these PVCs comes from a different ectopic focus.
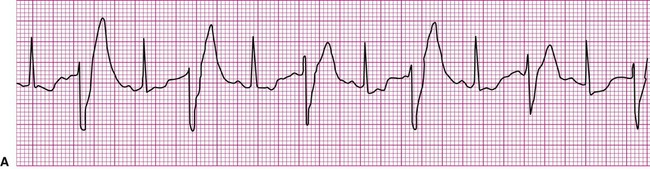
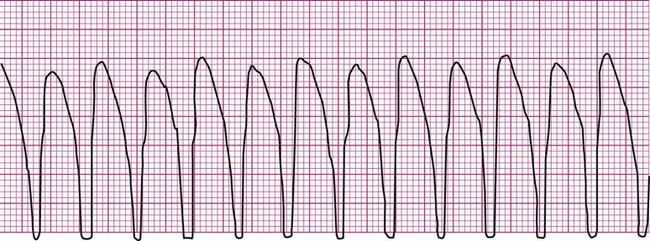
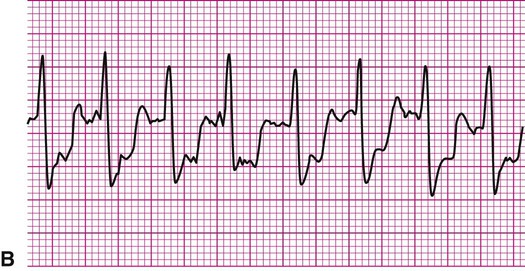
Ventricular tachycardia (V-tach, or VT) (Figure 12-15) is defined as three or more consecutive PVCs at a rate greater than 100 beats per minute.14,15 This is a serious and potentially lethal dysrhythmia that requires that emergency measures be undertaken. During V-tach all complexes are ventricular in origin. V-tach sometimes occurs in runs of three or more ectopic complexes followed by reversion to the baseline rhythm, or it may be sustained. Effective circulation may be preserved, or it may be seriously compromised or absent in sustained V-tach. A patient may be asymptomatic, particularly if only a brief run of V-tach was experienced. If VT is sustained, the patient may be asymptomatic, symptomatic, or unconscious and pulseless. The physical therapist’s response depends on the rhythm (regardless of whether it is sustained) and on whether the patient is symptomatic or conscious. Clinical responses range from cessation of activity, ongoing patient monitoring, and immediate notification of a physician to a full code.
Ventricular fibrillation (V-fib) is a lethal dysrhythmia accompanied by immediate loss of consciousness and loss of circulation (i.e., cardiac arrest). It is characterized by disorganized, simultaneous firing of multiple, ectopic ventricular foci and there is no organized rhythm (Figure 12-16). Effective ventricular contraction ceases and cardiopulmonary resuscitation is indicated until defibrillation is available. Death follows unless defibrillation with an automated external defibrillator (AED) or other device successfully restores an effective rhythm. Conditions that render the myocardium vulnerable to ventricular fibrillation include V-tach, myocardial ischemia or infarction, dilation of the heart, hyperkalemia, and electric shock.3
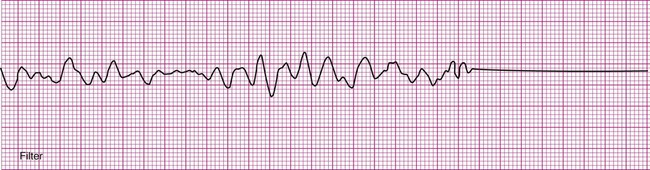
If not successfully treated, V-fib may further degenerate into asystole, which indicates complete absence of ventricular electrical activity (see Figure 12-16). Asystole may also occur as a primary event. This is known colloquially as flat-line rhythm. Like ventricular fibrillation, asystole requires that cardiopulmonary resuscitation begin immediately to save the patient’s life.
Conduction Blocks
More common are the AV blocks (Figure 12-17). They are ranked as first-, second-, or third-degree, depending on the extent of delay or obstruction of the cardiac impulse between the atria and ventricles. First-degree AV block is characterized by a prolongation of the P-R interval beyond its normal 0.2 second (Figure 12-17, A). Remember that the P-R interval is measured from the beginning of the P wave to the beginning of the QRS complex. Each impulse is delayed between the atria and ventricles, but each eventually reaches the ventricular conduction system, resulting in a normal QRS complex. Thus for each P wave, there is a QRS complex; therefore the conduction ratio is 1 : 1.
Second-degree AV block takes two forms, although in each form there are some sinus impulses that are not conducted to the ventricles. In second-degree block Mobitz type 1, also known as Wenckebach periodicity or block, the P-R interval lengthens progressively until a P wave fails to conduct to the ventricles (Figure 12-17, B1). Notice how the first three P-R intervals lengthen until, after the fourth P wave, a QRS complex fails to appear. The cycle then repeats itself. Second-degree block Mobitz type 2 (Figure 12-17, B2) is characterized by a fixed P-R interval with a “dropped” QRS following every second, third, or fourth P wave. The conduction ratio in Figure 12-17, B2 is 3 : 1, or three P waves for each QRS complex. Both first- and second-degree AV blocks are considered to be incomplete heart blocks.
Third-degree AV block, or complete heart block, is also known as AV dissociation. In this rhythm, P waves are present, but there is no relationship between P waves and QRS complexes. Typically, a longer strip of rhythm is required to make this diagnosis. P waves may be superimposed on QRS complexes, but none of the sinus impulses are conducted to the ventricles; the atria and ventricles are contracting independently of each other. In the absence of clinical intervention such as artificial pacing (Figure 12-17, C), ventricular depolarization is initiated by a junctional or ventricular pacemaker.
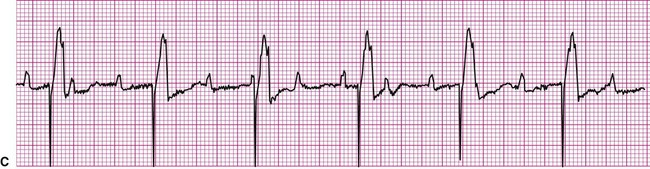
Clinically, AV blocks range in severity from benign, as is usually the case with first-degree AV block, to potentially lethal. Whether hemodynamic compromise occurs depends on the extent of impairment of cardiac output caused by too slow a rate of ventricular contraction.4 Slow rates of ventricular contraction may cause lightheadedness or syncope. In most cases of third-degree block, treatment now includes the implantation of an artificial pacemaker. In Figure 12-17, C, the needle-like spikes indicate that an artificial pacemaker is depolarizing the ventricles at a rate of 60 beats per minute.
Myocardial Ischemia or Infarction
The ECG provides much more information than that gleaned from dysrhythmia analysis. Because physical therapists often treat patients with coronary heart disease, information regarding myocardial ischemia or infarction (MI) is also of interest. Although physical therapists do not medically diagnose myocardial ischemia or MI, they should have a working knowledge of its electrocardiographic evidence and the consequences of ischemia. During myocardial ischemia, blood flow to a portion of myocardium is compromised, resulting in alteration of myocardial metabolism. In MI, a portion of myocardium has died, but an adjacent zone of ischemic myocardial cells endures. These ischemic cells may remain leaky and partially depolarized. A persistent current flows from the injured regions to the healthy regions (that are fully polarized), resulting in a current of injury, which is seen as a shift in the S-T segment above or below the isoelectric line (Figure 12-18).3,8 S-T segment shifts have significant diagnostic value. For example, S-T segment elevation (Figure 12-18, A) is associated with transmural MI, whereas S-T segment depression (Figure 12-18, B) is associated with nontransmural or subendocardial MI. Also, the onset of S-T segment depression during activity is often considered diagnostic of myocardial ischemia.12,16 Figure 12-18, B is an example of exercise-induced S-T segment depression observed in one lead during exercise.
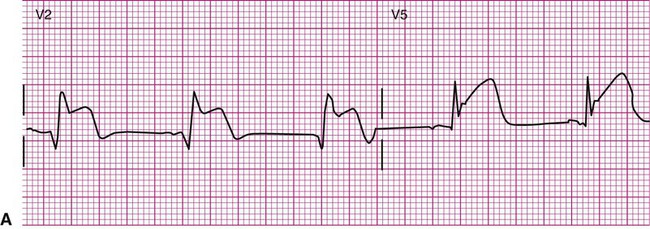
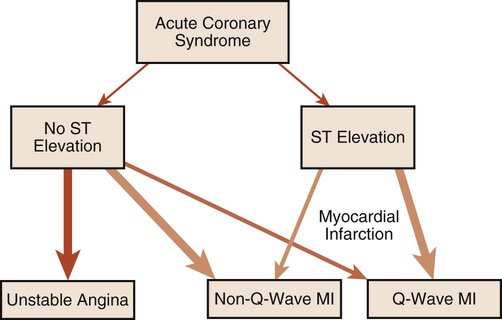
The following is a brief discussion of other abnormalities of the ECG observed in coronary artery disease (CAD). A prominent, pathological Q wave is indicative of a transmural MI.8,12 Indeed, non-Q is synonymous with nontransmural, in terms of MI. In addition, the presence of a prominent Q wave (Figure 12-19) does not distinguish between an old and an acute event. Figure 12-20 shows an algorithm for the classification of ischemia and MI based on the ECG.16
The T wave itself may also undergo changes during myocardial ischemia or MI. During ischemia, for example, the T wave may invert as a result of prolongation of repolarization.3 Similarly, during MI, changes in the T wave may evolve with the infarct, at first becoming indistinguishable within an elevated S-T segment, then inverting, then perhaps reverting to the original configuration after the passage of time. Although ST segment changes and the presence of a Q wave are compelling indicators for the diagnosis of ischemia or MI, it must be kept in mind that they are neither 100% sensitive nor 100% specific.
Cases Studies
Case Study 1
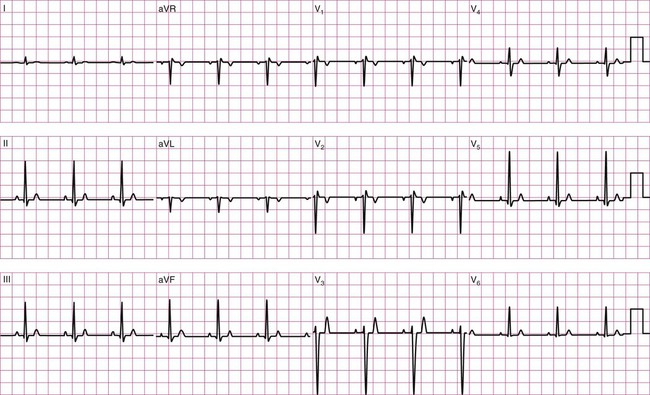
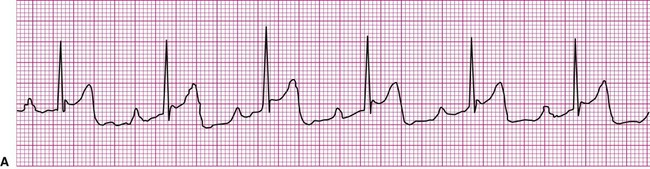
An 81-year-old man is referred to physical therapy 2 days after angioplasty for treatment of coronary heart disease and blockages in the left circumflex and diagonal arteries. The patient has had an uncomplicated course and no cardiac arrhythmias since surgery. He is evaluated in the physical therapy gym and given a submaximal predictive treadmill test with electrocardiogram monitoring. The test consists of walking a 5% grade at 3 mph for 5 minutes. His ECG is normal at rest, but at 4 minutes of ambulation he complains of shortness of breath and requests that the test be stopped. The ECG in the last 6 seconds of ambulation is shown below (Figure 12-21). Answer the questions related to these findings. The answers can be found after the Review Questions.
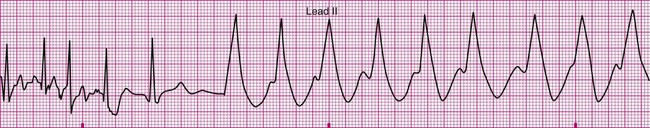
2. What are the hemodynamic and functional consequences of this dysrhythmia?
3. What action should be taken by the evaluating physical therapist?
Case Study 2
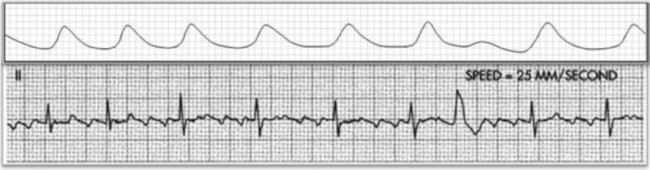
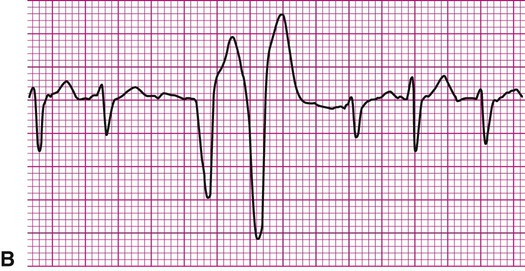
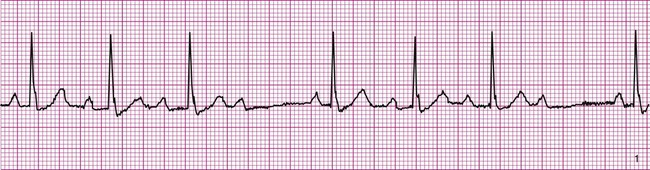
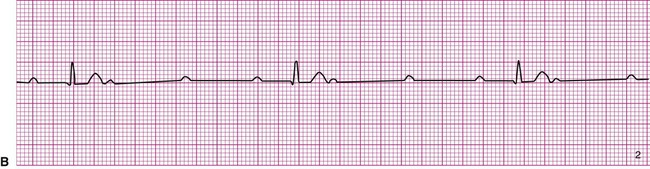
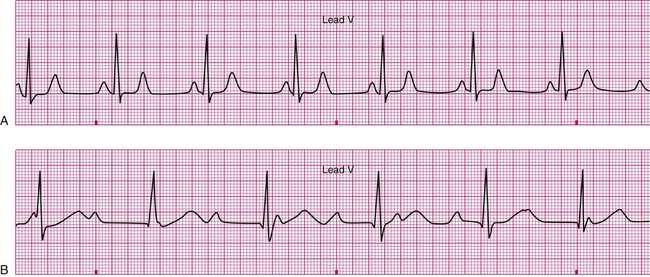
A 20-year-old basketball player is referred to a sports medicine clinic for a medical examination because of a knee injury. The physical examination shows mild tenderness and edema of the right knee but no other medical problems. During the examination by the physician, the athlete confides that he often experiences dizziness throughout the day. The physician performs a single-lead electrocardiogram and exercise test at that time. The test shows sinus bradycardia at rest and a normal response to exercise (Figure 12-22, A). The patient is sent home with a Holter monitor (a device that records an ECG continuously over a 24-hour period). Analysis of the recording reveals that the pattern in Figure 12-22, B, is occurring sporadically approximately 25% of the time.
1. How may the following dysrhythmias be perceived by a clinician without the benefit of ECG monitoring? How may they be perceived by a patient?
2. What determines the clinical significance of a dysrhythmia?
3. What property of the SA node allows it to pace the heart? Under what conditions do other portions of the conduction system act as pacemakers?
4. Does an impulse originating within the ventricular myocardium generate an effective myocardial contraction? If not, why not?
5. Why is ECG monitoring indicated after myocardial infarction?
6. What event is represented by each of the following:
7. What is the possible clinical significance of S-T segment depression? Of S-T segment elevation? What symptoms might be anticipated in the presence of those conditions?
Answers to Case Study 2
Careful inspection of panel B in Figure 12-22 reveals that there is complete dissociation of the ventricular rhythm from the atrial rhythm, indicating third-degree or complete heart block. The rhythm strip shows that a regular atrial pattern (P waves) is superimposed on a regular ventricular rhythm (QRS complexes), but the QRS complexes do not follow the P waves. The heart rate is the ventricular rate and therefore approximately 40 beats per minute. Third-degree heart block results in asynchrony between the atrial ejection and the ventricular filling. In addition, the ventricular rate is typically very low and the combined effects of decreased filling and low heart rate may cause decreased blood pressure. The resulting hypotension, particularly during changes in position or movement, may lead to dizziness.