[level-membership-for-internal-medicine-category]Chapter 3
Electrocardiogram
1. What are the most commonly used criteria to diagnose left ventricular hypertrophy (LVH)?


2. What are the most commonly used criteria to diagnose right ventricular hypertrophy (RVH)?


3. What criteria are used to diagnose left atrial enlargement (LAE)?
 P wave total width of > 0.12 sec (3 small boxes) in the inferior leads, usually with a double-peaked P wave

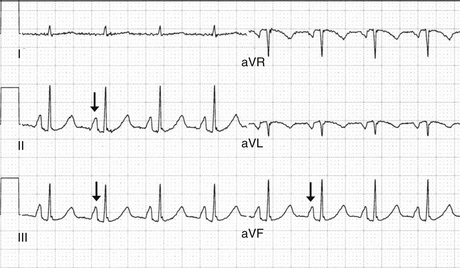
4. What electrocardiogram (ECG) finding suggests right atrial enlargement (RAE)?
 P-wave height in the inferior leads (II, III, and aVF) ≥ 2.5 to 3 mm (2.5 to 3 small boxes) (Fig. 3-1)
5. What is the normal rate of a junctional rhythm?
6. How can one distinguish a junctional escape rhythm from a ventricular escape rhythm in a patient with complete heart block?
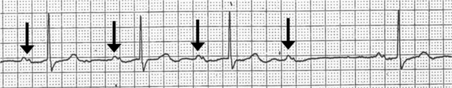
7. Describe the three types of heart block.
 First-degree heart block: The PR interval is a fixed duration of more than 0.20 seconds.
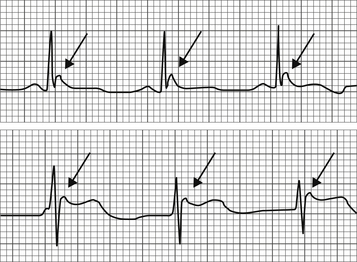
 Second-degree heart block: In Mobitz type I (Wenckebach) block, the PR interval increases until a P wave is nonconducted (Fig. 3-2). The cycle then resets and starts again. Mobitz type I second-degree heart block is sometimes due to increased vagal tone and is usually a relatively benign finding. In Mobitz type II block, the PR interval is fixed and occasional P waves are nonconducted. Mobitz type II second-degree heart block usually indicates structural disease in the atrioventricular (AV) node or His-Purkinje system and is an indication for pacemaker implantation.

8. What are the causes of ST segment elevation?
 Acute myocardial infarction (MI) due to thrombotic occlusion of a coronary artery
 Prinzmetal angina (variant angina), in which there is vasospasm of a coronary artery

 Pericarditis, in which there is usually diffuse ST segment elevation

 Left bundle branch block (LBBB)
 Left ventricular hypertrophy with repolarization abnormalities


9. What are the electrocardiographic findings of hyperkalemia?
Initially, a “peaking” of the T waves is seen (Fig. 3-3). As the hyperkalemia becomes more profound, “loss” of the P waves, QRS widening, and ST segment elevation may occur. The preterminal finding is a sinusoidal pattern on the ECG (Fig. 3-4).
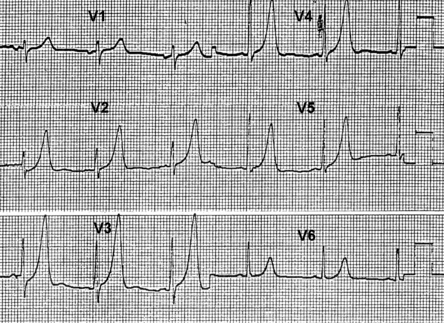
Figure 3-3 Hyperkalemia. Peaked T waves are seen in many of the precordial leads. (Adapted with permission from Levine GN, Podrid PJ: The ECG workbook: a review and discussion of ECG findings and abnormalities, New York, 1995, Futura Publishing Company, p 405.)
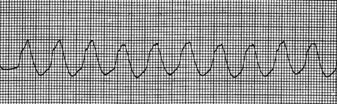
Figure 3-4 Severe hyperkalemia. The rhythm strip demonstrates the preterminal rhythm sinusoidal wave seen in cases of severe hyperkalemia. (Adapted with permission from Levine GN, Podrid PJ: The ECG workbook: a review and discussion of ECG findings and abnormalities, New York, 1995, Futura Publishing Company, p 503.)
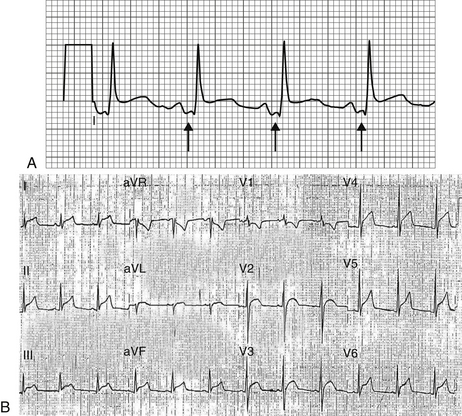
10. What are the ECG findings in pericarditis?
The first findings are thought to be PR segment depression (Fig 3-5, A), possibly caused by repolarization abnormalities of the atria. This may be fairly transient and is often not present by the time the patient is seen for evaluation. Either concurrent with PR segment depression or shortly following PR segment depression, diffuse ST segment elevation occurs (Fig. 3-5, B). At a later time, diffuse T-wave inversions may develop.
11. What is electrical alternans?
In the presence of large pericardial effusions, the heart may “swing” within the large pericardial effusion, resulting in an alteration of the amplitude of the QRS complex (Fig. 3-6).
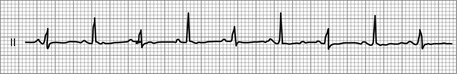
Figure 3-6 Electrical alternans in a patient with a large pericardial effusion. Note the alternating amplitude of the QRS complexes. (From Manning WJ: Pericardial disease. In Goldman L, editor: Cecil medicine, ed 23, Philadelphia, 2008, Saunders.)
12. What is the main ECG finding in hypercalcemia and hypocalcemia?
With hypercalcemia, the QT interval shortens. With hypocalcemia, prolongation of the QT interval occurs as a result of delayed repolarization (Fig. 3-7).
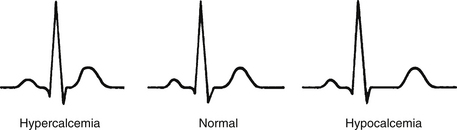
Figure 3-7 Electrocardiographic findings of hypercalcemia and hypocalcemia. With hypercalcemia, the QT interval shortens. With hypocalcemia there is prolongation of the QT interval due to delayed repolarization. (From Park MK, Guntheroth WG: How to read pediatric ECGs, ed 4, Philadelphia, 2006, Mosby.)
13. What ECG findings may be present in pulmonary embolus?
 Sinus tachycardia (the most common ECG finding)
 Right atrial enlargement (P pulmonale)—tall P waves in the inferior leads

 T wave inversions in leads V1-V2


14. How is the QT interval calculated and what are the causes of short QT and long QT intervals?
Causes of short QT interval include hypercalcemia, congenital short QT syndrome, and digoxin therapy. Numerous drugs, metabolic abnormalities, and other conditions can cause a prolonged QT interval (Table 3-1). QTc values greater than 440 to 460 milliseconds are considered prolonged, though the risk of arrhythmia is generally ascribed to be more common at QTc values greater than 500 milliseconds.
TABLE 3-1
CAUSES OF PROLONGED QT INTERVAL
Antiarrhythmic drugs (e.g., Amiodarone, sotalol, quinidine, procainamide, ibutilide, dofetilide, flecainide)
Psychiatric medications, particularly overdoses (tricyclic antidepressants, antipsychotic agents)
Certain antibiotics (e.g., Macrolides, fluoroquinolones, antifungals, antimalarials)
Certain antihistamines (e.g., Diphenhydramine, astemizole, loratadine, terfenadine)
Electrolyte abnormalities (e.g., Hypocalcemia, hypokalemia, hypomagnesemia)
Raised intracranial pressure (“cerebral T waves”)
Hypothermia
Hypothyroidism
Congenital long QT syndrome
15. What is torsades de pointes?
Torsades de pointes is a ventricular arrhythmia that occurs in the setting of QT prolongation, usually when drugs that prolong the QT interval have been administered. It may also occur in the setting of congenital prolonged QT syndrome and other conditions. The term was reported coined by Dessertenne to describe the arrhythmia, in which the QRS axis appears to twist around the isoelectric line (Fig. 3-8). It is usually a hemodynamically unstable rhythm that can further degenerate and lead to hemodynamic collapse.
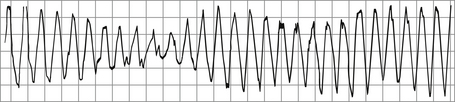
Figure 3-8 Torsades de pointes, in which the QRS axis seems to rotate about the isoelectric point. (From Olgin JE, Zipes DP: Specific arrhythmias: diagnosis and treatment. In Libby P, Bonow R, Mann D, et al, editors: Braunwald’s heart disease: a textbook of cardiovascular medicine, ed 8, Philadelphia, 2008, Saunders.)
16. What are cerebral T waves?
Cerebral T waves are strikingly deep and inverted T waves, most prominently seen in the precordial leads, that occur with central nervous system diseases, most notably subarachnoid and intracerebral hemorrhages. They are thought to be due to prolonged and abnormal repolarization of the left ventricle, presumably as a result of autonomic imbalance. They should not be mistaken for evidence of active cardiac ischemia (Fig. 3-9).
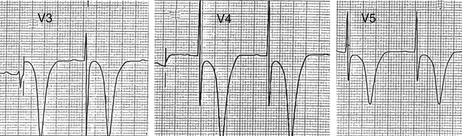
Figure 3-9 Cerebral T waves. The markedly deep and inverted T waves are seen with central nervous system disease, particularly subarachnoid and intracerebral hemorrhages. (Reproduced with permission from Levine GN, Podrid PJ: The ECG workbook: a review and discussion of ECG findings and abnormalities, New York, 1995, Futura Publishing Company, p 437.)
Osborne waves are upward deflections that occur at the J point of the QRS complex, which occur in the setting of hypothermia (Fig. 3-10). They are thought to result from hypothermia-induced repolarization abnormalities of the ventricle.
Bibliography, Suggested Readings, and Websites
1. Dublin, D. Rapid interpretation of EKGs. Tampa, Fla: Cover Publishing; 2000.
2. Jenkins, D., Gerred, S. ECG library. Available at http://www.ecglibrary.com/ecghome.html. Accessed September 6, 2009
3. Levine, G.N. Diagnosing (and treating) arrhythmias made easy. St Louis: Quality Medical Publishers; 1998.
4. Levine, G.N., Podrid, P.J. The ECG workbook. Armonk, NY: Futura Publishing; 1995.
5. Mason, J.W., Hancock, E.W., Gettes, L.S. Recommendations for the standardization and interpretation of the electrocardiogram: part II: electrocardiography diagnostic statement list, a scientific statement from the American Heart Association Electrocardiography and Arrhythmias Committee, Council on Clinical Cardiology; the American College of Cardiology Foundation; and the Heart Rhythm Society endorsed by the International Society for Computerized Electrocardiology. J Am Coll Cardiol. 2007;49(10):1128–1135.
6. Segal, A. Electrocardiography: an on-line tutorial in lead II ECG interpretation. Available at http://www.drsegal.com/medstud/ecg/. Accessed September 6, 2009
7. Wagner, G.S. Marriot’s practical electrocardiography. Philadelphia: Lippincott Williams & Wilkins; 2008.
8. Wolters Kluwer Health Clinical Solutions: ECG tutorial. In Basow, DS, editor: UpToDate, Waltham, MA, 2013, UpToDate. Available at: http://www.uptodate.com/contents/ecg-tutorial. Accessed March 26, 2013
9. Wartak, J. Electrocardiogram rhythm tutor. Available at http://www.coldbacon.com/mdtruth/more/ekg.html. Accessed September 7, 2009
[/level-membership-for-internal-medicine-category][not-level-membership-for-internal-medicine-category]Chapter 3
Electrocardiogram
1. What are the most commonly used criteria to diagnose left ventricular hypertrophy (LVH)?
2. What are the most commonly used criteria to diagnose right ventricular hypertrophy (RVH)?
3. What criteria are used to diagnose left atrial enlargement (LAE)?
P wave total width of > 0.12 sec (3 small boxes) in the inferior leads, usually with a double-peaked P wave
4. What electrocardiogram (ECG) finding suggests right atrial enlargement (RAE)?
P-wave height in the inferior leads (II, III, and aVF) ≥ 2.5 to 3 mm (2.5 to 3 small boxes) (Fig. 3-1)
5. What is the normal rate of a junctional rhythm?
6. How can one distinguish a junctional escape rhythm from a ventricular escape rhythm in a patient with complete heart block?
7. Describe the three types of heart block.
First-degree heart block: The PR interval is a fixed duration of more than 0.20 seconds.
Second-degree heart block: In Mobitz type I (Wenckebach) block, the PR interval increases until a P wave is nonconducted (Fig. 3-2). The cycle then resets and starts again. Mobitz type I second-degree heart block is sometimes due to increased vagal tone and is usually a relatively benign finding. In Mobitz type II block, the PR interval is fixed and occasional P waves are nonconducted. Mobitz type II second-degree heart block usually indicates structural disease in the atrioventricular (AV) node or His-Purkinje system and is an indication for pacemaker implantation.
8. What are the causes of ST segment elevation?
Acute myocardial infarction (MI) due to thrombotic occlusion of a coronary artery
Prinzmetal angina (variant angina), in which there is vasospasm of a coronary artery
Pericarditis, in which there is usually diffuse ST segment elevation
Left bundle branch block (LBBB)
Left ventricular hypertrophy with repolarization abnormalities
[/not-level-membership-for-internal-medicine-category]
