[level-membership-for-cardiovascular-category]
Chapter 5 Electrical Axis and Axis Deviation
Please go to expertconsult.com for supplemental chapter material.
Normal ECG patterns in the chest and extremity leads were discussed in Chapter 4. The general terms horizontal heart (or horizontal QRS axis) and vertical heart (or vertical QRS axis) were used to describe the normal variations in QRS patterns seen in the extremity leads. In this chapter the concept of electrical axis is refined, and methods are presented for estimating the QRS axis quickly and simply.
Mean QRS Axis: Definition
Because the QRS axis is being defined in the frontal plane, the QRS is being described only in reference to the six extremity leads (the six frontal plane leads). Therefore, the scale of reference used to measure the mean QRS axis is the diagram of the frontal plane leads (described in Chapter 3 and depicted again in Fig. 5-1). Einthoven’s triangle can easily be converted into a triaxial lead diagram by having the axes of the three standard limb leads (I, II, and III) intersect at a central point (Fig. 5-1A). Similarly the axes of the three augmented limb leads (aVR, aVL, and aVF) also form a triaxial lead diagram (Fig. 5-1B). These two triaxial lead diagrams can be combined to produce a hexaxial lead diagram (Fig. 5-1C). You will be using this diagram to determine the mean QRS axis and describe axis deviation.
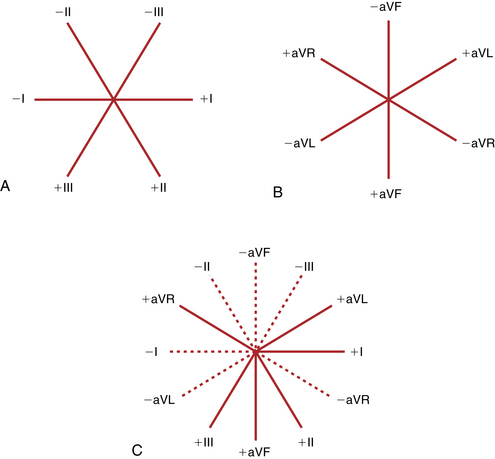
As noted in Chapter 3, each lead has a positive and negative pole (see Fig. 5-1C). As a wave of depolarization spreads toward the positive pole, an upward (positive) deflection occurs. As a wave spreads toward the negative pole, a downward (negative) deflection is inscribed.
Finally, a scale is needed to determine or calculate the mean QRS axis. By convention the positive pole of lead I is said to be at 0°. All points below the lead I axis are positive, and all points above that axis are negative (Fig. 5-2). Thus, toward the positive pole of lead aVL (–30°), the scale becomes negative. Downward toward the positive poles of leads II, III, and aVF, the scale becomes more positive (lead II at +60°, lead aVF at +90°, and lead III at +120°).
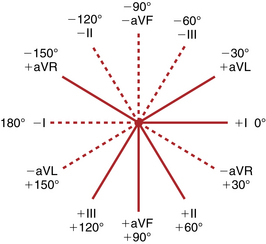
The completed hexaxial diagram used to measure the QRS axis is shown in Figure 5-2. By convention again, an electrical axis that points toward lead aVL is termed leftward or horizontal. An axis that points toward leads II, III, and aVF is rightward or vertical.
Mean QRS Axis: Calculation
In calculating the mean QRS axis, you are answering this question: In what general direction or toward which lead axis is the QRS complex predominantly oriented? In Figure 5-3, for example, notice the tall R waves in leads II, III, and aVF. These waves indicate that the heart is electrically vertical (vertical electrical axis). Furthermore, the R waves are equally tall in leads II and III.∗ Therefore, by simple inspection the mean electrical QRS axis can be seen to be directed between the positive poles of leads II and III and toward the positive pole of lead aVF (+90°).
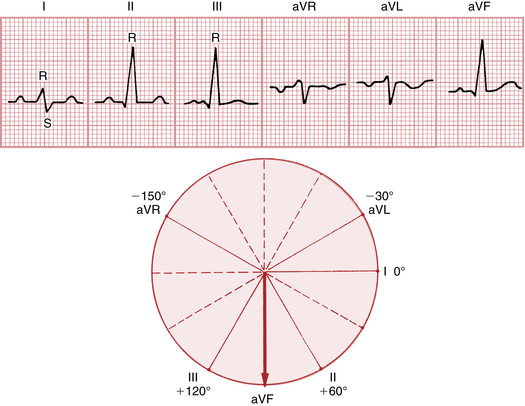
As a general rule, the mean QRS axis points midway between any two leads that show tall R waves of equal height.
In Figure 5-3 the mean electrical axis could have been calculated a second way. Recall from Chapter 3 that if a wave of depolarization is oriented at right angles to any lead axis, a biphasic complex (RS or QR) is recorded in that lead. Reasoning in a reverse manner, if you find a biphasic complex in any of the extremity leads, the mean QRS axis must be directed at 90° to that lead. Now look at Figure 5-3 again. Do you see any biphasic QRS complexes? Obviously, lead I is biphasic and shows an RS pattern. Therefore, the mean electrical axis must be directed at right angles to lead I. Because lead I on the hexaxial lead scale is at 0°, the mean electrical axis must be at right angles to 0° or at either –90° or +90°. If the axis were –90°, the depolarization forces would be oriented away from the positive pole of lead aVF and that lead would show a negative complex. In Figure 5-3, however, lead aVF shows a positive complex (tall R wave); therefore the axis must be +90°.
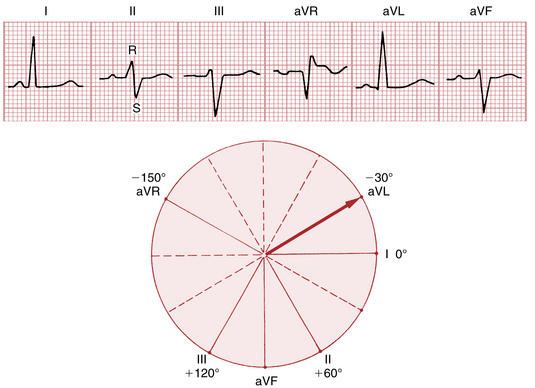
Figure 5-4 presents another example. By inspection the mean QRS axis is obviously horizontal, because leads I and aVL are positive and leads II, III, and aVF are predominantly negative. The precise electrical axis can be calculated by looking at lead II, which shows a biphasic RS complex. Therefore the axis must be at right angles to lead II. Because lead II is at +60° on the hexaxial scale (see Fig. 5-2), the axis must be either –30° or +150°. If it were +150°, leads II, III, and aVF would be positive. Clearly the axis is –30°.
Another example is given in Figure 5-5. The QRS complex is positive in leads II, III, and aVF. Therefore the axis is relatively vertical. Because the R waves are of equal magnitude in leads I and III, the mean QRS axis must be oriented between these two leads, or at +60°.
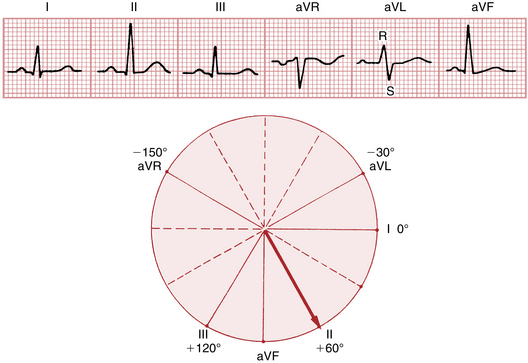
Alternatively, in Figure 5-5 the QRS axis can be calculated by looking at lead aVL, which shows a biphasic RS-type complex. The axis must be at right angles to lead aVL (–30°); that is, it must be oriented at either –120° or +60°. Obviously, the axis is at +60°, since the electrical axis must be oriented toward lead II, which shows a relatively tall R wave.
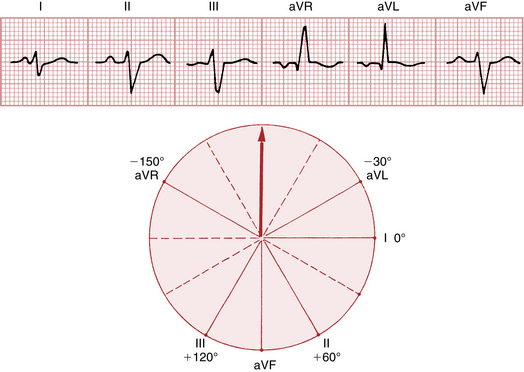
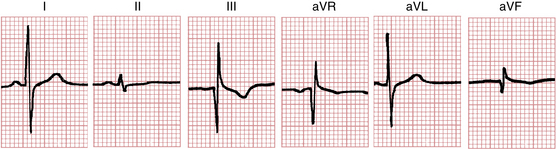
Still another example is provided in Figure 5-6. The electrical axis is seen to be oriented away from leads II, III, and aVF and toward leads aVR and aVL, which show positive complexes. Because the R waves are of equal magnitude in leads aVR and aVL, the axis must be oriented precisely between these leads, or at –90°. Alternatively, look at lead I, which shows a biphasic RS complex. In this case the axis must be directed at right angles to lead I (0°); that is, it must be either –90° or +90°. Because the axis is oriented away from the positive pole of lead aVF and toward the negative pole of that lead, it must be –90°.
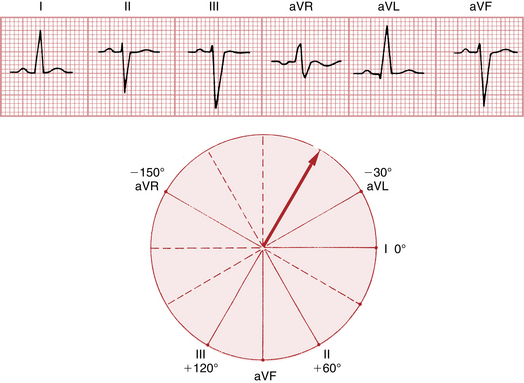
Again, look at Figure 5-7. Because lead aVR shows a biphasic RS-type complex, the electrical axis must be at right angles to the axis of that lead. The axis of aVR is at –150°; therefore, the electrical axis in this case must be either –60° or +120°. Clearly it is –60° because lead aVL is positive and lead III shows a negative complex.∗
These basic examples should establish the ground rules for calculating the mean QRS axis. However, such calculations are generally only an estimate or a near approximation. An error of 10° or 15° is not clinically significant. Thus it is perfectly acceptable to calculate the axis from leads in which the QRS complex is nearly biphasic or from two leads in which the R (or S) waves are of approximately equal amplitude.†
In summary, the mean QRS axis can be determined on the basis of one or both of the following rules:
Axis Deviation
The mean QRS axis is determined by the anatomic position of the heart and the direction in which the stimulus spreads through the ventricles (i.e., the direction of ventricular depolarization):
1. The influence of cardiac anatomic position on the electrical axis can be illustrated by the effects of respiration. When a person breathes in, the diaphragm descends and the heart becomes more vertical in the chest cavity. This change generally shifts the QRS electrical axis vertically (to the right). (Patients with emphysema and chronically hyperinflated lungs usually have anatomically vertical hearts and electrically vertical QRS axes.) Conversely, when the person breathes out, the diaphragm ascends and the heart assumes a more horizontal position in the chest. This generally shifts the QRS electrical axis horizontally (to the left).
2. The influence of the direction of ventricular depolarization can be illustrated by left anterior fascicular block, in which the spread of stimuli through the more superior and leftward portions of the left ventricle is delayed and the mean QRS axis shifts to the left (see Chapter 7). By contrast, with right ventricular hypertrophy (RVH) the QRS axis shifts to the right.
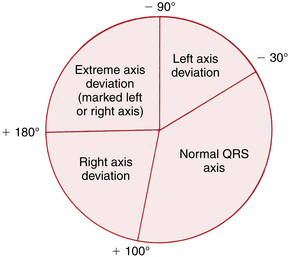
Recognition of RAD and LAD is quite simple:
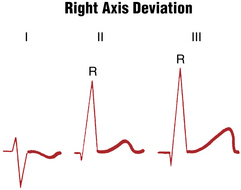
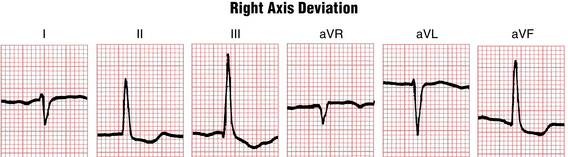
1. RAD exists if the QRS axis is found to be +100° or more positive. Recall that when leads II and III show tall R waves of equal height, the QRS axis must be +90°. As an approximate rule, if leads II and III show tall R waves and the R wave in lead III exceeds the R wave in lead II, RAD is present. In addition, lead I shows an RS pattern with the S wave deeper than the R wave is tall (see Figs. 5-8 and 5-9).
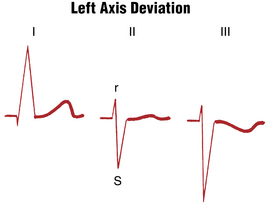
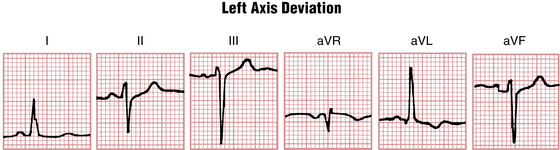
2. LAD exists if the QRS axis is found to be –30° or more negative. In the ECG shown in Figure 5-4 the QRS axis is exactly –30°. Notice that lead II shows a biphasic (RS) complex. Remember that the location of lead II is aligned at +60° (see Fig. 5-2), and a biphasic complex indicates that the electrical axis must be at right angles to that lead (at either –30° or +150°). Thus, with an axis of –30°, lead II shows an RS complex with the R and S waves of equal amplitude. If the electrical axis is more negative than –30° (LAD), lead II shows an RS complex with the S wave deeper than the R wave is tall (Figs. 5-10 and 5-11).
The rules for recognizing QRS axis deviation can be summarized as follows:
• RAD is present if the R wave in lead III is taller than the R wave in lead II. Notice that with RAD, lead I shows an RS-type complex in which the S wave is deeper than the R wave is tall (see Figs. 5-8 and 5-9).
• LAD is present if lead I shows a tall R wave, lead III shows a deep S wave, and lead II shows either a biphasic RS complex (with the amplitude of the S wave exceeding the height of the r wave) (see Figs. 5-10 and 5-11) or a QS complex. Leads I and aVL both show R waves.
In Chapter 4 the terms electrically vertical and electrically horizontal heart positions (mean QRS axes) were introduced. This chapter has added the terms left axis deviation and right axis deviation. What is the difference between these terms? Electrically vertical and electrically horizontal heart positions are qualitative. With an electrically vertical mean QRS axis, leads II, III, and aVF show tall R waves. With an electrically horizontal mean QRS axis, leads I and aVL show tall R waves. With an electrically vertical heart, the actual mean QRS axis may be normal (e.g., +80°) or abnormally rightward (e.g., +120°). Similarly, with an electrically horizontal heart the actual axis may be normal (0°) or abnormally leftward (–50°).
Axis Deviation: Instant Recognition
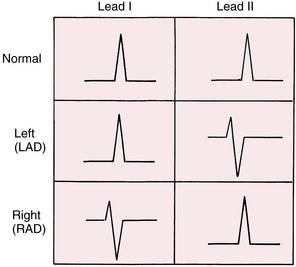
For beginning students, precise calculation of the QRS axis is not as important as answering the following key questions: Is the QRS axis normal, or is LAD or RAD present? The answer can be obtained simply by inspecting the QRS complex from leads I and II (Fig. 5-12).
Clinical Significance
Axis deviation may be encountered in a variety of settings. RAD, with a mean QRS axis +100° or more, is sometimes seen in the ECGs of normal hearts. However, RVH is an important cause of RAD (see Chapter 6). Another cause is myocardial infarction of the lateral wall of the left ventricle. In this setting, loss of the normal leftward depolarization forces may lead “by default” to a rightward axis (see Fig. 8-11). Left posterior fascicular block (hemiblock) is a much rarer cause of RAD (see Chapter 7). The ECGs of patients with chronic lung disease (emphysema or chronic bronchitis) often show RAD. Finally, a sudden shift in the mean QRS axis to the right (not necessarily causing actual RAD) may occur with acute pulmonary embolism (see Chapters 11 and 24).
LAD, with a mean QRS axis of –30° or more, is also seen in several settings. Patients with left ventricular hypertrophy (LVH) sometimes but not always have LAD (see Chapter 6). Left anterior fascicular block (hemiblock) is a fairly common cause of marked deviation (more negative than –45°). LAD may be seen in association with left bundle branch block (see Chapter 7). It may also occur in the absence of apparent cardiac disease.
RAD or LAD is not necessarily a sign of significant underlying heart disease. Nevertheless, recognition of RAD or LAD (Fig. 5-12 and 5-13) often provides supportive evidence for LVH or RVH, ventricular conduction disturbance (left anterior or posterior hemiblock), or another disorder (see Chapter 24).
Finally, the limits for LAD and RAD (–30° to +100°) used in this book are necessarily arbitrary. Some authors use different criteria (e.g., 0° to +90°). These apparent discrepancies reflect the important fact that no absolute parameters have been established in clinical electrocardiography—only general criteria can be applied. The same problems will be encountered in the discussion of LVH and RVH (see Chapter 6) because different voltage criteria have been described by various authors.
On rare occasions, all six extremity leads show biphasic (QR or RS) complexes, which makes it impossible to calculate the mean frontal plane QRS axis. In such cases the term indeterminate axis is used (Fig. 5-14). An indeterminate QRS axis may occur as a normal variant, or it may be seen in a variety of pathologic settings.
Mean Electrical Axis of the P Wave and T Wave
For example, when sinus rhythm is present, the normal P wave is always negative in lead aVR and positive in lead II. Normally, therefore, the P wave is generally directed toward the positive pole of lead II (see Fig. 4-3), which makes the normal mean P wave axis about +60°. On the other hand, if the atrioventricular (AV) junction (and not the sinus node) is pacing the heart, the atria are stimulated in a retrograde way. When AV junctional rhythm is present, atrial depolarization spreads upward, toward lead aVR and away from lead II (see Fig. 4-5). In this situation, lead aVR may show a positive P wave and lead II a negative P wave, and the mean P wave axis may be about –150°.
∗ In Figure 5-3, three leads (II, III, and aVF) have R waves of equal height. In this situation the electrical axis points toward the middle lead (i.e., toward lead aVF or at +90°).
∗ In Figure 5-7 the QRS axis can also be calculated by looking at lead I, which shows an R wave of equal amplitude with the S wave in lead II. The mean QRS axis must be oriented between the positive pole of lead I (0°) and the negative pole of lead II (−120°). Therefore, the axis must be at −60°.
† For example, when the R (or S) waves in two leads have similar but not identical voltages, the mean QRS axis does not lie exactly between these two leads. Instead, it points more toward the lead with the larger amplitude. Similarly, if a lead shows a biphasic (RS or QR) deflection with the R and S (or Q and R) waves not of identical amplitude, the mean QRS axis does not point exactly perpendicular to that lead. If the R wave is larger than the S (or Q) wave, the axis points slightly less than 90° away from the lead. If the R wave is smaller than the S (or Q) wave, the axis points slightly more than 90° away from that lead.
[/level-membership-for-cardiovascular-category][not-level-membership-for-cardiovascular-category]
Chapter 5 Electrical Axis and Axis Deviation
Please go to expertconsult.com for supplemental chapter material.
Normal ECG patterns in the chest and extremity leads were discussed in Chapter 4. The general terms horizontal heart (or horizontal QRS axis) and vertical heart (or vertical QRS axis) were used to describe the normal variations in QRS patterns seen in the extremity leads. In this chapter the concept of electrical axis is refined, and methods are presented for estimating the QRS axis quickly and simply.
Mean QRS Axis: Definition
Because the QRS axis is being defined in the frontal plane, the QRS is being described only in reference to the six extremity leads (the six frontal plane leads). Therefore, the scale of reference used to measure the mean QRS axis is the diagram of the frontal plane leads (described in Chapter 3 and depicted again in Fig. 5-1). Einthoven’s triangle can easily be converted into a triaxial lead diagram by having the axes of the three standard limb leads (I, II, and III) intersect at a central point (Fig. 5-1A). Similarly the axes of the three augmented limb leads (aVR, aVL, and aVF) also form a triaxial lead diagram (Fig. 5-1B). These two triaxial lead diagrams can be combined to produce a hexaxial lead diagram (Fig. 5-1C). You will be using this diagram to determine the mean QRS axis and describe axis deviation.
As noted in Chapter 3, each lead has a positive and negative pole (see Fig. 5-1C). As a wave of depolarization spreads toward the positive pole, an upward (positive) deflection occurs. As a wave spreads toward the negative pole, a downward (negative) deflection is inscribed.
Finally, a scale is needed to determine or calculate the mean QRS axis. By convention the positive pole of lead I is said to be at 0°. All points below the lead I axis are positive, and all points above that axis are negative (Fig. 5-2). Thus, toward the positive pole of lead aVL (–30°), the scale becomes negative. Downward toward the positive poles of leads II, III, and aVF, the scale becomes more positive (lead II at +60°, lead aVF at +90°, and lead III at +120°).
The completed hexaxial diagram used to measure the QRS axis is shown in Figure 5-2. By convention again, an electrical axis that points toward lead aVL is termed leftward or horizontal. An axis that points toward leads II, III, and aVF is rightward or vertical.
Mean QRS Axis: Calculation
In calculating the mean QRS axis, you are answering this question: In what general direction or toward which lead axis is the QRS complex predominantly oriented? In Figure 5-3, for example, notice the tall R waves in leads II, III, and aVF. These waves indicate that the heart is electrically vertical (vertical electrical axis). Furthermore, the R waves are equally tall in leads II and III.∗ Therefore, by simple inspection the mean electrical QRS axis can be seen to be directed between the positive poles of leads II and III and toward the positive pole of lead aVF (+90°).
As a general rule, the mean QRS axis points midway between any two leads that show tall R waves of equal height.
In Figure 5-3 the mean electrical axis could have been calculated a second way. Recall from Chapter 3 that if a wave of depolarization is oriented at right angles to any lead axis, a biphasic complex (RS or QR) is recorded in that lead. Reasoning in a reverse manner, if you find a biphasic complex in any of the extremity leads, the mean QRS axis must be directed at 90° to that lead. Now look at Figure 5-3 again. Do you see any biphasic QRS complexes? Obviously, lead I is biphasic and shows an RS pattern. Therefore, the mean electrical axis must be directed at right angles to lead I. Because lead I on the hexaxial lead scale is at 0°, the mean electrical axis must be at right angles to 0° or at either –90° or +90°. If the axis were –90°, the depolarization forces would be oriented away from the positive pole of lead aVF and that lead would show a negative complex. In Figure 5-3, however, lead aVF shows a positive complex (tall R wave); therefore the axis must be +90°.
Figure 5-4 presents another example. By inspection the mean QRS axis is obviously horizontal, because leads I and aVL are positive and leads II, III, and aVF are predominantly negative. The precise electrical axis can be calculated by looking at lead II, which shows a biphasic RS complex. Therefore the axis must be at right angles to lead II. Because lead II is at +60° on the hexaxial scale (see Fig. 5-2), the axis must be either –30° or +150°. If it were +150°, leads II, III, and aVF would be positive. Clearly the axis is –30°.
Another example is given in Figure 5-5. The QRS complex is positive in leads II, III, and aVF. Therefore the axis is relatively vertical. Because the R waves are of equal magnitude in leads I and III, the mean QRS axis must be oriented between these two leads, or at +60°.
Alternatively, in Figure 5-5 the QRS axis can be calculated by looking at lead aVL, which shows a biphasic RS-type complex. The axis must be at right angles to lead aVL (–30°); that is, it must be oriented at either –120° or +60°. Obviously, the axis is at +60°, since the electrical axis must be oriented toward lead II, which shows a relatively tall R wave.
[/not-level-membership-for-cardiovascular-category]
